Embed Size (px)
Citation preview

MMaassssaacchhuusseettttss EEssttuuaarriieess PPrroojjeecctt
QAPP Revisions Round 3 Embayment Prioritization
June 2004
Massachusetts Department of Environmental Protection

2
QAPP Revisions Round 3 Embayment Prioritization
The DEP/SMAST Massachusetts Estuaries Project
Year Two Final
June 15, 2004
Dr. Brian Howes Roland Samimy
School of Marine Science & Technology, UMass Dartmouth
Project Officer: _______________________________________________________________
Brian Dudley, Mass DEP 20 Riverside Drive, Lakeville, MA 02347: Tel: 508-946-2753
Project Quality Assurance Officer:
__________________________________________________________ Dr. Brian Howes, SMAST-UMassD 706 Rodney French Blvd, New Bedford MA 02744; Tel: 508-910-6352 Project Coordinator:
_______________________________________________________________ Roland Samimy, SMAST-UMassD
706 Rodney French Blvd, New Bedford MA 02744; Tel: 508-910-6352 EPA Project Officer:
__________________________________________________________ MaryJo Feuerbach, EPA Region I One Congress Street, Boston, MA 02203; Tel: 617-918-1578 EPA Quality Assurance Officer:
__________________________________________________________ Arthur E. Clark, U.S. EPA
11 Technology Drive, N. Chelmsford, MA 01863; Tel: 617-918-8374 MA DEP Quality Assurance Officer:
__________________________________________________________ Art Screpetis, MA DEP / DWM 627 Main Street, 2nd Floor, Worcester, MA 01608; Tel: 508-767-2875
3
QAPP Revisions
Round 3 Embayment Prioritization Overview: The Massachusetts Estuaries Project is tasked with updating its QAPP to include the additional embayments selected in the annual prioritization process. The following update of the Final Massachusetts Estuaries Project Quality Assurance Project Plan (QAPP) dated June 13, 2003 and approved in July of 2003 focuses on the integration of a third round of embayment prioritization (embayments 35 – 49). The round three embayment prioritization builds on the QAPP for embayments 1 – 20, summer 2002 field season, and the round two prioritization embayments 21 – 34, summer 2003 field season. The Massachusetts Estuaries Project (MEP) Final QAPP has not undergone any revisions relative to the methodology employed to conduct the nutrient analyses in each embayment system, nor has it changed relative to the process utilized for conducting the hydrodynamic and water quality modeling. As such, details regarding:
• A Project Management • B.1 Review of Nitrogen Related Water Quality Monitoring Data • B.2 Hydrodynamic Modeling • B.3 Watershed Nitrogen Loading • B.4 Nitrogen Regeneration Within Embayments • B.5 Linked Watershed-Embayment Nitrogen Model • B.6 Habitat Assessment • B.7 Synthesis of Modeling and Habitat Assessments • C Assessment and Oversight • D Data Validation and Usability
remain unchanged relative to what was previously submitted in the Final QAPP dated June 13, 2003, except for two changes in Project Management and one change in Section B.6 relative to dissolved oxygen (D.O) mooring deployments. The specific changes are as follows: (1) Section A (Project Management) Bruce Rosinoff, presented in the Year One Final QAPP as EPA Project Officer responsible for aspects of policy and coordination related to the Project has been replaced by MaryJo Feuerbach, Bruce Rosinoff’s replacement at US EPA Region 1. Therefore, the distribution list presented on page 5 of the Final QAPP is hereby amended to read:

4
Name (#copies) Address Coastal Systems Program (6 Copies)
School of Marine Science & Technology University of Massachusetts-Dartmouth 706 Rodney French Blvd. New Bedford, MA 02744 508-910-6316
Department of Environmental Protection (1 Copy)
Brian Dudley DEP-SERO 20 Riverside Drive Lakeville, MA 02347 508-946-2753
Department of Environmental Protection (1 Copy)
Art Screpetis, MA DEP / DWM 627 Main Street, 2nd Floor Worcester, MA 01608 508-767-2875
Environmental Protection Agency (1 Copy)
MaryJo Feuerbach USEPA Region 1 One Congress Street Boston, MA 02203 617-918-1578
Environmental Protection Agency (1 Copy)
Arthur E. Clark, U.S. EPA 11 Technology Drive N. Chelmsford, MA 01863 617-918-8374
Cape Cod Commission (1 Copy)
Ed Eichner Cape Cod Commission Rt. 6A Barnstable, MA 508-328-3828
Additionally, the table that summarizes the roles and responsibilities of both the Technical Team and DEP / EPA Personnel (as presented on page 8 of the Final QAPP) is hereby changed to reflect both the replacement of Bruce Rosinoff with MaryJo Feuerbach as well as the departure of Mike Rapacz (previously serving as Science / Policy Laison for SMAST). The position that was previously filled by Mr. Rapacz has in part been filed by Bruce Rosinoff who is currently under contract to the MEP on a part time basis. An additional hire is currently underway to assume some of the project responsibilities previously held by Mr. Rapacz. Therefore, the summary table of roles and responsibilities presented on page 8 of the Final QAPP is hereby amended to read:

5
Name Roles Responsibilities Affiliation Technical Team Personnel:
Dr. Brian Howes Technical Manager Technical Team, Chair
Science Oversight Synthesis/Thresholds
SMAST-UMassD
Roland Samimy Technical Coordinator Technical Team
Science/DEP Coordination Surface Water Hydrology
SMAST-UMassD
Dr. Dave Schlezinger Technical Team N regeneration, D.O. Instrumentation
SMAST-UMassD
John Ramsey, P.E. Technical Team Modeling ACRE Dr. David White Technical Team Laboratory Analytical SMAST-UMassD Dr. Robert Hamersley Technical Team N attenuation in lakes SMAST-UMassD Paul Henderson Technical Team / Lab
Manager General Field Program SMAST-UMassD
Charlie Costello Technical Team Macrophyte Mapping DEP Ed Eichner Technical Team Land-use Analysis Cape Cod Comm. Tom Cambereri Technical Team Land-use Analysis Cape Cod Comm. Dale Goehringer Lab Coordinator Water Quality Monitoring SMAST-UMassD Bruce Rosinoff Science/Policy Liaison SMAST-DEP Coordinator SMAST-UMassD DEP / EPA Personnel:
Brian Dudley DEP–Project Manager Technical Team
DEP Oversight & input to Planning/Steering Comm.
DEP-SERO
Arthur Screpetis MA DEP Quality Assurance Officer
Guidance to DEP needs for TMDL Program
DEP/DWM
MaryJo Feuerbach EPA Project Officer Policy & Coordination USEPA, Region I Arthur Clarke EPA Quality Assurance
Officer QA/QC Guidance USEPA, Region I
Affiliated Personnel: John Masterson Don Walter Kathy Hess
Technical Team (as needed)
Watershed Delineation & Aquifer Modeling
USGS
Gong Min Lei Lab Director (sub- contractor)
Bacteria assays Barnstable County Laboratory
(2) Within Section B (sub-section B.6.1, Data Quality Objectives for Measurement Data and B.6.3, Sampling Process Design), a modification has been made to the length of the period during which summer D.O. mooring deployments can be conducted. As previously stated in the Final QAPP, dissolved oxygen mooring deployments are to be conducted during the months of July and August and moorings would typically remain on station for 30 to 60 days. Based on data collected to date, the MEP Technical Team, in consultation with the Massachusetts Department of Environmental Protection (DEP) Technical Specialists, determined that the DO mooring program would be

6
improved by extending the instrument deployment window. During the ~100 mooring placements to date, it is clear that the period of low dissolved oxygen extends beyond the first 2 weeks of September. Therefore the window for acceptable D.O. mooring data will be amended to be from July 1 to September 15. By extending the deployment window for DO instrumentation, it will be possible to capture low DO events occurring in the early weeks of September. This extension of the deployment window will be effective for the summer 2004 field data collection season and does not invalidate or change the accuracy and precision of previous dissolved oxygen data collected for the MEP. Therefore, Table B.6-1 (Habitat Assessment Program, field parameters measured and data objectives) presented on page 79 of the Final QAPP is hereby amended to read:
Parameter Method Detection Limits
Frequency QC Samples Acceptable %Recovery
Macrophytes Video Survey Individual shoots
1 survey May-Oct.
Spot checks by diver 95%
Benthic Animals
Van Veen Grab or Coring as
appropriate Microscope sorting
1 animal 1 survey Aug-Oct
Spot checks by different specialist
95%
Dissolved Oxygen
Rapid Pulse Clark Electrode
0.2 mg/L 15 min. for 1-2 months, July-Sept.
Winkler Titration of water from sensor
depth(start,mid,end of mooring deployment)
75 %
Temperature Bead Thermistor (sensitivity of
0.1oC)
NA 15 min. for 1-2 months, July-Sept.
Calibrated to certified thermometer prior to
deployment
75 %
Conductivity/ Salinity
2-electrode platinum
conductivity cell 1 cm. Path length
0.1 mS/cm
15 min. for 1-2 months, July-Sept.
Whole water collected at sensor depth
(start,mid,end of mooring deployment)
75 %
Depth Differential Strain gauge transducer
0.02 m 15 min. for 1-2 months, July-Sept.
Calibrated to measured tape level at beginning and end of
deployment
75 %
Chlorophyll a Fixed wavelength fluorometer, 470
nm
0.1 ug/L 15 min. for 1-2 months, July-Sept.
Chlorophyll extraction
(start,mid,end of mooring deployment)
75 %
Additionally, the second complete paragraph on page 81 has been revised to reflect the mutually agreed upon extension of the deployment period and hereby reads as follows:
Dissolved oxygen is a critical indicator of nutrient over-enrichment and eutrophication. The problem with quantifying dissolved oxygen conditions stems from the high temporal variability of this parameter. However, determining the level of oxygen depletion

7
and the duration of low oxygen conditions is a key indicator and one with regulatory implications. Therefore, the Estuary Project will deploy ENDECO/YSI 6600 sensor systems in the target embayments throughout July and September of the field data collection year or possibly in a following second year if necessary. We have extensive experience with using these instruments and they are a routine part of SMAST field Programs. The sensors will also measure temperature, salinity and chlorophyll a. They will be placed within “areas of concern” and other areas throughout each system, as indicated from the long-term monitoring baseline. The sensors will be deployed on fixed moorings generally within the upper reaches of embayments or where baseline water quality monitoring suggests that D.O. depletion may be occurring. The sites will be selected based upon (1) measured dissolved oxygen levels of <4mg/L by water quality monitoring programs or (2) indications based upon algal blooms and circulation that a low dissolved oxygen environment may exist. Sensors will be placed 0.3 m above the sediment surface and will sample at 10-15 minute intervals. Membrane fouling and sensor maintenance will follow manufacturer specifications, but membranes and batteries will be replaced every 30 days.
In addition to the above mentioned specific revisions, the Final MEP QAPP has been updated to reflect the third round of prioritization of embayments intended to undergo high end MEP field data collection in summer 2004. A sampling and analysis plan has been developed for each of the embayments listed in the round three prioritization per the agreed upon format developed for embayments in rounds one and two. The embayment specific SAPs (referred to as the Appendix QAPPs) are provided in this document under separate cover to serve as an addendum to the Final QAPP (June 13, 2003). As was previously agreed over the year and a half long development period for the final approved MEP QAPP, the Final QAPP would not be reproduced unless there was a significant change that needed to be made to the final approved MEP QAPP. The above changes are presented as an addendum to the Final QAPP and are not deemed of sufficient magnitude to trigger a full QAPP revision.

8
MASSACHUSETTS ESTUARIES PROJECT
LISTING OF APPENDIX QAPPs A.XXXV - XLIX
Appendix A-XXXV BB/Dartmouth: Slocums River Appendix A-XXXVI BB/Dartmouth: Little River Appendix A-XXXVII BB/Dartmouth: Apponagansett Bay Appendix A-XXXVIII CC/Barnstable: Centerville Harbor Appendix A-XXXIX CC/Barnstable: Rushy Marsh Appendix A-XL CC/Barnstable/Yarmouth: Lewis Bay Appendix A-XLI CC/Yarmouth: Parkers River Appendix A-XLII MV/Martha’s Vineyard: Sengekontacket/Trapps Appendix A-XLIII BB/Mattapoisett: Mattapoisett Harbor Appendix A-XLIV BB/Marion: Sippican Harbor Appendix A-XLV CC/Wellfleet: Wellfleet Harbor Appendix A-XLVI CC/Harwich: Saquatucket Harbor Appendix A-XLVII CC/Harwich: Allens Harbor Appendix A-XLVIII CC/Harwich: Wychmere Harbor Appendix A-XLIX CC/Harwich: Herring River
9
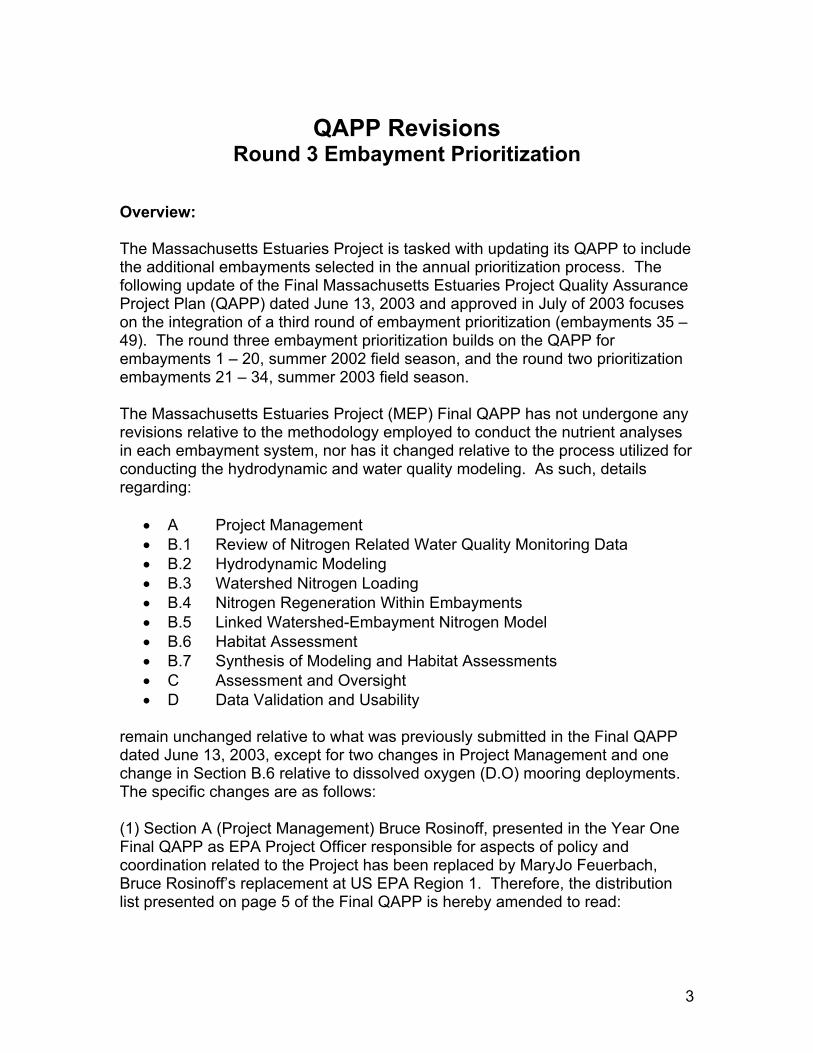
MA Estuaries Project QAPP Appendix A-XXXV Slocums River
Town of Dartmouth Prioritization Rank: Round 3 - #35
Figure 1. Location Map Figure 2. Nutrient Sampling Locations Figure 3. Benthic Regeneration and Stream Discharge Sampling Locations Figure 4. Hydrodynamic Data Collection Sites: Tide Gauges and ADCP
transects Embayment Specific Plan: Data Collection consists of Hydrodynamic Data (field data and model), Stream gauging and nitrogen sampling, GIS based Land-use analysis, Nitrogen recycling via Benthic Regeneration, Habitat Assessment (Eelgrass, macroalgae, benthic animals, DO records). Synthesis is primarily covered in the Water Quality Modeling and Reporting components. The efforts of the Estuary Project will be to fill in data gaps to allow parameterization and full modeling and synthesis following the Linked Management Approach. Many of the embayments currently have existing data that can be incorporated into the Linked Approach. A detailed description of previous data, its quality and how it was collected will be part of the Report. However, it is useful to indicate the existing data and our initial assessment of its quality and to present the additional field and modeling work required to fully implement the Estuaries Project Management Approach. Slocums River, Dartmouth Description of System: The Slocums River System is found within the Town of Dartmouth, with portions of the upper watershed in the City of New Bedford. The system is a drowned river valley estuary with a significant river inflow to its headwaters and numerous tributary freshwater inflows. The upper portion of the estuary is shallow with extensive salt marsh, but the lower region is dominated by open water. The tidal inlet is not “fixed” by jetties and is potentially occluded. The Slocums River System appears to be currently nitrogen enriched based upon nutrient related water quality measures and observations of macroalgae. Previous Relevant Data: There is some high quality Estuaries Project required data available for the Slocum River System. This primarily relates to a

10
Massachusetts Watershed Initiative project to conduct a hydrodynamic analysis of the system. This effort was conducted by MEP Technical Staff and includes tidal data, bathymetric survey, ADCP velocity measurements. Figure 4 shows the location of the ADCP surveys and tide gaging as previously conducted. Should the ADCP survey or tide gage deployment need to be conducted a second time, the surveys and tide gaging will be conducted at the same locations. The report has been accepted by DEP and the data are fully able to be integrated into the MEP. In addition, the USGS maintains a river gauge on the major freshwater inflow, the Paskamanset River. This gauge site will be used for nitrogen sampling to determine the nitrogen load from this pathway. There are also benthic infauna community data from a MET funded project to the Turn the Tide program, projected for completion 2004. These data are fully compliant with MEP procedures, except for the surface area of the grab sample (1/2 the MEP size). When the report is available, determination of the data usage (comparative or primary) will be made by the MEP Technical Team. High quality water quality monitoring data exists which was collected and analyzed following the Coalition for Buzzards Bay Monitoring QAPP. All technical design details and analytical aspects of the monitoring program were conducted by the Coastal Systems Program at SMAST for the Town of Dartmouth Water Quality Monitoring Program. This program uses technical staff from the Lloyd Center for Environmental Studies to perform the sampling. MEP Analysis: The main Estuaries Project efforts will be to (1) perform land-use and watershed nitrogen load modeling based upon the new USGS watershed delineation; (2) collect stream flow/nitrogen load data to complete the requisite 14 months (building on the existing dataset); (3) collect benthic cores and determine summer nitrogen regeneration rates as well as macroalgal presence at the benthic coring location; (4) collect a dissolved oxygen record to support the habitat assessment; (5) map eelgrass distribution and create historic record; (6) collect benthic infaunal distribution and indicator data; and (7) conduct the water quality modeling, thresholds analysis and synthesis. It should be noted that the selection of sites for collection of the benthic infaunal grab samples is not conducted a priori and are therefore not depicted in Figure 3. Observations made by divers collecting benthic nutrient regeneration cores guides the selection of which benthic locations will also be used for infaunal grab samples. A sub-set of the nutrient regeneration core locations depicted in Figure 3 will be used to conduct the benthic infaunal grab sampling.

11
Massachusetts Department of Environmental Protection
Massachusetts Estuaries Project Round 3 Prioritization Massachusetts Estuaries Project Round 3 Prioritization Town of Dartmouth: Slocums River
Slocums River
Figure 1
LegendLegend
Red = Embayments Modeled 2005
Green = Embayments Modeled 2006
Massachusetts Department of Environmental Protection
Massachusetts Estuaries Project Round 3 Prioritization Massachusetts Estuaries Project Round 3 Prioritization Town of Dartmouth: Slocums River
Slocums River
Figure 1
LegendLegend
Red = Embayments Modeled 2005
Green = Embayments Modeled 2006

12Figure 2
Town of Dartmouth - Slocums River (Rank 35) Nutrient Sampling Stations
Nutrient D.O. Mooring

13
Figure 3
Town of Dartmouth - Slocums River (Rank 35) Benthic/Stream Locations
Destruction Brook
Barneys Joy
Giles Creek
Stream Gaging Location Benthic Nutrient Flux Coring *
USGS Paskamanset
Dup
* A sub-set of the nutrient flux coring locations will be used for conducting benthic infuanal grabs

14Figure 4
Town of Dartmouth - Slocums River (Rank 35) Tide Gage Locations
Tide Gage ADCP

15

16
MA Estuaries Project QAPP Appendix A-XXXVI Little River
Town of Dartmouth Prioritization Rank: Round 3 - #36
Figure 1. Location Map Figure 2. Nutrient Sampling Locations Figure 3. Benthic Regeneration and Stream Discharge Sampling Locations Figure 4. Hydrodynamic Data Collection Sites: Tide Gauges and ADCP
transects Embayment Specific Plan: Data Collection consists of Hydrodynamic Data (field data and model), Stream gauging and nitrogen sampling, GIS based Land-use analysis, Nitrogen recycling via Benthic Regeneration, Habitat Assessment (Eelgrass, macroalgae, benthic animals, DO records). Synthesis is primarily covered in the Water Quality Modeling and Reporting components. The efforts of the Estuary Project will be to fill in data gaps to allow parameterization and full modeling and synthesis following the Linked Management Approach. Many of the embayments currently have existing data that can be incorporated into the Linked Approach. A detailed description of previous data, its quality and how it was collected will be part of the Report. However, it is useful to indicate the existing data and our initial assessment of its quality and to present the additional field and modeling work required to fully implement the Estuaries Project Management Approach. Little River, Dartmouth Description of System: The Little River System is found within the Town of Dartmouth and both its open waters and watershed are contained within the town boundary. The system is a drowned basin, without significant surface freshwater inflows. Bordering the open water basin is salt marsh, with a large marsh in the northeast region. The tidal inlet is not “fixed” by jetties, but is structured by a bridge under which all tidal flows to the estuary pass. The Little River System appears to be currently nitrogen enriched based upon nutrient related water quality measures, although the significance to habitat quality is currently unknown due to the interplay with the salt marsh regions.

17
Previous Relevant Data: There is some high quality Estuaries Project required data available for the Little River System. This primarily relates to a Massachusetts Watershed Initiative project to conduct a hydrodynamic analysis of the system. This effort was conducted by MEP Technical Staff and includes tidal data, bathymetric survey, ADCP velocity measurements. The report has been accepted by DEP and the data are fully able to be integrated into the MEP. There are also limited benthic infauna community data from a MET funded project to the Turn the Tide program, projected for completion 2004. These data are fully compliant with MEP procedures, except for the surface area of the grab sample (1/2 the MEP size). When the report is available, determination of the data usage (comparative or primary) will be made by the MEP Technical Team. High quality water quality monitoring data exists which was collected and analyzed following the Coalition for Buzzards Bay Monitoring QAPP. All technical design details and analytical aspects of the monitoring program were conducted by the Coastal Systems Program at SMAST for the Town of Dartmouth Water Quality Monitoring Program. This program uses technical staff from the Lloyd Center for Environmental Studies to perform the sampling. MEP Analysis: The main Estuaries Project efforts will be to (1) perform land-use and watershed nitrogen load modeling based upon the new USGS watershed delineation; (2) collect stream flow/nitrogen load data to complete the requisite 14 months (building on the existing dataset); (3) collect benthic cores and determine summer nitrogen regeneration rates as well as macroalgal presence at the benthic coring location; (4) collect a dissolved oxygen record to support the habitat assessment; (5) map eelgrass distribution and create historic record; (6) collect benthic infaunal distribution and indicator data; and (7) conduct the water quality modeling, thresholds analysis and synthesis. It should be noted that the selection of sites for collection of the benthic infaunal grab samples is not conducted a priori and are therefore not depicted in Figure 3. Observations made by divers collecting benthic nutrient regeneration cores guides the selection of which benthic locations will also be used for infaunal grab samples. A sub-set of the nutrient regeneration core locations depicted in Figure 3 will be used to conduct the benthic infaunal grab sampling. Note: Inlet flows will follow stream flow method, but will be conducted in time-series over a tidal cycle at each inlet. The Acoustic Doppler Current Profiler (ADCP) will not be used.

18
Massachusetts Department of Environmental Protection
Massachusetts Estuaries Project Round 3 Prioritization Massachusetts Estuaries Project Round 3 Prioritization Town of Dartmouth: Little River
Little River
Figure 1
LegendLegend
Red = Embayments Modeled 2005
Green = Embayments Modeled 2006
Massachusetts Department of Environmental Protection
Massachusetts Estuaries Project Round 3 Prioritization Massachusetts Estuaries Project Round 3 Prioritization Town of Dartmouth: Little River
Little River
Figure 1
LegendLegend
Red = Embayments Modeled 2005
Green = Embayments Modeled 2006

19Figure 2
Town of Dartmouth - Little River (Rank 36) Nutrient Sampling Stations
Nutrient Station (offshore station with Slocums River D.O. Mooring

20Figure 3
Town of Dartmouth - Little River (Rank 36) Benthic/Stream Locations
Stream Gaging Location Benthic Nutrient Flux Coring * * A sub-set of the nutrient flux coring locations will be used for conducting benthic infuanal grabs

21Figure 4
Town of Dartmouth - Little River (Rank 36) Tide Gage Locations
Tide Gage ADCP Single Point Current

22

23
MA Estuaries Project QAPP Appendix A-XXXVII Apponagansett Bay
Town of Dartmouth Prioritization Rank: Round 3 - #37
Figure 1. Location Map Figure 2. Nutrient Sampling Locations Figure 3. Benthic Regeneration and Stream Discharge Sampling Locations Figure 4. Hydrodynamic Data Collection Sites: Tide Gauges and ADCP
transects Embayment Specific Plan: Data Collection consists of Hydrodynamic Data (field data and model), Stream gauging and nitrogen sampling, GIS based Land-use analysis, Nitrogen recycling via Benthic Regeneration, Habitat Assessment (Eelgrass, macroalgae, benthic animals, DO records). Synthesis is primarily covered in the Water Quality Modeling and Reporting components. The efforts of the Estuary Project will be to fill in data gaps to allow parameterization and full modeling and synthesis following the Linked Management Approach. Many of the embayments currently have existing data that can be incorporated into the Linked Approach. A detailed description of previous data, its quality and how it was collected will be part of the Report. However, it is useful to indicate the existing data and our initial assessment of its quality and to present the additional field and modeling work required to fully implement the Estuaries Project Management Approach. Apponagansett Bay, Dartmouth Description of System: The Apponagansett Bay System is found within the Town of Dartmouth, with portions of the upper watershed in the City of New Bedford. The system is a drowned river valley estuary with moderate river inflows to its headwaters, Buttonwood Brook. The upper portion of the estuary is shallow near the Buttonwood Brook discharge. There is an extensive salt marsh separated by a bridge and entering the upper basin to the southeast. The system is dominated by open water processes. The tidal inlet is “fixed” by jetties. The Apponagansett Bay System appears to be currently nitrogen enriched based upon nutrient related water quality measures and observations of macroalgae in the upper basin.

24
Previous Relevant Data: Only limited Estuaries Project data exist for this estuary. However, there are 2 relevant studies. There are limited benthic infauna community data from a MET funded project to the Turn the Tide program, projected for completion 2004. These data are fully compliant with MEP procedures, except for the surface area of the grab sample (1/2 the MEP size). When the report is available, determination of the data usage (comparative or primary) will be made by the MEP Technical Team. Second, a stormwater study has been completed for Buttonwood Brook that measured both pathogenic indicators and nitrogen in 3 dry and 3 wet weather events. This data was collected under a DEP approved QAPP and will be useful when coupled with the MEP stream gauging effort in determining total nitrogen loads to the Bay. High quality water quality monitoring data exists which was collected and analyzed following the Coalition for Buzzards Bay Monitoring QAPP. All technical design details and analytical aspects of the monitoring program were conducted by the Coastal Systems Program at SMAST for the Town of Dartmouth Water Quality Monitoring Program. This program uses both technical staff and volunteers to perform the sampling. MEP Analysis: The main Estuaries Project efforts will be to (1) establish a hydrodynamic model based upon placement of tide gauges, bathymetric survey, (2) perform land-use and watershed nitrogen load modeling based upon the new USGS watershed delineation; (3) collect stream flow/nitrogen load data to complete the requisite 14 months (building on the existing dataset); (4) collect benthic cores and determine summer nitrogen regeneration rates as well as macroalgal presence at the benthic coring location; (5) collect a dissolved oxygen record to support the habitat assessment; (6) map eelgrass distribution and create historic record; (7) collect benthic infaunal distribution and indicator data; and (8) conduct the water quality modeling, thresholds analysis and synthesis. It should be noted that the selection of sites for collection of the benthic infaunal grab samples is not conducted a priori and are therefore not depicted in Figure 3. Observations made by divers collecting benthic nutrient regeneration cores guides the selection of which benthic locations will also be used for infaunal grab samples. A sub-set of the nutrient regeneration core locations depicted in Figure 3 will be used to conduct the benthic infaunal grab sampling. Note: The Acoustic Doppler Current Profiler (ADCP) will not be used. The ADCP does not yield accurate results in the low flows anticipated for this system.

25
Massachusetts Department of Environmental Protection
Massachusetts Estuaries Project Round 3 Prioritization Massachusetts Estuaries Project Round 3 Prioritization Town of Dartmouth: Apponagansett Bay
Apponagansett Bay
Figure 1
LegendLegend
Red = Embayments Modeled 2005
Green = Embayments Modeled 2006

26Figure 2
Town of Dartmouth - Apponagansett Bay (Rank 37) Nutrient Sampling Stations
Nutrient

27
Figure 3
Town of Dartmouth - Apponagansett Bay (Rank 37) Benthic/Stream Locations
Buttonwood Brook
Apponagansett Bay
Dup
Stream Gaging Location Benthic Nutrient Flux Coring * * A sub-set of the nutrient flux coring locations will be used for conducting benthic infuanal grabs

28Figure 4
Town of Dartmouth - Apponagansett Bay (Rank 37) Tide Gage Locations
Tide Gage ADCP D.O. Mooring

29

30
MA Estuaries Project QAPP Appendix A-XXXVIII Centerville Harbor
Town of Barnstable Prioritization Rank: Round 3 - #38
Figure 1. Location Map Figure 2. Nutrient Sampling Locations Figure 3. Benthic Regeneration and Stream Discharge Sampling Locations Figure 4. Hydrodynamic Data Collection Sites: Tide Gauges and ADCP
transects Embayment Specific Plan: Data Collection consists of Hydrodynamic Data (field data and model), Stream gauging and nitrogen sampling, GIS based Land-use analysis, Nitrogen recycling via Benthic Regeneration, Habitat Assessment (Eelgrass, macroalgae, benthic animals, DO records). Synthesis is primarily covered in the Water Quality Modeling and Reporting components. The efforts of the Estuary Project will be to fill in data gaps to allow parameterization and full modeling and synthesis following the Linked Management Approach. Many of the embayments currently have existing data that can be incorporated into the Linked Approach. A detailed description of previous data, its quality and how it was collected will be part of the Report. However, it is useful to indicate the existing data and our initial assessment of its quality and to present the additional field and modeling work required to fully implement the Estuaries Project Management Approach. Centerville Harbor, Barnstable Description of System: The Centerville Harbor System is a complex estuary comprised of a drowned river valley estuary discharging into a lagoon system formed behind an extensive barrier beach. While much of the estuary consists of narrow tidal channels, there are 2 major basins, East Bay and Scudder Bay. There are extensive tidal marsh regions in the upper estuary associated with the Bumps River/Scudder Bay and Centerville River eastern portion. The Centerville River appears to be presently nitrogen enriched particularly in the Bumps River/Scudder Bay region and in the inland regions of the River. Also, within the Centerville Harbor System is the tributary system of Halls Creek. Halls Creek is a tidal salt marsh system, which exchanges with the outer basin of Centerville

31
Harbor. While there are local concerns over nitrogen enrichment of this system, there is no evidence at present to support this contention, particularly given its salt marsh status and the high quality of inflowing tidal waters from Centerville Harbor. Previous Relevant Data: Only limited Estuaries Project data exist for this estuary. However, there are some existing data suitable for parameterizing the Linked Watershed-Embayment Modeling Approach that are fully compliant with the Estuaries Project QAPP. These data were collected and analyzed by present Estuaries Project Technical Team members. These data sets include: bathymetric and tidal data and an ADCP data set collected prior to the dredging of the tidal inlet. These data were collected to allow comparison with MEP data to allow for the determination of changes in tidal flushing since 2003. It should be noted that the inlet was dredged for navigation and there is little expectation of a shift in tidal volume. However, these data will allow quantitative determination on pre- and post- dredging changes in hydrodynamics. High quality water quality monitoring data exists which was collected by a Town of Barnstable water quality monitoring program under the guidance of the Coastal Systems Program at SMAST. The sampling program is consistent with the MEP QAPP water quality requirements. This program uses both technical staff and volunteers to perform the sampling. MEP Analysis: The main Estuaries Project efforts will be to (1) establish a hydrodynamic model based upon placement of tide gauges, bathymetric survey, and conducting ADCP survey, (2) perform land-use and watershed nitrogen load modeling based upon the new USGS watershed delineation; (3) collect stream flow/nitrogen load data to complete the requisite 14 months (building on the existing dataset); (4) collect benthic cores and determine summer nitrogen regeneration rates as well as macroalgal presence at the benthic coring location; (5) collect a dissolved oxygen record to support the habitat assessment; (6) map eelgrass distribution and create historic record; (7) collect benthic infaunal distribution and indicator data; and (8) conduct the water quality modeling, thresholds analysis and synthesis. It should be noted that the selection of sites for collection of the benthic infaunal grab samples is not conducted a priori and are therefore not depicted in Figure 3. Observations made by divers collecting benthic nutrient regeneration cores guides the selection of which benthic locations will also be used for infaunal grab samples. A sub-set of the nutrient regeneration core locations depicted in Figure 3 will be used to conduct the benthic infaunal grab sampling.

32
Massachusetts Department of Environmental Protection
Massachusetts Estuaries Project Round 3 Prioritization Massachusetts Estuaries Project Round 3 Prioritization Town of Barnstable: Centerville Harbor
Centerville Harbor
Figure 1
LegendLegend
Red = Embayments Modeled 2005
Green = Embayments Modeled 2006

33
Figure 2
Town of Barnstable - Centerville Harbor (Rank 38) Nutrient Sampling Stations
Nutrient
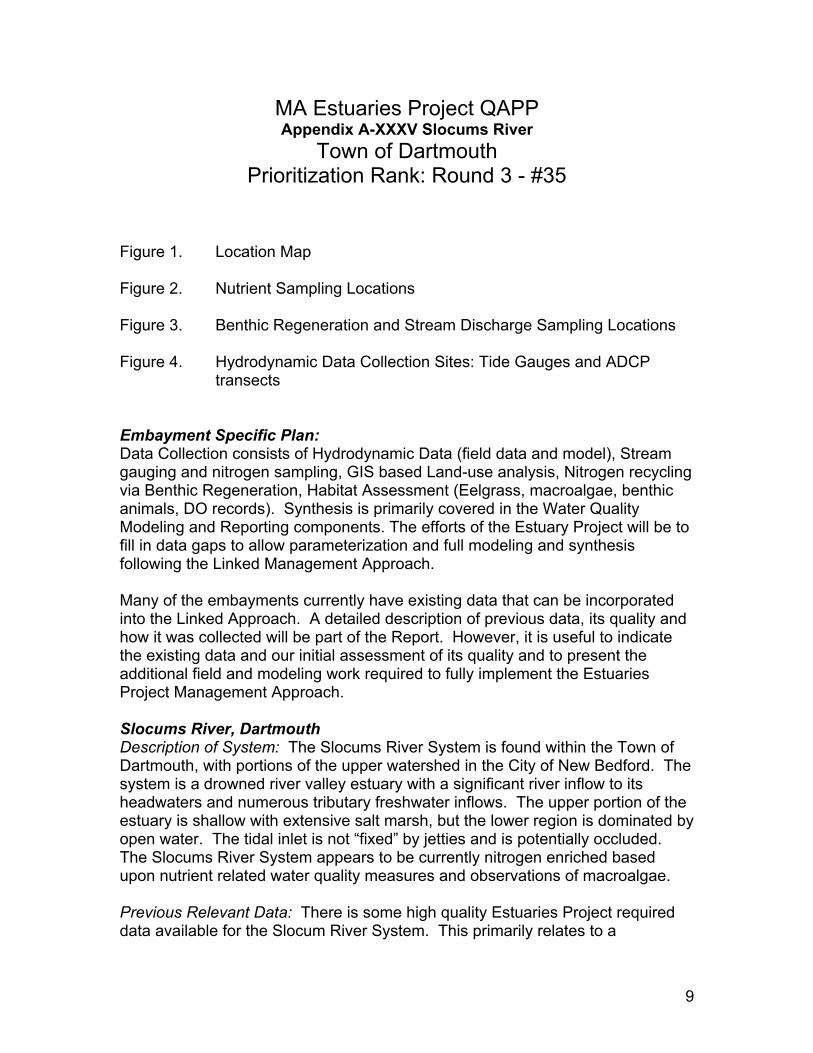
34Figure 3
Town of Barnstable - Centerville Harbor (Rank 38) Benthic/Stream Locations
Creek From Lake Elizabeth
Bumps River
Skunknet River
Dup
Stream Gaging Location Benthic Nutrient Flux Coring * * A sub-set of the nutrient flux coring locations will be used for conducting benthic infuanal grabs

35Figure 4
Town of Barnstable - Centerville Harbor (Rank 38) Tide Gage Locations
Tide Gage ADCP D.O. Mooring

36

37
MA Estuaries Project QAPP Appendix A-XXXIX Rushy Marsh
Town of Barnstable Prioritization Rank: Round 3 - #39
Figure 1. Location Map Figure 2. Nutrient Sampling Locations Figure 3. Benthic Regeneration and Stream Discharge Sampling Locations Figure 4. Hydrodynamic Data Collection Sites: Tide Gauges and ADCP
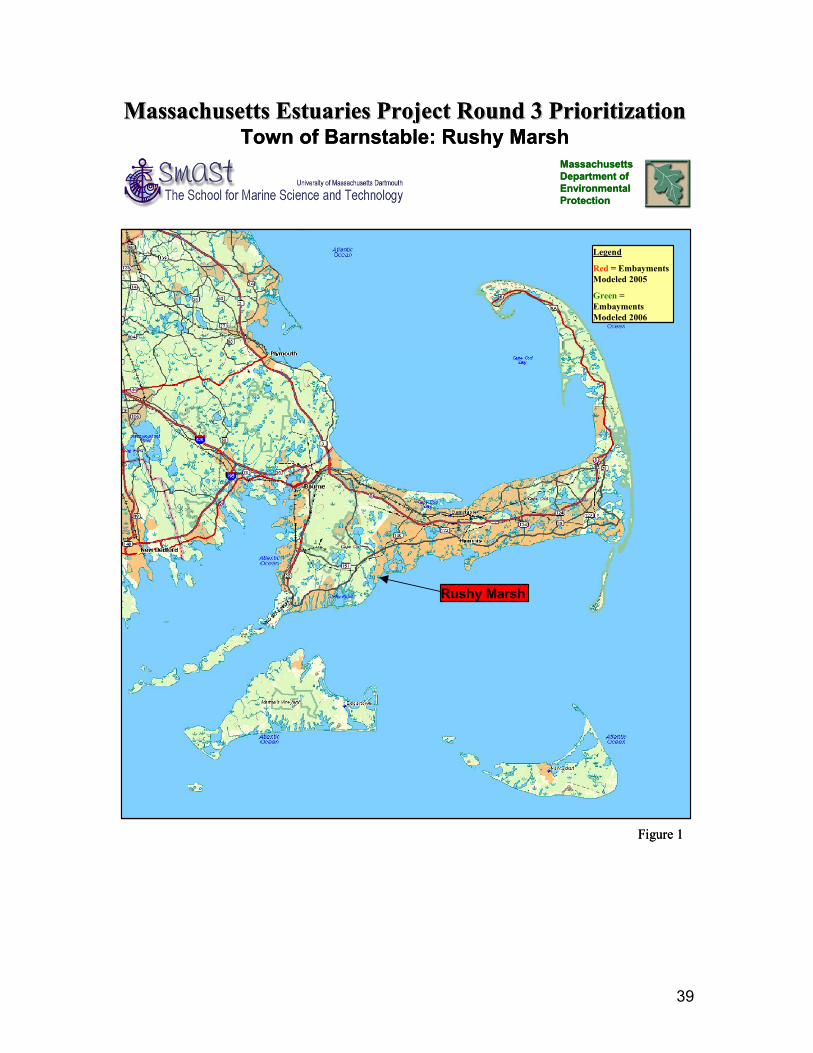
transects Embayment Specific Plan: Data Collection consists of Hydrodynamic Data (field data and model), Stream gauging and nitrogen sampling, GIS based Land-use analysis, Nitrogen recycling via Benthic Regeneration, Habitat Assessment (Eelgrass, macroalgae, benthic animals, DO records). Synthesis is primarily covered in the Water Quality Modeling and Reporting components. The efforts of the Estuary Project will be to fill in data gaps to allow parameterization and full modeling and synthesis following the Linked Management Approach. Many of the embayments currently have existing data that can be incorporated into the Linked Approach. A detailed description of previous data, its quality and how it was collected will be part of the Report. However, it is useful to indicate the existing data and our initial assessment of its quality and to present the additional field and modeling work required to fully implement the Estuaries Project Management Approach. Rushy Marsh, Barnstable: Description of System: Rushy Marsh is likely a coastal kettle pond which has been “captured” by rising sea level. The system is comprised of a central basin (>3 m) with fringing wetland. The wetland consists of salt marsh with bordering stands of Phragmites to landward. In the 1800’s, Rushy Marsh was fully open to Nantucket Sound. However, at the turn of the century the pond became closed due to coastal processes associated with Popponesset Spit and offshore Gull Island (now gone). For the past ~100 years the pond tidal exchange has been maintained with sluiceways and culverts. Recently, tidal exchange with Nantucket Sound has been enhanced by Town of Barnstable maintained culverts meant to prevent flooding during large rainfall periods and to stabilize the salinity

38
within the basin waters. At present there are 2 culverts operating and a management plan focusing on the hydrology of the system is presently being discussed. Previous Relevant Data: Only limited Estuaries Project data exist for this estuary. The Town of Barnstable Conservation Commission conducted a study on the geology of the basin in 2002 that included very limited D.O. sampling. Unfortunately, while there has been a recent study to assist hydrologic management of the system, only cursory field measurements were undertaken. Although a bathymetric map was produced as part of this effort, we must obtain the vertical datum and distribution of sounding to accept this data (we are still trying). High quality water quality monitoring data exists which was collected by a joint Three Bays Preservation (NGO) and Town of Barnstable water quality monitoring program under the guidance of the Coastal Systems Program at SMAST. The sampling program is consistent with the MEP QAPP water quality requirements. This program uses only technical staff to perform the sampling. MEP Analysis: The main Estuaries Project efforts will be to (1) establish a hydrodynamic model based upon placement of tide gauges, and bathymetric survey, (2) perform land-use and watershed nitrogen loading model based upon the new USGS watershed delineation; (3) collect stream flow/nitrogen load data to complete the requisite 14 months (building on the existing dataset); (4) collect benthic cores and determine summer nitrogen regeneration rates as well as macroalgal presence at the benthic coring location; (5) collect a dissolved oxygen record to support the habitat assessment; (6) map eelgrass distribution and create historic record; (7) collect benthic infaunal distribution and indicator data; and (8) conduct the water quality modeling, thresholds analysis and synthesis. It should be noted that the selection of sites for collection of the benthic infaunal grab samples is not conducted a priori and are therefore not depicted in Figure 3. Observations made by divers collecting benthic nutrient regeneration cores guides the selection of which benthic locations will also be used for infaunal grab samples. A sub-set of the nutrient regeneration core locations depicted in Figure 3 will be used to conduct the benthic infaunal grab sampling. Note: Inlet flows will follow stream flow method, but will be conducted in time-series over a tidal cycle at each inlet. The Acoustic Doppler Current Profiler (ADCP) will not be used. The ADCP does not yield accurate results at the water depths (0.4m) and channel dimensions associated with the Rushy Pond inlets. Also, the bathymetric survey will not be conducted if the previous bathymetric analysis can be supported by information on vertical datum and distribution of soundings. These data are required for consistency with the MEP QAPP and for running the MEP hydrodynamic analysis.
39
Massachusetts Department of Environmental Protection
Massachusetts Estuaries Project Round 3 Prioritization Massachusetts Estuaries Project Round 3 Prioritization Town of Barnstable: Rushy Marsh
Rushy Marsh
Figure 1
LegendLegend
Red = Embayments Modeled 2005
Green = Embayments Modeled 2006
Massachusetts Department of Environmental Protection
Massachusetts Estuaries Project Round 3 Prioritization Massachusetts Estuaries Project Round 3 Prioritization Town of Barnstable: Rushy Marsh
Rushy Marsh
Figure 1
LegendLegend
Red = Embayments Modeled 2005
Green = Embayments Modeled 2006

40
Figure 2
Town of Barnstable - Rushy Marsh (Rank 39) Nutrient Sampling Stations
Nutrient
41
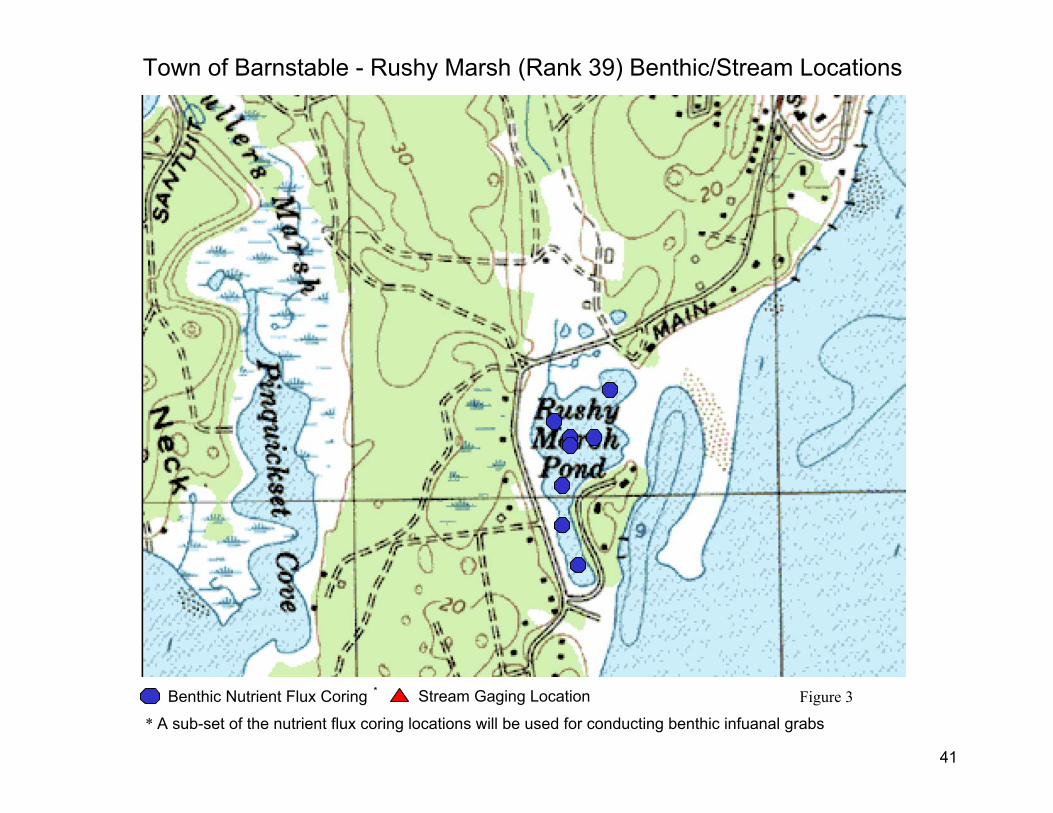
Figure 3
Town of Barnstable - Rushy Marsh (Rank 39) Benthic/Stream Locations
Stream Gaging Location Benthic Nutrient Flux Coring *
* A sub-set of the nutrient flux coring locations will be used for conducting benthic infuanal grabs

42
Figure 4
Town of Barnstable - Rushy Marsh (Rank 39) Tide Gage Locations
Tide Gage ADCP D.O. Mooring

43

44
MA Estuaries Project QAPP Appendix A-XL Lewis Bay
Towns of Barnstable / Yarmouth Prioritization Rank: Round 3 - #40
Figure 1. Location Map Figure 2. Nutrient Sampling Locations Figure 3. Benthic Regeneration and Stream Discharge Sampling Locations Figure 4. Hydrodynamic Data Collection Sites: Tide Gauges and ADCP
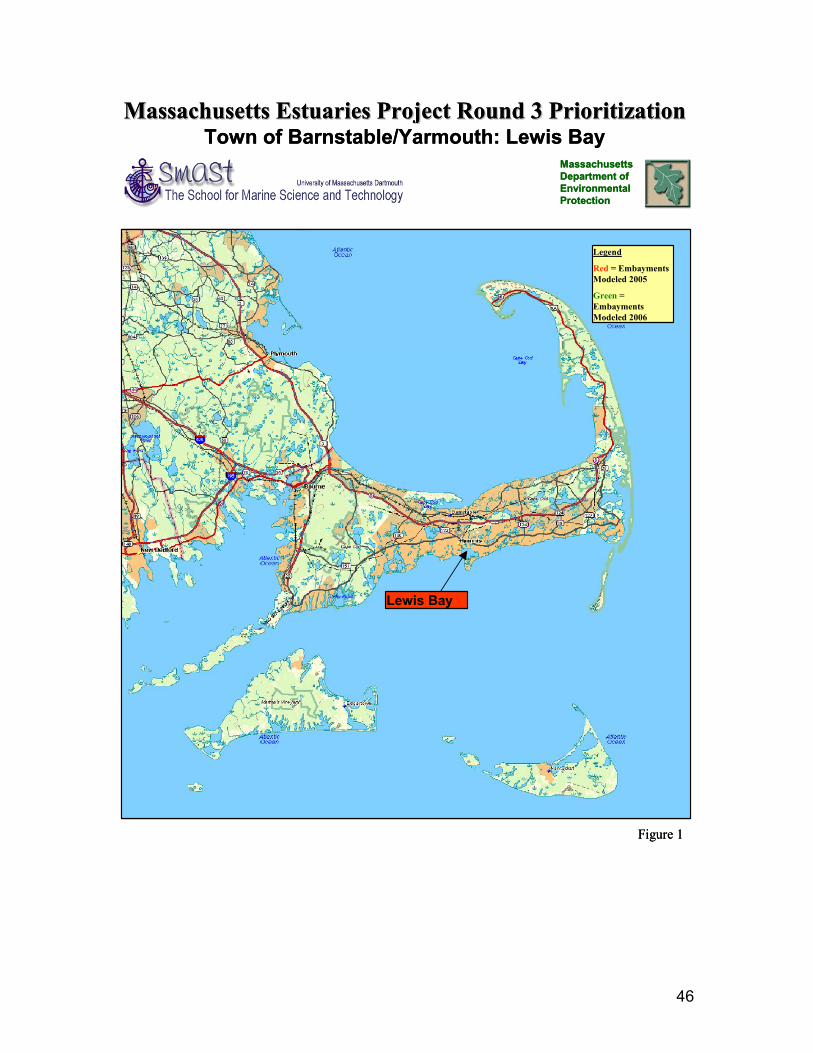
transects Embayment Specific Plan: Data Collection consists of Hydrodynamic Data (field data and model), Stream gauging and nitrogen sampling, GIS based Land-use analysis, Nitrogen recycling via Benthic Regeneration, Habitat Assessment (Eelgrass, macroalgae, benthic animals, DO records). Synthesis is primarily covered in the Water Quality Modeling and Reporting components. The efforts of the Estuary Project will be to fill in data gaps to allow parameterization and full modeling and synthesis following the Linked Management Approach. Many of the embayments currently have existing data that can be incorporated into the Linked Approach. A detailed description of previous data, its quality and how it was collected will be part of the Report. However, it is useful to indicate the existing data and our initial assessment of its quality and to present the additional field and modeling work required to fully implement the Estuaries Project Management Approach. Lewis Bay, Towns of Barnstable / Yarmouth Description of System: The Lewis Bay System is a complex estuary comprised of Mill Creek, a large tidal salt marsh system with surface water inflows, Hyannis Harbor, a highly altered lagoon serving as a working port and Lewis Bay, a large outer basin formed behind a large barrier spit. The barrier spit also contains 2 smaller tidal systems, Roberts Cove and Pine Island Creek. The Lewis Bay System is divided between the Towns of Barnstable and Yarmouth and the watershed contains the heavily developed regions of Hyannis, a significant proportion of which is currently on sewers. The tidal inlet to Lewis Bay is armored (to the west) with a large jetty and bulkhead on Dunbar Point. Across the channel is Smiths Point which is not armored, but which has multiple groins
45
for beach stabilization. At present there are indications that Hyannis Harbor and possibly Mill Creek in the upper regions of the Lewis Bay System are nitrogen enriched. Previous Relevant Data: Only limited Estuaries Project data exist for this estuary. However, there are some existing stage data for parameterizing the hydrodynamic model. These data were collected under a contract to Tetra Tech. The base files are not yet available and there is concern that the stage data was not collected relative to a vertical datum. High quality water quality monitoring data exists which was collected by a Town of Barnstable water quality monitoring program under the guidance of the Coastal Systems Program at SMAST. The sampling program is consistent with the MEP QAPP water quality requirements. This program uses both technical staff and volunteers to perform the sampling. MEP Analysis: The main Estuaries Project efforts will be to (1) establish a hydrodynamic model based upon placement of tide gauges, bathymetric survey, and conducting ADCP survey, (2) perform land-use and watershed nitrogen load modeling based upon the new USGS watershed delineation; (3) collect stream flow/nitrogen load data to complete the requisite 14 months (building on the existing dataset); (4) collect benthic cores and determine summer nitrogen regeneration rates as well as macroalgal presence at the benthic coring location; (5) collect a dissolved oxygen record to support the habitat assessment; (6) map eelgrass distribution and create historic record; (7) collect benthic infaunal distribution and indicator data; and (8) conduct the water quality modeling, thresholds analysis and synthesis. It should be noted that the selection of sites for collection of the benthic infaunal grab samples is not conducted a priori and are therefore not depicted in Figure 3. Observations made by divers collecting benthic nutrient regeneration cores guides the selection of which benthic locations will also be used for infaunal grab samples. A sub-set of the nutrient regeneration core locations depicted in Figure 3 will be used to conduct the benthic infaunal grab sampling.
46
Massachusetts Department of Environmental Protection
Massachusetts Estuaries Project Round 3 Prioritization Massachusetts Estuaries Project Round 3 Prioritization Town of Barnstable/Yarmouth: Lewis Bay
Lewis Bay
Figure 1
LegendLegend
Red = Embayments Modeled 2005
Green = Embayments Modeled 2006
Massachusetts Department of Environmental Protection
Massachusetts Estuaries Project Round 3 Prioritization Massachusetts Estuaries Project Round 3 Prioritization Town of Barnstable/Yarmouth: Lewis Bay
Lewis Bay
Figure 1
LegendLegend
Red = Embayments Modeled 2005
Green = Embayments Modeled 2006

47
Figure 2
Town of Barnstable - Lewis Bay (Rank 40) Nutrient Sampling Stations
Nutrient

48
Figure 3
Town of Barnstable - Lewis Bay (Rank 40) Benthic/Stream Locations
Snows Creek
Bog to Lewis Bay
Mill Pond Creek
Bog to Mill Creek
Dup
Stream Gaging Location Benthic Nutrient Flux Coring * * A sub-set of the nutrient flux coring locations will be used for conducting benthic infuanal grabs

49
Figure 4
Town of Barnstable - Lewis Bay (Rank 40) Tide Gage Locations
Tide Gage ADCP D.O. Mooring

50

51
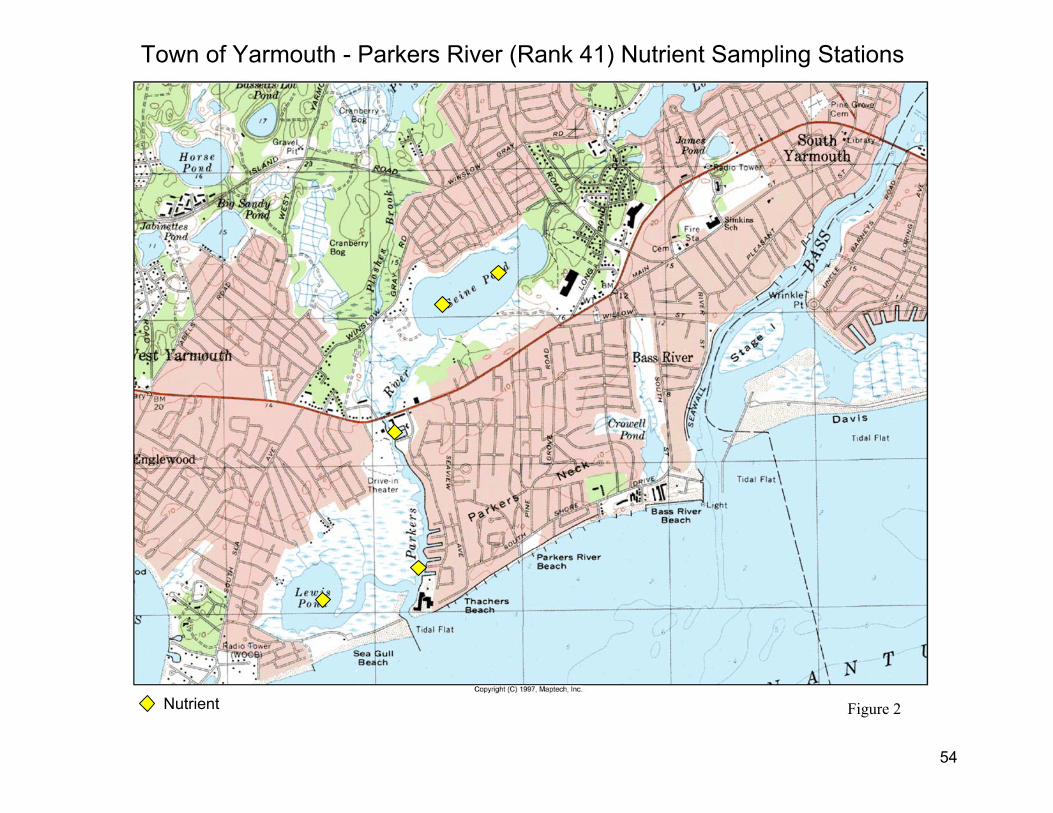
MA Estuaries Project QAPP Appendix A-XLI Parkers River
Town of Yarmouth Prioritization Rank: Round 3 - #41
Figure 1. Location Map Figure 2. Nutrient Sampling Locations Figure 3. Benthic Regeneration and Stream Discharge Sampling Locations Figure 4. Hydrodynamic Data Collection Sites: Tide Gauges and ADCP
transects Embayment Specific Plan: Data Collection consists of Hydrodynamic Data (field data and model), Stream gauging and nitrogen sampling, GIS based Land-use analysis, Nitrogen recycling via Benthic Regeneration, Habitat Assessment (Eelgrass, macroalgae, benthic animals, DO records). Synthesis is primarily covered in the Water Quality Modeling and Reporting components. The efforts of the Estuary Project will be to fill in data gaps to allow parameterization and full modeling and synthesis following the Linked Management Approach. Many of the embayments currently have existing data that can be incorporated into the Linked Approach. A detailed description of previous data, its quality and how it was collected will be part of the Report. However, it is useful to indicate the existing data and our initial assessment of its quality and to present the additional field and modeling work required to fully implement the Estuaries Project Management Approach. Parkers River, Yarmouth Description of System: The Parker River System is a small yet complex estuary that includes Seine Pond, a large tidal salt pond at the upper most reach of the Parker River, and the Parker River proper that is primarily a salt marsh channel. There are 2 surface water flows to the upper system. At the lower end of the Parker River is Lewis Pond a salt pond bordered by extensive tidal salt marsh. The inlet to the Parkers River is maintained and “fixed” by a jetty to the west. At present there are indications that Seine Pond is nitrogen enriched. Previous Relevant Data: Only limited Estuaries Project data exist for this estuary. However, there are some existing stage data for parameterizing the

52
hydrodynamic model. These data were collected under a contract to Tetra Tech. The base files are not yet available and there is concern that the stage data was not collected relative to a vertical datum. High quality water quality monitoring data exists which was collected by a Town of Barnstable water quality monitoring program under the guidance of the Coastal Systems Program at SMAST. The sampling program is consistent with the MEP QAPP water quality requirements. This program uses both technical staff and volunteers to perform the sampling. MEP Analysis: The main Estuaries Project efforts will be to (1) establish a hydrodynamic model based upon placement of tide gauges, bathymetric survey, and conducting ADCP survey, (2) perform land-use and watershed nitrogen load modeling based upon the new USGS watershed delineation; (3) collect stream flow/nitrogen load data to complete the requisite 14 months (building on the existing dataset); (4) collect benthic cores and determine summer nitrogen regeneration rates as well as macroalgal presence at the benthic coring location; (5) collect a dissolved oxygen record to support the habitat assessment; (6) map eelgrass distribution and create historic record; (7) collect benthic infaunal distribution and indicator data; and (8) conduct the water quality modeling, thresholds analysis and synthesis. It should be noted that the selection of sites for collection of the benthic infaunal grab samples is not conducted a priori and are therefore not depicted in Figure 3. Observations made by divers collecting benthic nutrient regeneration cores guides the selection of which benthic locations will also be used for infaunal grab samples. A sub-set of the nutrient regeneration core locations depicted in Figure 3 will be used to conduct the benthic infaunal grab sampling.

53
Massachusetts Department of Environmental Protection
Massachusetts Estuaries Project Round 3 Prioritization Massachusetts Estuaries Project Round 3 Prioritization Town of Yarmouth: Parkers River
Parkers River
Figure 1
LegendLegend
Red = Embayments Modeled 2005
Green = Embayments Modeled 2006
Massachusetts Department of Environmental Protection
Massachusetts Estuaries Project Round 3 Prioritization Massachusetts Estuaries Project Round 3 Prioritization Town of Yarmouth: Parkers River
Parkers River
Figure 1
LegendLegend
Red = Embayments Modeled 2005
Green = Embayments Modeled 2006
54
Figure 2
Town of Yarmouth - Parkers River (Rank 41) Nutrient Sampling Stations
Nutrient

55
Figure 3
Town of Yarmouth - Parkers River (Rank 41) Benthic/Stream Locations
Creek to Seine Pond
Dup
Stream Gaging Location Benthic Nutrient Flux Coring *
* A sub-set of the nutrient flux coring locations will be used for conducting benthic infuanal grabs

56
Figure 4
Town of Yarmouth - Parkers River (Rank 41) Tide Gage Locations
Tide Gage ADCP D.O. Mooring

57

58
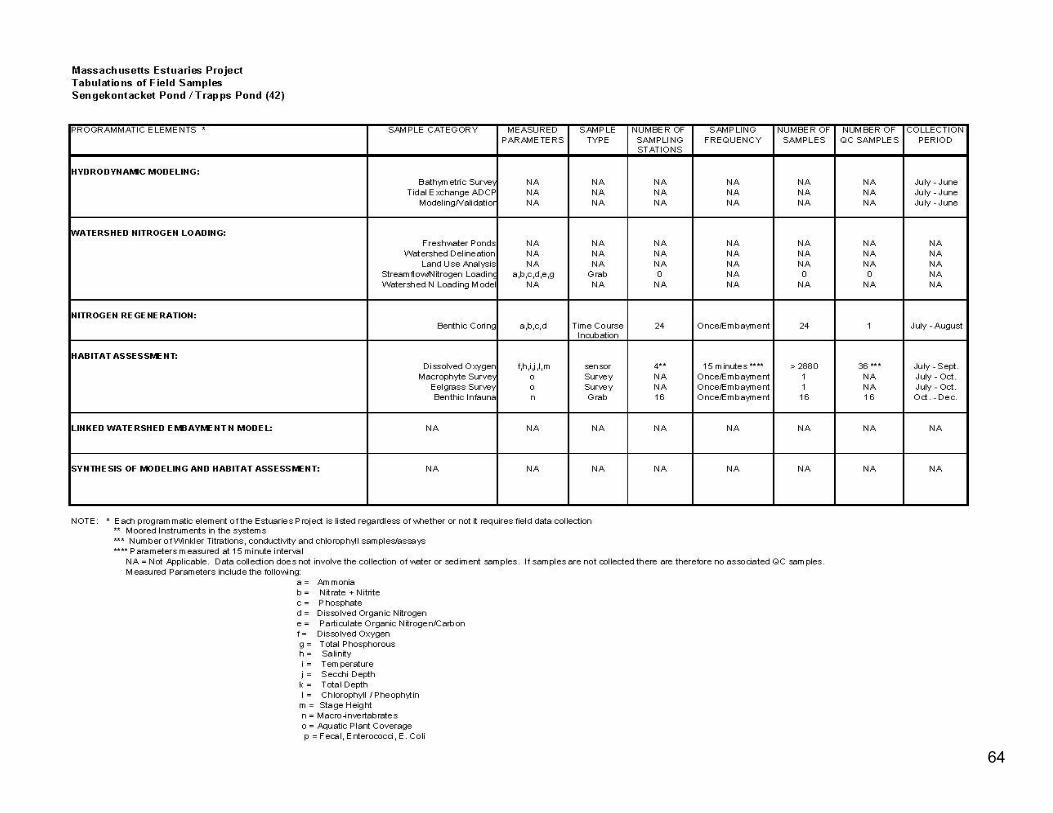
MA Estuaries Project QAPP Appendix A-XLII Sengekontacket Pond/Trapps Pond
Martha’s Vineyard Prioritization Rank: Round 3 - #42
Figure 1. Location Map Figure 2. Nutrient Sampling Locations Figure 3. Benthic Regeneration and Stream Discharge Sampling Locations Figure 4. Hydrodynamic Data Collection Sites: Tide Gauges and ADCP
transects Embayment Specific Plan: Data Collection consists of Hydrodynamic Data (field data and model), Stream gauging and nitrogen sampling, GIS based Land-use analysis, Nitrogen recycling via Benthic Regeneration, Habitat Assessment (Eelgrass, macroalgae, benthic animals, DO records). Synthesis is primarily covered in the Water Quality Modeling and Reporting components. The efforts of the Estuary Project will be to fill in data gaps to allow parameterization and full modeling and synthesis following the Linked Management Approach. Many of the embayments currently have existing data that can be incorporated into the Linked Approach. A detailed description of previous data, its quality and how it was collected will be part of the Report. However, it is useful to indicate the existing data and our initial assessment of its quality and to present the additional field and modeling work required to fully implement the Estuaries Project Management Approach. Sengekontacket Pond / Trapps Pond, Martha’s Vineyard Description of System: The Sengekontacket Pond System is a complex estuary formed by the enclosure of a coastal basin by a large barrier beach. The system consists of a large coastal lagoon, Sengekontacket Pond with open exchange to an inland basin, Majors Cove, and restricted exchange with Trapps Pond. Trapps Pond was almost certainly once a continuation of Sengekontacket Pond, being separated by coastal processes and the landward migration of the barrier beach. Currently, Sengekontacket Pond exchanges tidal waters through 2 inlets “fixed” by highway bridges, while Trapps Pond/Sengekontacket exchange is through a narrow channel, through salt marsh, and under the highway. At

59
present there is concern regarding the habitat health of Trapps Pond and Majors Cove. Previous Relevant Data: Only limited Estuaries Project data exist for this estuary. However, there was a 72 hr tidal/nutrient flow study conducted by WHOI scientists in the late 1980’s that can be used for comparative purposes, as well as a Coastal Processes study on the Barrier Beach that was conducted by ENSR and provides some contextual information. High quality water quality monitoring data exists which was collected and analyzed by the Martha’s Vineyard Commission under a DEP approved QAPP. Technical design details and analytical aspects of the monitoring program were developed in collaboration with the Coastal Systems Program at SMAST for the MVC. Most of the assays were performed by the SMAST Coastal Systems Analytical Facility. This program uses technical staff to perform the sampling. The Martha’s Vineyard Commission is a formal partner to the Estuaries Project and is assisting in the incorporation of water quality data and historical data into the Estuaries Project Effort. MEP Analysis: The main Estuaries Project efforts will be to (1) establish a hydrodynamic model based upon placement of tide gauges, bathymetric survey, and conducting ADCP surveys, (2) perform land-use and watershed nitrogen load modeling based upon the new USGS watershed delineation; (3) collect stream flow/nitrogen load data to complete the requisite 14 months (building on the existing dataset); (4) collect benthic cores and determine summer nitrogen regeneration rates as well as macroalgal presence at the benthic coring location; (5) collect a dissolved oxygen record to support the habitat assessment; (6) map eelgrass distribution and create historic record; (7) collect benthic infaunal distribution and indicator data; and (8) conduct the water quality modeling, thresholds analysis and synthesis. It should be noted that the selection of sites for collection of the benthic infaunal grab samples is not conducted a priori and are therefore not depicted in Figure 3. Observations made by divers collecting benthic nutrient regeneration cores guides the selection of which benthic locations will also be used for infaunal grab samples. A sub-set of the nutrient regeneration core locations depicted in Figure 3 will be used to conduct the benthic infaunal grab sampling.

60
Massachusetts Department of Environmental Protection
Massachusetts Estuaries Project Round 3 Prioritization Massachusetts Estuaries Project Round 3 Prioritization Martha’s Vineyard : Sengekontacket/Trapps Pond
Sengekontacket/Trapps Pond
Figure 1
LegendLegend
Red = Embayments Modeled 2005
Green = Embayments Modeled 2006

61
Figure 2
Martha’s Vineyard - Sengekontacket Pond (Rank 42) Nutrient Sampling Stations
Nutrient

62
Figure 3
Martha’s Vineyard - Sengekontacket Pond (Rank 42) Benthic/Stream Locations
Dup
Stream Gaging Location Benthic Nutrient Flux Coring *
* A sub-set of the nutrient flux coring locations will be used for conducting benthic infuanal grabs

63
Figure 4
Martha’s Vineyard - Sengekontacket Pond (Rank 42) Tide Gage Locations
Tide Gage ADCP D.O. Mooring
64

65
MA Estuaries Project QAPP Appendix A-XLIII Mattapoisett Harbor
Town of Mattapoisett Prioritization Rank: Round 3 - #43
Figure 1. Location Map Figure 2. Nutrient Sampling Locations Figure 3. Benthic Regeneration and Stream Discharge Sampling Locations Figure 4. Hydrodynamic Data Collection Sites: Tide Gauges and ADCP
transects Embayment Specific Plan: Data Collection consists of Hydrodynamic Data (field data and model), Stream gauging and nitrogen sampling, GIS based Land-use analysis, Nitrogen recycling via Benthic Regeneration, Habitat Assessment (Eelgrass, macroalgae, benthic animals, DO records). Synthesis is primarily covered in the Water Quality Modeling and Reporting components. The efforts of the Estuary Project will be to fill in data gaps to allow parameterization and full modeling and synthesis following the Linked Management Approach. Many of the embayments currently have existing data that can be incorporated into the Linked Approach. A detailed description of previous data, its quality and how it was collected will be part of the Report. However, it is useful to indicate the existing data and our initial assessment of its quality and to present the additional field and modeling work required to fully implement the Estuaries Project Management Approach. Mattapoisett Harbor, Mattapoisett: Description of System: Mattapoisett Harbor is drowned river valley estuary formed by surface water inflows primarily through the Mattapoisett River. The large open basin dominates the system and extends to the end of Mattapoisett Neck to the west and Strawberry Point to the east. The System contains 3 small tributaries, the Mattapoisett River estuary, Eel Pond and Pine Island Pond. At present there are indications of nitrogen enrichment in the Mattapoisett River estuary and Eel Pond. The semi-enclosed basin of Mattapoisett Harbor appears to support nitrogen levels consistent with its open exchange with Buzzards Bay.
66
Previous Relevant Data: Only limited Estuaries Project data exist for this estuary. However, the MEP will integrate information previously collected in the USGS groundwater modeling effort relating to the Mattapoisett River. A high quality nutrient monitoring data set is available from the Coalition for Buzzards Bay’s Monitoring Program. The monitoring data has been collected and analyzed following the Coalition for Buzzards Bay’s Monitoring QAPP, approved by DEP. Technical design details and analytical aspects of the monitoring program were in collaboration with the Coastal Systems Program at SMAST. The assays were performed by the SMAST Coastal Systems Analytical Facility. This program uses volunteers and technical staff to perform the sampling. MEP Analysis: The main Estuaries Project efforts will be to (1) establish a hydrodynamic model based upon placement of tide gauges, and bathymetric survey, (2) perform land-use and watershed nitrogen load modeling based upon the new USGS watershed delineation; (3) collect stream flow/nitrogen load data to complete the requisite 14 months (building on the existing dataset); (4) collect benthic cores and determine summer nitrogen regeneration rates as well as macroalgal presence at the benthic coring location; (5) collect a dissolved oxygen record to support the habitat assessment; (6) map eelgrass distribution and create historic record; (7) collect benthic infaunal distribution and indicator data; and (8) conduct the water quality modeling, thresholds analysis and synthesis. It should be noted that the selection of sites for collection of the benthic infaunal grab samples is not conducted a priori and are therefore not depicted in Figure 3. Observations made by divers collecting benthic nutrient regeneration cores guides the selection of which benthic locations will also be used for infaunal grab samples. A sub-set of the nutrient regeneration core locations depicted in Figure 3 will be used to conduct the benthic infaunal grab sampling. Note: The Acoustic Doppler Current Profiler (ADCP) will not be used. This basin is fully open to tidal exchange with Buzzards Bay waters. The size and configuration of the basin does not support accurate flow determinations by ADCP.

67
Massachusetts Department of Environmental Protection
Massachusetts Estuaries Project Round 3 Prioritization Massachusetts Estuaries Project Round 3 Prioritization Town of Mattapoisett: Mattapoisett Harbor
Mattapoisett Harbor
Figure 1
LegendLegend
Red = Embayments Modeled 2005
Green = Embayments Modeled 2006

68Figure 2
Town of Mattapoisett - Mattapoisett Harbor (Rank 43) Nutrient Sampling Stations
Nutrient

69Figure 3
Town of Mattapoisett - Mattapoisett Harbor (Rank 43) Benthic/Stream Locations
Creek to Eel Pond
Mattapoisett River
Dup
Stream Gaging Location Benthic Nutrient Flux Coring * * A sub-set of the nutrient flux coring locations will be used for conducting benthic infuanal grabs

70Figure 4
Town of Mattapoisett - Mattapoisett Harbor (Rank 43) Tide Gage Locations
Tide Gage ADCP D.O. Mooring Single Point Current

71

72
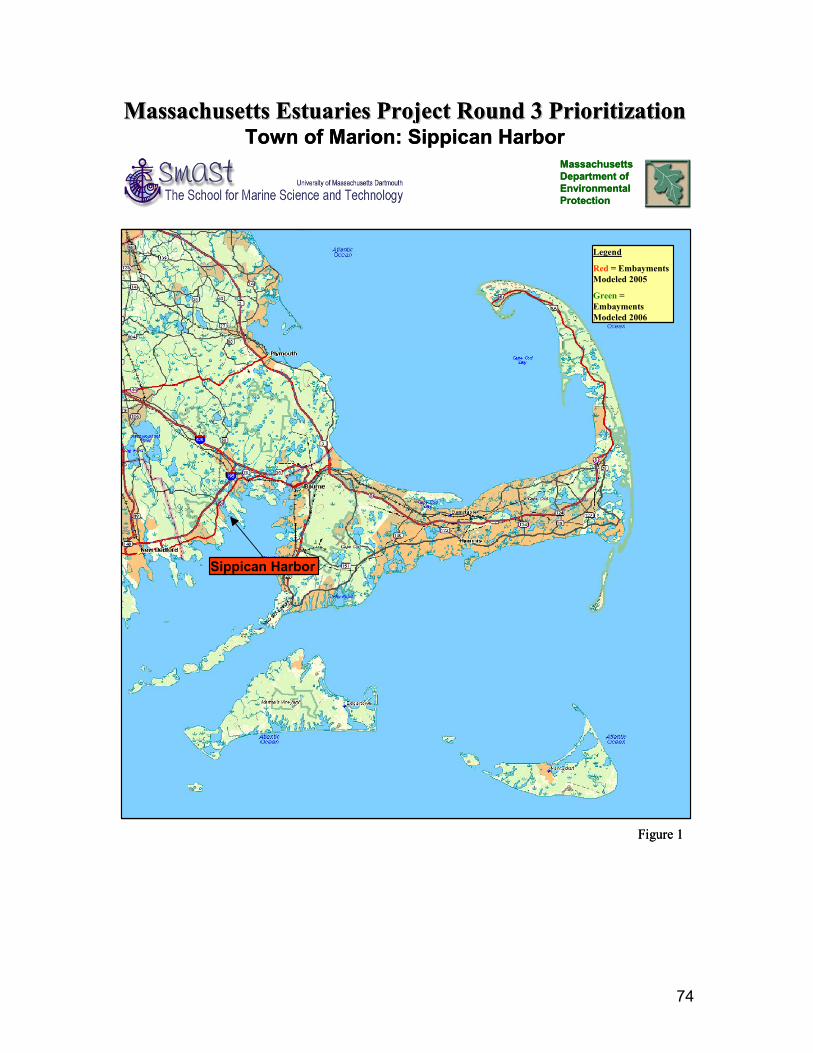
MA Estuaries Project QAPP Appendix A-XLIV Sippican Harbor
Town of Marion Prioritization Rank: Round 3 - #44
Figure 1. Location Map Figure 2. Nutrient Sampling Locations Figure 3. Benthic Regeneration and Stream Discharge Sampling Locations Figure 4. Hydrodynamic Data Collection Sites: Tide Gauges and ADCP
transects Embayment Specific Plan: Data Collection consists of Hydrodynamic Data (field data and model), Stream gauging and nitrogen sampling, GIS based Land-use analysis, Nitrogen recycling via Benthic Regeneration, Habitat Assessment (Eelgrass, macroalgae, benthic animals, DO records). Synthesis is primarily covered in the Water Quality Modeling and Reporting components. The efforts of the Estuary Project will be to fill in data gaps to allow parameterization and full modeling and synthesis following the Linked Management Approach. Many of the embayments currently have existing data that can be incorporated into the Linked Approach. A detailed description of previous data, its quality and how it was collected will be part of the Report. However, it is useful to indicate the existing data and our initial assessment of its quality and to present the additional field and modeling work required to fully implement the Estuaries Project Management Approach. Sippican Harbor, Marion Description of System: The Sippican Harbor System is a complex estuary formed initially as a drowned river valley estuary by surface water inflows at the head of the Harbor and through Hammett Cove. The large open basin dominates the system and extends to the end of Converse Point to the west and Strawberry Point to the east. The System contains 2 smaller tributaries, Hammett Cove which receives a large proportion of the watershed nitrogen loading and the Blankinship Cove/Planting Island Cove basin in the outer harbor region. The Sippican Harbor basin is divided into upper and lower regions by Ram Island. This island alters the tidal flows which allows for enhanced nitrogen levels in the upper versus lower basin. The lower Sippican Harbor Basin

73
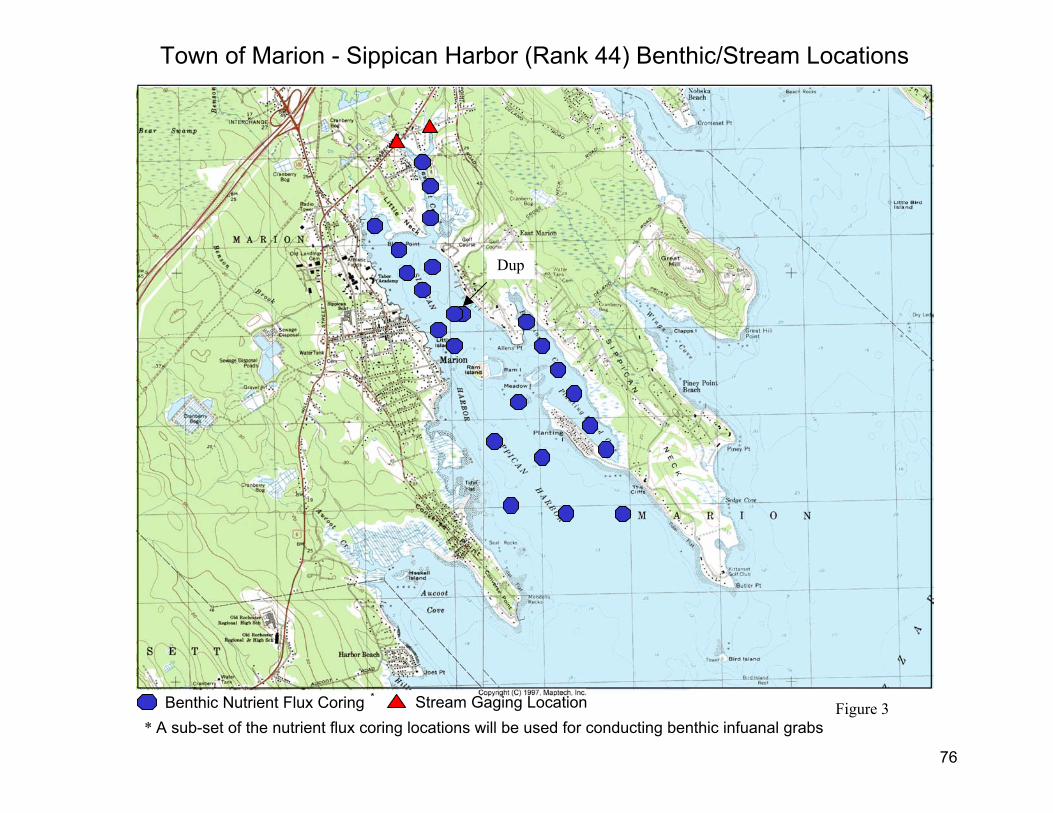
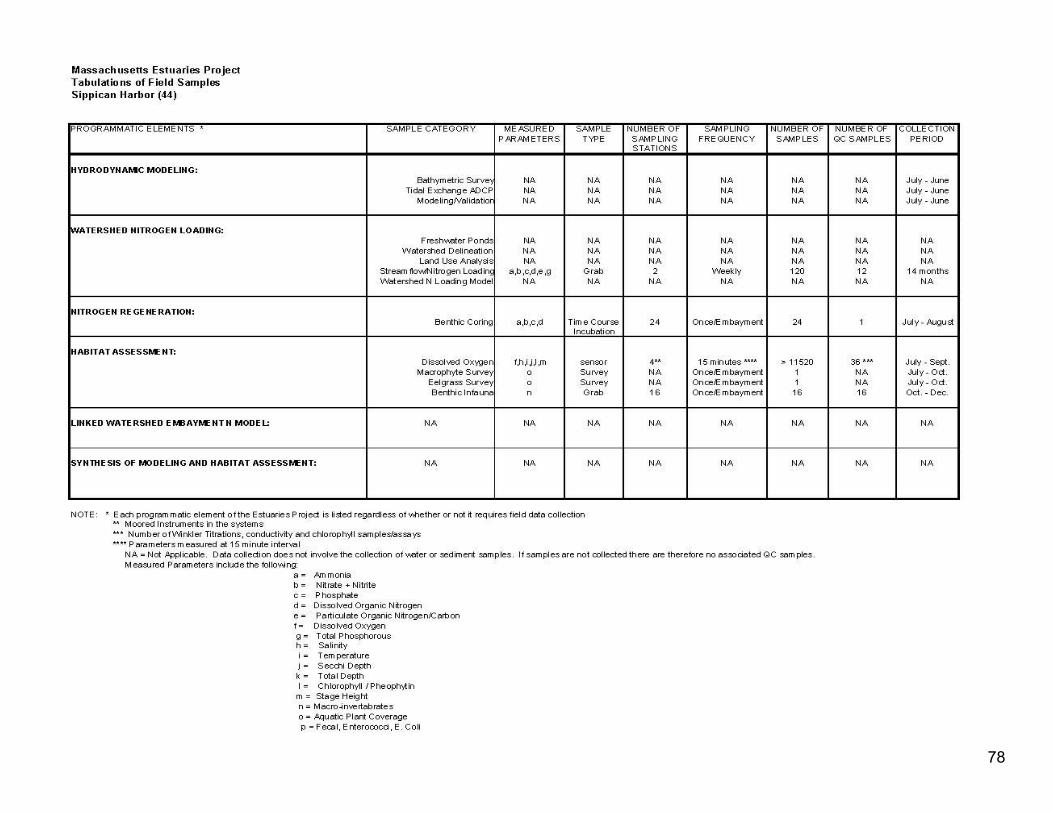
exchanges tidal waters directly with Buzzards Bay. At present there are indications of nitrogen enrichment in Hammett Cove and to a lesser extent in Blankinship Cove/Planting Island Cove and the upper Harbor basin. The semi-enclosed lower basin of Sippican Harbor appears to support nitrogen levels consistent with its open exchange with Buzzards Bay. Previous Relevant Data: At present no existing process-level data that are fully compliant with the Estuaries Project QAPP and suitable for parameterizing the Linked Approach have been identified. A high quality nutrient monitoring data set is available from the Coalition for Buzzards Bay’s Monitoring Program. The monitoring data has been collected and analyzed following the Coalition for Buzzards Bay’s Monitoring QAPP, approved by DEP. Technical design details and analytical aspects of the monitoring program were in collaboration with the Coastal Systems Program at SMAST. The assays were performed by the SMAST Coastal Systems Analytical Facility. This program uses volunteers and technical staff to perform the sampling. MEP Analysis: The main Estuaries Project efforts will be to (1) establish a hydrodynamic model based upon placement of tide gauges, bathymetric survey, and ADCP surveys, (2) perform land-use and watershed nitrogen load modeling based upon the new USGS watershed delineation; (3) collect stream flow/nitrogen load data to complete the requisite 14 months (building on the existing dataset); (4) collect benthic cores and determine summer nitrogen regeneration rates as well as macroalgal presence at the benthic coring location; (5) collect a dissolved oxygen record to support the habitat assessment; (6) map eelgrass distribution and create historic record; (7) collect benthic infaunal distribution and indicator data; and (8) conduct the water quality modeling, thresholds analysis and synthesis. It should be noted that the selection of sites for collection of the benthic infaunal grab samples is not conducted a priori and are therefore not depicted in Figure 3. Observations made by divers collecting benthic nutrient regeneration cores guides the selection of which benthic locations will also be used for infaunal grab samples. A sub-set of the nutrient regeneration core locations depicted in Figure 3 will be used to conduct the benthic infaunal grab sampling.
74
Massachusetts Department of Environmental Protection
Massachusetts Estuaries Project Round 3 Prioritization Massachusetts Estuaries Project Round 3 Prioritization Town of Marion: Sippican Harbor
Sippican Harbor
Figure 1
LegendLegend
Red = Embayments Modeled 2005
Green = Embayments Modeled 2006
Massachusetts Department of Environmental Protection
Massachusetts Estuaries Project Round 3 Prioritization Massachusetts Estuaries Project Round 3 Prioritization Town of Marion: Sippican Harbor
Sippican Harbor
Figure 1
LegendLegend
Red = Embayments Modeled 2005
Green = Embayments Modeled 2006

75
Figure 2
Town of Marion - Sippican Harbor (Rank 44) Nutrient Sampling Stations
Nutrient
76
Figure 3
Town of Marion - Sippican Harbor (Rank 44) Benthic/Stream Locations
Dup
Stream Gaging Location Benthic Nutrient Flux Coring * * A sub-set of the nutrient flux coring locations will be used for conducting benthic infuanal grabs

77
Figure 4
Town of Marion - Sippican Harbor (Rank 44) Tide Gage Locations
Tide Gage ADCP D.O. Mooring
78

79
MA Estuaries Project QAPP Appendix A-XLV Wellfleet Harbor
Town of Wellfleet Prioritization Rank: Round 3 - #45
Figure 1. Location Map Figure 2. Nutrient Sampling Locations Figure 3. Benthic Regeneration and Stream Discharge Sampling Locations Figure 4. Hydrodynamic Data Collection Sites: Tide Gauges and ADCP
transects Embayment Specific Plan: Data Collection consists of Hydrodynamic Data (field data and model), Stream gauging and nitrogen sampling, GIS based Land-use analysis, Nitrogen recycling via Benthic Regeneration, Habitat Assessment (Eelgrass, macroalgae, benthic animals, DO records). Synthesis is primarily covered in the Water Quality Modeling and Reporting components. The efforts of the Estuary Project will be to fill in data gaps to allow parameterization and full modeling and synthesis following the Linked Management Approach. Many of the embayments currently have existing data that can be incorporated into the Linked Approach. A detailed description of previous data, its quality and how it was collected will be part of the Report. However, it is useful to indicate the existing data and our initial assessment of its quality and to present the additional field and modeling work required to fully implement the Estuaries Project Management Approach. Wellfleet Harbor, Wellfleet: Description of system: The Wellfleet Harbor System is a complex embayment consisting of a large central basin with extensive tributary sub-systems that have extensive wetlands (Herring River and Hatches Creek, tidal flats, Drummer Cover and Loggy Bay), and a significantly altered tidal river (Duck Creek). The system has generally high water quality and supports extensive aquaculture enterprises. However, the Herring River is a tidally restricted marsh system, Duck Creek is nutrient enriched and the Drummer Cove/Loggy Bay region has some macroalgal accumulations. Previous Relevant Data: Only limited Estuaries Project data exist for this estuary. In the early 1990’s, WHOI conducted a preliminary hydrodynamic study

80
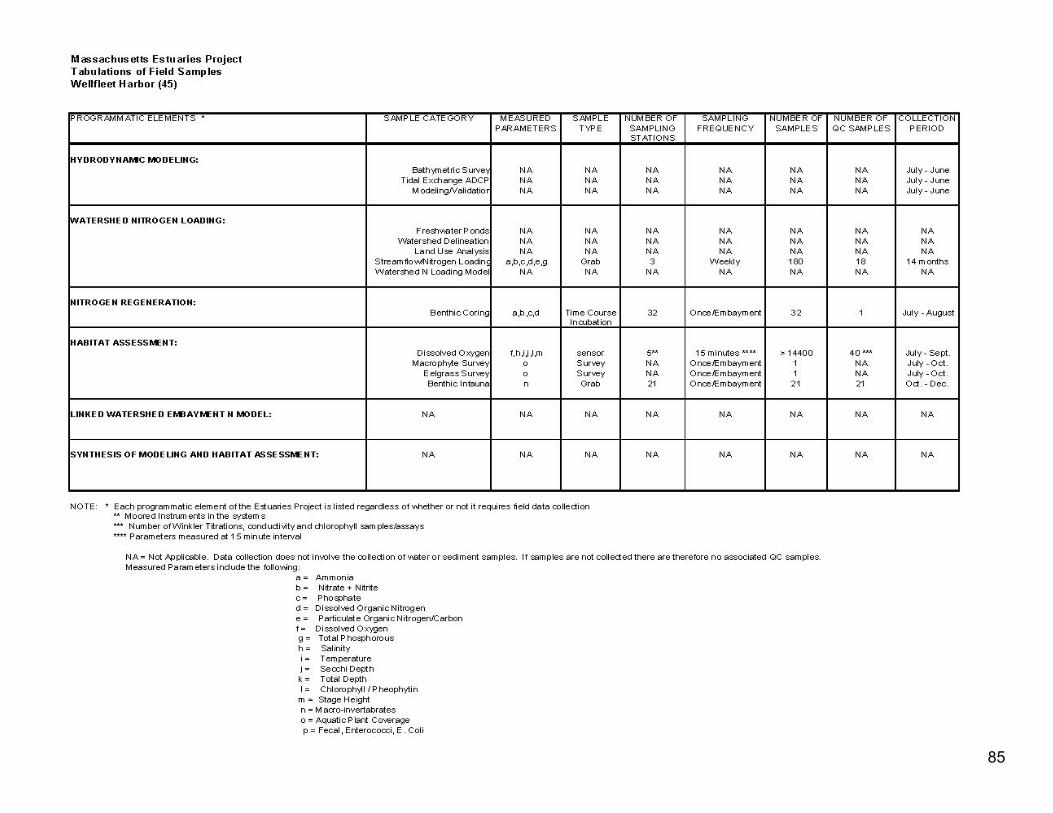
of the system, which will be used for comparative purposes. In addition, there has been extensive study of the Herring River System relative to the effects and needs for restoration tidal flows. These studies provide important context for the nutrient retention by this sub-system and also will provide some outflow data. The MEP will also use previous benthic regeneration data collected at 3 sites, focusing on the Duck Creek region. These data were collected by current MEP Technical Staff using the technique now employed by the MEP and detailed in the MEP QAPP. These data will be used primarily for purposes of temporal comparison. There is also high quality water quality monitoring data exists which was collected and analyzed by the Town of Wellfleet in partnership with the Barnstable County Department of Health and Environment from 1990-95. These data were collected under a QAPP for the Massachusetts Bay Program. More recently the Town of Wellfleet has renewed its water quality sampling program, the QAPP is in revision and the MEP will only use data that follows the final accepted QAPP procedures. MEP Analysis: The main Estuaries Project efforts will be to (1) establish a hydrodynamic model based upon placement of tide gauges, bathymetric survey, and conducting ADCP survey, (2) perform land-use and watershed nitrogen loading model based upon the new USGS watershed delineation; (3) collect stream flow/nitrogen load data to complete the requisite 14 months (building on the existing dataset); (4) collect benthic cores and determine summer nitrogen regeneration rates as well as macroalgal presence at the benthic coring location; (5) collect a dissolved oxygen record to support the habitat assessment; (6) map eelgrass distribution and create historic record; (7) collect benthic infaunal distribution and indicator data; and (8) conduct the water quality modeling, thresholds analysis and synthesis. It should be noted that the selection of sites for collection of the benthic infaunal grab samples is not conducted a priori and are therefore not depicted in Figure 3. Observations made by divers collecting benthic nutrient regeneration cores guides the selection of which benthic locations will also be used for infaunal grab samples. A sub-set of the nutrient regeneration core locations depicted in Figure 3 will be used to conduct the benthic infaunal grab sampling.

81
Massachusetts Department of Environmental Protection
Massachusetts Estuaries Project Round 3 Prioritization Massachusetts Estuaries Project Round 3 Prioritization Town of Wellfleet: Wellfleet Harbor
Wellfleet Harbor
Figure 1
LegendLegend
Red = Embayments Modeled 2005
Green = Embayments Modeled 2006
Massachusetts Department of Environmental Protection
Massachusetts Estuaries Project Round 3 Prioritization Massachusetts Estuaries Project Round 3 Prioritization Town of Wellfleet: Wellfleet Harbor
Wellfleet Harbor
Figure 1
LegendLegend
Red = Embayments Modeled 2005
Green = Embayments Modeled 2006

82Figure 2
Town of Wellfleet - Wellfleet Harbor (Rank 45) Nutrient Sampling Stations
Nutrient

83Figure 3
Town of Wellfleet - Wellfleet Harbor (Rank 45) Benthic/Stream Locations
Herring River
Hatches
Fresh Brook
Dup
Stream Gaging Location Benthic Nutrient Flux Coring * * A sub-set of the nutrient flux coring locations will be used for conducting benthic infuanal grabs

84Figure 4
Town of Wellfleet - Wellfleet Harbor (Rank 45) Tide Gage Locations
Tide Gage ADCP Single Point Current D.O.
85

86
MA Estuaries Project QAPP Appendix A-XLVI Saquatucket Harbor
Town of Harwich Prioritization Rank: Round 3 - #46
Figure 1. Location Map Figure 2. Nutrient Sampling Locations Figure 3. Benthic Regeneration and Stream Discharge Sampling Locations Figure 4. Hydrodynamic Data Collection Sites: Tide Gauges and ADCP
transects Embayment Specific Plan: Data Collection consists of Hydrodynamic Data (field data and model), Stream gauging and nitrogen sampling, GIS based Land-use analysis, Nitrogen recycling via Benthic Regeneration, Habitat Assessment (Eelgrass, macroalgae, benthic animals, DO records). Synthesis is primarily covered in the Water Quality Modeling and Reporting components. The efforts of the Estuary Project will be to fill in data gaps to allow parameterization and full modeling and synthesis following the Linked Management Approach. Many of the embayments currently have existing data that can be incorporated into the Linked Approach. A detailed description of previous data, its quality and how it was collected will be part of the Report. However, it is useful to indicate the existing data and our initial assessment of its quality and to present the additional field and modeling work required to fully implement the Estuaries Project Management Approach. Saquatucket Harbor, Harwich Description of System: Saquatucket Harbor is mainly an artificial basin created by dredging (most likely of salt marsh). There are 2 surface water inflows originating in a bog and pond, respectively. The Harbor system consists of a small central basin with a dredged channel to Nantucket Sound, there is limited remaining salt marsh. The tidal channel to Nantucket Sound is stabilized by jetties. The Harbor supports a high density of dockage and moorings. Previous Relevant Data: At present no existing process-level data that are fully compliant with the Estuaries Project QAPP and suitable for parameterizing the

87
Linked Approach have been identified. A preliminary hydrodynamic investigation was conducted for the Cape Cod Commission, which will be used for comparative purposes. High quality water quality monitoring data exists which was collected by a the Town of Harwich water quality monitoring program in cooperation with the Coastal Systems Program at SMAST. The sampling program is consistent with the MEP QAPP water quality requirements. A QAPP is being prepared by the Town for submission to DEP. This program uses primarily technical staff to perform the sampling. MEP Analysis: The main Estuaries Project efforts will be to (1) establish a hydrodynamic model based upon placement of tide gauges, and bathymetric survey, (2) perform land-use and watershed nitrogen load modeling based upon the new USGS watershed delineation; (3) collect stream flow/nitrogen load data to complete the requisite 14 months (building on the existing dataset); (4) collect benthic cores and determine summer nitrogen regeneration rates as well as macroalgal presence at the benthic coring location; (5) collect a dissolved oxygen record to support the habitat assessment; (6) map eelgrass distribution and create historic record; (7) collect benthic infaunal distribution and indicator data; and (8) conduct the water quality modeling, thresholds analysis and synthesis. It should be noted that the selection of sites for collection of the benthic infaunal grab samples is not conducted a priori and are therefore not depicted in Figure 3. Observations made by divers collecting benthic nutrient regeneration cores guides the selection of which benthic locations will also be used for infaunal grab samples. A sub-set of the nutrient regeneration core locations depicted in Figure 3 will be used to conduct the benthic infaunal grab sampling. Note: The Acoustic Doppler Current Profiler (ADCP) will not be used, due to issues with the small channel and the simplicity of the system allowing for use of tidal prism calculations to validate tidal volume.

88
Massachusetts Department of Environmental Protection
Massachusetts Estuaries Project Round 3 Prioritization Massachusetts Estuaries Project Round 3 Prioritization Town of Harwich: Saquatucket Harbor
Saquatucket Harbor
Figure 1
LegendLegend
Red = Embayments Modeled 2005
Green = Embayments Modeled 2006

89
Figure 2

90
Figure 3 Stream Gaging Location Benthic Nutrient Flux Coring *
* A sub-set of the nutrient flux coring locations will be used for conducting benthic infuanal grabs

91
Figure 4

92

93
MA Estuaries Project QAPP Appendix A-XLVII Allens Harbor
Town of Harwich Prioritization Rank: Round 3 - #47
Figure 1. Location Map Figure 2. Nutrient Sampling Locations Figure 3. Benthic Regeneration and Stream Discharge Sampling Locations Figure 4. Hydrodynamic Data Collection Sites: Tide Gauges and ADCP
transects Embayment Specific Plan: Data Collection consists of Hydrodynamic Data (field data and model), Stream gauging and nitrogen sampling, GIS based Land-use analysis, Nitrogen recycling via Benthic Regeneration, Habitat Assessment (Eelgrass, macroalgae, benthic animals, DO records). Synthesis is primarily covered in the Water Quality Modeling and Reporting components. The efforts of the Estuary Project will be to fill in data gaps to allow parameterization and full modeling and synthesis following the Linked Management Approach. Many of the embayments currently have existing data that can be incorporated into the Linked Approach. A detailed description of previous data, its quality and how it was collected will be part of the Report. However, it is useful to indicate the existing data and our initial assessment of its quality and to present the additional field and modeling work required to fully implement the Estuaries Project Management Approach. Allens Harbor, Harwich Description of System: Allens Harbor is a small complex estuary consisting of a central open water basin with a small tributary embayment and an upper tidal salt marsh connected by a single tidal channel. The Harbor System exchanges tidal water with Nantucket Sound through Doanes Creek, which is stabilized with jetties. The central basin supports a high density of dockage and moorings. Allens Harbor currently has bacterial contamination issues, which a Town study suggests results primarily from wildlife. Previous Relevant Data: At present no existing process-level data that are fully compliant with the Estuaries Project QAPP and suitable for parameterizing the

94
Linked Approach have been identified. The Town’s study of bacterial contamination did not include surface water inflow or hydrodynamic investigations or nutrient data collection. However, a preliminary tidal prism study of this system has been conducted for the Cape Cod Commission and will be used for comparative purposes. High quality water quality monitoring data exists which was collected by the Town of Harwich water quality monitoring program in cooperation with the Coastal Systems Program at SMAST. The sampling program is consistent with the MEP QAPP water quality requirements. A QAPP is being prepared by the Town for submission to DEP. This program uses primarily technical staff to perform the sampling. MEP Analysis: The main Estuaries Project efforts will be to (1) establish a hydrodynamic model based upon placement of tide gauges, and bathymetric survey, (2) perform land-use and watershed nitrogen load modeling based upon the new USGS watershed delineation; (3) collect stream flow/nitrogen load data to complete the requisite 14 months (building on the existing dataset); (4) collect benthic cores and determine summer nitrogen regeneration rates as well as macroalgal presence at the benthic coring location; (5) collect a dissolved oxygen record to support the habitat assessment; (6) map eelgrass distribution and create historic record; (7) collect benthic infaunal distribution and indicator data; and (8) conduct the water quality modeling, thresholds analysis and synthesis. It should be noted that the selection of sites for collection of the benthic infaunal grab samples is not conducted a priori and are therefore not depicted in Figure 3. Observations made by divers collecting benthic nutrient regeneration cores guides the selection of which benthic locations will also be used for infaunal grab samples. A sub-set of the nutrient regeneration core locations depicted in Figure 3 will be used to conduct the benthic infaunal grab sampling. Note: The Acoustic Doppler Current Profiler (ADCP) will not be used, due to issues with the small channel and the simplicity of the system allowing for use of tidal prism calculations to validate tidal volume.

95
Massachusetts Department of Environmental Protection
Massachusetts Estuaries Project Round 3 Prioritization Massachusetts Estuaries Project Round 3 Prioritization Town of Harwich: Allens Harbor
Allens Harbor
Figure 1
LegendLegend
Red = Embayments Modeled 2005
Green = Embayments Modeled 2006
Massachusetts Department of Environmental Protection
Massachusetts Estuaries Project Round 3 Prioritization Massachusetts Estuaries Project Round 3 Prioritization Town of Harwich: Allens Harbor
Allens Harbor
Figure 1
LegendLegend
Red = Embayments Modeled 2005
Green = Embayments Modeled 2006

96
Figure 2

97
Figure 3 Stream Gaging Location Benthic Nutrient Flux Coring *
* A sub-set of the nutrient flux coring locations will be used for conducting benthic infuanal grabs

98
Figure 4

99

100
MA Estuaries Project QAPP Appendix A-XLVIII Wychmere Harbor
Town of Harwich Prioritization Rank: Round 3 - #48
Figure 1. Location Map Figure 2. Nutrient Sampling Locations Figure 3. Benthic Regeneration and Stream Discharge Sampling Locations Figure 4. Hydrodynamic Data Collection Sites: Tide Gauges and ADCP
transects Embayment Specific Plan: Data Collection consists of Hydrodynamic Data (field data and model), Stream gauging and nitrogen sampling, GIS based Land-use analysis, Nitrogen recycling via Benthic Regeneration, Habitat Assessment (Eelgrass, macroalgae, benthic animals, DO records). Synthesis is primarily covered in the Water Quality Modeling and Reporting components. The efforts of the Estuary Project will be to fill in data gaps to allow parameterization and full modeling and synthesis following the Linked Management Approach. Many of the embayments currently have existing data that can be incorporated into the Linked Approach. A detailed description of previous data, its quality and how it was collected will be part of the Report. However, it is useful to indicate the existing data and our initial assessment of its quality and to present the additional field and modeling work required to fully implement the Estuaries Project Management Approach. Wychmere Harbor, Harwich Description of System: Wychmere is a drowned kettle pond receiving tidal flows from Nantucket Sound through a narrow channel, which is stabilized with jetties. The single basin supports a high density of moorings. There is little associated tidal marsh. Previous Relevant Data: At present no existing process-level data that are fully compliant with the Estuaries Project QAPP and suitable for parameterizing the Linked Approach have been identified. However, a preliminary tidal prism study of this system has been conducted for the Cape Cod Commission and will be used for comparative purposes.
101
High quality water quality monitoring data exists which was collected by the Town of Harwich water quality monitoring program in cooperation with the Coastal Systems Program at SMAST. The sampling program is consistent with the MEP QAPP water quality requirements. A QAPP is being prepared by the Town for submission to DEP. This program uses primarily technical staff to perform the sampling. MEP Analysis: The main Estuaries Project efforts will be to (1) establish a hydrodynamic model based upon placement of tide gauges, and bathymetric survey, (2) perform land-use and watershed nitrogen load modeling based upon the new USGS watershed delineation; (3) collect stream flow/nitrogen load data to complete the requisite 14 months (building on the existing dataset); (4) collect benthic cores and determine summer nitrogen regeneration rates as well as macroalgal presence at the benthic coring location; (5) collect a dissolved oxygen record to support the habitat assessment; (6) map eelgrass distribution and create historic record; (7) collect benthic infaunal distribution and indicator data; and (8) conduct the water quality modeling, thresholds analysis and synthesis. It should be noted that the selection of sites for collection of the benthic infaunal grab samples is not conducted a priori and are therefore not depicted in Figure 3. Observations made by divers collecting benthic nutrient regeneration cores guides the selection of which benthic locations will also be used for infaunal grab samples. A sub-set of the nutrient regeneration core locations depicted in Figure 3 will be used to conduct the benthic infaunal grab sampling. Note: The Acoustic Doppler Current Profiler (ADCP) will not be used, due to issues with the small channel and the simplicity of the system allowing for use of tidal prism calculations to validate tidal volume.

102
Massachusetts Department of Environmental Protection
Massachusetts Estuaries Project Round 3 Prioritization Massachusetts Estuaries Project Round 3 Prioritization Town of Harwich: Wychmere Harbor
Wychmere Harbor
Figure 1
LegendLegend
Red = Embayments Modeled 2005
Green = Embayments Modeled 2006
Massachusetts Department of Environmental Protection
Massachusetts Estuaries Project Round 3 Prioritization Massachusetts Estuaries Project Round 3 Prioritization Town of Harwich: Wychmere Harbor
Wychmere Harbor
Figure 1
LegendLegend
Red = Embayments Modeled 2005
Green = Embayments Modeled 2006

103
Figure 2

104
Figure 3 Stream Gaging Location Benthic Nutrient Flux Coring *
* A sub-set of the nutrient flux coring locations will be used for conducting benthic infuanal grabs

105
Figure 4

106

107
MA Estuaries Project QAPP Appendix A-XLIX Herring River
Town of Harwich Prioritization Rank: Round 3 - #49
Figure 1. Location Map Figure 2. Nutrient Sampling Locations Figure 3. Benthic Regeneration and Stream Discharge Sampling Locations Figure 4. Hydrodynamic Data Collection Sites: Tide Gauges and ADCP
transects Embayment Specific Plan: Data Collection consists of Hydrodynamic Data (field data and model), Stream gauging and nitrogen sampling, GIS based Land-use analysis, Nitrogen recycling via Benthic Regeneration, Habitat Assessment (Eelgrass, macroalgae, benthic animals, DO records). Synthesis is primarily covered in the Water Quality Modeling and Reporting components. The efforts of the Estuary Project will be to fill in data gaps to allow parameterization and full modeling and synthesis following the Linked Management Approach. Many of the embayments currently have existing data that can be incorporated into the Linked Approach. A detailed description of previous data, its quality and how it was collected will be part of the Report. However, it is useful to indicate the existing data and our initial assessment of its quality and to present the additional field and modeling work required to fully implement the Estuaries Project Management Approach. Herring River, Harwich: Preliminary study of tidal flow and seasonal nitrogen fluxes (4-5 samples over one year). Description of System: The Herring River System is primarily a large tidal wetland system with multiple (3) surface water inflows. The large upper marsh system exchanges tidal waters with Nantucket Sound through a long channel that passes through the densely developed portion of West Harwich. Although there are concerns over nitrogen enrichment of this system, its function as a salt marsh suggests that it may not currently be nitrogen overloaded. The tidal inlet is presently stabilized with jetties.

108
Previous Relevant Data: At present no existing process-level data that are fully compliant with the Estuaries Project QAPP and suitable for parameterizing the Linked Approach have been identified. However, a preliminary study of flow and nitrogen fluxes within the tidal river has been conducted. This effort collected nitrogen samples and point measurements of flow on 4-5 dates over a year. This data will be used as part of the baseline data for this system. High quality water quality monitoring data exists which was collected by the Town of Harwich water quality monitoring program in cooperation with the Coastal Systems Program at SMAST. The sampling program is consistent with the MEP QAPP water quality requirements. A QAPP is being prepared by the Town for submission to DEP. This program uses primarily technical staff to perform the sampling. MEP Analysis: The main Estuaries Project efforts will be to (1) establish a hydrodynamic model based upon placement of tide gauges, bathymetric survey, and ADCP survey, (2) perform land-use and watershed nitrogen load modeling based upon the new USGS watershed delineation; (3) collect stream flow/nitrogen load data to complete the requisite 14 months (building on the existing dataset); (4) collect benthic cores and determine summer nitrogen regeneration rates as well as macroalgal presence at the benthic coring location; (5) collect a dissolved oxygen record to support the habitat assessment; (6) map eelgrass distribution and create historic record; (7) collect benthic infaunal distribution and indicator data; and (8) conduct the water quality modeling, thresholds analysis and synthesis. It should be noted that the selection of sites for collection of the benthic infaunal grab samples is not conducted a priori and are therefore not depicted in Figure 3. Observations made by divers collecting benthic nutrient regeneration cores guides the selection of which benthic locations will also be used for infaunal grab samples. A sub-set of the nutrient regeneration core locations depicted in Figure 3 will be used to conduct the benthic infaunal grab sampling. Note: The Acoustic Doppler Current Profiler (ADCP) will be used to validate modeled flows in this system with significant marsh plain.

109
Massachusetts Department of Environmental Protection
Massachusetts Estuaries Project Round 3 Prioritization Massachusetts Estuaries Project Round 3 Prioritization Town of Harwich: Herring River
LegendLegend
Red = Embayments Modeled 2005
Green = Embayments Modeled 2006
Herring River
Figure 1
Massachusetts Department of Environmental Protection
Massachusetts Estuaries Project Round 3 Prioritization Massachusetts Estuaries Project Round 3 Prioritization Town of Harwich: Herring River
LegendLegend
Red = Embayments Modeled 2005
Green = Embayments Modeled 2006
Herring River
Figure 1

110
Figure 2

111
Figure 3 Stream Gaging Location Benthic Nutrient Flux Coring *
* A sub-set of the nutrient flux coring locations will be used for conducting benthic infuanal grabs

112
Figure 4

113

114
List of References ASA, Inc. Studies of flushing in Round Cove, Allens Harbor, Wychmere Harbor, Saquatucket Harbor. Project Report to the Cape Cod Commission, 1992. Barnstable County (G. Heufelder, B. Howes and others). Quality Assurance Project Plan (QAPP) for the Wellfleet Harbor MiniBays Project. Final June 1992. Benthic infaunal analysis of the Slocum River and Little River Estuaries. This effort is underway and is conducted by the Turn the Tide Project which includes: the Lloyd Center for Environmental Studies, the Coalition for Buzzards Bay and the Coastal Systems Program at SMAST-UMD. The project is central to the MEP effort for the Town of Dartmouth. Coast and Harbor Institute, Inc. Rushy Marsh Pond Restoration Project. Report to the Conservation Division, Town of Barnstable. 2002. De Lima, Virginia, and Olimpio, J.C., 2984, Ground-water resources of the Mattapoisett River Valley, Plymouth County, Massachusetts: Summary for water-resource managers: U.S. Geological Survey Water-Resources Investigations Report 84-4023, 43 p. ENSR Inc. Long-term protection, maintenance alternatives for Beach Road Oak Bluffs and Edgartown, Martha’s Vineyard. Report to Massachusetts Highways, 2000. Gaines, A.G. A natural systems assessment of Sengekontacket POnd, Martha’s Vineyard: managing domestic wastewater at the coast. Marine Policy Center Woods Hole Oceanographic Institiution, Final Report. 1995. Giese, G.S., T.R. McSherry, and W.D. Spencer. Wellfleet Inner Harbor: 1989-1992, A Summary of Work (relating to hydrodynamics). Woods Hole Oceanographic Institution, Report to the Mini-Bay Program. 1994. Horsley & Witten, Inc. A baseline hydrodynamic and water quality investigation of the lower Herring River, Harwich, MA. Final Report to the Town of Harwich Herring River Watershed Study Committee, February 2000. Howes, B.L. and R.I. Samimy. Town of Yarmouth Estuaries Monitoring Program: Lewis Bay, Parkers River and Bass River Systems. Sampling and Analysis Plan for DEP, Final April 2004. Howes, B.L., T. Williams and M. Rasmussen. Bay Watchers II: Nutrient related water quality of Buzzards Bay embayments: a synthesis of BayWatchers monitoring 1992-1998. The Coalition for Buzzards Ba. 150pp, 1999. Olimpio, J.C., and de Lima, Virginia, 1984, Ground-water resources of the Mattapoisett River Valley, Plymouth County, Massachusetts: U.S. Geological Survey Water-Resources Investigations Report 84-4043, 83 p.

115
Porter, S., N.P. Millham and B.L. Howes. Quality Assurance Project Plan (QAPP) for the City of New Bedford/CZM-CPR Buttonwood Brook Stormwater Sampling Project. Final December 22, 2003. Roman, C.T and others. An evaluation of alternatives of estuarine restoration management: The Herring River Ecosystem (Cape Cod National Seashore). Center for Coastal and Environmenatl Studies, Rutgers University. Report to the National Park Service, 1987. Ruthven, T., S. Kelley, J. Cote, and J. Ramsey. May 2003. Hydrodynamic analysis of Slocums River and Little River, Dartmouth, MA. Final Report to DEP under the Massachusetts Watershed Initiative. Sterns and Wheler, Inc. Fecal Coliform Evaluation and Mitigation Planing for the Allens Harbor Watershed. Final Report to the Town of Harwich. May 2003. TetraTech. Report funded by DEP which includes hydrodynamic analysis of Lewis Bay and Parkers River. At present the MEP Technical Team does not have this report, but have been assured that it will be available through DEP when it is accepted by DEP. Williams, T. and B.L. Howes. Quality Assurance Project Plan for The Coalition for Buzzards Bay’s Citizens’ Water Quality Monitoring Program, “BayWatchers”. July 25, 2001.