Embed Size (px)
Citation preview
Massachusetts Development Finance Agency (A Component Unit of the Commonwealth of Massachusetts) Financial Statements issued in accordance with Government Auditing Standards Years Ended June 30, 2020 and 2019

Massachusetts Development Finance Agency (A Component Unit of the Commonwealth of Massachusetts) Index Years Ended June 30, 2020 and 2019
Page(s) Independent Auditors Report…………………………………………………….…………….…….1-2 Management’s Discussion and Analysis (unaudited)…………………………………….…….…..3-16 Financial Statements Statements of Net Position…………..…………………….……………………………………….….....17 Statements of Revenues, Expenses and Changes in Net Position...….……………………..………...…18 Statements of Cash Flows………..…………………………..….….…………………………...……19-20 Notes to the Financial Statements…………………..………………………………………………..21-62 Supplementary Information (unaudited) Statements of Departmental Net Position and Statements of Departmental Revenues, Expenses and Changes in Net Position as of June 30, 2020 and 2019……..………………………..……….…63-64
1
Independent Auditor’s Report
Board of Directors Massachusetts Development Finance Agency
Report on the Financial Statements We have audited the accompanying financial statements of the business-type activities of the Massachusetts Development Finance Agency (the Agency), a component unit of the Commonwealth of Massachusetts, as of and for the years ended June 30, 2020 and 2019, and the related notes to the financial statements, which collectively comprise the Agency’s basic financial statements as listed in the table of contents.
Management’s Responsibility for the Financial Statements Management is responsible for the preparation and fair presentation of these financial statements in accordance with accounting principles generally accepted in the United States of America; this includes the design, implementation and maintenance of internal control relevant to the preparation and fair presentation of financial statements that are free from material misstatement, whether due to fraud or error.
Auditor’s Responsibility Our responsibility is to express an opinion on these financial statements based on our audits. We conducted our audits in accordance with auditing standards generally accepted in the United States of America and the standards applicable to financial audits contained in Government Auditing Standards, issued by the Comptroller General of the United States. Those standards require that we plan and perform the audit to obtain reasonable assurance about whether the financial statements are free from material misstatement.
An audit involves performing procedures to obtain audit evidence about the amounts and disclosures in the financial statements. The procedures selected depend on the auditor’s judgment, including the assessment of the risks of material misstatement of the financial statements, whether due to fraud or error. In making those risk assessments, the auditor considers internal control relevant to the Agency’s preparation and fair presentation of the financial statements in order to design audit procedures that are appropriate in the circumstances, but not for the purpose of expressing an opinion on the effectiveness of the entity’s internal control. Accordingly, we express no such opinion. An audit also includes evaluating the appropriateness of accounting policies used and the reasonableness of significant accounting estimates made by management, as well as evaluating the overall presentation of the financial statements.
We believe that the audit evidence we have obtained is sufficient and appropriate to provide a basis for our audit opinions.

2
Opinions In our opinion, the financial statements referred to above present fairly, in all material respects, the financial position of the business-type activities of the Massachusetts Development Finance Agency as of June 30, 2020 and 2019, and the respective changes in financial position, and, where applicable, cash flows thereof for the years then ended in accordance with accounting principles generally accepted in the United States of America. Other Matters Required Supplementary Information Accounting principles generally accepted in the United States of America require that the required supplementary information such as management’s discussion and analysis on pages 3-16 be presented to supplement the basic financial statements. Such information, although not a part of the basic financial statements, is required by the Governmental Accounting Standards Board who considers it to be an essential part of financial reporting for placing the basic financial statements in an appropriate operational, economic, or historical context. We have applied certain limited procedures to the required supplementary information in accordance with auditing standards generally accepted in the United States of America, which consisted of inquiries of management about the methods of preparing the information and comparing the information for consistency with management’s responses to our inquiries, the basic financial statements, and other knowledge we obtained during our audit of the basic financial statements. We do not express an opinion or provide any assurance on the information because the limited procedures do not provide us with sufficient evidence to express an opinion or provide any assurance. Other Information Our audit was conducted for the purpose of forming opinions on the financial statements that collectively comprise the Agency’s basic financial statements. The Statements of Departmental Net Position and Statements of Departmental Revenues, Expenses and Changes in Net Position (the Statements) are presented for purposes of additional analysis and are not a required part of the basic financial statements. The Statements are the responsibility of management and were derived from and relate directly to the underlying accounting and other records used to prepare the basic financial statements. The Statements have not been subjected to the auditing procedures applied in the audit of the basic financial statements, and accordingly, we do not express an opinion or provide any assurance on them. Other Reporting Required by Government Auditing Standards In accordance with Government Auditing Standards, we have also issued our report dated November 30, 2020 on our consideration of the Agency's internal control over financial reporting and on our tests of its compliance with certain provisions of laws, regulations, contracts, and grant agreements and other matters. The purpose of that report is to describe the scope of our testing of internal control over financial reporting and compliance and the results of that testing, and not to provide an opinion on internal control over financial reporting or on compliance. That report is an integral part of an audit performed in accordance with Government Auditing Standards in considering the Agency’s internal control over financial reporting and compliance.
Boston, Massachusetts November 30, 2020

3
Massachusetts Development Finance Agency (A Component Unit of the Commonwealth of Massachusetts)
Management's Discussion and Analysis June 30, 2020 and 2019
(unaudited)
As management of the Massachusetts Development Finance Agency (the "Agency"), we offer the readers of the Agency's financial statements this narrative overview and analysis of the financial activities of the Agency for the fiscal years ended June 30, 2020 and 2019. This discussion and analysis should be read in conjunction with the accompanying financial statements. Unless otherwise indicated, years in this discussion refer to the fiscal year ended June 30.
The Agency was created on September 30, 1998 pursuant to Chapter 23G of Massachusetts General Laws (“MGL”) (Chapter 289 of the Acts of 1998). The Agency is a body corporate and politic and a public instrumentality and was created from the statutory merger of, and is the legal successor in all respects to, two previous existing instrumentalities, the Massachusetts Government Land Bank (created in 1975 under Chapter 212 of the Acts of 1975) and the Massachusetts Industrial Finance Agency (created in 1978 pursuant to Chapter 23A of the MGL) and is the legal successor to the Massachusetts Health and Educational Facilities Authority (created pursuant to Chapter 614 of the Acts of 1968). Other powers of the Agency are also set forth in MGL Chapter 40D (with respect to the issuance of tax-exempt bonds) and Chapter 498 of the Acts of 1993, as amended (with respect to the redevelopment of the former Fort Devens, a former federal military base).
The purpose of the Agency is to stimulate economic growth, increase employment, eradicate blight, promote prosperity and help build communities throughout the Commonwealth of Massachusetts (the "Commonwealth"). It does this through its powers to:
• Issue tax-exempt bonds for the benefit of certain industrial and commercial entities, educational, health care and housing facilities and public bodies;
• Make loans and provide credit to eligible borrowers in accordance with its public purpose;
• Aid public and private enterprises in the redevelopment of surplus federal and state property and other blighted, open, underdeveloped property, and;
• Administer specific statutory programs directed at certain economic development needs in the Commonwealth, such as, the Emerging Technology Program, the Cultural Facilities Program, Military Bond Bill Capital Projects Program, Site Readiness Program, redevelopment of the Belchertown State School and the Worcester State Hospital, Worcester Business Development Program, Transformative Development Initiative Program, the Brownfield Redevelopment Program, the Credit Enhancement of Charter School Facilities Program and the Massachusetts Export Finance Program.
The Agency is governed by an eleven member Board of Directors, nine of whom are appointed directly by the Governor and two of whom are public officials, or their designees, serving ex-officio. The Agency is considered a component unit of the Commonwealth for financial statement reporting purposes.

4
Using the Financial Statements The Agency’s annual report includes three basic financial statements: the statement of net position, the statement of revenues, expenses and changes in net position and the statement of cash flows. The basic financial statements are prepared on an accrual basis in accordance with accounting principles generally accepted in the United States of America (“GAAP”) as promulgated by the Governmental Accounting Standards Board (“GASB”). The Agency’s financial statements are reported as a special purpose business type entity. The statement of net position reports assets, liabilities and the difference between them as net position. Net position represents the residual interest in the Agency's assets, plus deferred outflows of resources after liabilities, less deferred inflows of resources and consists of three sections: net investment in capital assets; restricted and unrestricted. The net investment in capital assets component of net position consists of capital assets, net of accumulated depreciation, reduced by the outstanding balances of bonds, mortgages, notes, or other borrowings that are attributable to the acquisition, construction or improvement of those assets. Deferred outflows of resources and deferred inflows of resources that are attributable to the acquisition, construction, or improvement of those assets or related debt are included in this component of net position. Net position is reported as restricted when constraints are imposed by third parties or enabling legislation. The Agency's restricted net position is expendable. All other net position is unrestricted. Revenues and expenses are categorized as either operating or non-operating based upon management’s definition of the Agency’s principal ongoing operations. Financial Highlights
Statements of Net Position
June 30, 2020 June 30, 2019 June 30, 2018
AssetsCurrent assets 252,326,629$ 354,358,087$ 221,528,480$ Noncurrent assets 161,107,012 148,029,638 167,453,164 Assets held for sale 12,002,543 13,728,200 10,462,872 Capital assets (net of accumulated depreciation) 81,162,147 84,661,896 163,658,055
Total assets 506,598,331 600,777,821 563,102,571
LiabilitiesCurrent liabilities 48,814,635 135,411,050 43,542,242 Noncurrent liabilities 26,022,721 24,463,427 23,312,021
Total liabilities 74,837,356 159,874,477 66,854,263
Deferred Inflows of Resources - - 712,835 Total liabilities and deferred inflows of resources 74,837,356 159,874,477 67,567,098
Net PositionNet investment in capital assets 80,312,016 84,572,929 152,325,255 Restricted 169,718,561 169,205,922 168,894,792 Unrestricted 181,730,398 187,124,493 174,315,426
Total net position 431,760,975 440,903,344 495,535,473 Total liabilities, deferred inflows of resources and net position 506,598,331$ 600,777,821$ 563,102,571$

5
Assets The Agency’s current assets mainly consist of cash and cash equivalents, short-term investments, current portion of loans receivable, interest receivable and accounts receivable and other assets. The Agency’s noncurrent assets mainly consist of long-term cash and cash equivalents and investments, investment in joint ventures, and net loans receivable. Current assets decreased $102.0 million from 2019 to 2020 mainly due to a decrease in short-term investments. In fiscal year 2020, the Agency remitted $86.2 million of sales proceeds to the Commonwealth from the sale of two buildings in Boston, MA which occurred in fiscal year 2019. Noncurrent assets increased $13.1 million from 2019 to 2020 mainly due to a new loan fund and an increase in loans receivable. During the fiscal year, the Agency remitted $10.0 million to the Massachusetts Growth Capital Corporation’s (“MGCC”) Small Business Recovery Loan Fund established to assist small businesses impacted by the COVID-19 pandemic. The net amount is $5.0 million as the Agency applied a $5.0 million loss provision due to the nature of the fund. In addition, Agency loans receivables increased from 2019 to 2020 as there were more loan disbursements than loan repayments during the fiscal year. Current assets increased $132.8 million from 2018 to 2019 mainly due to a $122.1 million increase in short-term investments. The Agency was holding $98.5 million in short term investments as of the end of fiscal year 2019 due to the sale of two buildings in Boston, MA which were purchased in fiscal year 2017 for General Electric’s (GE) relocation of its headquarters. Most of these funds were remitted to the Commonwealth in fiscal year 2020. Noncurrent assets decreased $19.4 million from 2018 to 2019 mainly due to a decrease in noncurrent loans receivable. There were increased loan payoffs during fiscal year 2019 as compared to the prior year. The Agency’s operating cash accounts are held with TD Bank, N.A. The majority of the Devens Electric System Utility bond proceeds are held with the trustee at U.S. Bank. The Agency’s investments are held with PFM Asset Management (“PFM”) as the Agency’s investment advisor. The Agency’s cash, cash equivalents and investments are recorded at fair value and consist of guaranteed investment contracts, certificates of deposit, demand deposits, money market mutual funds, Short-Term Asset Reserve Fund (“STAR Fund”), and corporate and government obligations. The Agency is the administrator of the STAR Fund. The STAR Fund is a fiduciary investment fund that is managed like a money market fund, invests in short-term, high-quality securities and is available for the investment of bond proceeds of the Agency’s client institutions. PFM is the STAR Fund’s investment advisor. The STAR Fund is designed to preserve principal, provide daily liquidity, and earn a reasonable rate of return. The Agency’s holdings in the STAR Fund on the statements of net position as of June 30, 2020, 2019 and 2018, were approximately $87.2 million, $87.2 million and $65.4 million, respectively.

6
Loans receivable consist of loans issued by the Agency (net of the allowance for loan loss) primarily for the following economic development program types:
• Business loans • Construction loans • Permanent real estate loans • Equipment loans • Development loans • Emerging technology loans • Brownfields redevelopment loans • Export financing
As of June 30, 2020, 2019 and 2018, there were $81.7 million, $74.9 million and $93.4 million, respectively, of net loans receivable. Net loans receivable increased $6.8 million from 2019 to 2020. The increase was mainly due to more loan disbursements as compared to loan repayments during the fiscal year. The total loan disbursements were approximately $24.5 million as compared to $17.5 million in loan repayments, mainly within the General Operations Program and the Emerging Technology Program. The decrease of $18.5 million from 2018 to 2019 was mainly due to more loan repayments as compared to loan advances during fiscal year 2019. The total loan repayments were approximately $42.7 million versus loan advances of approximately $22.5 million, mainly within the General Operations Program. Investment in joint ventures includes the Agency’s equity investments in Hospital Hill, LLC, the Commonwealth Fund III LLC and fifteen New Markets Tax Credit (“NMTC”) entities as of June 30, 2020. The increase of approximately $0.6 million from 2019 to 2020 was mainly due to $0.8 million share of income, offset by $0.3 million of distributions, for all investments. The decrease of approximately $1.8 million from 2018 to 2019 was mainly related to net activity for the investment in Hospital Hill LLC. The Agency had a share of operating loss of $1.5 million mainly due to a loss on the sale of approximately 6 acres in Northampton, MA during fiscal year 2019. The Agency remitted $10.0 million to the MGCC’s Small Business Recovery Loan Fund to assist small businesses impacted by the COVID-19 pandemic. The Agency anticipates to be repaid as businesses repay loans to MGCC, but a $5.0 million loss provision was applied against the fund as there may be some businesses that will be unable to repay loans. Accounts receivable and other assets include outstanding amounts at year end related to utility usage at Devens, grants, NMTC management fees and reimbursement of expenses, Devens operating fees, real estate consulting services, lease receivables, prepaid insurance and other miscellaneous receivables. The changes from 2019 to 2020 and 2018 to 2019 were insignificant. Due from the Commonwealth represents amounts owed for grant reimbursements or capital activity at year end. The decrease of $4.2 million from 2019 to 2020 is mainly related to decreased reimbursements outstanding for all programs at year end. The amounts were consistent from 2018 to 2019.
7
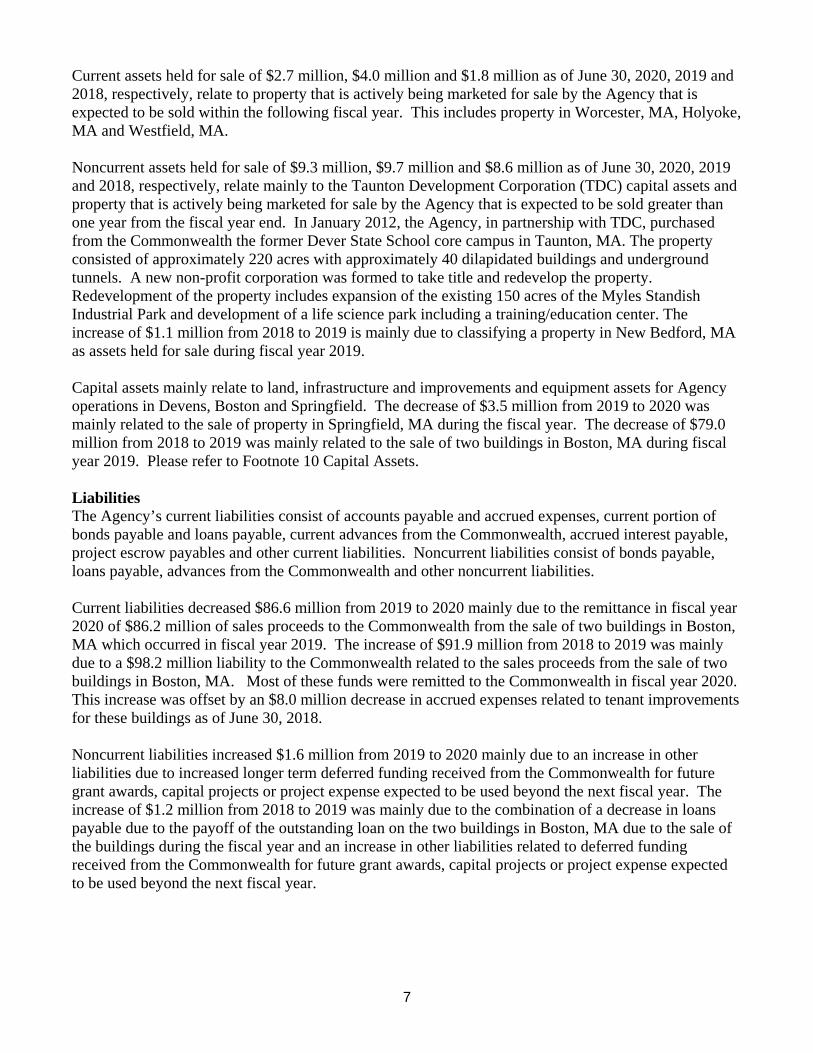
Current assets held for sale of $2.7 million, $4.0 million and $1.8 million as of June 30, 2020, 2019 and 2018, respectively, relate to property that is actively being marketed for sale by the Agency that is expected to be sold within the following fiscal year. This includes property in Worcester, MA, Holyoke, MA and Westfield, MA. Noncurrent assets held for sale of $9.3 million, $9.7 million and $8.6 million as of June 30, 2020, 2019 and 2018, respectively, relate mainly to the Taunton Development Corporation (TDC) capital assets and property that is actively being marketed for sale by the Agency that is expected to be sold greater than one year from the fiscal year end. In January 2012, the Agency, in partnership with TDC, purchased from the Commonwealth the former Dever State School core campus in Taunton, MA. The property consisted of approximately 220 acres with approximately 40 dilapidated buildings and underground tunnels. A new non-profit corporation was formed to take title and redevelop the property. Redevelopment of the property includes expansion of the existing 150 acres of the Myles Standish Industrial Park and development of a life science park including a training/education center. The increase of $1.1 million from 2018 to 2019 is mainly due to classifying a property in New Bedford, MA as assets held for sale during fiscal year 2019. Capital assets mainly relate to land, infrastructure and improvements and equipment assets for Agency operations in Devens, Boston and Springfield. The decrease of $3.5 million from 2019 to 2020 was mainly related to the sale of property in Springfield, MA during the fiscal year. The decrease of $79.0 million from 2018 to 2019 was mainly related to the sale of two buildings in Boston, MA during fiscal year 2019. Please refer to Footnote 10 Capital Assets. Liabilities The Agency’s current liabilities consist of accounts payable and accrued expenses, current portion of bonds payable and loans payable, current advances from the Commonwealth, accrued interest payable, project escrow payables and other current liabilities. Noncurrent liabilities consist of bonds payable, loans payable, advances from the Commonwealth and other noncurrent liabilities. Current liabilities decreased $86.6 million from 2019 to 2020 mainly due to the remittance in fiscal year 2020 of $86.2 million of sales proceeds to the Commonwealth from the sale of two buildings in Boston, MA which occurred in fiscal year 2019. The increase of $91.9 million from 2018 to 2019 was mainly due to a $98.2 million liability to the Commonwealth related to the sales proceeds from the sale of two buildings in Boston, MA. Most of these funds were remitted to the Commonwealth in fiscal year 2020. This increase was offset by an $8.0 million decrease in accrued expenses related to tenant improvements for these buildings as of June 30, 2018. Noncurrent liabilities increased $1.6 million from 2019 to 2020 mainly due to an increase in other liabilities due to increased longer term deferred funding received from the Commonwealth for future grant awards, capital projects or project expense expected to be used beyond the next fiscal year. The increase of $1.2 million from 2018 to 2019 was mainly due to the combination of a decrease in loans payable due to the payoff of the outstanding loan on the two buildings in Boston, MA due to the sale of the buildings during the fiscal year and an increase in other liabilities related to deferred funding received from the Commonwealth for future grant awards, capital projects or project expense expected to be used beyond the next fiscal year.
8
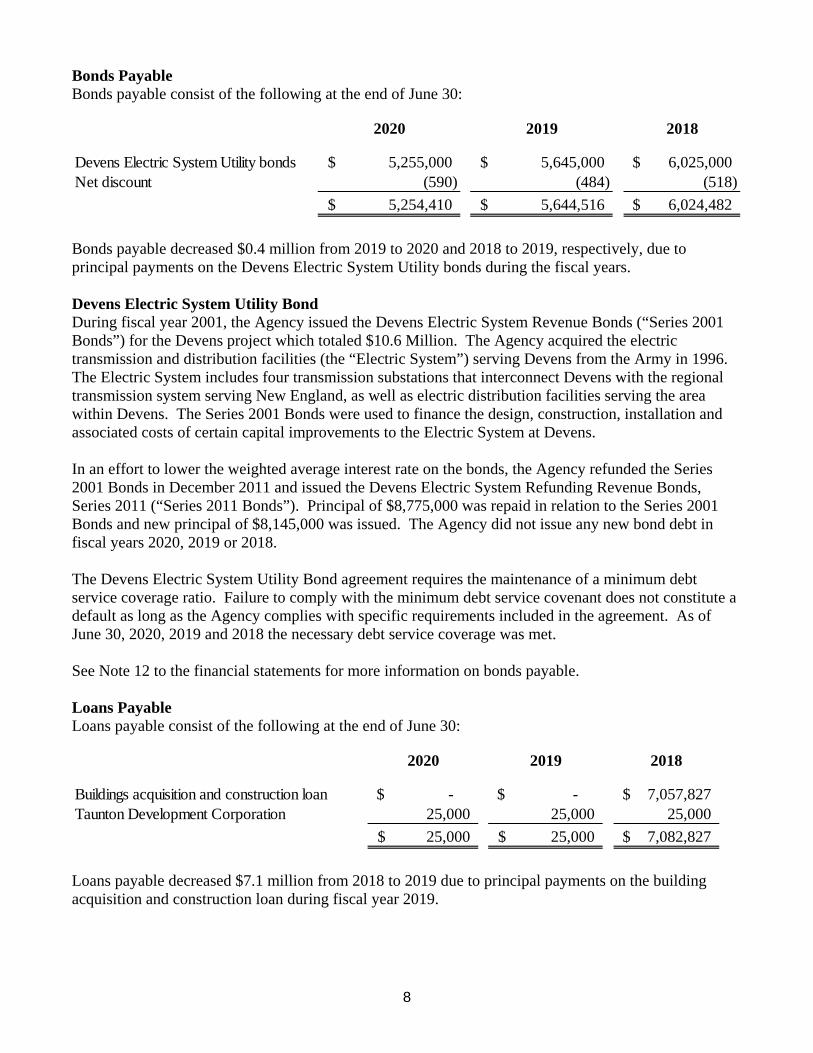
Bonds Payable Bonds payable consist of the following at the end of June 30:
Bonds payable decreased $0.4 million from 2019 to 2020 and 2018 to 2019, respectively, due to principal payments on the Devens Electric System Utility bonds during the fiscal years.
Devens Electric System Utility Bond During fiscal year 2001, the Agency issued the Devens Electric System Revenue Bonds (“Series 2001 Bonds”) for the Devens project which totaled $10.6 Million. The Agency acquired the electric transmission and distribution facilities (the “Electric System”) serving Devens from the Army in 1996. The Electric System includes four transmission substations that interconnect Devens with the regional transmission system serving New England, as well as electric distribution facilities serving the area within Devens. The Series 2001 Bonds were used to finance the design, construction, installation and associated costs of certain capital improvements to the Electric System at Devens.
In an effort to lower the weighted average interest rate on the bonds, the Agency refunded the Series 2001 Bonds in December 2011 and issued the Devens Electric System Refunding Revenue Bonds, Series 2011 (“Series 2011 Bonds”). Principal of $8,775,000 was repaid in relation to the Series 2001 Bonds and new principal of $8,145,000 was issued. The Agency did not issue any new bond debt in fiscal years 2020, 2019 or 2018.
The Devens Electric System Utility Bond agreement requires the maintenance of a minimum debt service coverage ratio. Failure to comply with the minimum debt service covenant does not constitute a default as long as the Agency complies with specific requirements included in the agreement. As of June 30, 2020, 2019 and 2018 the necessary debt service coverage was met.
See Note 12 to the financial statements for more information on bonds payable.
Loans Payable Loans payable consist of the following at the end of June 30:
Loans payable decreased $7.1 million from 2018 to 2019 due to principal payments on the building acquisition and construction loan during fiscal year 2019.
2020 2019 2018
Devens Electric System Utility bonds 5,255,000$ 5,645,000$ 6,025,000$ Net discount (590) (484) (518)
5,254,410$ 5,644,516$ 6,024,482$
2020 2019 2018
Buildings acquisition and construction loan -$ -$ 7,057,827$ Taunton Development Corporation 25,000 25,000 25,000
25,000$ 25,000$ 7,082,827$

9
Net position decreased $9.1 million from 2019 to 2020 mainly due to a combination of $23.5 million operating loss and $17.4 million of grant award disbursements, offset by an $18.8 million contribution from the Commonwealth and $4.9 million in capital grant revenue.
On December 14, 2016, Citizens Bank, N.A. (“Citizens”) issued a $90.0 million line of credit to the Agency for the acquisition and redevelopment of two buildings in Boston, MA in which General Electric (“GE”) would relocate its headquarters and lease the buildings under a twenty year lease. The Agency also received $125.0 million of Massworks grant commitments from the Commonwealth in support of the acquisition and redevelopment of the buildings.
The Citizens construction mortgage required the maintenance of a minimum cash liquidity balance as of June 30 and December 31 through June 30, 2020. At June 30, 2018, the necessary minimum cash liquidity was met. The building acquisition and construction loan was repaid during fiscal year 2019 due to the sale of the two buildings in Boston, MA. See Note 13 to the financial statements for more information on loans payable.
Advances from the Commonwealth Advances from the Commonwealth consist of the following at the end of June 30:
2020 2019 2018
Massachusetts Department of Environmental Protection $ 7,375,057 $ 7,934,503 $ 8,477,352
Massachusetts Department of Environmental Protection The Massachusetts Department of Environmental Protection approved loans to the Agency to construct a wastewater treatment facility at Devens. In addition, The Massachusetts Water Abatement Trust currently known as The Massachusetts Clean Water Trust (“MCWT”), issued loans to the Agency. These loans will be paid back to the trust through revenues generated from wastewater processing from Devens and surrounding communities. The Agency and the Commonwealth have entered into a contract providing that the Commonwealth shall pay contract assistance on behalf of the Agency with respect to partial debt service on this loan.
The MCWT loan agreement requires the maintenance of an adequate annual debt service coverage ratio. As of June 30, 2020, 2019 and 2018, the necessary debt service coverage was met.
Net Position Net position represents the residual interest in the Agency’s assets plus deferred outflows of resources after all liabilities plus deferred inflows of resources are deducted. The Agency’s net position was as follows at June 30: 2020 2019 2018
Net investment in capital assets 80,312,016$ 84,572,929$ 152,325,255$ Restricted 169,718,561 169,205,922 168,894,792 Unrestricted 181,730,398 187,124,493 174,315,426
431,760,975$ 440,903,344$ 495,535,473$

10
Net position decreased $54.6 million from 2018 to 2019 mainly due to a combination of an $18.7 million operating loss, $98.2 million disbursement to the Commonwealth and $30.4 million of grant award disbursements, offset by a $31.4 million contribution from the Commonwealth and $26.9 million in capital grant revenue. Revenues and Expenses
Operating Revenues
Operating revenues decreased $2.0 million from 2019 to 2020 due to the combination of decreases of $0.9 million in Devens operating revenue and $0.8 million of interest and other loan income, offset by an increase of $0.8 million in gain on share of joint ventures. Operating revenues decreased $0.1 million from 2018 to 2019 due to the combination of increases of $1.8 million in Devens operating income and $1.2 million in other operating income, offset by a $3.4 million decrease in bond issuance and New Market Tax Credit fees. Devens operating revenue, which includes utility income and real estate taxes, are an important component of the Agency’s operating revenue. The Agency owns the utility systems at Devens and provides electricity, natural gas, water and sewer services to the Devens community. The utility staff works in conjunction with operations and maintenance contractors to maintain, upgrade and expand the utility systems. The current systems consist of five electrical substations, approximately 73 miles of distribution power lines, three miles of transmission power lines, four wells and pumping stations, approximately 50 miles of water line, 32 miles of natural gas pipeline, a wastewater treatment facility, six sewer lift stations and 50 miles of sewer. Devens operating revenue decreased $0.9 million from 2019 to 2020 mainly due to decreased electric utility income due to lower electric sales and decreased electric rates in fiscal year 2020. The increase of $1.8 million from 2018 to 2019 was mainly due to
2020 2019 2018
Operating revenues 57,960,941$ 59,947,736$ 60,026,400$ Operating expenses (81,462,037) (78,601,041) (78,970,926) Operating loss (23,501,096) (18,653,305) (18,944,526)
Nonoperating revenues, net 8,055,129 7,619,930 1,822,697 Capital contributions (distributions), net 6,303,598 (70,383,875) 35,273,720 Special item - 26,785,121 - (Decrease) increase in net position (9,142,369)$ (54,632,129)$ 18,151,891$
2020 2019 2018
Devens operating revenue 40,045,330$ 40,939,105$ 39,180,807$ Interest and other loan income 4,928,317 5,771,817 5,720,039 Bond issuance and New Markets Tax Credit fees 8,097,194 8,121,071 11,486,378 Other 4,074,443 4,575,533 3,424,487 Gain on share of joint ventures 815,657 - 214,689 Gain on sale of real estate, net - 540,210 -
57,960,941$ 59,947,736$ 60,026,400$

11
increased commercial real estate tax income as a result of higher assessed property values and increased electric income due to increased usage by a large commercial customer. Interest and other loan income represents income related to outstanding loans issued by the Agency. There was a decrease of $0.8 million from 2019 to 2020 mainly due to decreased interest income collections for the General Operations Program and decreased interest rate swap payments received due to the payoff of the interest rate swap in fiscal year 2019. The amounts were consistent from 2018 to 2019. Bond issuance fees and NMTC fees represent revenue generated by the Agency as a conduit issuer of taxable and tax-exempt bonds or fees related to the allocation of federal New Markets Tax Credits. The revenues were consistent from 2019 to 2020, but there was an increase of $0.9 million in bond issuance fees due to more bond closings during fiscal year 2020, offset by a decrease of $0.8 million in NMTC issuance fees as there were no new issuances during fiscal year 2020. This revenue decreased $3.4 million from 2018 to 2019 mainly due to decreased bond issuance fees earned due to decreased bond closings during the fiscal year as compared to fiscal year 2018. Other operating income mainly consists of real estate advisory service fees and lease income for leased property in Worcester, Springfield and Devens and other miscellaneous operating revenues. The $0.5 million decrease from 2019 to 2020 was mainly due to the fact that during fiscal year 2019 the Agency received reimbursements for legal fees related to lending and donated water and sewer line to the utility systems. The $1.2 million increase from 2018 to 2019 was mainly due to increased advisory services, reimbursed legal fees related to lending activity and donated water and sewer lines to the utility systems. The gain on share of joint ventures represents the Agency’s share of operating gains on the Agency’s joint ventures. The gain on share of joint ventures in 2020 was mainly related to a $0.7 million gain on the Commonwealth Fund III LLC investment. The gain on share of joint ventures in 2018 is mainly the combination of a $0.4 million gain related to the Commonwealth Fund III LLC investment, offset by a $0.2 million loss related to the Hospital Hill LLC investment during the fiscal year. The gain on sale of real estate, net of $0.5 million in fiscal year 2019, was a combination of the recognition of the gains on sale of properties sold in prior fiscal years for which the recognition of the sales had been deferred due to repurchase and future commitment agreements, offset by a loss on sale for a fiscal year 2019 property sale. The deferred sales had gross proceeds of $0.8 million, offset by $0.1 million costs of sale, for net gains of $0.7 million. These gains were offset by a loss on sale related to the sale of property in Holyoke, MA during fiscal year 2019. This sale had minimal gross proceeds, offset by $0.3 million costs of sale, for a net loss of $0.3 million.
12
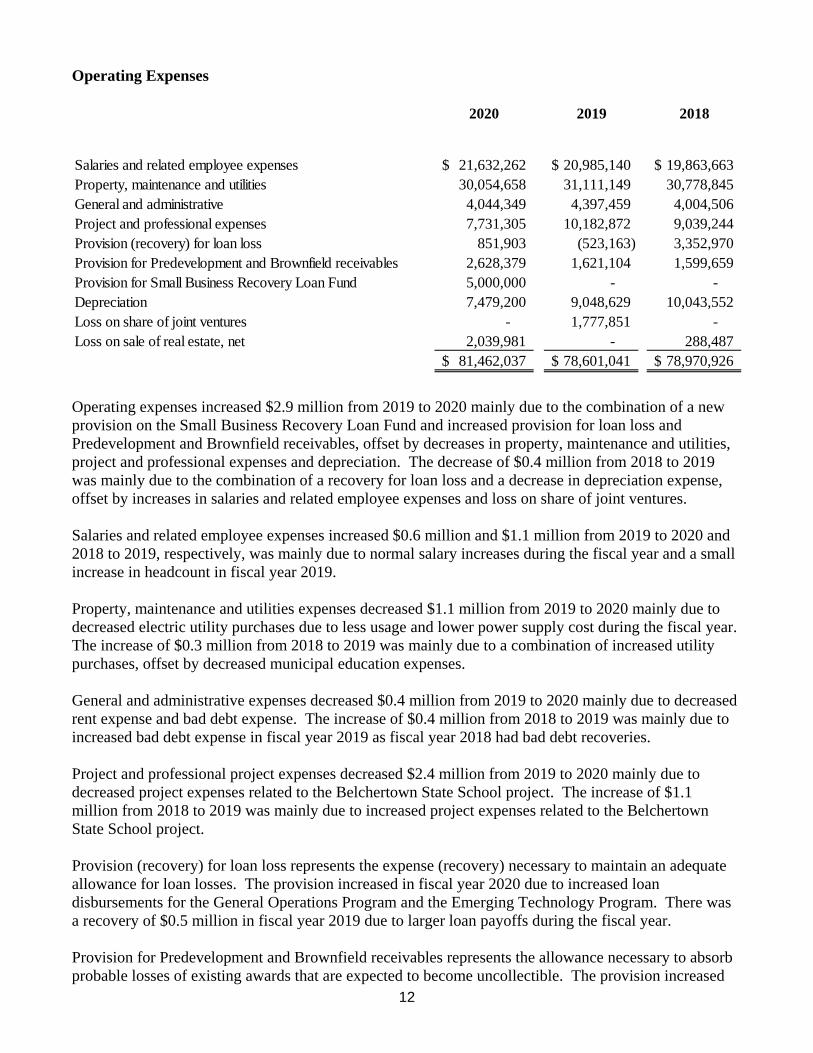
Operating Expenses
Operating expenses increased $2.9 million from 2019 to 2020 mainly due to the combination of a new provision on the Small Business Recovery Loan Fund and increased provision for loan loss and Predevelopment and Brownfield receivables, offset by decreases in property, maintenance and utilities, project and professional expenses and depreciation. The decrease of $0.4 million from 2018 to 2019 was mainly due to the combination of a recovery for loan loss and a decrease in depreciation expense, offset by increases in salaries and related employee expenses and loss on share of joint ventures. Salaries and related employee expenses increased $0.6 million and $1.1 million from 2019 to 2020 and 2018 to 2019, respectively, was mainly due to normal salary increases during the fiscal year and a small increase in headcount in fiscal year 2019. Property, maintenance and utilities expenses decreased $1.1 million from 2019 to 2020 mainly due to decreased electric utility purchases due to less usage and lower power supply cost during the fiscal year. The increase of $0.3 million from 2018 to 2019 was mainly due to a combination of increased utility purchases, offset by decreased municipal education expenses. General and administrative expenses decreased $0.4 million from 2019 to 2020 mainly due to decreased rent expense and bad debt expense. The increase of $0.4 million from 2018 to 2019 was mainly due to increased bad debt expense in fiscal year 2019 as fiscal year 2018 had bad debt recoveries. Project and professional project expenses decreased $2.4 million from 2019 to 2020 mainly due to decreased project expenses related to the Belchertown State School project. The increase of $1.1 million from 2018 to 2019 was mainly due to increased project expenses related to the Belchertown State School project. Provision (recovery) for loan loss represents the expense (recovery) necessary to maintain an adequate allowance for loan losses. The provision increased in fiscal year 2020 due to increased loan disbursements for the General Operations Program and the Emerging Technology Program. There was a recovery of $0.5 million in fiscal year 2019 due to larger loan payoffs during the fiscal year. Provision for Predevelopment and Brownfield receivables represents the allowance necessary to absorb probable losses of existing awards that are expected to become uncollectible. The provision increased
2020 2019 2018
Salaries and related employee expenses 21,632,262$ 20,985,140$ 19,863,663$ Property, maintenance and utilities 30,054,658 31,111,149 30,778,845 General and administrative 4,044,349 4,397,459 4,004,506 Project and professional expenses 7,731,305 10,182,872 9,039,244 Provision (recovery) for loan loss 851,903 (523,163) 3,352,970 Provision for Predevelopment and Brownfield receivables 2,628,379 1,621,104 1,599,659 Provision for Small Business Recovery Loan Fund 5,000,000 - - Depreciation 7,479,200 9,048,629 10,043,552 Loss on share of joint ventures - 1,777,851 - Loss on sale of real estate, net 2,039,981 - 288,487
81,462,037$ 78,601,041$ 78,970,926$

13
$1.0 million from 2019 to 2020 due to increased disbursements during fiscal year 2020. The provision was consistent from 2018 to 2019. Depreciation decreased $1.6 million from 2019 to 2020 and $1.0 million from 2018 to 2019, mainly due to the sale of the two buildings in Boston, MA as the buildings were moved to assets held for sale and depreciation was stopped in December 2018. Fiscal year 2019 had six months of depreciation related to these buildings versus zero depreciation in fiscal year 2020. Provision for Small Business Recovery Loan Fund was recognized on the Small Business Recovery Loan Fund in fiscal year 2020. Projections related to the fund as of June 30, 2020 demonstrated that it was not probable that the current invested balance would be recoverable from distributions from future loan repayments due to the nature of the unsecured high risk loans that MGCC is providing to small businesses. Therefore, the Agency recognized a $5.0 million provision loss in fiscal year 2020 to write down the amount expected to be recovered through its net cash flow from the fund. Loss on share of joint ventures represents the Agency’s share of operating losses on the Agency’s joint ventures. The loss on share of joint ventures in 2019 was mainly related to the $1.5 million share of loss for the Hospital Hill LLC investment during the fiscal year. The loss on sale of real estate, net of $2.0 million in fiscal year 2020 was mainly related to the sale of a building in Springfield, MA during the fiscal year. This sale had gross proceeds of $0, offset by $2.4 million costs of sale, for a net loss of $2.4 million. The loss on sale of real estate, net of $0.3 million in fiscal year 2018 was mainly due to the sale of approximately 2.3 acres in Taunton during the fiscal year. This sale had gross proceeds of $0.4 million, offset by $0.8 million costs of sale, for a net loss of $0.4 million. Non-operating Revenues (Expenses)
Non-operating revenues (expenses) consists mainly of investment income, contract assistance, interest expense, amortization of bond discount, net, financing costs and other. Non-operating revenues, net was consistent from 2019 to 2020. The increase of $5.8 million from 2018 to 2019 was mainly due to increased investment income during fiscal year 2019. Investment income increased $0.3 million from 2019 to 2020 mainly due to higher investment balances as compared to fiscal year 2019. The increase of $5.1 million from 2018 to 2019 was mainly due to higher interest rates and higher average investment balances in fiscal year 2019.
2020 2019 2018
Investment income 8,279,133$ 7,947,778$ 2,840,214$ Contract assistance 368,857 382,408 397,049 Interest expense (591,778) (636,188) (1,320,821) Amortization of bond discount, net (1,083) (1,224) (1,381) Financing costs - (72,844) (92,364)
8,055,129$ 7,619,930$ 1,822,697$
14
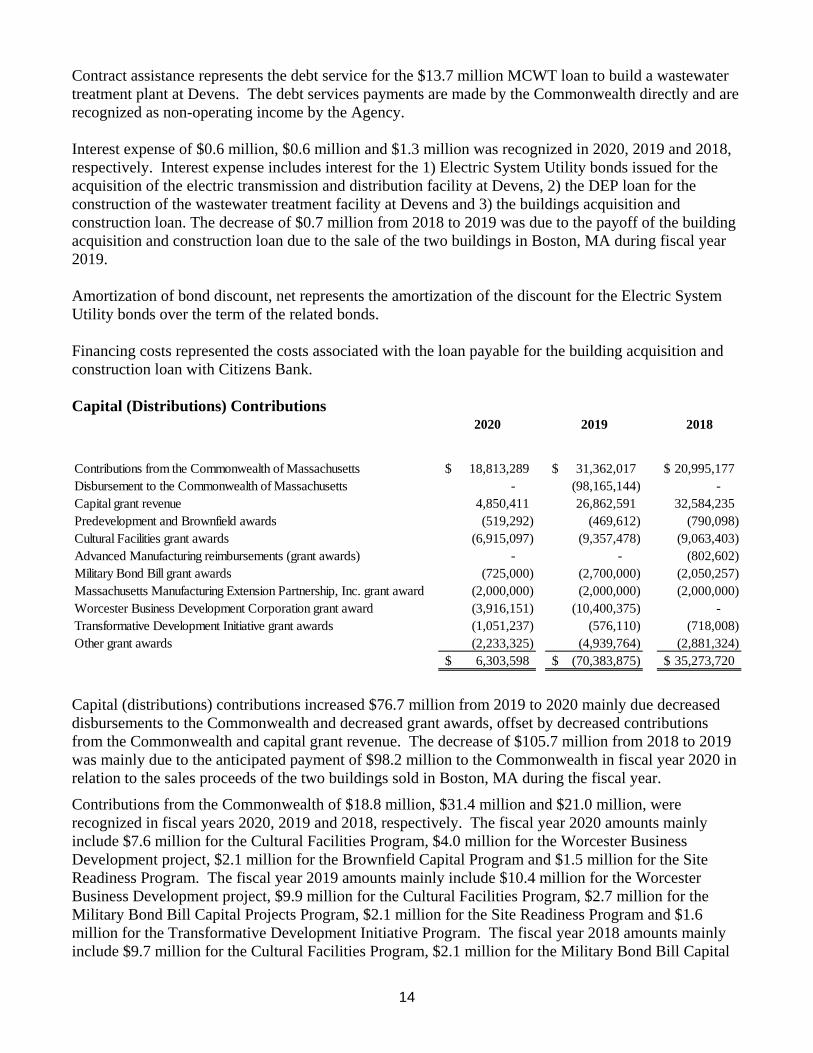
Contract assistance represents the debt service for the $13.7 million MCWT loan to build a wastewater treatment plant at Devens. The debt services payments are made by the Commonwealth directly and are recognized as non-operating income by the Agency. Interest expense of $0.6 million, $0.6 million and $1.3 million was recognized in 2020, 2019 and 2018, respectively. Interest expense includes interest for the 1) Electric System Utility bonds issued for the acquisition of the electric transmission and distribution facility at Devens, 2) the DEP loan for the construction of the wastewater treatment facility at Devens and 3) the buildings acquisition and construction loan. The decrease of $0.7 million from 2018 to 2019 was due to the payoff of the building acquisition and construction loan due to the sale of the two buildings in Boston, MA during fiscal year 2019. Amortization of bond discount, net represents the amortization of the discount for the Electric System Utility bonds over the term of the related bonds. Financing costs represented the costs associated with the loan payable for the building acquisition and construction loan with Citizens Bank. Capital (Distributions) Contributions
Capital (distributions) contributions increased $76.7 million from 2019 to 2020 mainly due decreased disbursements to the Commonwealth and decreased grant awards, offset by decreased contributions from the Commonwealth and capital grant revenue. The decrease of $105.7 million from 2018 to 2019 was mainly due to the anticipated payment of $98.2 million to the Commonwealth in fiscal year 2020 in relation to the sales proceeds of the two buildings sold in Boston, MA during the fiscal year. Contributions from the Commonwealth of $18.8 million, $31.4 million and $21.0 million, were recognized in fiscal years 2020, 2019 and 2018, respectively. The fiscal year 2020 amounts mainly include $7.6 million for the Cultural Facilities Program, $4.0 million for the Worcester Business Development project, $2.1 million for the Brownfield Capital Program and $1.5 million for the Site Readiness Program. The fiscal year 2019 amounts mainly include $10.4 million for the Worcester Business Development project, $9.9 million for the Cultural Facilities Program, $2.7 million for the Military Bond Bill Capital Projects Program, $2.1 million for the Site Readiness Program and $1.6 million for the Transformative Development Initiative Program. The fiscal year 2018 amounts mainly include $9.7 million for the Cultural Facilities Program, $2.1 million for the Military Bond Bill Capital
2020 2019 2018
Contributions from the Commonwealth of Massachusetts 18,813,289$ 31,362,017$ 20,995,177$ Disbursement to the Commonwealth of Massachusetts - (98,165,144) - Capital grant revenue 4,850,411 26,862,591 32,584,235 Predevelopment and Brownfield awards (519,292) (469,612) (790,098) Cultural Facilities grant awards (6,915,097) (9,357,478) (9,063,403) Advanced Manufacturing reimbursements (grant awards) - - (802,602) Military Bond Bill grant awards (725,000) (2,700,000) (2,050,257) Massachusetts Manufacturing Extension Partnership, Inc. grant award (2,000,000) (2,000,000) (2,000,000) Worcester Business Development Corporation grant award (3,916,151) (10,400,375) - Transformative Development Initiative grant awards (1,051,237) (576,110) (718,008) Other grant awards (2,233,325) (4,939,764) (2,881,324)
6,303,598$ (70,383,875)$ 35,273,720$
15
Projects Program, $1.5 million for the Transformative Development Initiative Program, $1.4 million for the Site Readiness Program and $1.4 million for the redevelopment of the Belchertown State School. Disbursement to the Commonwealth of $98.2 million in fiscal year 2019 was the accrual of an anticipated payment of $98.2 million to the Commonwealth in fiscal year 2020 in relation to the sales proceeds of the two buildings sold in Boston, MA during the fiscal year. During fiscal year 2020, $86.2 million was remitted to the Commonwealth; the remaining $12.0 million is now expected to be remitted during fiscal year 2021. Capital grant revenue of approximately $4.9 million, $26.9 million and $32.6 million was recognized in fiscal years 2020, 2019 and 2018, respectively. The fiscal year 2020 amount was mainly related to the $3.3 million recognition of Credit Enhancement of Charter School Facilities guarantee program funding due to the issuance of new guarantees during the fiscal year. The fiscal year 2019 amount was mainly related to $16.7 million of Massworks funding for the redevelopment of two buildings in Boston, MA, the $6.8 million recognition of Credit Enhancement of Charter School Facilities guarantee program funding due to the issuance of new guarantees during the fiscal year and $2.8 million of Massworks funding for the Belchertown State Hospital redevelopment. The fiscal year 2018 amount was mainly related to Massworks funding received for the redevelopment of two buildings in Boston, MA. The Agency disbursed $6.9 million, $9.4 million and $9.1 million in fiscal years 2020, 2019 and 2018, respectively, to various recipients in support of acquisition, design, construction, repair, renovation, rehabilitation or capital improvements or deferred maintenance of a cultural facility. The Agency disbursed $0.8 million in fiscal year 2018 for the purpose of facilitating growth and competitiveness in the field of manufacturing. The Agency disbursed $0.7 million, $2.7 million and $2.1 million in fiscal years 2020, 2019 and 2018, respectively, to various recipients in support of military installation development projects across the Commonwealth. The Agency disbursed $2.0 million to the Massachusetts Manufacturing Extension Partnership, Inc. in fiscal years 2020, 2019 and 2018, respectively, in support of its mission to invest in the Massachusetts manufacturing economy. The Agency disbursed $3.9 million and $10.4 million to the Worcester Business Development Corporation in fiscal years 2020 and 2019, respectively, in support of the redevelopment of the Worcester State Hospital in Worcester, MA. The Agency disbursed $1.1 million, $0.6 million and $0.7 million in fiscal years 2020, 2019 and 2018, respectively, to various recipients in support of the redevelopment of Gateway cities in the Commonwealth. Special Item During fiscal year 2019, the Agency sold two buildings in Boston, MA relating to the GE transaction that resulted in gross sales proceeds of $98.2 million and a net gain of $26.8 million. These buildings were originally purchased in December 2016 for a purchase price of $57.4 million for GE to move its headquarters to the Commonwealth. During fiscal 2019, GE scaled backed plans to expand this headquarters site, and decided to sell the parcel of land on which they had originally intended to build a main headquarters building. The Commonwealth and the Agency decided to package the two building with the GE owned property to create an attractive real estate opportunity. The gross proceeds of $98.2
16
million will be reimbursed to the Commonwealth as the Commonwealth funded the original purchase price of $57.4 million and subsequent redevelopment costs of $20.1 million. As a result of this unusual transaction, with the Agency being obligated to return some or all of the sale proceeds to the Commonwealth, this was noted as a special item in fiscal year 2019. Requests for Information This financial report is designed to provide a general overview of the Agency’s finances for all those with an interest in the government’s finances. Questions concerning any of the information provided in this report or requests for additional financial information should be addressed to the Office of the Chief Financial Officer, Massachusetts Development Finance Agency, 99 High Street, 11th Floor, Boston, MA, 02110.

17
Massachusetts Development Finance Agency (A Component Unit of the Commonwealth of Massachusetts) Statements of Net Position June 30, 2020 and 2019
2020 2019
AssetsCurrent assets Cash and cash equivalents 38,946,743$ 34,758,404$ Cash and cash equivalents-restricted for use 95,559,471 96,312,821 Investments 89,417,343 193,170,194 Loans receivable, net 16,207,690 13,435,836 Interest receivable 786,419 974,940 Accounts receivable and other assets (net of allowance of $639,548 and $474,928 at June 30, 2020 and 2019) 8,162,987 8,680,099 Due from the Commonwealth of Massachusetts 1,112,069 5,277,064 Project escrow deposits 2,133,907 1,748,729 Assets held for sale 2,673,578 4,014,319 Total current assets 255,000,207 358,372,406 Noncurrent assets Cash and cash equivalents restricted for capital use 12,411,496 12,020,134 Cash and cash equivalents-restricted for use 4,449,232 4,432,014 Investments 67,288,942 64,255,027 Investment in joint ventures 5,525,052 4,974,332 Small Business Recovery Loan Fund (net of allowance of $5,000,000 as of June 30, 2020) 5,000,000 - Loans receivable (net of allowance of $9,948,470 and $9,802,777 at June 30, 2020 and 2019, respectively) 65,515,360 61,488,731 Predevelopment and Brownfield receivables (net of allowance of $11,618,987 and $9,233,589 at June 30, 2020 and 2019, respectively) 916,930 859,400 Assets held for sale 9,328,965 9,713,881 Capital assets, net 81,162,147 84,661,896 Total noncurrent assets 251,598,124 242,405,415 Total assets 506,598,331$ 600,777,821$
Liabilities and Net PositionCurrent liabilities Accounts payable and accrued expenses 9,990,618$ 10,259,414$ Current portion of bonds payable 400,000 390,000 Current portion of loans payable 25,000 - Advances from the Commonwealth of Massachusetts 580,195 559,449 Accrued interest payable 216,266 231,145 Project escrow payable 2,324,464 1,930,634 Due to the Commonwealth of Massachusetts 11,965,144 98,165,144 Other liabilit ies 23,312,948 23,875,264 Total current liabilit ies 48,814,635 135,411,050 Noncurrent liabilities Bonds payable 4,854,410 5,254,516 Loans payable - 25,000 Advances from the Commonwealth of Massachusetts 6,794,862 7,375,054 Other liabilit ies 14,373,449 11,808,857 Total noncurrent liabilit ies 26,022,721 24,463,427 Total liabilit ies 74,837,356 159,874,477
Net position Net investment in capital assets 80,312,016 84,572,929 Restricted 169,718,561 169,205,922 Unrestricted 181,730,398 187,124,493 Total net position 431,760,975 440,903,344 Total liabilit ies and net position 506,598,331$ 600,777,821$
The accompanying notes are an integral part of these financial statements.

18
Massachusetts Development Finance Agency (A Component Unit of the Commonwealth of Massachusetts) Statements of Revenues, Expenses and Changes in Net Position Year Ended June 30, 2020 and 2019
2020 2019
RevenuesOperating revenues Devens operating revenue 40,045,330$ 40,939,105$ Interest and other loan income 4,928,317 5,771,817 Bond issuance and New Markets Tax Credit fees 8,097,194 8,121,071 Other 4,074,443 4,575,533 Gain on sale of real estate, net - 540,210 Gain on share of joint ventures 815,657 - Total operating revenues 57,960,941 59,947,736
ExpensesOperating expenses Salaries and related employee expenses 21,632,262 20,985,140 Property, maintenance and utilities 30,054,658 31,111,149 General and administrative 4,044,349 4,397,459 Project and professional expenses 7,731,305 10,182,872 Provision for (recovery of) loan loss 851,903 (523,163) Provision for Predevelopment and Brownfield receivables 2,628,379 1,621,104 Provision for Small Business Recovery Loan Fund 5,000,000 - Depreciation 7,479,200 9,048,629 Loss on share of joint ventures - 1,777,851 Loss on sale of real estate, net 2,039,981 - Total operating expenses 81,462,037 78,601,041
Operating loss (23,501,096) (18,653,305) Nonoperating revenues (expenses) Investment income 8,279,133 7,947,778 Contract assistance 368,857 382,408 Interest expense (591,778) (636,188) Amortization of bond discount, net (1,083) (1,224) Financing costs - (72,844) Nonoperating revenues, net 8,055,129 7,619,930
Loss before capital contributions (distributions) (15,445,967) (11,033,375)
Capital contributions (distributions) Contributions from the Commonwealth of Massachusetts 18,813,289 31,362,017 Disbursement to the Commonwealth of Massachusetts - (98,165,144) Capital grant revenue 4,850,411 26,862,591 Predevelopment and Brownfield grant awards (519,292) (469,612) Cultural Facilities grant awards (6,915,097) (9,357,478) Military Bond Bill grant awards (725,000) (2,700,000) Massachusetts Manufacturing Extension Partnership, Inc. grant award (2,000,000) (2,000,000) Worcester Business Development Corporation grant award (3,916,151) (10,400,375) Transformative Development Initiative grant awards (1,051,237) (576,110) Other grant awards (2,233,325) (4,939,764) Total capital contributions (distributions), net 6,303,598 (70,383,875)
Special item Gain on sale of capital asset - 26,785,121 Decrease in net position (9,142,369) (54,632,129) Net position Net position - beginning of year 440,903,344 495,535,473 Net position - end of year 431,760,975$ 440,903,344$
The accompanying notes are an integral part of these financial statements.

19
Massachusetts Development Finance Agency (A Component Unit of the Commonwealth of Massachusetts) Statements of Cash Flows Year Ended June 30, 2020 and 2019
2020 2019
Cash flows from operating activitiesReceipts from interest on loans 4,776,899$ 5,574,351$ Receipts from Devens operating income 40,140,306 39,913,567 Receipts from bond issuance fees 8,039,713 8,054,515 Receipts from other operating income 4,164,778 4,225,402 Payment of salaries and related employees expenses (21,414,878) (20,762,054) Payment of rent, maintenance and utilit ies expenses (28,978,147) (31,480,679) Payment of general and administration expenses (4,348,821) (4,331,158) Payment of project and professional expenses (8,296,033) (10,953,320) Project escrows, draws (385,178) (338,935) Project escrows, deposits 393,830 402,560
Net cash used in operating activities (5,907,531) (9,695,751)
Cash flows from capital and related financing activitiesAcquisition of capital assets (4,063,151) (14,339,301)Principal payments on debt obligations (836,108) (16,118,748)Principal advances on debt obligations - 8,239,503Payment of financing costs - (95,950)Proceeds from sale of capital assets 20,060 101,450,962Receipts from capital grants 3,548,421 29,260,767Payment of Predevelopment and Brownfield grant awards (519,292) (569,612) Payment of Cultural Facilit ies grant awards (6,633,671) (9,357,478) Payment to Commonwealth of Massachusetts (86,200,000) - Payment of Advanced Manufacturing grant awards - (222,207) Payment of Military Bond Bill grant awards (725,000) (3,630,000) Payment of Massachusetts Manufacturing Extension Partnership, Inc. grant award (2,000,000) (2,000,000) Payment of Worcester Business Development Corporation grant award (4,887,957) (9,428,569) Payment of Transformative Development Initiative grant awards (1,205,225) (648,162) Payment of other capital grants (2,932,570) (4,447,439) Receipts of contributions from the Commonwealth of Massachusetts 27,301,190 40,486,252Payment of interest (343,175) (345,188)
Net cash (used in)/provided by capital and related financing activities (79,476,478) 118,234,830
Cash flows from investing activitiesPurchases of investments (2,203,097,000) (506,812,542)Sales of investments 2,305,594,599 388,547,010Investments in joint venture (55,410) (37,576)Distributions from joint ventures 320,347 100,191Distribution to Small Business Recovery Loan Fund (10,000,000) -Disbursements of loans (24,472,917) (22,523,738)Collections and recoveries of loans 16,822,531 41,550,077Payment of Predevelopment and Brownfield receivables 1,900 150,840 Advance of Predevelopment and Brownfield receivables (2,687,809) (1,774,488) Receipts of investment income 6,801,337 5,653,554
Net cash provided by/(used) in investing activities 89,227,578 (95,146,672)Net increase in cash and cash equivalents 3,843,569 13,392,407Cash and cash equivalents at beginning of year 147,523,373 134,130,966Cash and cash equivalents at end of year 151,366,942$ 147,523,373$
Supplemental disclosure of noncash activity:Contract assistance 368,857$ 382,408$ Contributions from the Commonwealth 4,330,869 9,089,823Capital grant revenue (1,595,336) 1,277,500Interest expense 255,519 280,977Grant awards (576,566) (2,120,179)Unrealized gain on investments 1,755,662 1,945,182Capital additions included in accounts payable and accrued expenses 481,755 (7,183,462)Disbursement to the Commonwealth - (98,165,144)
(continued)
20
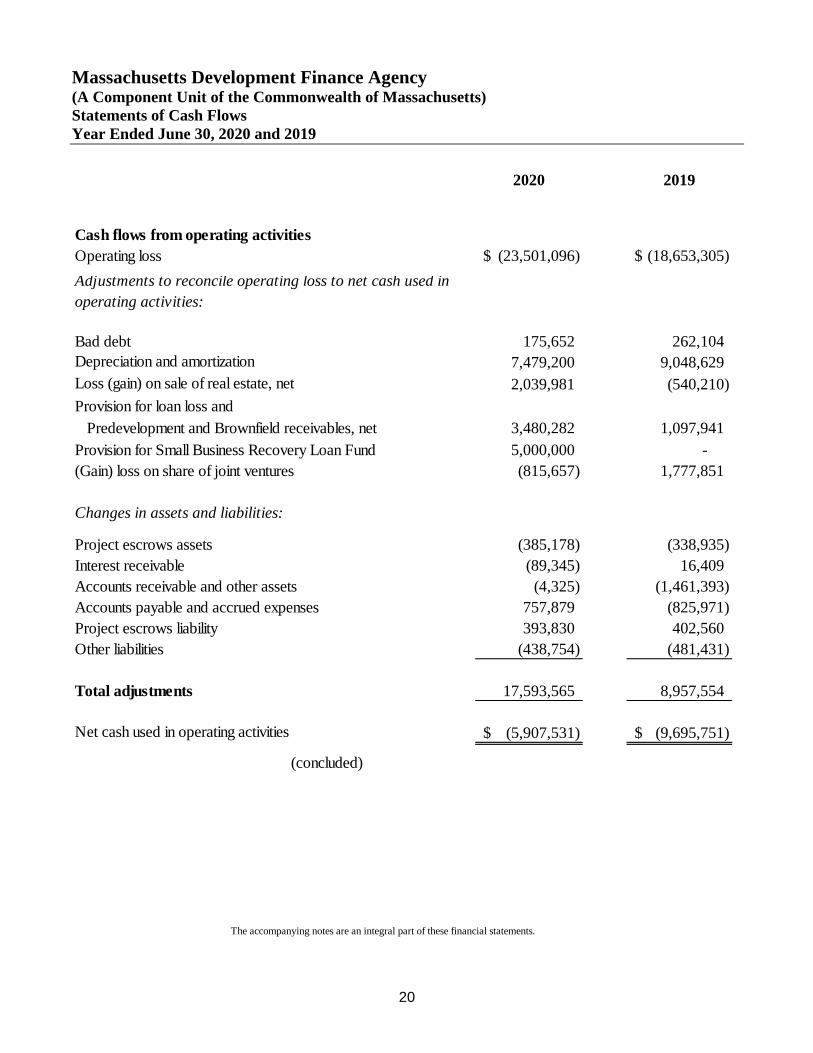
Massachusetts Development Finance Agency (A Component Unit of the Commonwealth of Massachusetts) Statements of Cash Flows Year Ended June 30, 2020 and 2019
2020 2019
Cash flows from operating activitiesOperating loss (23,501,096)$ (18,653,305)$ Adjustments to reconcile operating loss to net cash used in operating activities:
Bad debt 175,652 262,104 Depreciation and amortization 7,479,200 9,048,629 Loss (gain) on sale of real estate, net 2,039,981 (540,210) Provision for loan loss and Predevelopment and Brownfield receivables, net 3,480,282 1,097,941 Provision for Small Business Recovery Loan Fund 5,000,000 - (Gain) loss on share of joint ventures (815,657) 1,777,851
Changes in assets and liabilities:
Project escrows assets (385,178) (338,935) Interest receivable (89,345) 16,409 Accounts receivable and other assets (4,325) (1,461,393) Accounts payable and accrued expenses 757,879 (825,971) Project escrows liability 393,830 402,560 Other liabilities (438,754) (481,431)
Total adjustments 17,593,565 8,957,554
Net cash used in operating activities (5,907,531)$ (9,695,751)$
(concluded)
The accompanying notes are an integral part of these financial statements.

Massachusetts Development Finance Agency (A Component Unit of the Commonwealth of Massachusetts) Notes to Financial Statements
21
1. Authorizing Legislation Massachusetts Development Finance Agency (the “Agency” or “MDFA”) was created on September 30, 1998 pursuant to Chapter 23G of Massachusetts General Laws (“MGL”) (Chapter 289 of the Acts of 1998). The Agency is a body corporate and politic instrumentality and was created from the statutory merger of, and is the legal successor in all respects to, two previous existing instrumentalities, the Massachusetts Government Land Bank (“Land Bank”) (created in 1975 under Chapter 212 of the Acts of 1975) and the Massachusetts Industrial Finance Agency (“MIFA”) (created 1978 pursuant to chapter 23A of the MGL) and is the legal successor to the Massachusetts Health and Educational Facilities Authority (created pursuant to Chapter 614 of the Acts of 1968). Other powers of the Agency are also set forth in MGL’s Chapter 40D (with respect to the issuance of taxable and tax-exempt bonds) and chapter 498 of the Acts of 1993, as amended (with respect to the redevelopment of the former Fort Devens (“Devens”), a closed federal military base). The purpose of the Agency is to stimulate economic growth, increase employment, eradicate blight, promote prosperity and help build communities throughout the Commonwealth of Massachusetts (the “Commonwealth”). It does this through its powers to issue taxable and tax-exempt bonds for the benefit of industrial and commercial entities, institutions, health care and housing facilities, public bodies and other non-profit organizations; making loans and providing credit to eligible borrowers in accordance with its public purposes; and aiding public and private enterprises in the redevelopment of surplus federal and state property and other blighted, open, underdeveloped property. It also administers specific statutory funds directed at certain economic development needs in the Commonwealth, such as, the Brownfields Redevelopment Program (“Brownfields”), Emerging Technology Program (“ETP”), Cultural Facilities Program, Massachusetts Export Finance Program, Credit Enhancement of Charter School Facilities Program, Site Readiness Program, Military Bond Bill Capital Projects Program (“MBB”), Transformative Development Initiative Program (“TDI”), redevelopment of the Belchertown State School and the Worcester Business Development Project Program (“WBD”). The Agency also has the power to issue debt for the redevelopment of Devens. The Agency is governed by an eleven member Board of Directors (the “Board”), nine of whom are appointed directly by the governor and two of whom are public officials, or their designees, serving ex-officio. In accordance with the requirements of Governmental Accounting Standards Board (“GASB”) Statement No. 14, The Financial Reporting Entity, GASB Statement No. 39, Determining Whether Certain Organizations Are Component Units - an Amendment of GASB Statement 14, and GASB Statement No. 61, the Financial Reporting Entity: Omnibus - an amendment of GASB Statements No. 14 and No. 34, the financial statements must present the Agency and its component units. The Agency, itself, is considered a component unit of the Commonwealth and, accordingly, its financial statements are incorporated into the financial statements of the Commonwealth.

Massachusetts Development Finance Agency (A Component Unit of the Commonwealth of Massachusetts) Notes to Financial Statements
22
The Agency’s financial statements include the following blended component unit:
Taunton Development MassDevelopment Corporation In January 2012, the Agency, in partnership with Taunton Development Corporation, purchased from the Commonwealth the former Dever State School core campus in Taunton, MA. The property consists of approximately 220 acres with approximately 40 dilapidated buildings and underground tunnels. A new non-profit corporation called Taunton Development MassDevelopment Corporation (“TDMDC”) was formed to own and redevelop the property. Redevelopment of the property includes expansion of the existing 150 acres of the Myles Standish Industrial Park and development of a life science park including a training/education center. Grants have been provided by the Commonwealth through MassWorks and by the United States Department of Commerce Economic Development Administration. TDMDC is included in the financial statements of the Agency as the majority of the TDMDC board members are executives of the Agency. The Agency also provides consultant services related to the redevelopment of the property and financial services for TDMDC. The net position of TDMDC was approximately $10.1 million and $10.3 million, respectively, as of June 30, 2020 and 2019. Income Taxes As noted, the Agency has been determined to be a component unit of the Commonwealth. Accordingly, income earned by the Agency is not included within the definition of income as defined in Section 61 of the Internal Revenue Code (“IRC”). Therefore, the Agency is not required to file federal and state income tax returns.
2. Significant Accounting Policies Accounting and Reporting Standards These financial statements have been prepared in accordance with accounting principles generally accepted in the United States of America (“GAAP”), as prescribed by the GASB, which establishes standards for defining and reporting on the financial reporting entity. The GASB defines the basic financial statements of a business type activity as the statement of net position, the statement of revenues, expenses and changes in net position, the statement of cash flows, and management’s discussion and analysis as required supplementary information. The statement of net position is presented to illustrate both the current and noncurrent balances of each asset and liability. All revenues and expenses are classified as either operating or nonoperating activities in the statement of revenues, expenses and changes in net position. Operating activities are those that support the mission and purpose of the Agency. Nonoperating activities represent transactions that are capital, investing, legislative or regulated in nature.
Massachusetts Development Finance Agency (A Component Unit of the Commonwealth of Massachusetts) Notes to Financial Statements
23
Net position represents the residual interest in the Agency's assets plus deferred outflows of resources after liabilities plus deferred inflows of resources are deducted and consist of: net investment in capital assets, restricted, and unrestricted, as follows:
• Net Investment in Capital Assets The net investment in capital assets component of net position consists of capital assets, net of accumulated depreciation, reduced by the outstanding balances of bonds, mortgages, notes, or other borrowings that are attributable to the acquisition, construction or improvement of those assets plus unspent bond proceeds. Deferred outflows of resources and deferred inflows of resources that are attributable to the acquisition, construction, or improvement of those assets or related debt are included in this component of net position.
• Restricted Net position is reported as restricted when there are third party limitations (statutory, contractual or bond covenant) on its use. Nonexpendable – Net position subject to externally imposed stipulations such that the Agency maintains them permanently. For the years ended June 30, 2020 and 2019, the Agency did not have any nonexpendable restricted net position. Expendable – Net position whose use by the Agency is subject to externally imposed stipulations that can be fulfilled by actions of the Agency pursuant to those stipulations or that expire by the passage of time. Such assets include the Agency’s bond construction funds on hand.
• Unrestricted Net position that is not subject to externally imposed stipulations. Unrestricted net position may be designated for specific purposes by action of management or the Board or may otherwise be limited by contractual agreements with outside parties.
Use of Estimates The preparation of financial statements in conformity with GAAP requires management to make estimates and assumptions that affect the reported amounts of assets and liabilities and disclosure of contingent assets and liabilities at the date of the financial statements and the reported amounts of revenues and expenses during the reporting period. Actual results could differ from those estimates.

Massachusetts Development Finance Agency (A Component Unit of the Commonwealth of Massachusetts) Notes to Financial Statements
24
Basis of Accounting The financial statements were prepared using the accrual basis of accounting in conformity with GAAP. Under the accrual basis, revenue is recognized when earned and expenses are recognized when obligations are incurred or when benefits are received. Cash and Cash Equivalents Cash and cash equivalents consist of cash on hand and highly liquid investments with maturities of three months or less at acquisition. Current cash and cash equivalents consist of unrestricted funds available for general operating purposes for the General Operations Program and TDMDC. Current cash and cash equivalents-restricted for use consist of available funds for current operations related to the Devens Electric Utility Division and available funds for loan, guarantee, grant or capital activity for restricted programs. Noncurrent cash and cash equivalents restricted for capital use consist of funds available for future capital improvements. Noncurrent cash and cash equivalents-restricted for use consist of funds available for future debt service payments, project reserves and future operations when there are not sufficient funds available from current operations. Cash and cash equivalents includes the Agency’s investments in the Short Term Asset Reserve Fund (“STAR Fund”), which is a short-term money market portfolio which seeks to preserve principal and maintain liquidity. Pursuant GASB 79, Certain External Investment Pools and Pool Participants, the STAR Fund is a qualifying external investment pool that measures for financial reporting purposes all of its short-term money market portfolio at amortized cost. See Note 4 for more information related to the STAR Fund. STAR Fund The Agency is also the administrator of the STAR Fund. The STAR Fund is an investment fund that is managed like a money market fund and invests in short-term, high-quality securities, and is available for the investment of bond proceeds of the Agency’s client institutions. The STAR Fund is designed to preserve principal, provide daily liquidity, and earn a reasonable rate of return. The STAR Fund operates on a calendar year-end basis and is audited annually by a third party. Except for the Agency’s investments in the STAR Fund, the accounts and investment results of the STAR Fund are not included in the Agency’s financial statements.
Investments The Agency’s investments are reported at fair value using quoted market price as defined by GASB Statement No. 72, Fair Value Measurement and Application, except for guaranteed investment contracts (“GIC”), which are reported at contract value. Contract value represents contributions made under the contract plus accrued interest. GASB 72 also establishes a hierarchy of inputs to valuation techniques used to measure fair value. The hierarchy has three levels. Level 1 inputs are quoted prices in active markets for identical assets or liabilities. Level 2 inputs are inputs that are observable for the asset or liability, either directly or indirectly. Level 3 inputs are unobservable inputs, such as management’s assumptions.
Massachusetts Development Finance Agency (A Component Unit of the Commonwealth of Massachusetts) Notes to Financial Statements
25
The Agency has loan agreements within the ETP, established under Sections 27 and 28 of MGL Chapter 23G. Certain loan agreements include separate warrants that qualify as reportable derivative instruments under GASB No. 53, Accounting and Financial Reporting for Derivative Instruments. The value of these warrants is ultimately dependent upon the fair value of the companies which have issued the warrants. The ETP is a loan program designed to promote economic development in the emerging technologies sector of the Massachusetts economy. These loans are generally issued to companies that are otherwise unable to obtain market based financing. The majority of these companies are pre-revenue start-up operations funded in part through the ETP to promote economic development in the Commonwealth. The Agency has developed a reliable estimate of the fair value of the related warrants using a comparable company analysis and last round of financing approach. See Note 4 for more information related to these derivative instruments. All investment income, including changes in the fair value of investments, is reported as revenue in the accompanying statements of revenue, expenses and changes in net position. The primary objectives of the Agency’s investment policy are to ensure preservation of capital, to grow funds available to meet the expanding needs of lending capital in the Commonwealth, to ensure liquidity of investments to meet current and estimated cash flow needs by investing in instruments with structured maturities that are readily marketable and to provide maximum yield while maintaining safety and liquidity. The maturities of investments range from less than one year to greater than five years. Investments may include money market funds with maturities of three months or less. These money market funds are classified as investments since they are held for the primary purpose of meeting some of the Agency’s investment objectives and are due to investment restrictions placed on the related programs. Loans Receivable and Predevelopment and Brownfield Receivables, net Loans receivable consist of loans issued by the Agency for various economic development programs. Predevelopment and brownfield receivables consist of loans issued by the Agency to finance early stage project costs (i.e. architectural and engineering costs) which are necessary to advance a project to the development stage. These loans receivable are stated at principal amount outstanding, net of a provision for loan loss. Loans are charged against the provision for loan loss when the Agency believes the collectability of the principal is unlikely. The provision for loan loss is an amount that the Agency believes will be adequate to absorb possible loan losses of existing loans that may become uncollectible. Investment in Joint Ventures The Agency accounts for its participating interest in its joint ventures using the equity method of accounting. Under the equity method, the investment is carried at cost and adjusted for the Agency’s share of net income or loss, cash contributions or distributions to and from its joint ventures as well as impairment losses on the joint ventures. Any impairment loss represents a write down to the carrying value of the investment as projections related to the investment show that it is not probable that the investment balance will be recoverable from distributions

Massachusetts Development Finance Agency (A Component Unit of the Commonwealth of Massachusetts) Notes to Financial Statements
26
generated by future sales. These investments are deemed operating in nature as they support the mission and purpose of the Agency. Impairment Loss on Joint Ventures Management analyzes its investments in joint ventures to determine whether the amounts are considered to be permanently impaired based upon its best estimates of the cash flows from the investment. If a permanent impairment in carrying value exists, a provision to write down the investment to the estimated cash flows realizable from the investment will be recorded in the Agency’s financial statements. There were no impairment losses recognized in fiscal years 2020 and 2019. Accounts Receivable and Other Assets The Agency evaluates the collectability of leases, utility and other accounts receivable after considering payment history. Although collection efforts continue, the Agency charges off any receivable balance that is deemed unlikely to be collected. Interest Receivable Interest receivable represents the amount of interest revenue that was earned, but not yet received by the end of the fiscal year in relation to loans receivable and investments. Interest income on loans is recognized as earned. For loans receivable with interest payments in arrears, the Agency continues to accrue interest until such time as the loan agreement is restructured or the interest receivable is deemed to be uncollectible. When loans are restructured, interest payments in arrears, net of any amounts deemed uncollectible, are typically aggregated with the outstanding principal balance and interest is accrued on the new principal balance. Project Escrows The Agency holds funds consisting of cash and investments as collateral for mortgages receivable and as a source of payment for borrowers’ obligations including tax and insurance payments. These amounts are recorded at market value and are held in separate bank accounts under the borrowers’ tax identification numbers. Due From the Commonwealth Due from the Commonwealth represents amounts owed from the Commonwealth as of June 30, 2020 and 2019, totaling $1,112,069 and $5,277,064, respectively. The balance due from the Commonwealth mainly represents reimbursements due to the Agency for Cultural Facilities grant expenses, Devens capital reimbursement, Transformative Development Initiative equity investment projects, community innovation grant expenses and military initiative project expenses incurred during the fiscal years.
Massachusetts Development Finance Agency (A Component Unit of the Commonwealth of Massachusetts) Notes to Financial Statements
27
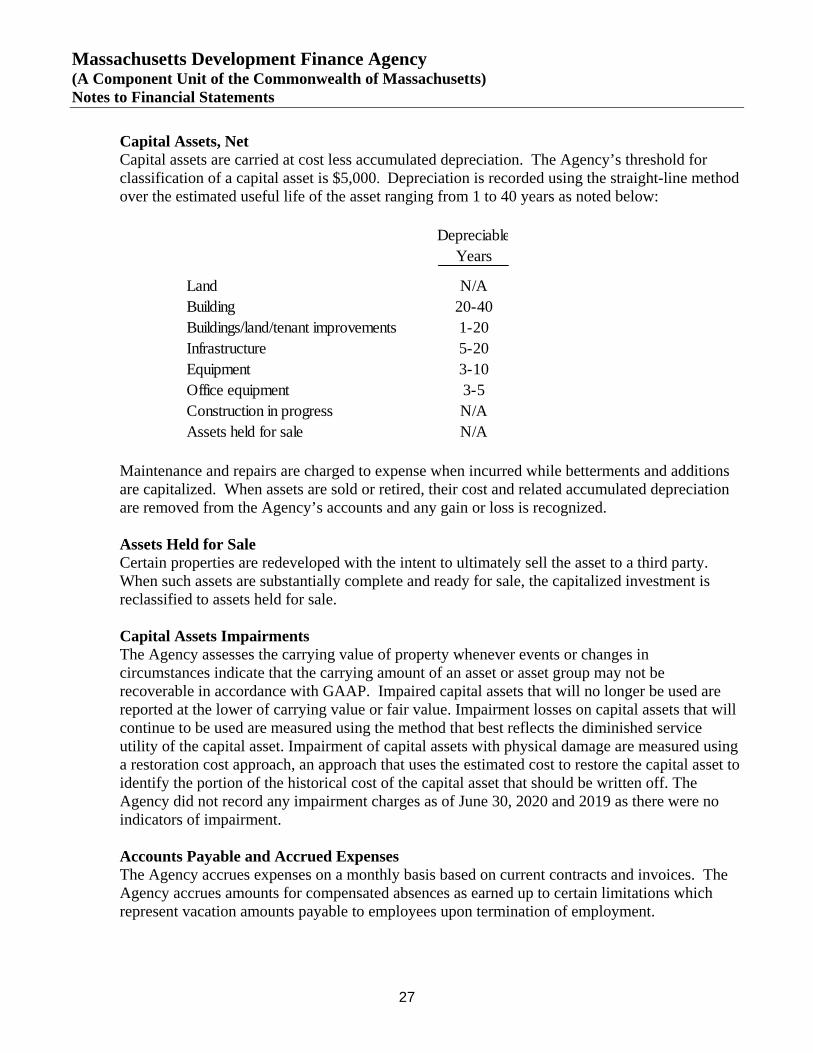
Capital Assets, Net Capital assets are carried at cost less accumulated depreciation. The Agency’s threshold for classification of a capital asset is $5,000. Depreciation is recorded using the straight-line method over the estimated useful life of the asset ranging from 1 to 40 years as noted below:
Maintenance and repairs are charged to expense when incurred while betterments and additions are capitalized. When assets are sold or retired, their cost and related accumulated depreciation are removed from the Agency’s accounts and any gain or loss is recognized. Assets Held for Sale Certain properties are redeveloped with the intent to ultimately sell the asset to a third party. When such assets are substantially complete and ready for sale, the capitalized investment is reclassified to assets held for sale. Capital Assets Impairments The Agency assesses the carrying value of property whenever events or changes in circumstances indicate that the carrying amount of an asset or asset group may not be recoverable in accordance with GAAP. Impaired capital assets that will no longer be used are reported at the lower of carrying value or fair value. Impairment losses on capital assets that will continue to be used are measured using the method that best reflects the diminished service utility of the capital asset. Impairment of capital assets with physical damage are measured using a restoration cost approach, an approach that uses the estimated cost to restore the capital asset to identify the portion of the historical cost of the capital asset that should be written off. The Agency did not record any impairment charges as of June 30, 2020 and 2019 as there were no indicators of impairment. Accounts Payable and Accrued Expenses The Agency accrues expenses on a monthly basis based on current contracts and invoices. The Agency accrues amounts for compensated absences as earned up to certain limitations which represent vacation amounts payable to employees upon termination of employment.
DepreciableYears
Land N/ABuilding 20-40Buildings/land/tenant improvements 1-20Infrastructure 5-20Equipment 3-10Office equipment 3-5Construction in progress N/AAssets held for sale N/A
Massachusetts Development Finance Agency (A Component Unit of the Commonwealth of Massachusetts) Notes to Financial Statements
28
Other Liabilities Other liabilities consists of unearned revenues received from the Commonwealth for future grants or project expenses, deferred rent, deferred gains on property sales, unearned insurance premiums and miscellaneous liabilities. Bonds Payable Bonds are recorded at date of issuance, net of related premium or discount amounts. Bond premiums and discounts are amortized or accreted, respectively, over the term of the related bond and these amounts are recorded as a component of non-operating expense. Revenue Recognition Application and processing fees for both tax-exempt and taxable bonds are recorded as bond issuance fee revenue on the date of closing on the bond. Debt servicing fees are recorded as revenue upon receipt. These are fees that are collected for Agency assistance in bond closings.
Organizational fee income for the New Markets Tax Credit (“NMTC”) programs is recognized as NMTC fees on the date of the closing of the related NMTC program. This fee is a one-time cost associated with setting up and organizing the program. Management fee income for the NMTC programs is recorded as services related to managing the operations of the NMTC programs are performed. Rental income is recognized on a straight-line basis for facility space rentals as it is earned. Advanced receipts of rental income are classified as liabilities until earned. All leases are operating leases. Rental income consists of base rent and reimbursements for certain operating expenses. Rental income is mainly related to properties located in Taunton, Devens, Worcester and Springfield. Rental income is included in the statements of revenues, expenses and changes in net position operating revenues as Devens operating revenue and Other line items. Guarantee fees received for loans guaranteed by the Agency are reported as unearned and recognized ratably over the term of the guarantee agreement. Guarantee fees are included in the statements of revenues, expenses and changes in net position operating revenues as interest and loan income. Capital grant revenue is recognized depending on the terms of the related grant. Charter School grant revenue is recognized as Charter School loan guarantees are issued. Belchertown MassWorks grants, Department of Homeland Security grants, Office of Economic Adjustment grants, Environmental Protection Agency grants and Economic Development Administration grants are recognized as funds are disbursed for the related grant project. Contributions from the Commonwealth are recognized according to the terms of the related agreement. Most are reimbursement type grants and are recognized as qualifying expenses are incurred. Devens operating revenue consists of fees received for utilities, municipal services and leased space and are recognized as earned.
Massachusetts Development Finance Agency (A Component Unit of the Commonwealth of Massachusetts) Notes to Financial Statements
29
The Agency accrues monthly principal and interest reimbursements due under its contract with the Commonwealth for debt service payments associated with the Massachusetts Department of Environmental Protection (“DEP”) loan and records these amounts as contract assistance which is included in non-operating revenue. Generally, gains on sales of real estate are recognized as earned. Certain purchase and sale agreements include a repurchase clause; therefore, these gains on sales are not recognized until the conditions in the repurchase clauses are satisfied. Provision for Loan Loss (Recovery) Provision for loan loss (recovery) represents the necessary expense (recovery) to maintain an adequate allowance for estimated loan losses. In determining the provision, the Agency evaluates each loan and considers past performance history, collateral value, financial stability of the borrower and the likelihood for foreclosure and such other factors as deemed necessary. The loan portfolio and the Agency’s loan loss rating system are evaluated annually by management and an independent consulting firm. Provision for Predevelopment and Brownfield Receivables, net Provision for predevelopment and brownfield receivables, net, represents the expense necessary to maintain an adequate allowance for estimated losses of receivables that may become uncollectible. Provision for Small Business Recovery Loan Fund Provision for Small Business Recovery Loan Fund, represents the probability that the current balance would not be recovered from distributions from future fund loan repayments due to the nature of the fund. The Agency recognized a $5.0 million provision loss in fiscal year 2020 to write down the amount expected to be recovered through its net cash flow from the fund. New Accounting Pronouncements Accounting Standards Effective in Current Year In May 2020, the GASB issued GASB No. 95, Postponement of the Effective Dates of Certain Authoritative Guidance. This Statement is to provide temporary relief to governments and other stakeholders in light of the COVID-19 pandemic. That objective is accomplished by postponing the effective dates of certain provisions in GASB statements and implementation guides that first became effective or were scheduled to become effective for periods beginning after June 15, 2018 and later. The adoption of this GASB resulted in the postponement of GASB Statement Nos. 84 through 93 and was effective immediately. In November 2016, the GASB issued GASB No. 83, Certain Asset Retirement Obligations (“AROs”). This standard addresses accounting and financial reporting for certain asset retirement obligations. The objective of this standard is to enhance comparability of financial statements among governments by establishing uniform criteria for governments to recognize and measure certain AROs. The adoption of this standard did not have a significant impact on the Agency’s financial statements.
Massachusetts Development Finance Agency (A Component Unit of the Commonwealth of Massachusetts) Notes to Financial Statements
30
In March 2018, the GASB issued GASB No. 88, Certain Disclosures Related to Debt, including Direct Borrowings and Direct Placements. The objective of this standard is to improve consistency in information that is disclosed in notes to the financial statements related to debt, including direct borrowings and direct placements, and to provide essential information about debt. The adoption of this standard did not have a significant impact on the Agency’s financial statements. In June 2018, the GASB issued Statement No. 89, Accounting for Interest Cost Incurred before the End of a Construction Period. The objective of this standard is to establish accounting requirements for interest cost incurred before the end of a construction period. This standard is now effective for financial statements for fiscal years beginning after December 15, 2020. Earlier application is encouraged. The requirements of this standard should be applied prospectively. The Agency early implemented this standard and the adoption of this standard did not have a significant impact on the Agency’s financial statements. New Accounting Standards Not Yet Effective In January 2017, the GASB issued GASB No. 84, Fiduciary Activities. This standard establishes criteria for identifying fiduciary activities of all state and local governments. The objective of this standard is to improve guidance regarding the identification of fiduciary activities for accounting and financial reporting purposes and how those activities should be reported. This standard is now effective for financial statements for fiscal years beginning after December 15, 2019. Earlier application is encouraged. The adoption of this standard is not expected to have a significant impact on the Agency’s financial statements, but may require additional disclosures in the financial statements by the Agency. In June 2017, the GASB issued GASB No. 87, Leases. This standard establishes standards of accounting and financial reporting for leases by lessees and lessors. The objective of this standard is to better meet the informational needs of financial statement users by improving accounting and financial reporting for leases by governments. This standard is now effective for financial statements for fiscal years beginning after June 15, 2021. Earlier application is encouraged. The Agency is in the process of reviewing how the adoption of this standard will impact the Agency’s financial statements. In August 2018, the GASB issued GASB No. 90, Majority Equity Interests. The objective of this standard is to improve the consistency and comparability of reporting a government’s majority equity interest in a legally separate organization and to improve the relevance of financial statement information for certain component units. This standard is now effective for financial statements for fiscal years beginning after December 15, 2019. Earlier application is encouraged. The requirements of this standard should be applied retroactively. The Agency is in the process of reviewing how the adoption of this standard will impact the Agency’s financial statements.

Massachusetts Development Finance Agency (A Component Unit of the Commonwealth of Massachusetts) Notes to Financial Statements
31
In May 2019, the GASB issued GASB No. 91, Conduit Debt Obligations. The objective of this standard is to provide a single method of reporting conduit debt obligations by issuers. This standard is now effective for reporting periods beginning after December 15, 2021. Earlier application is encouraged. The Agency is in the process of reviewing how the adoption of this standard will impact the Agency’s financial statements. In January 2020, the GASB issued GASB No. 92, Omnibus 2020. The objectives of this standard are to enhance comparability in accounting and financial reporting and improve consistency of authoritative literature. There are varying effective dates based on the applicable requirements in the related GASB. Earlier application is encouraged. The Agency is in the process of reviewing how the adoption of this standard will impact the Agency’s financial statements. In March 2020, the GASB issued GASB No. 93, Replacement of Interbank Offered Rates. The objective of this standard is to address accounting and financial reporting implications that result from the replacement of an interbank offered rate (“IBOR”). The removal of IBOR as an appropriate benchmark interest rate is now effect for reporting periods beginning after December 31, 2022. All other requirements of this standard are now effective for reporting periods beginning after June 15, 2022. Earlier application is encourage. The Agency is in the process of reviewing how the adoption of this standard will impact the Agency’s financial statements. In March 2020, the GASB issued GASB No. 94, Public-Private and Public-Public Partnerships and Availability Payment Arrangements. The objective of this standard is to improve financial reporting by addressing issues related to public-private and public-public partnership arrangements. This standard is effective for reporting periods beginning after June 15, 2022. Earlier application is encouraged. The Agency is in the process of reviewing how the adoption of this standard will impact the Agency’s financial statements. In May 2020, the GASB issued GASB No. 96, Subscription-Based Information Technology Arrangements. The objective of this standard is to improve guidance on accounting and financial reporting for subscription-based information technology arrangements. This standard is effective for reporting periods beginning after June 15, 2022. Earlier application is encouraged. The Agency is in the process of reviewing how the adoption of this standard will impact the Agency’s financial statements. In June 2020, the GASB issued GASB No. 97, Certain Component Unit Criteria, and Accounting and Financial Reporting for Internal Revenue Code Section 457 Deferred Compensation Plan. The primary objectives of this Statement are to (1) increase consistency and comparability related to the reporting of fiduciary component units in circumstances in which a potential component unit does not have a governing board and the primary government performs the duties that a governing board typically would perform; (2) mitigate costs associated with the reporting of certain defined contribution pension plans, defined contribution other postemployment benefit (OPEB) plans, and employee benefit plans other than pension plans or OPEB plans (other employee benefit plans) as fiduciary component units in fiduciary fund financial statements; and (3) enhance the relevance, consistency, and comparability of the accounting and financial reporting for Internal Revenue Code (IRC) Section 457 deferred
Massachusetts Development Finance Agency (A Component Unit of the Commonwealth of Massachusetts) Notes to Financial Statements
32
compensation plans (Section 457 plans) that meet the definition of a pension plan and for benefits provided through those plans. This standard is effective for reporting periods beginning after June 15, 2021. Earlier application is encouraged. The Agency is in the process of reviewing how the adoption of this standard will impact the Agency’s financial statements.
3. Programs of the Agency The following describes certain programs or divisions of the Agency. Please also refer to the Supplemental Information on pages 63-64. General Operations Program The General Operations Program supports five major programs of the Agency: direct lending, investment banking, development/redevelopment of properties, consulting/technical assistance to communities and support of the defense sector in the Commonwealth. The Agency’s lending programs consist of business loans, real estate mortgages, equipment loans and development loans. Lending programs generate fee income at closings and interest income. Investment banking acts as a conduit issuer for tax-exempt and taxable bond financing for a variety of borrowers. Investment banking generates fee income from bond issuances. The Agency invests funds in real estate developments in support of the development/ redevelopment of blighted and/or surplus public properties within the Commonwealth. The Agency is actively involved in the development and/or ongoing operations of such properties in Devens, Springfield, Northampton, Belchertown, Taunton and certain Massachusetts state piers. The Agency provides technical assistance to communities through various programs including loans and consulting services. The Agency also devotes staff time toward defense sector work. Current defense sector projects include economic analysis of the importance of the Commonwealth’s military installations and work on the Commonwealth’s Military Asset and Security Strategy Task Force. The net position of the General Operations Program was approximately $188.1 million and $195.4 million as of June 30, 2020 and 2019, respectively. Devens Operations Program The Devens Operations Program was established under Chapter 498 of the Acts of 1993, as amended (with respect to the redevelopment of Devens, a former federal military base). With financial support from the Commonwealth, the Agency purchased the property and has been redeveloping Devens, a 4,400 acre mixed-use community located in Devens, MA, by creating a sustainable and diverse residential and business community. The Agency currently provides municipal services, education, environmental protection, redevelopment and property leasing services at Devens. The net position of the Devens Operations Program was approximately $62.6 million and $66.2 million as of June 30, 2020 and 2019, respectively. Brownfield Redevelopment Program Brownfield was established in 1998 as part of the Commonwealth’s Brownfield Act to encourage reuse of environmentally contaminated property in economically distressed areas of the Commonwealth. This program is administered by the Agency and all cash balances related to this program must be invested according to an established Agency investment policy related to restricted funds. All related interest income must be utilized for the administration of the
Massachusetts Development Finance Agency (A Component Unit of the Commonwealth of Massachusetts) Notes to Financial Statements
33
program. The Agency had approximately $1.4 million and $2.2 million of gross Brownfield loans receivable with loan loss reserves of approximately $0.1 for net Brownfield loans receivable of approximately $1.3 million and $2.0 million outstanding as of June 30, 2020 and 2019, respectively. The Agency also issued approximately $0.5 million of grant awards during fiscal years 2020 and 2019, respectively. As of June 30, 2020 and 2019, approximately $12.5 million and $13.1 million, respectively, was available for disbursement. The restricted net position of this program was approximately $10.0 million and $11.5 million as of June 30, 2020 and 2019, respectively. Emerging Technology Program The ETP was established under Sections 27 and 28 of MGL Chapter 23G. ETP leverages private financing to provide capital for businesses, which develop or commercialize emerging technologies. The Agency had approximately $9.2 million and $6.0 million of gross ETP loans receivable with loan loss reserves of approximately $2.2 million and $1.9 million for net ETP loans receivable of approximately $7.0 million and $4.1 million outstanding as of June 30, 2020 and 2019, respectively. As of June 30, 2020 and 2019, the Agency had approximately $29.4 million and $32.9 million, respectively, available for disbursement. The restricted net position of this program was approximately $44.8 million and $43.7 million as of June 30, 2020 and 2019, respectively. The Agency assets at risk due to outstanding ETP guarantees, including unfunded commitments, at June 30, 2020 and 2019, were $2.0 million and $4.0 million, respectively. The Agency has also committed an additional $5.0 million to an equity investment in the Commonwealth Fund III LLC (“Fund”) from the ETP. As of June 30, 2020 and 2019, a total of $3.9 million, respectively, had been contributed to the Fund. Cultural Facilities Program The Cultural Facilities Program was established under section 42 of the MGL chapter 23G, effective July 13, 2006. The purpose of the Cultural Facilities Program is to make grants or loans for the acquisition, design, construction, repair, renovation, rehabilitation or other capital improvement or deferred maintenance of a cultural facility. All related interest income must be utilized for the administration of the program. New funds are given to the Agency on a reimbursement basis as grants are awarded. The Agency awarded approximately $6.9 million and $9.4 million of grant awards during fiscal years 2020 and 2019, respectively. As of June 30, 2020 and 2019, approximately $2.8 million and $2.7 million, respectively, is on hand and available for disbursement. The restricted net position of this program was approximately $3.0 million and $2.9 million as of June 30, 2020 and 2019, respectively. Massachusetts Export Development Program This program serves as a guarantee to lending institutions for their working capital loans to Massachusetts exporters. These funds are administered by the Agency and must be invested in securities issued by the Treasury of the United States Government or the Commonwealth. All related investment income must be utilized for the administration of this program. The Agency had designated approximately $3.5 million at June 30, 2020 and 2019, respectively, for this program. Total Agency assets at risk due to Massachusetts Export Development Program

Massachusetts Development Finance Agency (A Component Unit of the Commonwealth of Massachusetts) Notes to Financial Statements
34
guarantees outstanding, including commitments, aggregated approximately $3.9 million and $6.5 million at June 30, 2020 and 2019, respectively. The restricted net position of this program was approximately $2.8 million as of June 30, 2020 and 2019, respectively. This program is included in the Other column in the Supplemental Information on page 63 and 64. Mortgage Insurance Program The purpose of the Mortgage Insurance Program (“MIP”) is to encourage private sector investment by guaranteeing a portion of bank loans or bond issues. Premium income received and other monies made available to the program are credited thereto. This premium income is amortized over the loan guarantee period. The approved leverage policy for this program is 1) for loans secured by first liens on real estate or equipment three times the cash balance in the program backing such guarantees and 2) for loans secured by second liens on capital assets or first liens on other business assets, no more than one and a half times the cash balance in the program backing such guarantees. The Agency had designated approximately $13.3 million and $13.2 million at June 30, 2020 and 2019, respectively, for the MIP and are considered restricted funds. Total Agency assets at risk due to mortgage insurance in force, including commitments, under the Guaranteed Loan Program, aggregated approximately $14.5 million and $20.3 million at June 30, 2020 and 2019, respectively. The restricted net position of this program was approximately $12.8 million and $12.6 million as of June 30, 2020 and 2019, respectively.
MassDevelopment/HEFA Trust The MassDevelopment/HEFA Trust (“Trust”) was established on July 8, 1997 as an irrevocable trust. The Trust’s net position is subject to restrictions regarding its use. The Trust is authorized to make payments to charitable organizations or governmental entities such as public colleges and universities to assist in the form of gifts, grants, and loans. The General Operations Program may be eligible to receive the income and up to 10% of the principal from the Trust at the trustees’ direction. All payments to the General Operations Program shall be used by the Agency only to reduce charges it would otherwise have to impose upon institutions using the Agency’s services, and all payments to charitable institutions or governmental entities must be for their charitable and governmental purposes, respectively.
During the years ended June 30, 2020 and 2019, the Trust awarded grants of $249,973 and $483,924, respectively, to charitable institutions. The Trust also started issuing loans beginning with fiscal year 2014. The net loan receivable balance as of June 30, 2020 and 2019 was $0 and $35,738, respectively. As of June 30, 2020 and 2019, approximately $9.2 million and $9.0 million, respectively is available for future payments. The grants are reported as other grant awards in the accompanying statements of revenues, expenses and changes in net position. The restricted net position of the Trust was approximately $9.2 million and $9.0 million as of June 30, 2020 and 2019, respectively.

Massachusetts Development Finance Agency (A Component Unit of the Commonwealth of Massachusetts) Notes to Financial Statements
35
Credit Enhancement of Charter School Facilities Program In 2005, the Agency was awarded $10,025,000 from the U.S. Department of Education (“U.S. DOE”) to enable the Agency to facilitate the financing of charter schools through the issuance of loan guarantees. This program currently has a total capitalization of $58,025,000 derived from five grant awards from the U.S. DOE, matching private guarantees from The Boston Foundation and Local Initiatives Support Corporation and matching guarantees from the Agency’s General Fund. The first tier of the 2005 funding includes the $10,025,000 from the U.S. DOE and a $500,000 matching guarantee provided by the Agency’s General Fund. The second tier of the 2005 funding includes a $2,000,000 guarantee from Local Initiatives Support Corporation, a $4,000,000 guarantee from The Boston Foundation and a $500,000 guarantee from the Agency’s General Fund. During fiscal year 2014, the Agency was awarded another $5,000,000 towards this program by the U.S. DOE and the Agency’s General Fund may provide up to $5,000,000 match funding for guarantees. During fiscal years 2015 and 2016, the Agency was awarded another $3,900,000, and $1,100,000, respectively, under one grant, and the Agency’s General Fund may provide up to $5,000,000 match funding for guarantees. During fiscal year 2018, the Agency was awarded another $8,000,000 towards this program by the U.S. DOE and the Agency’s General Fund may provide up to $8,000,000 match funding for guarantees. Interest and certain fees earned on this program remain in the program funds. During fiscal year 2020, the Agency was awarded another $5,000,000 towards this program by the U.S. DOE and received $2,185,000 during the fiscal year. As of June 30, 2020 and 2019, approximately $32.5 million and $30.1 million, respectively, are available for loan guarantees. Total Agency assets at risk due to outstanding guarantees, including commitments, aggregated approximately $32.9 million and $28.9 million at June 30, 2020 and 2019, respectively. The restricted net position of this program was approximately $31.8 million and $28.3 million as of June 30, 2020 and 2019, respectively. Devens Electric Utility Division In February 2001, the Agency issued Electrical System Revenue Bonds, Series 2001 for the purpose of financing the design, construction, installation and associated costs of the electrical system at Devens, as part of its Devens operations. As required by Section 609 of the Master Trust Indenture by and between the Agency and the Trustee, the Agency accounts for all related revenues and expenditures associated with the electric utilities at Devens as a separate division within the Agency. Net position of the Devens Electric Utility Division was approximately $23.6 million and $21.3 million as of June 30, 2020 and 2019, respectively. Please also refer to Footnote 18 Segment Reporting. Devens Gas, Water and Wastewater Utility Divisions Devens also provides natural gas, water and sewer services to the residents and businesses of Devens, MA, as part of its Devens operations. The utility divisions pursue programs aimed at increasing energy supply, reliability and efficiency while limiting costs. The Agency tracks each utility division as a separate and distinct program. The net position of these utility divisions was approximately $19.8 million and $21.3 million as of June 30, 2020 and 2019, respectively.
Massachusetts Development Finance Agency (A Component Unit of the Commonwealth of Massachusetts) Notes to Financial Statements
36
Military Bond Bill Capital Projects Program MBB was established pursuant to MGL chapter 6, section 216. The purpose of this program is to establish a military asset and security task force and provides that the Agency oversee and implement military installations mission improvement and expansion projects or base realignment preparation and mitigation projects, including, the acquisition, management and disposition of all or any portion of military installations, buildings and utility systems, equipment and personal property, as well as, acquire title to land, buildings and improvements that comprise all or any portion of military installations upon the transfer or disposition of any portion of the military installations by the federal government. During fiscal years 2020 and 2019, MBB awarded grants totaling $0.7 million and $2.7 million, respectively. The restricted net position of this program was $0 as of June 30, 2020 and 2019. The MBB is included in the Other column in the Supplemental Information on page 63 and 64. Transformative Development Initiative Program TDI was established pursuant to MGL chapter 287, acts of 2014. The purpose of this program is to redevelop Gateway cities to enhance local public-private engagement and community identity; stimulate an improved quality of life for residents; and spur increased investment and economic activity. As of June 30, 2020 and 2019, approximately $9.5 million and $9.6 million, respectively, was available for disbursement. During fiscal years 2020 and 2019, TDI awarded grants totaling $1.1 million and $0.6 million, respectively, and had $0.7 million and $0.9 million, respectively, worth of direct project expenses. The net position of this program was approximately $7.3 million and $10.0 million as of June 30, 2020 and 2019, respectively. Worcester Business Development Project Program WBD was established in accordance with Section 19 of MGL Chapter 23G to provide Worcester Business Development Corporation a grant of up to $14,850,000 for the demolition and related costs of the former Bryan State Hospital building in Worcester, MA to create a pad-ready site to sell or lease to the bio-services industry. In fiscal year 2018, the Agency received $15.0 million from the Commonwealth in support of this project. During fiscal years 2020 and 2019, the Agency awarded grant funding totaling $3.9 million and $10.4 towards this project. As of June 30, 2020 and 2019, approximately $0.5 million and $5.5 million, respectively, was available for disbursement. The restricted net position of this program was approximately $0 as of June 30, 2020 and 2019. The WBD is included in the Other column in the Supplemental Information on page 63 and 64. . Bond Issuance Program The Bond Issuance Program allows the Agency to offer debt financing by acting as a conduit bond issuer, usually on a tax-exempt basis for diverse types of borrowers including but not limited to colleges, hospitals and other non-profits, affordable rental housing developments, manufacturing companies, solid waste disposal facilities, and public infrastructure. The Agency’s conduit bonds are purchased by banks or other types of investors. Principal and interest on the conduit bonds are payable from funds received from the underlying borrowers. Bonds may or may not carry private credit enhancement and are not obligations of the Agency, although in some cases a separate loan guarantee may have been provided by the Agency to a bank purchaser from one of the Agency’s Loan Guarantee programs.
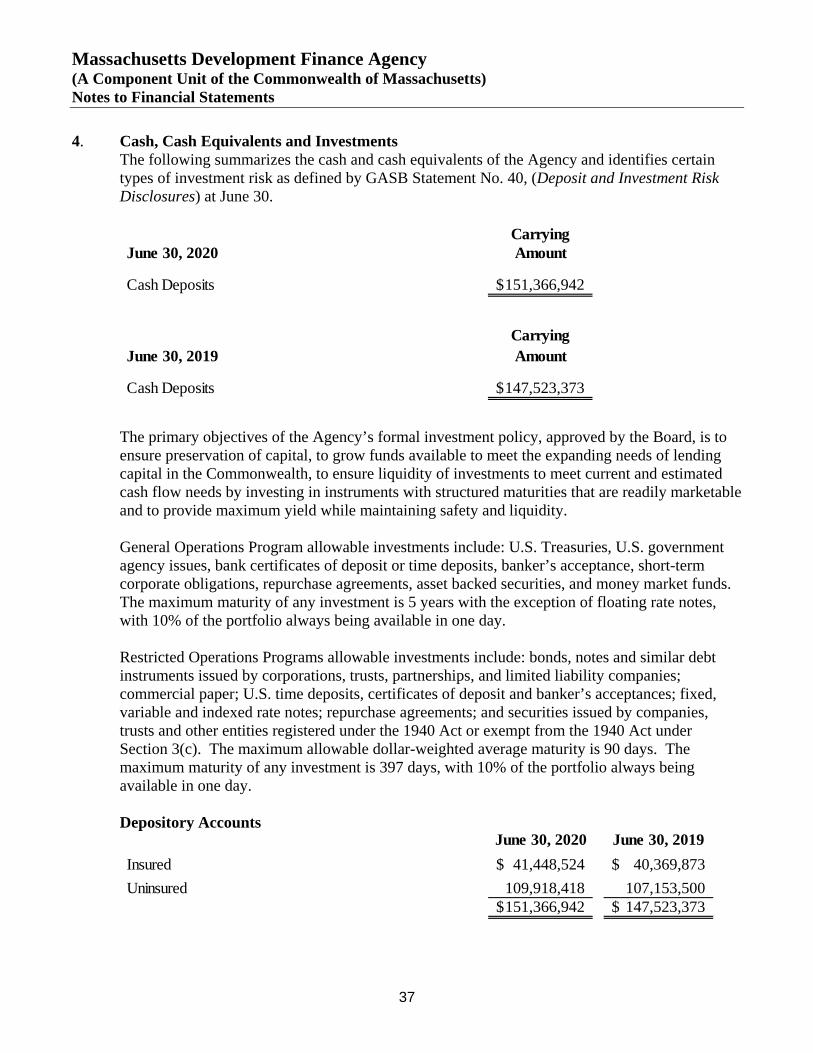
Massachusetts Development Finance Agency (A Component Unit of the Commonwealth of Massachusetts) Notes to Financial Statements
37
4. Cash, Cash Equivalents and Investments The following summarizes the cash and cash equivalents of the Agency and identifies certain types of investment risk as defined by GASB Statement No. 40, (Deposit and Investment Risk Disclosures) at June 30.
The primary objectives of the Agency’s formal investment policy, approved by the Board, is to ensure preservation of capital, to grow funds available to meet the expanding needs of lending capital in the Commonwealth, to ensure liquidity of investments to meet current and estimated cash flow needs by investing in instruments with structured maturities that are readily marketable and to provide maximum yield while maintaining safety and liquidity. General Operations Program allowable investments include: U.S. Treasuries, U.S. government agency issues, bank certificates of deposit or time deposits, banker’s acceptance, short-term corporate obligations, repurchase agreements, asset backed securities, and money market funds. The maximum maturity of any investment is 5 years with the exception of floating rate notes, with 10% of the portfolio always being available in one day. Restricted Operations Programs allowable investments include: bonds, notes and similar debt instruments issued by corporations, trusts, partnerships, and limited liability companies; commercial paper; U.S. time deposits, certificates of deposit and banker’s acceptances; fixed, variable and indexed rate notes; repurchase agreements; and securities issued by companies, trusts and other entities registered under the 1940 Act or exempt from the 1940 Act under Section 3(c). The maximum allowable dollar-weighted average maturity is 90 days. The maximum maturity of any investment is 397 days, with 10% of the portfolio always being available in one day. Depository Accounts
CarryingJune 30, 2020 Amount
Cash Deposits 151,366,942$
CarryingJune 30, 2019 Amount
Cash Deposits 147,523,373$
June 30, 2020 June 30, 2019Insured 41,448,524$ 40,369,873$ Uninsured 109,918,418 107,153,500
151,366,942$ 147,523,373$

Massachusetts Development Finance Agency (A Component Unit of the Commonwealth of Massachusetts) Notes to Financial Statements
38
At June 30, 2020 and 2019, investments of approximately $68.6 million and $68.5 million, respectively, were designated for purposes such as specific loan, guarantee or grant programs and are included in investments in the statements of net position. At June 30, 2020 and 2019, current investments included approximately $66.3 million and $73.8 million, respectively, of restricted investments. Non current restricted investments were approximately $12.2 million and $5.0 million as of June 30, 2020 and 2019, respectively. The Agency invests some of its funds in the STAR Fund. The STAR Fund is designed to comply with all Massachusetts statutes and regulations for the allowable investment of funds by the Agency. The Agency’s STAR Fund holdings as of June 30, 2020 and 2019 were approximately $87.2 million, respectively. The Agency’s investments in the STAR Fund in 2020 and 2019 qualified to be reported as cash equivalents as the STAR Fund adheres to GASB Statement No. 79, which establishes accounting and financial reporting standards for state and local governments that participate in a qualifying external investment pool that measures for financial reporting purposes all of its investments at amortized cost. A copy of the financial statements of the STAR Fund can be obtained from the Office of the Chief Financial Officer, Massachusetts Development Finance Agency, 99 High Street, 11th Floor, Boston, MA 02110. As of June 30, 2020, the Agency’s investments by maturity are summarized as follows:
Fair Less More Level InputsInvestment Type Value Than 1 1 to 5 * Than 5 (1, 2, 3)
U.S. Treasury Bonds 25,379,888$ 10,366,740$ 15,013,148$ -$ 1Federal Agency Bonds/Notes 24,373,505 1,276,084 23,097,421 - 2Corporate Notes 13,395,061 13,395,061 - - 2Commercial Paper 9,410,975 9,225,366 185,609 - 2Certificates of Deposit 22,258,609 18,974,303 3,284,306 - 2Asset Backed Securities 13,227,434 131,817 13,095,617 - 2PFM Government Money Market Fund 32,507,835 32,507,835 - - 2U.S. Bank First American U.S. Treasury Fund 3,540,137 3,540,137 - - 2U.S. Bank First American Government Fund 51,470 51,470 - - 2Exchange Traded Fund Bond 1,029,399 - - 1,029,399 2Exchange Traded Fund Equity 622,396 - - 622,396 2Mutual Fund Bond 2,860,434 - - 2,860,434 2Mutual Fund Equity 4,621,932 - - 4,621,932 2Other Guaranteed Investment Contracts 250,450 - - 250,450 N/AStock Warrants 924,000 - - 924,000 3Common Stock 2,252,760 - - 2,252,760 1, 3
156,706,285$ 89,468,813$ 54,676,101$ 12,561,371$
Investment Maturities (in years)
* This rating category includes a structured investment vehicle in commercial paper. This investment has been adjusted to reflect fair market value.
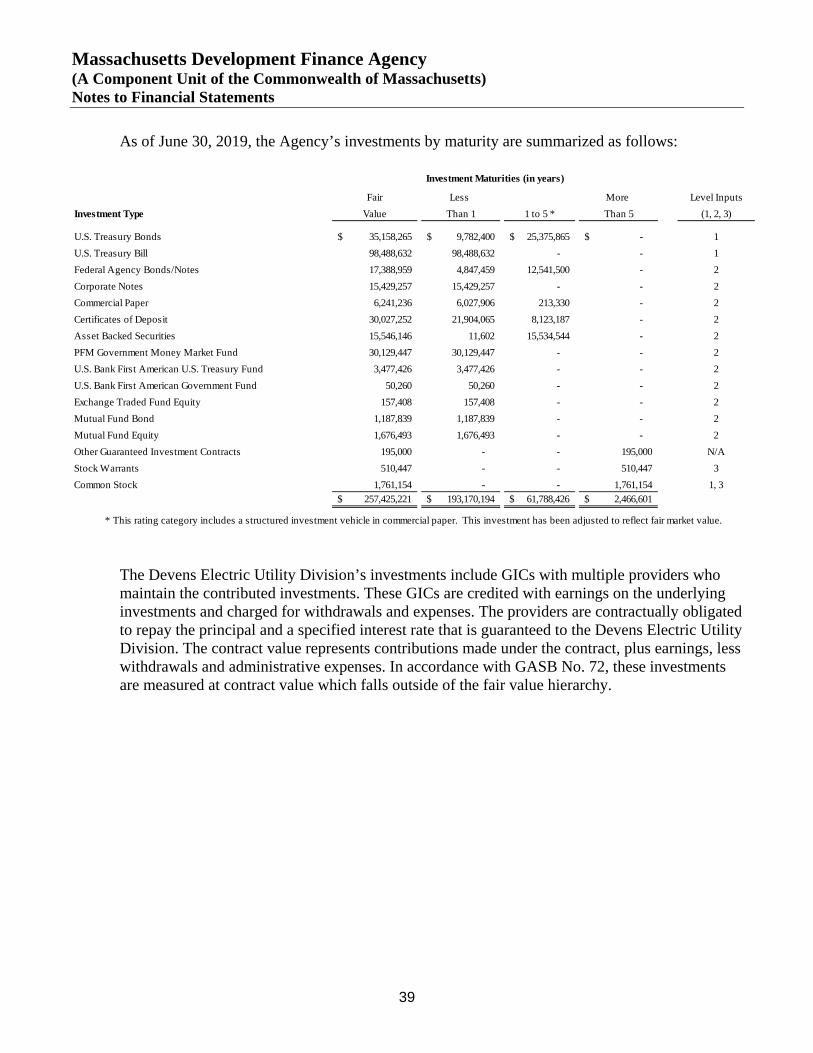
Massachusetts Development Finance Agency (A Component Unit of the Commonwealth of Massachusetts) Notes to Financial Statements
39
As of June 30, 2019, the Agency’s investments by maturity are summarized as follows:
The Devens Electric Utility Division’s investments include GICs with multiple providers who maintain the contributed investments. These GICs are credited with earnings on the underlying investments and charged for withdrawals and expenses. The providers are contractually obligated to repay the principal and a specified interest rate that is guaranteed to the Devens Electric Utility Division. The contract value represents contributions made under the contract, plus earnings, less withdrawals and administrative expenses. In accordance with GASB No. 72, these investments are measured at contract value which falls outside of the fair value hierarchy.
Fair Less More Level InputsInvestment Type Value Than 1 1 to 5 * Than 5 (1, 2, 3)
U.S. Treasury Bonds 35,158,265$ 9,782,400$ 25,375,865$ -$ 1U.S. Treasury Bill 98,488,632 98,488,632 - - 1Federal Agency Bonds/Notes 17,388,959 4,847,459 12,541,500 - 2Corporate Notes 15,429,257 15,429,257 - - 2Commercial Paper 6,241,236 6,027,906 213,330 - 2Certificates of Deposit 30,027,252 21,904,065 8,123,187 - 2Asset Backed Securities 15,546,146 11,602 15,534,544 - 2PFM Government Money Market Fund 30,129,447 30,129,447 - - 2U.S. Bank First American U.S. Treasury Fund 3,477,426 3,477,426 - - 2U.S. Bank First American Government Fund 50,260 50,260 - - 2Exchange Traded Fund Equity 157,408 157,408 - - 2Mutual Fund Bond 1,187,839 1,187,839 - - 2Mutual Fund Equity 1,676,493 1,676,493 - - 2Other Guaranteed Investment Contracts 195,000 - - 195,000 N/AStock Warrants 510,447 - - 510,447 3Common Stock 1,761,154 - - 1,761,154 1, 3
257,425,221$ 193,170,194$ 61,788,426$ 2,466,601$
Investment Maturities (in years)
* This rating category includes a structured investment vehicle in commercial paper. This investment has been adjusted to reflect fair market value.
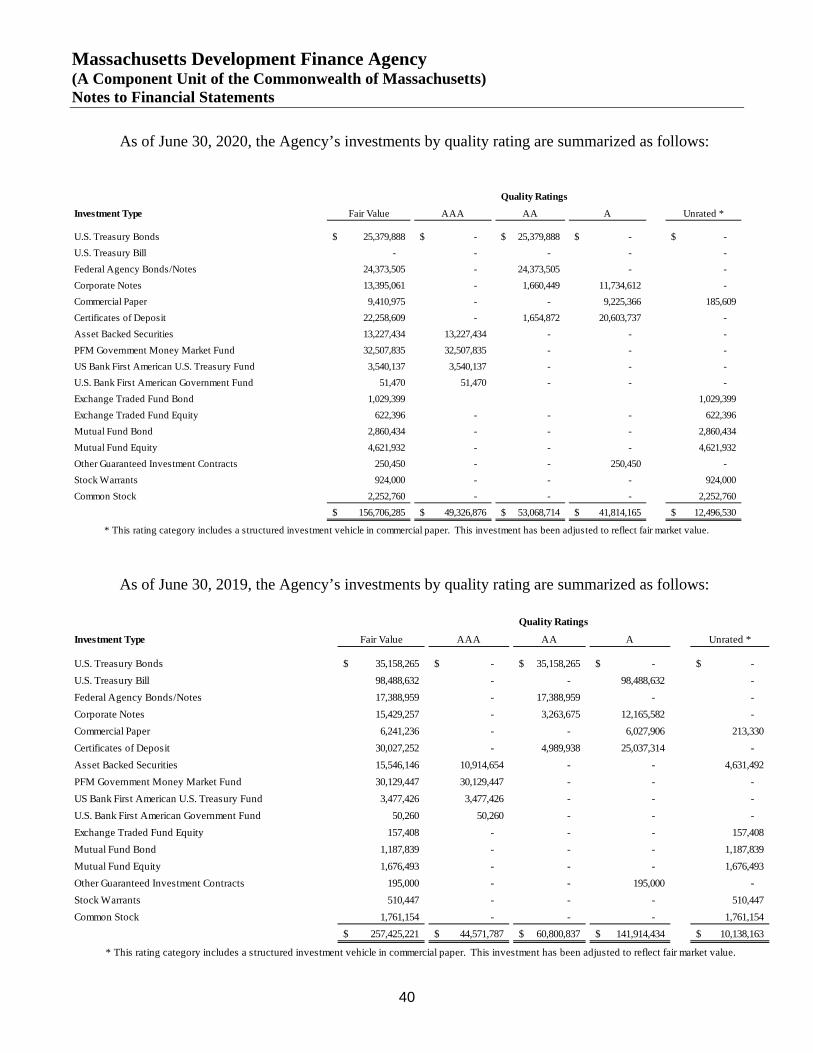
Massachusetts Development Finance Agency (A Component Unit of the Commonwealth of Massachusetts) Notes to Financial Statements
40
As of June 30, 2020, the Agency’s investments by quality rating are summarized as follows:
As of June 30, 2019, the Agency’s investments by quality rating are summarized as follows:
Investment Type Fair Value AAA AA A Unrated *
U.S. Treasury Bonds 25,379,888$ -$ 25,379,888$ -$ -$ U.S. Treasury Bill - - - - - Federal Agency Bonds/Notes 24,373,505 - 24,373,505 - - Corporate Notes 13,395,061 - 1,660,449 11,734,612 - Commercial Paper 9,410,975 - - 9,225,366 185,609 Certificates of Deposit 22,258,609 - 1,654,872 20,603,737 - Asset Backed Securities 13,227,434 13,227,434 - - - PFM Government Money Market Fund 32,507,835 32,507,835 - - - US Bank First American U.S. Treasury Fund 3,540,137 3,540,137 - - - U.S. Bank First American Government Fund 51,470 51,470 - - - Exchange Traded Fund Bond 1,029,399 1,029,399 Exchange Traded Fund Equity 622,396 - - - 622,396 Mutual Fund Bond 2,860,434 - - - 2,860,434 Mutual Fund Equity 4,621,932 - - - 4,621,932 Other Guaranteed Investment Contracts 250,450 - - 250,450 - Stock Warrants 924,000 - - - 924,000 Common Stock 2,252,760 - - - 2,252,760
156,706,285$ 49,326,876$ 53,068,714$ 41,814,165$ 12,496,530$
Quality Ratings
* This rating category includes a structured investment vehicle in commercial paper. This investment has been adjusted to reflect fair market value.
Investment Type Fair Value AAA AA A Unrated *
U.S. Treasury Bonds 35,158,265$ -$ 35,158,265$ -$ -$ U.S. Treasury Bill 98,488,632 - - 98,488,632 - Federal Agency Bonds/Notes 17,388,959 - 17,388,959 - - Corporate Notes 15,429,257 - 3,263,675 12,165,582 - Commercial Paper 6,241,236 - - 6,027,906 213,330 Certificates of Deposit 30,027,252 - 4,989,938 25,037,314 - Asset Backed Securities 15,546,146 10,914,654 - - 4,631,492 PFM Government Money Market Fund 30,129,447 30,129,447 - - - US Bank First American U.S. Treasury Fund 3,477,426 3,477,426 - - - U.S. Bank First American Government Fund 50,260 50,260 - - - Exchange Traded Fund Equity 157,408 - - - 157,408 Mutual Fund Bond 1,187,839 - - - 1,187,839 Mutual Fund Equity 1,676,493 - - - 1,676,493 Other Guaranteed Investment Contracts 195,000 - - 195,000 - Stock Warrants 510,447 - - - 510,447 Common Stock 1,761,154 - - - 1,761,154
257,425,221$ 44,571,787$ 60,800,837$ 141,914,434$ 10,138,163$
Quality Ratings
* This rating category includes a structured investment vehicle in commercial paper. This investment has been adjusted to reflect fair market value.

Massachusetts Development Finance Agency (A Component Unit of the Commonwealth of Massachusetts) Notes to Financial Statements
41
The Agency has loan agreements within the ETP. The ETP is a loan program designed to promote economic development in the emerging technologies sector of the Massachusetts economy. These loans are generally issued to companies that are otherwise unable to obtain market based financing. The majority of these companies are pre-revenue start-up operations which are being incubated through the ETP to promote economic development in the Commonwealth. Certain loan agreements include warrants that qualify as reportable derivative instruments under GASB 53. The value of these warrants is ultimately dependent upon the fair value of the companies which have issued the warrants. The objective of including a warrant in the loan agreement is for the ETP to share in any success the company may achieve if there is an initial public offering or sale of the company. Any successful warrant exercised essentially serves as a yield enhancement to the ETP and any proceeds are deposited back into the ETP. The Agency has developed a reliable estimate of the fair value of the related warrants using a comparable company analysis and last round of financing approach or Black-Scholes method. Privately held warrant and equity-related securities are valued based on an analysis of various factors including, but not limited to: 1) the related company’s operating performance and financial condition, 2) general economic and industry trends, 3) the company’s latest round of financing: 4) price to enterprise value or price to equity ratios, and discounted cash flow, and 5) valuation comparisons to comparable public companies or other industry benchmarks. When an external event occurs, such as a purchase transaction, public offering, or subsequent equity sale, the pricing indicated by that external event is utilized to corroborate the valuation of the warrant and equity-related securities. The Agency periodically reviews the valuation of its portfolio companies that have not been involved in a qualifying external event to determine if the value of the portfolio company may have increased or decreased since the last valuation measurement date.
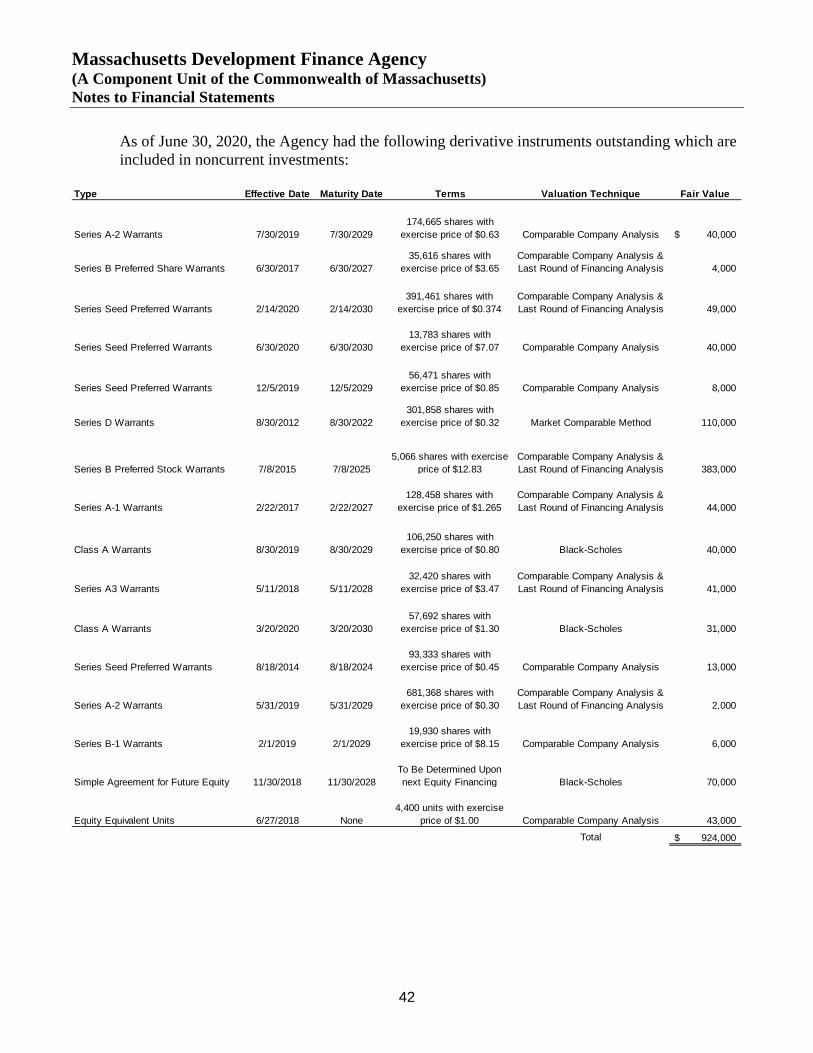
Massachusetts Development Finance Agency (A Component Unit of the Commonwealth of Massachusetts) Notes to Financial Statements
42
As of June 30, 2020, the Agency had the following derivative instruments outstanding which are included in noncurrent investments:
Type Effective Date Maturity Date Terms Valuation Technique Fair Value
Series A-2 Warrants 7/30/2019 7/30/2029174,665 shares with
exercise price of $0.63 Comparable Company Analysis 40,000$
Series B Preferred Share Warrants 6/30/2017 6/30/202735,616 shares with
exercise price of $3.65Comparable Company Analysis & Last Round of Financing Analysis 4,000
Series Seed Preferred Warrants 2/14/2020 2/14/2030391,461 shares with
exercise price of $0.374Comparable Company Analysis & Last Round of Financing Analysis 49,000
Series Seed Preferred Warrants 6/30/2020 6/30/203013,783 shares with
exercise price of $7.07 Comparable Company Analysis 40,000
Series Seed Preferred Warrants 12/5/2019 12/5/202956,471 shares with
exercise price of $0.85 Comparable Company Analysis 8,000
Series D Warrants 8/30/2012 8/30/2022301,858 shares with
exercise price of $0.32 Market Comparable Method 110,000
Series B Preferred Stock Warrants 7/8/2015 7/8/20255,066 shares with exercise
price of $12.83Comparable Company Analysis & Last Round of Financing Analysis 383,000
Series A-1 Warrants 2/22/2017 2/22/2027128,458 shares with
exercise price of $1.265Comparable Company Analysis & Last Round of Financing Analysis 44,000
Class A Warrants 8/30/2019 8/30/2029106,250 shares with
exercise price of $0.80 Black-Scholes 40,000
Series A3 Warrants 5/11/2018 5/11/202832,420 shares with
exercise price of $3.47Comparable Company Analysis & Last Round of Financing Analysis 41,000
Class A Warrants 3/20/2020 3/20/203057,692 shares with
exercise price of $1.30 Black-Scholes 31,000
Series Seed Preferred Warrants 8/18/2014 8/18/202493,333 shares with
exercise price of $0.45 Comparable Company Analysis 13,000
Series A-2 Warrants 5/31/2019 5/31/2029681,368 shares with
exercise price of $0.30Comparable Company Analysis & Last Round of Financing Analysis 2,000
Series B-1 Warrants 2/1/2019 2/1/202919,930 shares with
exercise price of $8.15 Comparable Company Analysis 6,000
Simple Agreement for Future Equity 11/30/2018 11/30/2028To Be Determined Upon next Equity Financing Black-Scholes 70,000
Equity Equivalent Units 6/27/2018 None4,400 units with exercise
price of $1.00 Comparable Company Analysis 43,000 Total 924,000$
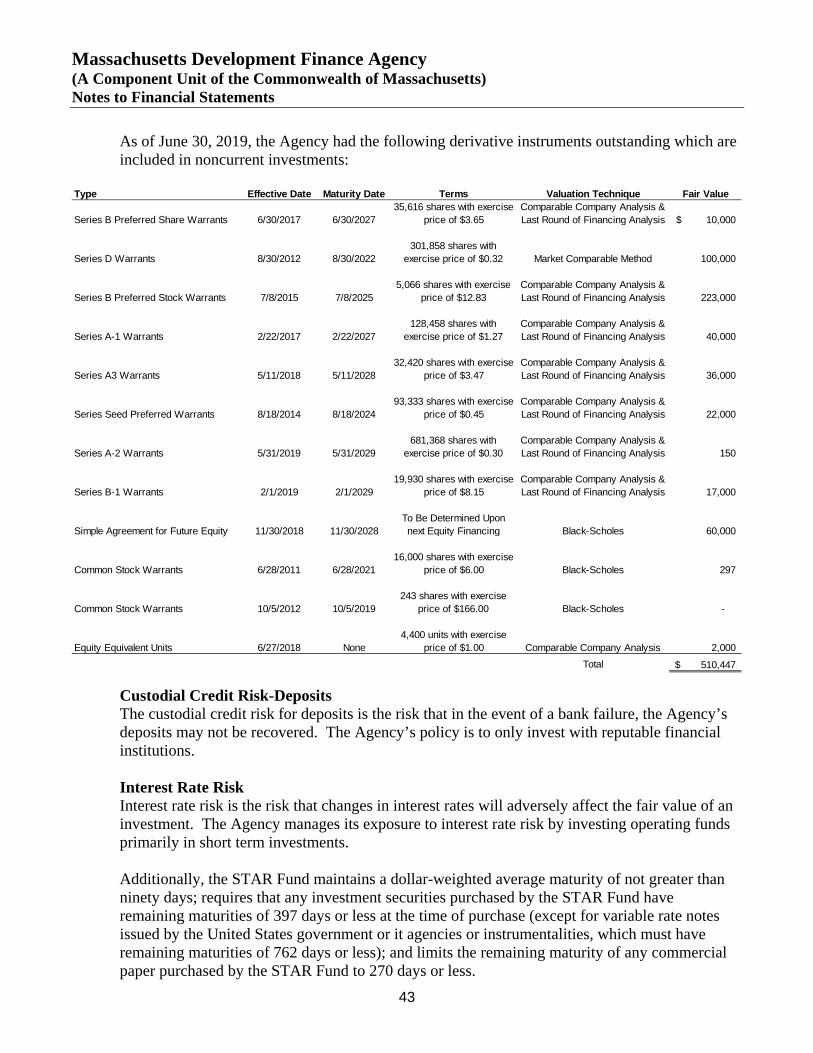
Massachusetts Development Finance Agency (A Component Unit of the Commonwealth of Massachusetts) Notes to Financial Statements
43
As of June 30, 2019, the Agency had the following derivative instruments outstanding which are included in noncurrent investments:
Custodial Credit Risk-Deposits The custodial credit risk for deposits is the risk that in the event of a bank failure, the Agency’s deposits may not be recovered. The Agency’s policy is to only invest with reputable financial institutions. Interest Rate Risk Interest rate risk is the risk that changes in interest rates will adversely affect the fair value of an investment. The Agency manages its exposure to interest rate risk by investing operating funds primarily in short term investments. Additionally, the STAR Fund maintains a dollar-weighted average maturity of not greater than ninety days; requires that any investment securities purchased by the STAR Fund have remaining maturities of 397 days or less at the time of purchase (except for variable rate notes issued by the United States government or it agencies or instrumentalities, which must have remaining maturities of 762 days or less); and limits the remaining maturity of any commercial paper purchased by the STAR Fund to 270 days or less.
Type Effective Date Maturity Date Terms Valuation Technique Fair Value
Series B Preferred Share Warrants 6/30/2017 6/30/202735,616 shares with exercise
price of $3.65Comparable Company Analysis & Last Round of Financing Analysis 10,000$
Series D Warrants 8/30/2012 8/30/2022301,858 shares with
exercise price of $0.32 Market Comparable Method 100,000
Series B Preferred Stock Warrants 7/8/2015 7/8/20255,066 shares with exercise
price of $12.83Comparable Company Analysis & Last Round of Financing Analysis 223,000
Series A-1 Warrants 2/22/2017 2/22/2027128,458 shares with
exercise price of $1.27Comparable Company Analysis & Last Round of Financing Analysis 40,000
Series A3 Warrants 5/11/2018 5/11/202832,420 shares with exercise
price of $3.47Comparable Company Analysis & Last Round of Financing Analysis 36,000
Series Seed Preferred Warrants 8/18/2014 8/18/202493,333 shares with exercise
price of $0.45Comparable Company Analysis & Last Round of Financing Analysis 22,000
Series A-2 Warrants 5/31/2019 5/31/2029681,368 shares with
exercise price of $0.30Comparable Company Analysis & Last Round of Financing Analysis 150
Series B-1 Warrants 2/1/2019 2/1/202919,930 shares with exercise
price of $8.15Comparable Company Analysis & Last Round of Financing Analysis 17,000
Simple Agreement for Future Equity 11/30/2018 11/30/2028To Be Determined Upon next Equity Financing Black-Scholes 60,000
Common Stock Warrants 6/28/2011 6/28/202116,000 shares with exercise
price of $6.00 Black-Scholes 297
Common Stock Warrants 10/5/2012 10/5/2019243 shares with exercise
price of $166.00 Black-Scholes -
Equity Equivalent Units 6/27/2018 None4,400 units with exercise
price of $1.00 Comparable Company Analysis 2,000 Total 510,447$

Massachusetts Development Finance Agency (A Component Unit of the Commonwealth of Massachusetts) Notes to Financial Statements
44
Credit Risk Credit risk is the risk that the Agency’s investments will be negatively impacted due to the default of the Agency’s investments. According to the Agency’s investment policy, investments must be prime quality and rated no less than A by either Moody’s, Standard and Poor’s, or Fitch. Concentration of Credit Risk Concentration of credit risk is assumed to arise when the amount of cash and investments that the Agency has with any one issuer exceeds five percent of the total value of the Agency’s investments. As of June 30, 2020, the cash, cash equivalents and investments held in any one issuer over five percent of the total value of the Agency’s investments included $32.5 million invested in a government money market fund (11.7%). As of June 30, 2019, the cash, cash equivalents and investments held in any one issuer over five percent of the total value of the Agency’s investments included $30.1 million invested in a government money market fund (20.8%) and $98.5 million in a U.S. Treasury Bill (38.3%). Foreign Currency Risk The investment policy of the Agency limits the Agency’s foreign currency risk by excluding foreign investments as an investment option.
5. Investments in Joint Ventures
The Agency has a participating interest in seventeen joint ventures, which are accounted for on the equity method of accounting. With this method, the Agency, reports its proportional share of revenue or expense on the statement of revenues, expenses and changes in net position. Upon dissolution of the respective joint venture, proceeds will be distributed according to the terms of the joint venture agreements of each respective member. The following is a summary of the Agency’s investment in joint ventures at June 30:
Share ofCapital Operating
June 30, 2019 Contributions Distributions Income June 30, 2020
Investment in Hospital Hill LLC 699,083$ 40,910$ (319,882)$ 75,211$ 495,322$ Investment in Commonwealth Fund III LLC 4,258,727 14,500 - 740,266 5,013,493 Investments in NMTC entities 16,522 - (465) 180 16,237
4,974,332$ 55,410$ (320,347)$ 815,657$ 5,525,052$
Share of Capital Operating (Loss)
June 30, 2018 Contributions Distributions Income June 30, 2019
Investment in Hospital Hill LLC 2,243,205$ 35,276$ (97,030)$ (1,482,368)$ 699,083$ Investment in Commonwealth Fund III LLC 4,554,431 - - (295,704) 4,258,727 Investments in NMTC entities 17,162 2,300 (3,161) 221 16,522
6,814,798$ 37,576$ (100,191)$ (1,777,851)$ 4,974,332$
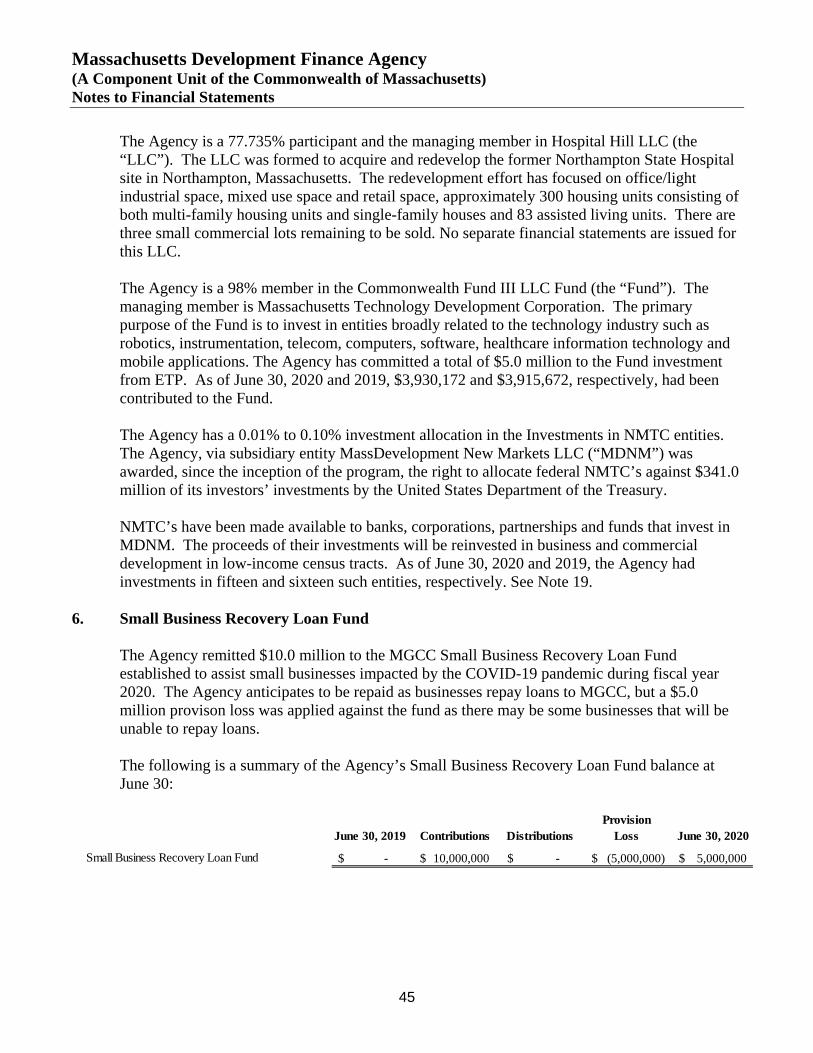
Massachusetts Development Finance Agency (A Component Unit of the Commonwealth of Massachusetts) Notes to Financial Statements
45
The Agency is a 77.735% participant and the managing member in Hospital Hill LLC (the “LLC”). The LLC was formed to acquire and redevelop the former Northampton State Hospital site in Northampton, Massachusetts. The redevelopment effort has focused on office/light industrial space, mixed use space and retail space, approximately 300 housing units consisting of both multi-family housing units and single-family houses and 83 assisted living units. There are three small commercial lots remaining to be sold. No separate financial statements are issued for this LLC. The Agency is a 98% member in the Commonwealth Fund III LLC Fund (the “Fund”). The managing member is Massachusetts Technology Development Corporation. The primary purpose of the Fund is to invest in entities broadly related to the technology industry such as robotics, instrumentation, telecom, computers, software, healthcare information technology and mobile applications. The Agency has committed a total of $5.0 million to the Fund investment from ETP. As of June 30, 2020 and 2019, $3,930,172 and $3,915,672, respectively, had been contributed to the Fund. The Agency has a 0.01% to 0.10% investment allocation in the Investments in NMTC entities. The Agency, via subsidiary entity MassDevelopment New Markets LLC (“MDNM”) was awarded, since the inception of the program, the right to allocate federal NMTC’s against $341.0 million of its investors’ investments by the United States Department of the Treasury. NMTC’s have been made available to banks, corporations, partnerships and funds that invest in MDNM. The proceeds of their investments will be reinvested in business and commercial development in low-income census tracts. As of June 30, 2020 and 2019, the Agency had investments in fifteen and sixteen such entities, respectively. See Note 19.
6. Small Business Recovery Loan Fund The Agency remitted $10.0 million to the MGCC Small Business Recovery Loan Fund established to assist small businesses impacted by the COVID-19 pandemic during fiscal year 2020. The Agency anticipates to be repaid as businesses repay loans to MGCC, but a $5.0 million provison loss was applied against the fund as there may be some businesses that will be unable to repay loans. The following is a summary of the Agency’s Small Business Recovery Loan Fund balance at June 30:
ProvisionJune 30, 2019 Contributions Distributions Loss June 30, 2020
Small Business Recovery Loan Fund -$ 10,000,000$ -$ (5,000,000)$ 5,000,000$

Massachusetts Development Finance Agency (A Component Unit of the Commonwealth of Massachusetts) Notes to Financial Statements
46
7. Loans Receivable
The following is a summary of the Agency’s loans receivable as of June 30:
Most loans are collateralized by a first or shared first position in the underlying collateral. As of June 30, 2020 and 2019, 12 loans totaling $6.7 million and 16 loans totaling $8.6 million, respectively, are collateralized by second positions in the underlying property. Also, as of June 30, 2020 and 2019, three loans totaling $0.7 million, respectively, are collateralized by third and fourth positions. As of June 30, 2020 and 2019, one loan totaling $0.05 million and $0.3 million, respectively, is unsecured. There were approximately $2.0 million and $0.9 million net loans receivable that were considered nonaccrual loans as of June 30, 2020 and 2019, respectively. All payments received from borrowers for nonaccrual loans are applied to the principal balance of the loan.
8. Interest Receivable The following is a summary of the Agency’s interest receivable at June 30:
Interest receivable includes amounts earned but not received on both investments and loans, net of an allowance for doubtful accounts. When the Agency believes the collectability of the interest is unlikely, a reserve against interest is charged as a component of the allowance for doubtful accounts. As of June 30, 2020 and 2019, no allowance was deemed necessary.
Disbursements (Collections)/June 30, 2019 (Provisions, net) Write-offs June 30, 2020
Loans receivable 84,727,344$ 24,472,917$ (17,528,741)$ 91,671,520$ Less: allowance for loan loss (9,802,777) (851,903) 706,210 (9,948,470)
74,924,567$ 23,621,014$ (16,822,531)$ 81,723,050$
Disbursements (Collections)/June 30, 2018 (Provisions, net) Write-offs June 30, 2019
Loans receivable 104,909,319$ 22,523,738$ (42,705,713)$ 84,727,344$ Less: allowance for loan loss (11,481,576) 523,163 1,155,636 (9,802,777)
93,427,743$ 23,046,901$ (41,550,077)$ 74,924,567$
2020 2019
Investment interest 416,127$ 693,993$ Loan interest 370,292 280,947
786,419$ 974,940$

Massachusetts Development Finance Agency (A Component Unit of the Commonwealth of Massachusetts) Notes to Financial Statements
47
9. Predevelopment and Brownfield Receivables The following is a summary of the Agency’s predevelopment and brownfield receivables as of June 30:
Predevelopment and Brownfield receivables represent amounts advanced to organizations for the purpose of conducting market analysis and feasibility studies for expansion of operations. Advanced funds are recovered in accordance with individual terms as stated in the memoranda of agreement and evaluation of collectability. In addition to the advances noted above, the Agency awarded approximately $0.5 million of Predevelopment and Brownfield grant awards during fiscal years 2020 and 2019, respectively, which are included in the statements of revenues, expenses and changes in net position.
Disbursements (Collections)/June 30, 2019 (Provision, net) Write-offs June 30, 2020
Predevelopment and Brownfield receivables 10,092,989$ 2,687,809$ (244,881)$ 12,535,917$ Less: accumulated provision (9,233,589) (2,628,379) 242,981 (11,618,987)
859,400$ 59,430$ (1,900)$ 916,930$
Disbursements (Collections)/June 30, 2018 (Provision, net) Write-offs June 30, 2019
Predevelopment and Brownfield receivables 10,273,174$ 1,774,488$ (1,954,673)$ 10,092,989$ Less: accumulated provision (9,416,318) (1,621,104) 1,803,833 (9,233,589)
856,856$ 153,384$ (150,840)$ 859,400$
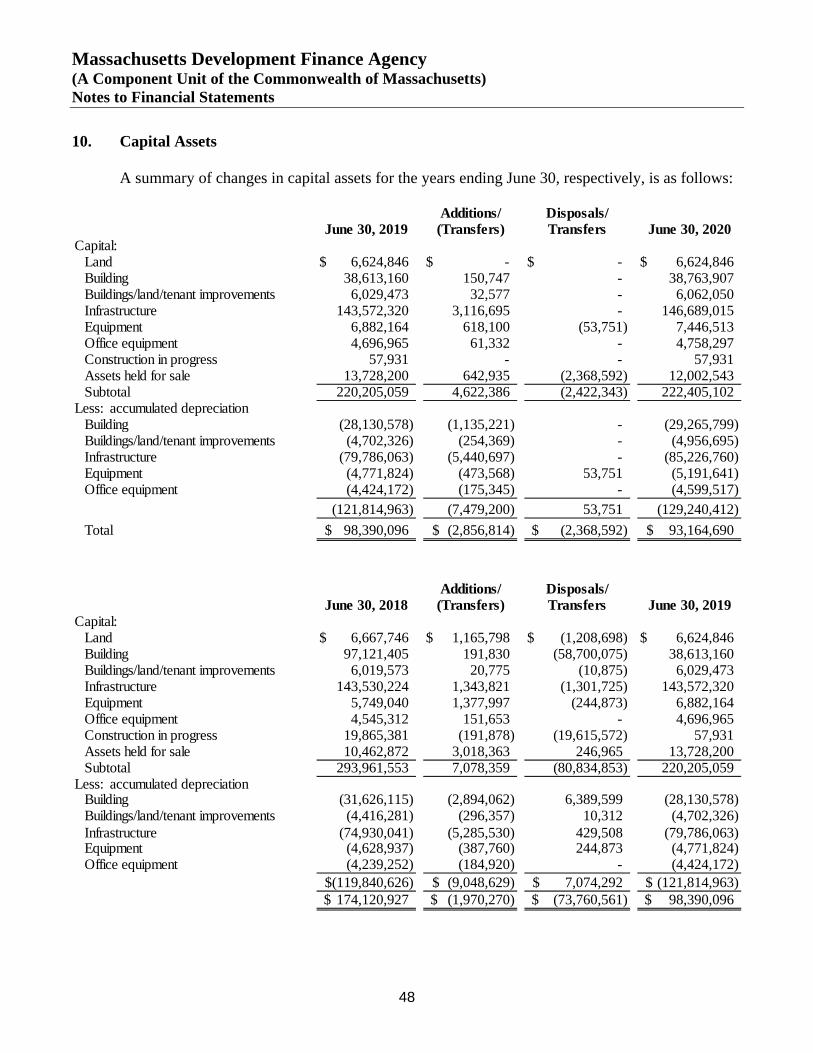
Massachusetts Development Finance Agency (A Component Unit of the Commonwealth of Massachusetts) Notes to Financial Statements
48
10. Capital Assets A summary of changes in capital assets for the years ending June 30, respectively, is as follows:
Additions/ Disposals/June 30, 2019 (Transfers) Transfers June 30, 2020
Capital:Land 6,624,846$ -$ -$ 6,624,846$ Building 38,613,160 150,747 - 38,763,907 Buildings/land/tenant improvements 6,029,473 32,577 - 6,062,050 Infrastructure 143,572,320 3,116,695 - 146,689,015 Equipment 6,882,164 618,100 (53,751) 7,446,513 Office equipment 4,696,965 61,332 - 4,758,297 Construction in progress 57,931 - - 57,931 Assets held for sale 13,728,200 642,935 (2,368,592) 12,002,543 Subtotal 220,205,059 4,622,386 (2,422,343) 222,405,102
Less: accumulated depreciationBuilding (28,130,578) (1,135,221) - (29,265,799)Buildings/land/tenant improvements (4,702,326) (254,369) - (4,956,695)Infrastructure (79,786,063) (5,440,697) - (85,226,760)Equipment (4,771,824) (473,568) 53,751 (5,191,641)Office equipment (4,424,172) (175,345) - (4,599,517)
(121,814,963) (7,479,200) 53,751 (129,240,412)Total 98,390,096$ (2,856,814)$ (2,368,592)$ 93,164,690$
Additions/ Disposals/June 30, 2018 (Transfers) Transfers June 30, 2019
Capital:Land 6,667,746$ 1,165,798$ (1,208,698)$ 6,624,846$ Building 97,121,405 191,830 (58,700,075) 38,613,160 Buildings/land/tenant improvements 6,019,573 20,775 (10,875) 6,029,473 Infrastructure 143,530,224 1,343,821 (1,301,725) 143,572,320 Equipment 5,749,040 1,377,997 (244,873) 6,882,164 Office equipment 4,545,312 151,653 - 4,696,965 Construction in progress 19,865,381 (191,878) (19,615,572) 57,931 Assets held for sale 10,462,872 3,018,363 246,965 13,728,200 Subtotal 293,961,553 7,078,359 (80,834,853) 220,205,059
Less: accumulated depreciationBuilding (31,626,115) (2,894,062) 6,389,599 (28,130,578)Buildings/land/tenant improvements (4,416,281) (296,357) 10,312 (4,702,326)Infrastructure (74,930,041) (5,285,530) 429,508 (79,786,063)Equipment (4,628,937) (387,760) 244,873 (4,771,824)Office equipment (4,239,252) (184,920) - (4,424,172)
(119,840,626)$ (9,048,629)$ 7,074,292$ (121,814,963)$ 174,120,927$ (1,970,270)$ (73,760,561)$ 98,390,096$
Massachusetts Development Finance Agency (A Component Unit of the Commonwealth of Massachusetts) Notes to Financial Statements
49
Devens As of June 30, 2020 and 2019, the Agency had cumulative net costs associated with the development of Devens, including utilities, of approximately $76.4 million and $79.2 million, respectively, which are included in capital assets. The related depreciation expense for the years ended June 30, 2020 and 2019 was approximately $6.7 million and $6.5 million, respectively. There were no sales at Devens during fiscal year 2020. The Agency had three lot sales at Devens during fiscal year 2019 resulting in gross sales proceeds of $1,894,500 and net gains of $775,229. The gains on sale were deferred and reported as other liabilities at June 30, 2019 as the conditions in the repurchase clauses had not been satisfied at year end. Boston The Agency purchased two buildings in Boston, MA in December 2016 for a purchase price of $57.4 million. The buildings were being redeveloped and General Electric planned on relocating its headquarters to these buildings and was going to lease the buildings under a 20 year lease. The related depreciation expense for the year ended June 30, 2019 was approximately $1.7 million. The Agency was awarded two grant commitments totaling $125.0 million from the Commonwealth in support of the acquisition and redevelopment of the buildings. Approximately $16.7 million in grant income was recognized during fiscal year 2019 in relation to the redevelopment. The Agency sold these buildings during fiscal year 2019 resulting in gross sales proceeds of $98,165,144 and a net gain of $26,785,121. The net gain is included as a special item on the statement of revenues, expenses and changes in net position as of June 30, 2019. The sales proceeds were being held in a U.S. Treasury Bill and were included as a short term investment and in due to Commonwealth of Massachusetts in the statement of net position as of June 30, 2019 because the funds were expected to be remitted to the Commonwealth during fiscal year 2020. The Agency did remit $86,200,000 to the Commonwealth during fiscal year 2020. The remaining $11,965,144 is included in due to the Commonwealth of Massachusetts in the statement of net position as of June 30, 2020. Springfield The Agency purchased a building at 1550 Main Street in Springfield, Massachusetts in September 2009 for a purchase price of $2.5 million. The Agency has cumulative net costs associated with 1550 Main Street of approximately $4.3 million and $4.9 million as of June 30, 2020 and 2019, respectively, which is included in capital assets. The related depreciation expense for the years ended June 30, 2020 and 2019 was $619,676 and $679,020, respectively.
The Agency purchased a building at 8-12 Stearns Square in Springfield, Massachusetts in October 2015 for a purchase price of $604,350 and had $1,872,520 of improvements to the building. During fiscal year 2020, the Agency sold this building resulting in gross sales proceeds of $100 and a net loss of $2,368,592.

Massachusetts Development Finance Agency (A Component Unit of the Commonwealth of Massachusetts) Notes to Financial Statements
50
Taunton In January 2012, the Agency, in partnership with TDMDC, purchased from the Commonwealth the former Dever State School core campus in Taunton, MA. The Agency has cumulative net redevelopment capital on the property of approximately $9.3 million and $8.9 million as of June 30, 2020 and 2019, respectively, which is included in assets held for sale. The Agency had one lot sale at the Taunton property during fiscal year 2019 resulting in gross sales proceeds of $1,638,500 and a net gain of $335,809. The gain on sale was deferred and reported as other liabilities at June 30, 2019 as the conditions in the repurchase clause had not been satisfied at year end. This net gain on sale was recognized during fiscal year 2020 as the conditions in the repurchase clause were satisfied during the fiscal year. There were no lot sales during fiscal year 2020. Leases The Agency leases office, commercial, and retail space in Springfield, Devens and Taunton. Rental income is included in other revenues in the statement of revenues, expenses and changes in net position. At June 30, 2020, the Agency had minimum future rental income, under long-term non-cancelable operating leases with various expiration dates through fiscal year 2062, for facilities over the next five years as follows:
11. Outstanding Loans, Commitments and Revenue Bonds Issued
The Agency issued loans under its economic development programs aggregating $24.5 million and $22.5 million during fiscal years 2020 and 2019, respectively. The Agency has committed to issuing an additional $12.3 million and $7.3 million of loans as of June 30, 2020 and 2019, respectively.
Fiscal Year Rental Income2021 2,482,033$ 2022 2,417,872 2023 1,788,167 2024 1,660,666 2025 1,270,217 Total 9,618,955$
Operating Leases

Massachusetts Development Finance Agency (A Component Unit of the Commonwealth of Massachusetts) Notes to Financial Statements
51
Leases At June 30, 2020, the Agency had minimum future rental commitments under long-term non-cancelable operating leases for facilities for the next five years as follows:
The Agency leases office space in Boston and Devens, Massachusetts and various other cities for regional offices throughout Massachusetts. Rent expense included in the accompanying statement of revenues, expenses and changes in net position was approximately $1.4 million and $1.6 million, respectively, for fiscal years 2020 and 2019. Bond Issuance Program The Agency’s Bond Issuance Program assisted in the issuance of taxable and tax-exempt bonds and lease transactions on behalf of client institutions through its bond financing program on 75 projects aggregating approximately $2.6 billion during fiscal year 2020 and 58 projects aggregating approximately $2.0 billion during fiscal year 2019. These debt obligations are conduit transactions and do not constitute a debt or liability of the Agency, therefore, these financing transactions are not included in the accompanying financial statements. The Agency earned bond issuance fee revenues related to these financings of approximately $6.4 million and $5.5 million in fiscal years 2020 and 2019, respectively, and are included as a component of bond issuance and new markets tax credit fees in the statements of revenues, expenses and changes in net position. Commitments The Devens Electric Utility Division uses Master Power Supply Agreements to procure necessary power supply requirements from time to time as market and load growth conditions dictate. Currently, the Devens Electric Utility Division has secured 60% of its 2020 power supply requirements with confirmations in place with BP Energy, Exelon, NextEra and Shell Energy. Additional confirmation transactions are in place with these same providers in varying quantities to secure between 40% - 50% of the load requirements from 2020 through 2023. An additional 10% of power supply needs are met through long-term contracts in place with several solar providers and one wind turbine provider. Total secured power supply for Devens with all combined resources is between 50% - 70% of total power supply needs with a diversified portfolio of qualified suppliers through 2023. The balance of the load requirements is purchased in the ISO New England managed real time and day ahead markets at market pricing.
Rent Expense
2021 1,492,295$ 2022 1,482,4132023 1,304,7422024 1,321,5582025 1,187,549
6,788,556$
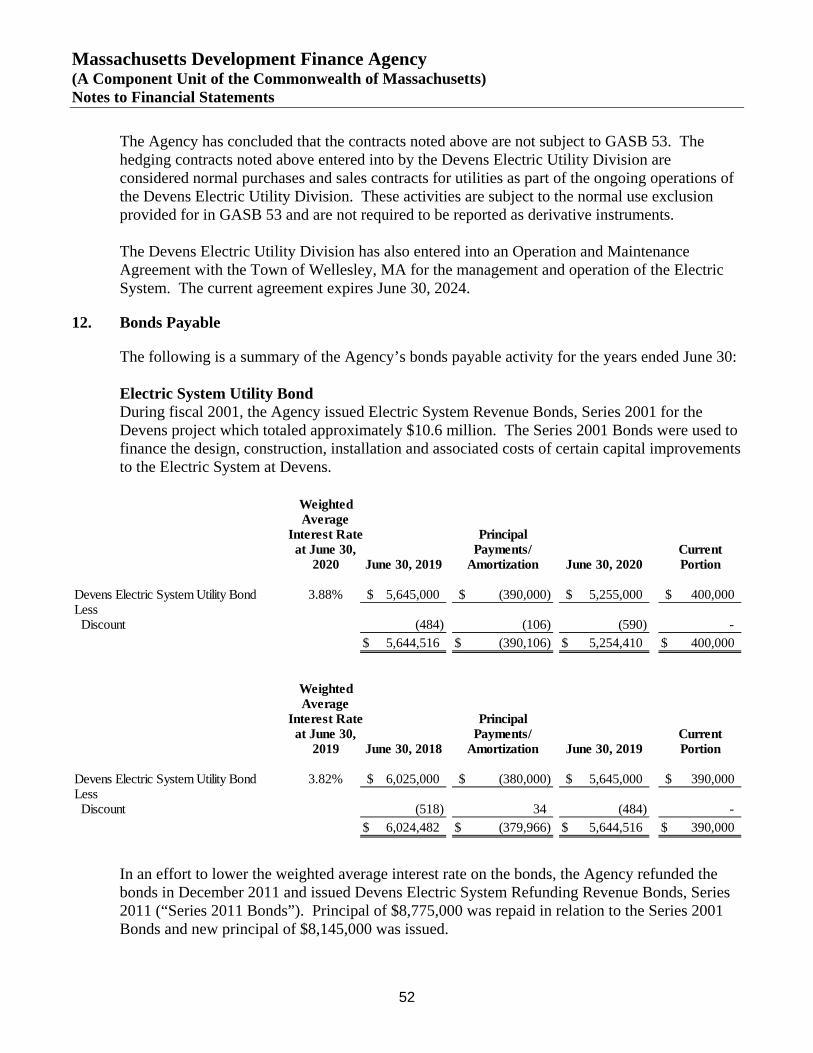
Massachusetts Development Finance Agency (A Component Unit of the Commonwealth of Massachusetts) Notes to Financial Statements
52
The Agency has concluded that the contracts noted above are not subject to GASB 53. The hedging contracts noted above entered into by the Devens Electric Utility Division are considered normal purchases and sales contracts for utilities as part of the ongoing operations of the Devens Electric Utility Division. These activities are subject to the normal use exclusion provided for in GASB 53 and are not required to be reported as derivative instruments.
The Devens Electric Utility Division has also entered into an Operation and Maintenance Agreement with the Town of Wellesley, MA for the management and operation of the Electric System. The current agreement expires June 30, 2024.
12. Bonds Payable
The following is a summary of the Agency’s bonds payable activity for the years ended June 30: Electric System Utility Bond During fiscal 2001, the Agency issued Electric System Revenue Bonds, Series 2001 for the Devens project which totaled approximately $10.6 million. The Series 2001 Bonds were used to finance the design, construction, installation and associated costs of certain capital improvements to the Electric System at Devens.
In an effort to lower the weighted average interest rate on the bonds, the Agency refunded the bonds in December 2011 and issued Devens Electric System Refunding Revenue Bonds, Series 2011 (“Series 2011 Bonds”). Principal of $8,775,000 was repaid in relation to the Series 2001 Bonds and new principal of $8,145,000 was issued.
WeightedAverage
Interest Rate Principalat June 30, Payments/ Current
2020 June 30, 2019 Amortization June 30, 2020 Portion
Devens Electric System Utility Bond 3.88% 5,645,000$ (390,000)$ 5,255,000$ 400,000$ Less Discount (484) (106) (590) -
5,644,516$ (390,106)$ 5,254,410$ 400,000$
WeightedAverage
Interest Rate Principalat June 30, Payments/ Current
2019 June 30, 2018 Amortization June 30, 2019 Portion
Devens Electric System Utility Bond 3.82% 6,025,000$ (380,000)$ 5,645,000$ 390,000$ Less Discount (518) 34 (484) -
6,024,482$ (379,966)$ 5,644,516$ 390,000$
Massachusetts Development Finance Agency (A Component Unit of the Commonwealth of Massachusetts) Notes to Financial Statements
53
The Series 2011 Bonds are collateralized by a pledge of the Electric System's revenues and certain funds and accounts established under the bond. The Series 2011 Bonds carry a long-term Standard & Poor’s rating of A. The credit rating was upgraded from A- to A as part of the issuance of the bonds during fiscal year 2012. Total principal and interest remaining on the bonds is $6,540,766, payable through June 30, 2031. For the current fiscal year, principal and interest paid was $601,256 and total funds and debt service related accounts of the Devens Electric Utility System were $8,796,698. Total revenues of the Devens Electric Utility System were $18,935,167 for the current fiscal year.
The bond documents require the maintenance of certain funds of the Project. Below are certain funds balances as of June 30, 2020 and 2019 which are included in restricted cash and cash equivalents on the statements of net position.
• The Revenue Fund had balances of $8,539,856 and $6,616,938, respectively. All revenues generated by the Electric System, exclusive of interest income, are deposited into the Revenue Fund. Funds are transferred from the Revenue Fund to other funds of the Electric System according to the bond resolution agreement.
• The Capital Upgrade Reserve Fund had balances of $5,561,883 and $5,481,786, respectively. The Capital Upgrade Reserve Fund may be used to fund capital improvements to the Electric System. If excess funds exist in the Capital Upgrade Reserve Fund these excess funds may be used to cover any operating shortfalls. There were no transfers during fiscal years 2020 and 2019.
• The Operating/Rate Stabilization Reserve Fund had balances of $3,347,948 and $3,299,735, respectively. There were no transfers during fiscal years 2020 and 2019. The Operating/Rate Stabilization Reserve Fund may be used to fund operating expenses of the Electric System when there are not sufficient funds available from operations. No funds were used in fiscal years 2020 and 2019 for this purpose.
Excess balances in the Revenue Fund may be transferred to the Agency, free and clear of the lien of the bond resolution, if all funding requirements are met and the debt service coverage requirement of 1.5 has been met, cumulatively, during the twelve consecutive months prior to the transfer date.
Principal payments are due annually through 2030. Interest expense related to this bond was $211,256 and $222,806 for the year ended June 30, 2020 and 2019, respectively. The Devens Electric System Utility Bond agreement requires the maintenance of a minimum debt service coverage ratio. Failure to comply with the minimum debt service covenant does not constitute a default, as long as the Agency complies with specific requirements included in the agreement. As of June 30, 2020 and 2019, the necessary debt service coverage was met.
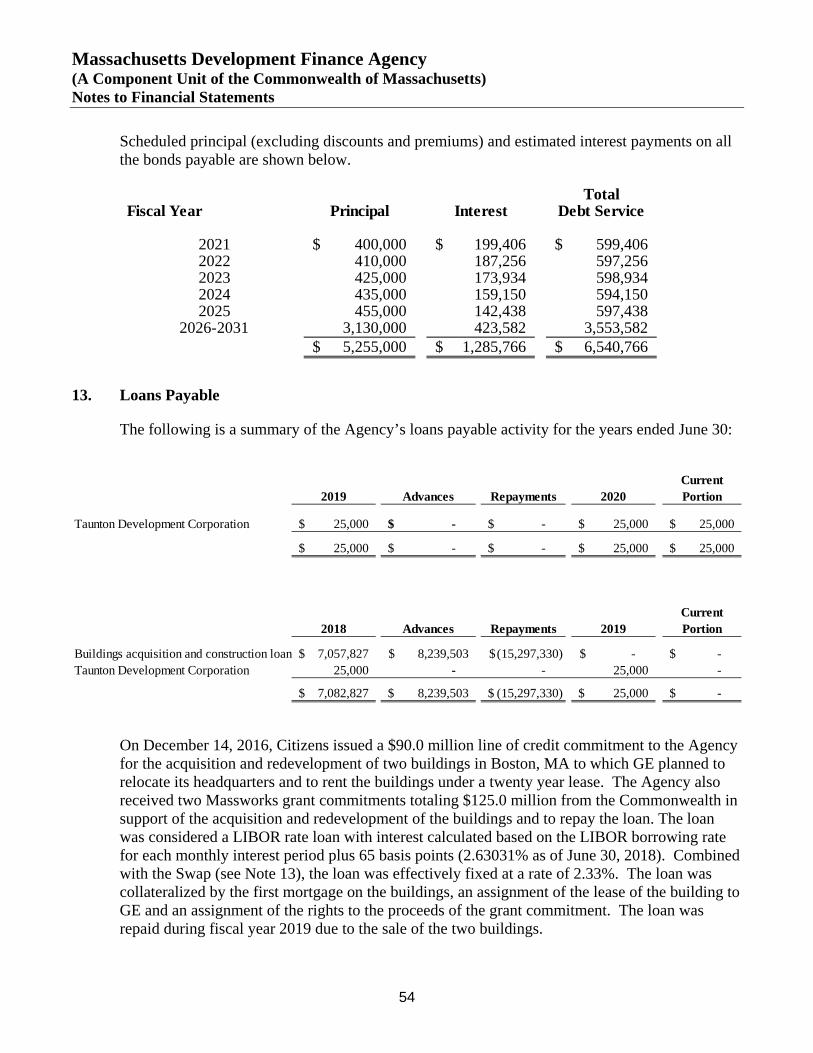
Massachusetts Development Finance Agency (A Component Unit of the Commonwealth of Massachusetts) Notes to Financial Statements
54
Scheduled principal (excluding discounts and premiums) and estimated interest payments on all the bonds payable are shown below.
13. Loans Payable
The following is a summary of the Agency’s loans payable activity for the years ended June 30:
On December 14, 2016, Citizens issued a $90.0 million line of credit commitment to the Agency for the acquisition and redevelopment of two buildings in Boston, MA to which GE planned to relocate its headquarters and to rent the buildings under a twenty year lease. The Agency also received two Massworks grant commitments totaling $125.0 million from the Commonwealth in support of the acquisition and redevelopment of the buildings and to repay the loan. The loan was considered a LIBOR rate loan with interest calculated based on the LIBOR borrowing rate for each monthly interest period plus 65 basis points (2.63031% as of June 30, 2018). Combined with the Swap (see Note 13), the loan was effectively fixed at a rate of 2.33%. The loan was collateralized by the first mortgage on the buildings, an assignment of the lease of the building to GE and an assignment of the rights to the proceeds of the grant commitment. The loan was repaid during fiscal year 2019 due to the sale of the two buildings.
TotalFiscal Year Principal Interest Debt Service
2021 400,000$ 199,406$ 599,406$ 2022 410,000 187,256 597,2562023 425,000 173,934 598,9342024 435,000 159,150 594,1502025 455,000 142,438 597,438
2026-2031 3,130,000 423,582 3,553,5825,255,000$ 1,285,766$ 6,540,766$
Current2019 Advances Repayments 2020 Portion
Taunton Development Corporation 25,000$ -$ -$ 25,000$ 25,000$
25,000$ -$ -$ 25,000$ 25,000$
Current2018 Advances Repayments 2019 Portion
Buildings acquisition and construction loan 7,057,827$ 8,239,503$ (15,297,330)$ -$ -$ Taunton Development Corporation 25,000 - - 25,000 -
7,082,827$ 8,239,503$ (15,297,330)$ 25,000$ -$
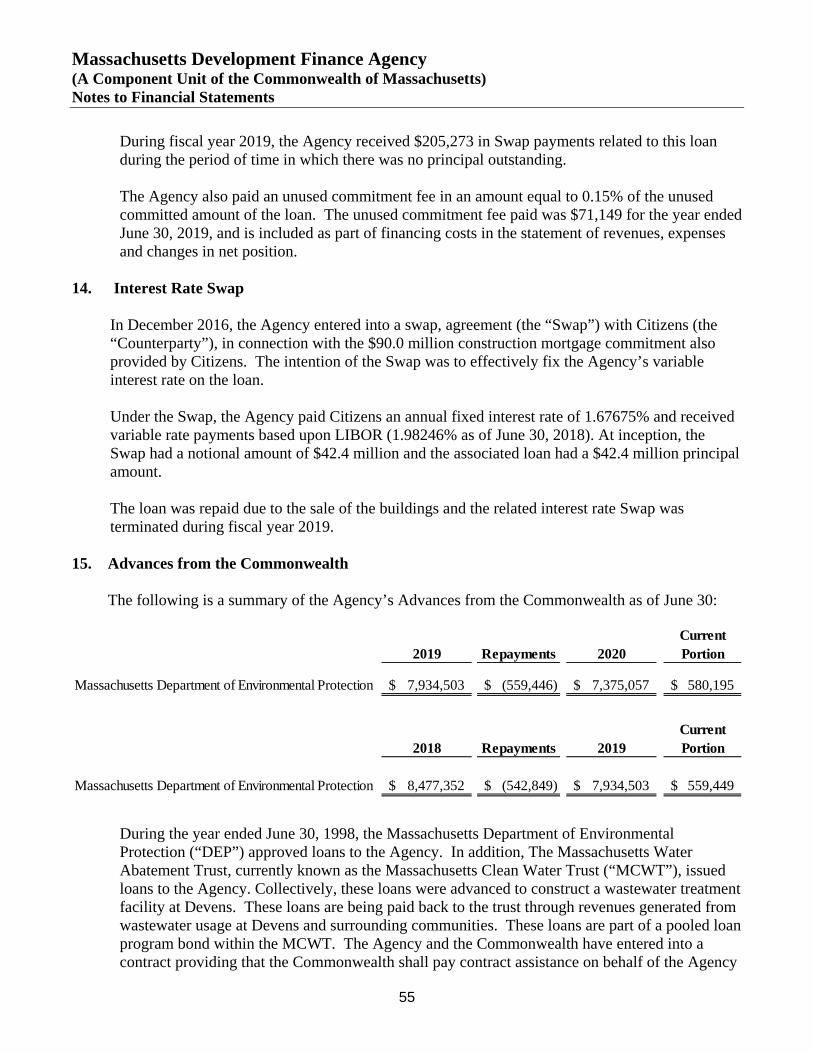
Massachusetts Development Finance Agency (A Component Unit of the Commonwealth of Massachusetts) Notes to Financial Statements
55
During fiscal year 2019, the Agency received $205,273 in Swap payments related to this loan during the period of time in which there was no principal outstanding. The Agency also paid an unused commitment fee in an amount equal to 0.15% of the unused committed amount of the loan. The unused commitment fee paid was $71,149 for the year ended June 30, 2019, and is included as part of financing costs in the statement of revenues, expenses and changes in net position.
14. Interest Rate Swap
In December 2016, the Agency entered into a swap, agreement (the “Swap”) with Citizens (the “Counterparty”), in connection with the $90.0 million construction mortgage commitment also provided by Citizens. The intention of the Swap was to effectively fix the Agency’s variable interest rate on the loan. Under the Swap, the Agency paid Citizens an annual fixed interest rate of 1.67675% and received variable rate payments based upon LIBOR (1.98246% as of June 30, 2018). At inception, the Swap had a notional amount of $42.4 million and the associated loan had a $42.4 million principal amount. The loan was repaid due to the sale of the buildings and the related interest rate Swap was terminated during fiscal year 2019.
15. Advances from the Commonwealth
The following is a summary of the Agency’s Advances from the Commonwealth as of June 30:
During the year ended June 30, 1998, the Massachusetts Department of Environmental Protection (“DEP”) approved loans to the Agency. In addition, The Massachusetts Water Abatement Trust, currently known as the Massachusetts Clean Water Trust (“MCWT”), issued loans to the Agency. Collectively, these loans were advanced to construct a wastewater treatment facility at Devens. These loans are being paid back to the trust through revenues generated from wastewater usage at Devens and surrounding communities. These loans are part of a pooled loan program bond within the MCWT. The Agency and the Commonwealth have entered into a contract providing that the Commonwealth shall pay contract assistance on behalf of the Agency
Current2019 Repayments 2020 Portion
Massachusetts Department of Environmental Protection 7,934,503$ (559,446)$ 7,375,057$ 580,195$
Current2018 Repayments 2019 Portion
Massachusetts Department of Environmental Protection 8,477,352$ (542,849)$ 7,934,503$ 559,449$
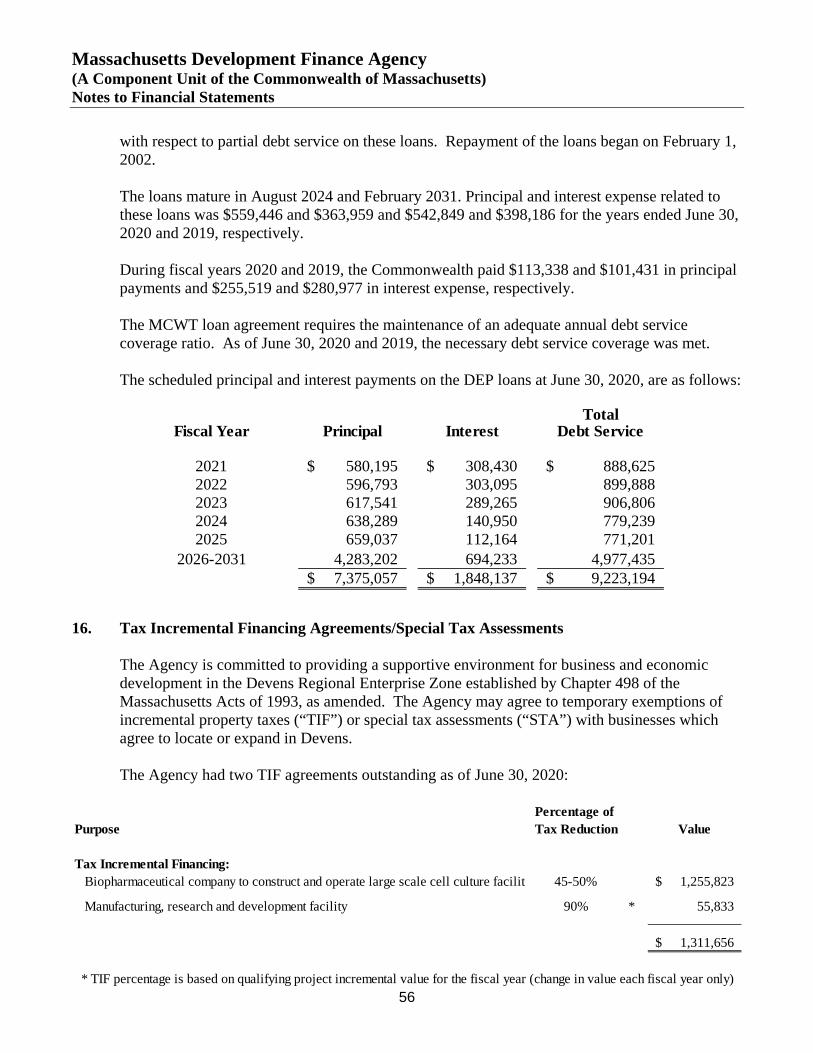
Massachusetts Development Finance Agency (A Component Unit of the Commonwealth of Massachusetts) Notes to Financial Statements
56
with respect to partial debt service on these loans. Repayment of the loans began on February 1, 2002. The loans mature in August 2024 and February 2031. Principal and interest expense related to these loans was $559,446 and $363,959 and $542,849 and $398,186 for the years ended June 30, 2020 and 2019, respectively. During fiscal years 2020 and 2019, the Commonwealth paid $113,338 and $101,431 in principal payments and $255,519 and $280,977 in interest expense, respectively. The MCWT loan agreement requires the maintenance of an adequate annual debt service coverage ratio. As of June 30, 2020 and 2019, the necessary debt service coverage was met. The scheduled principal and interest payments on the DEP loans at June 30, 2020, are as follows:
16. Tax Incremental Financing Agreements/Special Tax Assessments The Agency is committed to providing a supportive environment for business and economic development in the Devens Regional Enterprise Zone established by Chapter 498 of the Massachusetts Acts of 1993, as amended. The Agency may agree to temporary exemptions of incremental property taxes (“TIF”) or special tax assessments (“STA”) with businesses which agree to locate or expand in Devens. The Agency had two TIF agreements outstanding as of June 30, 2020:
TotalFiscal Year Principal Interest Debt Service
2021 580,195$ 308,430$ 888,625$ 2022 596,793 303,095 899,888 2023 617,541 289,265 906,806 2024 638,289 140,950 779,239 2025 659,037 112,164 771,201
2026-2031 4,283,202 694,233 4,977,435 7,375,057$ 1,848,137$ 9,223,194$
Percentage of Purpose Tax Reduction Value
Tax Incremental Financing: Biopharmaceutical company to construct and operate large scale cell culture facility 45-50% 1,255,823$
Manufacturing, research and development facility 90% * 55,833
1,311,656$
* TIF percentage is based on qualifying project incremental value for the fiscal year (change in value each fiscal year only)

Massachusetts Development Finance Agency (A Component Unit of the Commonwealth of Massachusetts) Notes to Financial Statements
57
The Agency had two TIF agreements and one STA agreement outstanding as of June 30, 2019:
Each TIF agreement was negotiated under provisions of MGL Chapter 59, section 5, clause 51 and MGL Chapter 40, section 59 allowing the Agency to grant temporary incremental property tax exemptions. The STA was granted in accordance with Chapter 23A, Section 3E of the MGL, allowing the Agency to grant special tax assessments. The Agency uses the TIF and STA agreements as an economic development incentive at Devens. The execution of such agreements is intended to promote the creation or retention of full-time jobs in Devens, increase the Devens tax and revenue base and enhance the overall quality of life in Devens. All agreements contain annual reporting requirements to the Agency on employment levels. If a business fails to comply with its obligations under an agreement, the Agency will give written notice of such failure and provide an opportunity to meet with the Agency to discuss such failure. Continued failure to comply with obligations could result in the revocation of the related agreement.
17. Other Related Party Transactions
The following related party transactions are not reflective of consideration of what these arrangements might have been if they occurred in an arms-length transaction. The Agency oversees the management and development of the Jodrey State Fish Pier (the “Pier”) facilities, which are leased to the Agency by the Department of Conservation and Recreation (representing the Commonwealth). The Pier reimburses the Agency for the Pier’s direct salary costs paid by the Agency, which amounted to $199,797 and $195,473 for the years ended June 30, 2020 and 2019, respectively. The Pier also reimburses the Agency for Agency staff time and operating expenses paid by the Agency, which amounted to $115,714 and $65,248 for the years ended June 30, 2020 and 2019, respectively. The Agency also oversees management services for Cape Ann Fisheries Development Corporation (“Cape Ann”), a non-profit corporation formed for construction and management of a multi-tenant seafood processing facility at the State Fish Pier in Gloucester. In fiscal year 2001, the Agency provided two loans to Cape Ann in the amounts of $2.3 million and $500,000 for construction expenses and remediation of environmental conditions at the seafood processing
Percentage of Purpose Tax Reduction Value
Tax Incremental Financing: Biopharmaceutical company to construct and operate large scale cell culture facility 50% 1,415,292$
Manufacturing, research and development facility 95% * 58,025
1,473,317$
* TIF percentage is based on qualifying project incremental value for the fiscal year (change in value each fiscal year only)

Massachusetts Development Finance Agency (A Component Unit of the Commonwealth of Massachusetts) Notes to Financial Statements
58
facility. In fiscal year 2013 these loans were refinanced into four separate notes (Notes A and B for each loan). The balance on the Notes A loans receivable, net of allowance for loan loss, as of June 30, 2020 was $506,225 and $139,974. The balance as of June 30, 2019 was $525,994 and $146,036. The Agency wrote off both Notes B during fiscal year 2013 as they were deemed uncollectible. These loans are included in loans receivable on the statements of net position. In September 2009, the Agency refinanced another Cape Ann loan in the amount of $2.7 million. In fiscal year 2013 this loan was refinanced into two separate notes (Notes A and B). The balance on the Note A loan receivable, net of allowance for loan loss, was $804,758 and $839,608 as of June 30, 2020 and 2019, respectively. The Agency wrote off Note B during fiscal year 2013 as it was deemed uncollectible. The Agency donated approximately $74,560 and $17,241 of Agency staff time and $35,258 and $34,471 of Cape Ann direct salary costs to Cape Ann during fiscal years 2020 and 2019, respectively. These donated costs covered management services provided to Cape Ann during the fiscal years. The Agency is eligible to receive an administrative fee of up to 0.09% of the average daily assets of the STAR Fund. The Agency’s STAR Fund holdings held on its own account as of June 30, 2020 and 2019, were approximately $87.2 million, respectively, and are included in cash and cash equivalents in the statements of net position. During the years ended June 30, 2020 and 2019, the Agency received administrative fees of $317,968 and $346,745, respectively, from the STAR Fund. The administrative fees are reported in bond issuance and new markets tax credit fees in the statements of revenues, expenses and changes in net position.
18. Benefit Plans
The Agency contributed approximately $1.7 million and $1.8 million to employee benefit plans described below during the years ended June 30, 2020 and 2019, respectively.
Deferred Compensation Plan The Agency offers its employees a deferred compensation plan created in accordance with IRC Section 457. The plan, available to all employees of the Agency, permits employees to defer a portion of their salaries. The Agency matches employees’ deferrals up to 5% of the participants’ salary, which are contributed to the 401(a) defined contribution plan. The participants’ rights to the Agency contributions vest immediately. The deferred compensation is not available to employees until termination, retirement, death or unforeseeable emergency. All contributions made under the plan, all property and rights purchased with those amounts, and all income attributable to those amounts, property or rights are held in trust for the exclusive benefit of the participants and their beneficiaries.
Massachusetts Development Finance Agency (A Component Unit of the Commonwealth of Massachusetts) Notes to Financial Statements
59
Effective December 31, 1997, Section 401(a) of the IRC was amended by Section 1448 of the Small Business Job protection Act of 1996 which provides that governmental deferred compensation plans must hold all assets and income of the plan in trust for the exclusive benefit of participants and their beneficiaries. In accordance with the legislation described above, the vested assets and associated liability of the deferred compensation plan assets are not included in the statements of net position. 401(a) Defined Contribution Plan The Agency provides for retirement through a contribution to a 401(a) plan for eligible employees. The contribution is equal to a percentage of the employee’s gross compensation earned each pay period. Currently, the Agency’s contribution is 7.5% of the employee’s gross compensation. Employees who began employment with the Agency on or after January 1, 1999 are subject to a three-year vesting schedule. Certain employees of the Agency are eligible to participate in the Commonwealth State Retirement Systems Pension Plan (the “State Plan”) under a special funding situation where the Commonwealth is the non-employer sole contributor under GASB Statement 68. An Actuarial valuation has been performed for the State Plan. The Agency’s employees were included in the actuarial analysis with a net pension liability of $4,054,705 and $3,796,735 as of June 30, 2020 and 2019, respectively, which is owed by the Commonwealth and noted as part of the total State Plan’s net pension liability. The State Plan’s net pension liability and the State Plan’s net position are disclosed in the footnotes and other required supplementary information of the Comprehensive Annual Financial Report of the Commonwealth as there are no liabilities to be recorded in the Agency's statements. The Agency has not included all required GASB Statement 68 disclosures as GASB Statement 68 is deemed immaterial to the Agency. Employees participating in the State Plan are not eligible for the contribution to the 401(a) plan.
Employees may borrow up to 50% of their vested accrued balance in the 401(a) account. Otherwise, the vested balance is not available to employees until termination, retirement, permanent disability, or death. The unvested portion of the 401(a) plan is recorded as an asset on the statements of net position. The total unvested portion of the 401(a) plan as of June 30, 2020 and 2019 was approximately $498,140 and $405,120, respectively. As discussed in Note 1, in 1998, Land Bank and MIFA merged to create the Agency. Prior to this merger, all Land Bank employees were participants in the State Plan; MIFA employees were not. All former Land Bank employees were given the option to stay in the State Plan or take part in the retirement plans being offered by the Agency. Any new employees hired after the merger were not eligible to participate in the State Plan, except for the union firefighters at Devens. The State Plan provides benefits including retiree health benefits to qualifying retirees. The programs are carried out by the Commonwealth. There are currently 24 employees in the State Plan. Neither the Land Bank nor the Agency have ever been charged for post-retirement benefits for its current employees or its retirees from the Commonwealth Group Insurance Commission. The Agency’s management has reviewed the requirements of GASB 75, Accounting and Financial Reporting for Postemployment Benefits Other Than Pensions (“OPEB”), and believes
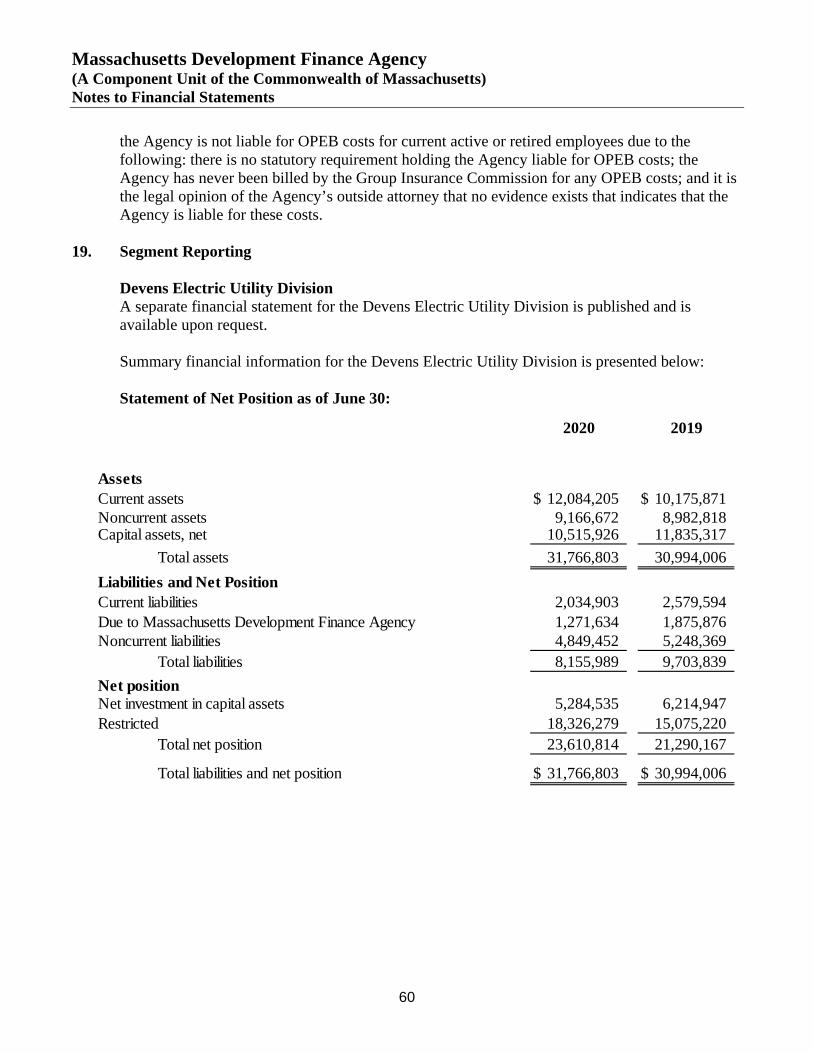
Massachusetts Development Finance Agency (A Component Unit of the Commonwealth of Massachusetts) Notes to Financial Statements
60
the Agency is not liable for OPEB costs for current active or retired employees due to the following: there is no statutory requirement holding the Agency liable for OPEB costs; the Agency has never been billed by the Group Insurance Commission for any OPEB costs; and it is the legal opinion of the Agency’s outside attorney that no evidence exists that indicates that the Agency is liable for these costs.
19. Segment Reporting
Devens Electric Utility Division A separate financial statement for the Devens Electric Utility Division is published and is available upon request. Summary financial information for the Devens Electric Utility Division is presented below: Statement of Net Position as of June 30:
2020 2019
AssetsCurrent assets 12,084,205$ 10,175,871$ Noncurrent assets 9,166,672 8,982,818 Capital assets, net 10,515,926 11,835,317
Total assets 31,766,803 30,994,006 Liabilities and Net PositionCurrent liabilities 2,034,903 2,579,594 Due to Massachusetts Development Finance Agency 1,271,634 1,875,876 Noncurrent liabilities 4,849,452 5,248,369
Total liabilities 8,155,989 9,703,839Net positionNet investment in capital assets 5,284,535 6,214,947 Restricted 18,326,279 15,075,220
Total net position 23,610,814 21,290,167
Total liabilities and net position 31,766,803$ 30,994,006$

Massachusetts Development Finance Agency (A Component Unit of the Commonwealth of Massachusetts) Notes to Financial Statements
61
Condensed Statement of Revenues, Expenses and Changes in Net Position for the year ended June 30:
Condensed Statement of Cash Flows for the years ended June 30:
20. New Markets Tax Credit Program The Agency has accounted for its 0.01% to 0.10% ownership interests in the NMTC entities using the equity method of accounting. The total amount invested in these NMTC entities was $16,237 and $16,522 as of June 30, 2020 and 2019, respectively.
As part of the closing of the NMTC entities, the Agency receives sub-allocation fees from the capitalized funds and such fees are included in bond issuance and NMTC fees in the statements of revenues, expenses and changes in net position as of June 30, 2020 and 2019. The Agency receives such fees as organizational fees for structuring and organizing the sub-allocation of the new markets tax credits of the NMTC entities. The sub-allocation fees recognized during fiscal years 2020 and 2019 were $80,548 and $922,497, respectively. The Agency receives an annual management fee for services related to managing the operations of the NMTC entities, including accounting, legal, management, technical and other services, as needed by the NMTC entities. Total management fees earned for fiscal years 2020 and 2019
2020 2019
Operating revenues 18,695,845$ 19,479,454$ Operating expenses (15,082,790) (17,669,317)Depreciation (1,319,391) (1,318,247)
Operating income 2,293,664 491,890
Nonoperating revenues, net 26,983 82,768
Increase in net position 2,320,647 574,658Net position at beginning of year 21,290,167 20,715,509
Net position at end of year 23,610,814$ 21,290,167$
2020 2019
Net cash provided by operating activities 2,468,677$ 3,027,163$ Net cash used in capital and related financing activities (601,256) (690,997)Net cash provided by investing activities 183,833 352,512
Net increase in cash and cash equivalents 2,051,254 2,688,678Cash and cash equivalents at beginning of year 15,703,278 13,014,600Cash and cash equivalents at end of year 17,754,532$ 15,703,278$

Massachusetts Development Finance Agency (A Component Unit of the Commonwealth of Massachusetts) Notes to Financial Statements
62
were $836,008 and $906,447, respectively. As of June 30, 2020 and 2019, management fees of $428,767 and $432,986, respectively, remain unpaid to the Agency, and are included in accounts receivable and other assets on the statements of net position.
The Agency may, from time to time, loan operating cash to the NMTC entities for professional services and be reimbursed at a later date. As of June 30, 2020 and 2019, $108,805 and $112,935, respectively, remains unpaid to the Agency.
21. Legal Matters
The Agency is subject to various legal proceedings and claims that arise in the ordinary course ofbusiness. Management believes that the final outcome of such matters will not have a materialadverse effect on the financial position, results of operations or liquidity of the Agency.
22. Risk Management
The Agency is exposed to various risks of loss related to general property and casualty losses.Accordingly, the Agency carries general liability and property insurance policies. The Agencyalso carries insurance coverage for business automobile, workers compensation, director andofficer liability, professional liability, cyber liability, crime and special excess liability.
23. COVID-19
On January 30, 2020, the World Health Organization declared the coronavirus outbreak a "PublicHealth Emergency of International Concern" and on March 11, 2020, declared it to be apandemic. Actions taken around the world to help mitigate the spread of the coronavirus includerestrictions on travel, and quarantines in certain areas, and forced closures for certain types ofpublic places and businesses. The coronavirus and actions taken to mitigate the spread of it havehad and are expected to continue to have an adverse impact on the economies and financialmarkets of many countries, including the geographical area in which the Agency operates. OnMarch 27, 2020, the Coronavirus Aid, Relief, and Economic Security Act (CARES Act) wasenacted to amongst other provisions, provide emergency assistance for individuals, families andbusinesses affected by the coronavirus pandemic. It is unknown how long the adverse conditionsassociated with the coronavirus will last and what the complete financial effect will be to theAgency.
24. Subsequent Events
Management has evaluated subsequent events through November 30, 2020, the date the financialstatements were available for issuance, noting no additional material events to disclose.

Transformative Devens Gas,Brownfield Emerging Cultural Mortgage MassDevelopment/ Charter School Development Devens Electric Water, Wastewater
General Operations Redevelopment Technology Facilities Insurance HEFA Trust Facilities Initiative Devens Utility Division Utility Divisions Other Taunton Corp. Eliminations Total
AssetsCurrent assets 81,037,277$ 12,927,463$ 30,689,189$ 3,797,569$ 13,369,133$ 10,036$ 32,569,975$ 9,554,451$ 17,031,844$ 12,084,205$ 7,896,581$ 33,672,496$ 1,324,538$ ( 3,638,128 )$ 252,326,629$ Noncurrent assets 122,538,917 1,470,095 14,069,157 - ( 351,601 ) 9,185,632 ( 724,475 ) - 8,685,936 9,166,672 5,556,569 ( 36,130 ) ( 8,453,760 ) 161,107,012 Capital assets, net 5,344,305 - - - - - - 1,390,754 40,214,003 10,515,926 25,692,844 677,893 9,328,965 93,164,690
Total assets 208,920,499$ 14,397,558$ 44,758,346$ 3,797,569$ 13,017,532$ 9,195,668$ 31,845,500$ 10,945,205$ 65,931,783$ 31,766,803$ 39,145,994$ 34,314,259$ 10,653,503$ (12,091,888)$ 506,598,331$
LiabilitiesCurrent liabilities 20,338,888$ 3,890,182$ 864$ 832,547$ -$ 5,052$ -$ 2,537,511$ 2,181,871$ 3,306,537$ 3,865,838$ 14,937,982$ 580,490$ (3,663,127)$ 48,814,635$
Noncurrent liabilities 498,575 538,744 - - 182,236 - 92,409 1,088,617 1,173,690 4,849,452 15,466,148 10,561,611 - ( 8,428,761 ) 26,022,721 Total liabilities 20,837,463 4,428,926 864 832,547 182,236 5,052 92,409 3,626,128 3,355,561 8,155,989 19,331,986 25,499,593 580,490 ( 12,091,888 ) 74,837,356
Net positionNet investment in capital assets 5,344,305 - - - - - - 1,390,754 40,214,003 5,284,535 18,101,866 677,892 9,268,511 30,150 80,312,016 Restricted 502,263 9,968,632 44,757,482 2,965,022 12,835,296 9,190,616 31,753,091 5,928,323 22,362,219 18,326,279 1,712,142 7,732,453 804,502 880,241 169,718,561 Unrestricted 182,236,468 - - - - - - - - 404,321 - ( 910,391 ) 181,730,398
Total net position 188,083,036 9,968,632 44,757,482 2,965,022 12,835,296 9,190,616 31,753,091 7,319,077 62,576,222 23,610,814 19,814,008 8,814,666 10,073,013 - 431,760,975
Total liabilities and net position 208,920,499$ 14,397,558$ 44,758,346$ 3,797,569$ 13,017,532$ 9,195,668$ 31,845,500$ 10,945,205$ 65,931,783$ 31,766,803$ 39,145,994$ 34,314,259$ 10,653,503$ ( 12,091,888 )$ 506,598,331$
Transformative Devens Gas,Brownfield Emerging Cultural Mortgage MassDevelopment/ Charter School Development Devens Electric Water, Wastewater
General Operations Redevelopment Technology Facilities Insurance HEFA Trust Facilities Initiative Devens Utility Division Utility Divisions Other Taunton Corp. Eliminations Total
Operating revenues 15,000,059$ 92,239$ 1,280,303$ -$ 396,855$ 73,297$ 182,635$ 3,436,114$ 11,463,821$ 18,695,845$ 11,232,838$ 1,109,592$ 2,064$ ( 5,004,721 )$ 57,960,941 Operating expenses ( 21,781,621 ) ( 3,458,225 ) ( 1,642,280 ) ( 661,761 ) ( 202,091 ) ( 137,519 ) ( 494,449 ) ( 5,481,015 ) ( 15,939,068 ) ( 16,402,181 ) ( 12,587,216 ) ( 3,046,445 ) ( 236,678 ) 608,512 (81,462,037)
Operating income (loss) ( 6,781,562 ) ( 3,365,986 ) ( 361,977 ) ( 661,761 ) 194,764 ( 64,222 ) ( 311,814 ) ( 2,044,901 ) ( 4,475,247 ) 2,293,664 ( 1,354,378 ) ( 1,936,853 ) ( 234,614 ) ( 4,396,209 ) ( 23,501,096 )
Nonoperating revenues (expenses) 4,328,805 250,812 1,462,608 45,183 71,818 502,682 402,714 211,691 295,685 26,983 ( 124,597 ) 368,285 ( 1,983 ) 214,443 8,055,129 Capital contributions (distributions) ( 4,818,269 ) 1,552,332 - 661,760 ( 71,818 ) ( 249,973 ) 3,347,500 ( 834,803 ) 511,580 - - 2,023,523 - 4,181,766 6,303,598 Special item - - - - - - - - - - - - - - -
Increase (decrease) in net position ( 7,271,026 ) ( 1,562,842 ) 1,100,631 45,182 194,764 188,487 3,438,400 ( 2,668,013 ) ( 3,667,982 ) 2,320,647 ( 1,478,975 ) 454,955 ( 236,597 ) - ( 9,142,369 )
Net position-beginning of year 195,354,062 11,531,474 43,656,851 2,919,840 12,640,532 9,002,129 28,314,691 9,987,090 66,244,204 21,290,167 21,292,983 8,359,711 10,309,610 - 440,903,344 Net position-end of year 188,083,036$ 9,968,632$ 44,757,482$ 2,965,022$ 12,835,296$ 9,190,616$ 31,753,091$ 7,319,077$ 62,576,222$ 23,610,814$ 19,814,008$ 8,814,666$ 10,073,013$ -$ 431,760,975$
Statements of Departmental Revenues, Expenses and Changes in Net Position
Masschusetts Development Finance AgencySupplementary Information
June 30, 2020(unaudited)
63

Transformative Devens Gas,Brownfield Emerging Cultural Mortgage MassDevelopment/ Charter School Advanced Development Devens Electric Water, Wastewater
General Operations Redevelopment Technology Facilities Insurance HEFA Trust Facilities Manufacturing Initiative Devens Utility Division Utility Divisions Other Taunton Corp. Eliminations Total
AssetsCurrent assets 176,308,782$ 13,551,782$ 34,190,358$ 4,993,873$ 13,357,288$ 6,481,708$ 30,153,495$ 483,617$ 10,093,935$ 19,505,579$ 10,175,871$ 6,943,043$ 30,443,239$ 2,014,049$ ( 4,338,532 )$ 354,358,087$ Noncurrent assets 119,814,987 2,123,509 9,467,918 - ( 494,555 ) 2,524,630 ( 568,276 ) - - 8,804,387 8,982,818 5,535,176 292,806 - ( 8,453,762 ) 148,029,638 Capital assets, net 6,039,352 - - - - - - - 3,581,995 41,258,564 11,835,317 26,119,825 674,893 8,880,150 98,390,096
Total assets 302,163,121$ 15,675,291$ 43,658,276$ 4,993,873$ 12,862,733$ 9,006,338$ 29,585,219$ 483,617$ 13,675,930$ 69,568,530$ 30,994,006$ 38,598,044$ 31,410,938$ 10,894,199$ (12,792,294)$ 600,777,821$
LiabilitiesCurrent liabilities 106,146,326$ 4,143,817$ 1,425$ 2,074,033$ -$ 4,209$ 1,162,500$ -$ 3,688,840$ 2,036,035$ 4,455,470$ 1,286,466$ 14,215,870$ 534,589$ (4,338,530)$ 135,411,050$
Noncurrent liabilities 662,733 - - - 222,201 - 108,028 - - 1,288,291 5,248,369 16,018,595 9,318,974 50,000 ( 8,453,764 ) 24,463,427 Total liabilities 106,809,059 4,143,817 1,425 2,074,033 222,201 4,209 1,270,528 - 3,688,840 3,324,326 9,703,839 17,305,061 23,534,844 584,589 ( 12,792,294 ) 159,874,477
Net positionNet investment in capital assets 6,039,352 - - - - - - - 3,581,994 41,258,564 6,214,947 17,952,339 674,893 8,821,679 29,161 84,572,929 Restricted 409,240 11,531,474 43,656,851 2,919,840 12,640,532 9,002,129 28,314,691 483,617 6,405,096 24,985,640 15,075,220 3,340,644 6,800,147 1,487,931 2,152,870 169,205,922 Unrestricted 188,905,470 - - - - - - - - - - - 401,054 - ( 2,182,031 ) 187,124,493
Total net position 195,354,062 11,531,474 43,656,851 2,919,840 12,640,532 9,002,129 28,314,691 483,617 9,987,090 66,244,204 21,290,167 21,292,983 7,876,094 10,309,610 - 440,903,344
Total liabilities and net position 302,163,121$ 15,675,291$ 43,658,276$ 4,993,873$ 12,862,733$ 9,006,338$ 29,585,219$ 483,617$ 13,675,930$ 69,568,530$ 30,994,006$ 38,598,044$ 31,410,938$ 10,894,199$ ( 12,792,294 )$ 600,777,821$
- - - - - - - - - - - - - - - -
Transformative Devens Gas,Brownfield Emerging Cultural Mortgage MassDevelopment/ Charter School Advanced Development Devens Electric Water, Wastewater
General Operations Redevelopment Technology Facilities Insurance HEFA Trust Facilities Manufacturing Initiative Devens Utility Division Utility Divisions Other Taunton Corp. Eliminations Total
Operating revenues 18,828,565$ 83,939$ 598,130$ -$ 522,095$ 15,706$ 159,993$ -$ ( 71,840 )$ 12,758,912$ 19,479,454$ 11,686,756$ 131,354$ 111,532$ ( 4,356,860 )$ 59,947,736 Operating expenses ( 20,505,094 ) ( 2,366,850 ) ( 958,290 ) ( 621,343 ) ( 361,753 ) ( 89,723 ) ( 319,552 ) ( 55,957 ) ( 3,821,265 ) ( 14,842,061 ) ( 18,987,564 ) ( 11,787,513 ) ( 4,968,316 ) ( 1,576,686 ) 2,660,926 (78,601,041)
Operating income (loss) ( 1,676,529 ) ( 2,282,911 ) ( 360,160 ) ( 621,343 ) 160,342 ( 74,017 ) ( 159,559 ) ( 55,957 ) ( 3,893,105 ) ( 2,083,149 ) 491,890 ( 100,757 ) ( 4,836,962 ) ( 1,465,154 ) ( 1,695,934 ) ( 18,653,305 )
Nonoperating revenues (expenses) 3,999,393 308,829 1,139,335 66,446 108,967 259,514 592,932 37,599 230,606 421,131 82,768 ( 36,721 ) 293,284 ( 2,155 ) 118,002 7,619,930 Capital contributions (distributions) ( 82,606,132 ) 922,774 - 514,607 ( 108,967 ) ( 483,924 ) 6,837,500 ( 2,587,494 ) 729,573 531,029 - - 4,289,226 - 1,577,933 (70,383,875)
Special item 26,785,121 - - - - - - - - - - - - - - 26,785,121
Increase (decrease) in net position ( 53,498,147 ) ( 1,051,308 ) 779,175 ( 40,290 ) 160,342 ( 298,427 ) 7,270,873 ( 2,605,852 ) ( 2,932,926 ) ( 1,130,989 ) 574,658 ( 137,478 ) ( 254,452 ) ( 1,467,309 ) 1 ( 54,632,129 )
Net position-beginning of year 248,852,209 12,582,782 42,877,676 2,960,130 12,480,190 9,300,556 21,043,818 3,089,469 12,920,016 67,375,193 20,715,509 21,430,461 8,130,546 11,776,919 ( 1 ) 495,535,473 Net position-end of year 195,354,062$ 11,531,474$ 43,656,851$ 2,919,840$ 12,640,532$ 9,002,129$ 28,314,691$ 483,617$ 9,987,090$ 66,244,204$ 21,290,167$ 21,292,983$ 7,876,094$ 10,309,610$ -$ 440,903,344$
Statements of Departmental Revenues, Expenses and Changes in Net Position
Masschusetts Development Finance AgencySupplementary Information
June 30, 2019(unaudited)
64