Embed Size (px)
Citation preview
Mc
TD
h
•••••
a
ARRA
1
pctopwtspga
h0
Nuclear Engineering and Design 276 (2014) 142–152
Contents lists available at ScienceDirect
Nuclear Engineering and Design
jou rn al hom epage : www.elsev ier .com/ locate /nucengdes
ass transfer in back to back elbows arranged in an out of planeonfiguration under annular two phase flow conditions
. Le, D. Ewing, C.Y. Ching ∗
epartment of Mechanical Engineering, McMaster University, Hamilton, ON L8S 4L7, Canada
i g h l i g h t s
Mass transfer in back to back elbows in an out of plane configuration was measured.Tests were performed under annular two phase air–water conditions.Highest mass transfer was on the outer wall of the first elbow.The mass transfer on the second elbow was always less than that in the first elbow.The mass transfer increased with an increase in the air superficial velocity.
r t i c l e i n f o
rticle history:eceived 5 September 2013eceived in revised form 22 May 2014ccepted 27 May 2014
a b s t r a c t
The mass transfer in back-to-back elbows arranged in an out of plane configuration has been measuredunder annular two phase air–water flow conditions. The measurements were performed using a walldissolving technique with the elbow sections cast from gypsum. Experiments were performed to studythe effect of increasing the water and air superficial velocities, and the effect of separation distancebetween the elbows. The highest mass transfer for all cases occurs on the outer wall of the first elbow,
and the magnitude was not affected by the separation distance between the elbows. The maximum masstransfer in the second elbow was approximately 60 percent of the maximum value in the first elbow.The mass transfer increased with an increase in either the water or air superficial velocity, with the airvelocity having a greater effect. The roughness development in the upstream pipe was modest, but wassignificant in the regions of high mass transfer on the first and second elbow.© 2014 Elsevier B.V. All rights reserved.
. Introduction
Flow accelerated corrosion (FAC) occurs in both single and twohase flows due to the dissolution of the adjacent magnetite layer ofarbon steel pipe into the flowing fluid. This can result in pipe wallhinning with potential for abrupt failure [Dooley, 2008]. While theperating conditions such as water chemistry and piping materiallay a role in FAC, the mass transfer to the flow determines the pipeall thinning rates. Abrupt changes in the flow can result in high
urbulence levels and significantly increase the mass transfer ratesuch as in flow downstream of orifices, T junctions, and bend com-
onents [Dooley, 2008]. In two phase flows, such as those in powereneration plants, the vapor flow can create localized turbulencend acceleration of the liquid resulting in high mass transfer rates.∗ Corresponding author. Tel.: +1 905 525 9140x24998.E-mail address: [email protected] (C.Y. Ching).
ttp://dx.doi.org/10.1016/j.nucengdes.2014.05.039029-5493/© 2014 Elsevier B.V. All rights reserved.
In such flows, liquid film thickness redistribution and liquid dropletimpingement is believed to play a strong role in the overall masstransfer in elbows [Poulson, 1991]. The focus here is on back to backelbows arranged in an out of plane configuration under annular twophase flow.
Mass transfer studies in elbows under annular two phase flowconditions are limited [Poulson, 1991; Pecherkin and Chekhovich,2011; Mazhar et al., 2014a, 2014b]. Poulson (1991) and Mazhar et al.(2014a) found high mass transfer rates on the outer wall of the firstelbow along the line of sight, which was attributed to the combinedeffect of liquid film redistribution and liquid droplet impingement.The combined effect of the two mechanisms would depend on theflow conditions, with liquid droplet impingement being the mainmechanism controlling mass transfer in the first elbow. Poulson
(1991) found a second region of enhanced mass transfer relative tothe upstream pipe in the latter half of the first elbow and the secondelbow in a 180◦ bend, though less than at the line of sight location.Mazhar et al. (2014a) found a similar enhancement in the latter half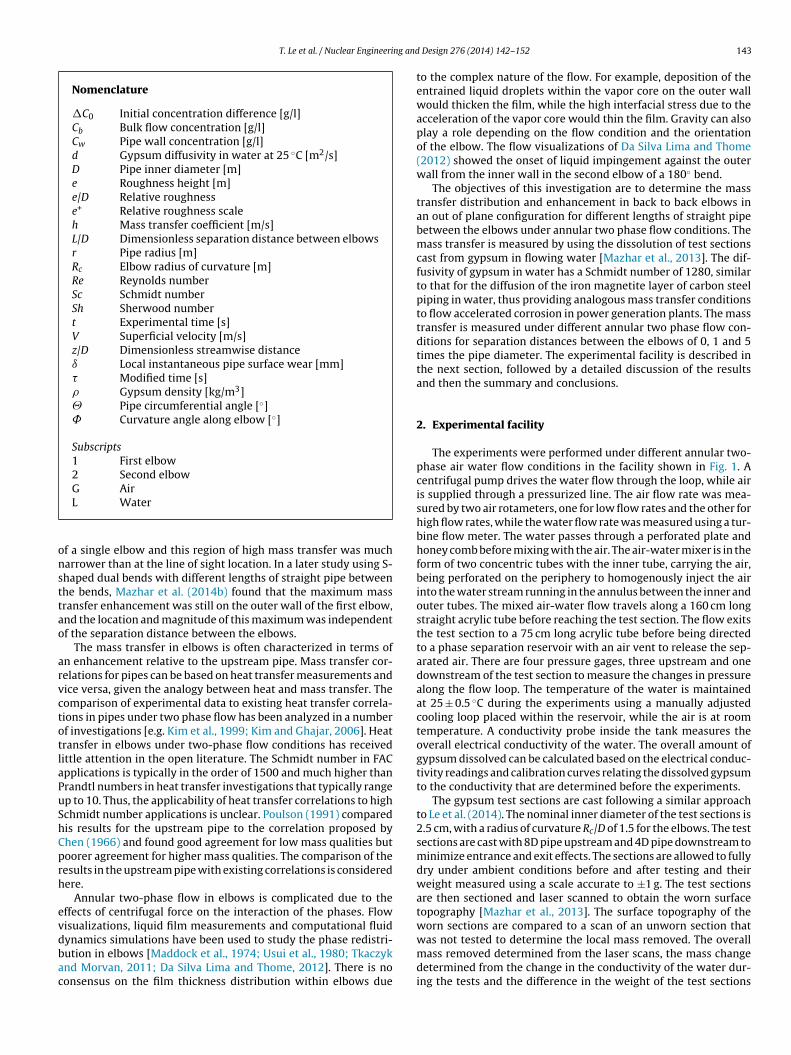
T. Le et al. / Nuclear Engineering and
Nomenclature
�C0 Initial concentration difference [g/l]Cb Bulk flow concentration [g/l]Cw Pipe wall concentration [g/l]d Gypsum diffusivity in water at 25 ◦C [m2/s]D Pipe inner diameter [m]e Roughness height [m]e/D Relative roughnesse+ Relative roughness scaleh Mass transfer coefficient [m/s]L/D Dimensionless separation distance between elbowsr Pipe radius [m]Rc Elbow radius of curvature [m]Re Reynolds numberSc Schmidt numberSh Sherwood numbert Experimental time [s]V Superficial velocity [m/s]z/D Dimensionless streamwise distanceı Local instantaneous pipe surface wear [mm]� Modified time [s]� Gypsum density [kg/m3]� Pipe circumferential angle [◦]
Curvature angle along elbow [◦]
Subscripts1 First elbow2 Second elbowG Air
onsttao
arvctotlaPuShCprh
evdbac
L Water
f a single elbow and this region of high mass transfer was mucharrower than at the line of sight location. In a later study using S-haped dual bends with different lengths of straight pipe betweenhe bends, Mazhar et al. (2014b) found that the maximum massransfer enhancement was still on the outer wall of the first elbow,nd the location and magnitude of this maximum was independentf the separation distance between the elbows.
The mass transfer in elbows is often characterized in terms ofn enhancement relative to the upstream pipe. Mass transfer cor-elations for pipes can be based on heat transfer measurements andice versa, given the analogy between heat and mass transfer. Theomparison of experimental data to existing heat transfer correla-ions in pipes under two phase flow has been analyzed in a numberf investigations [e.g. Kim et al., 1999; Kim and Ghajar, 2006]. Heatransfer in elbows under two-phase flow conditions has receivedittle attention in the open literature. The Schmidt number in FACpplications is typically in the order of 1500 and much higher thanrandtl numbers in heat transfer investigations that typically rangep to 10. Thus, the applicability of heat transfer correlations to highchmidt number applications is unclear. Poulson (1991) comparedis results for the upstream pipe to the correlation proposed byhen (1966) and found good agreement for low mass qualities butoorer agreement for higher mass qualities. The comparison of theesults in the upstream pipe with existing correlations is consideredere.
Annular two-phase flow in elbows is complicated due to theffects of centrifugal force on the interaction of the phases. Flowisualizations, liquid film measurements and computational fluid
ynamics simulations have been used to study the phase redistri-ution in elbows [Maddock et al., 1974; Usui et al., 1980; Tkaczyknd Morvan, 2011; Da Silva Lima and Thome, 2012]. There is noonsensus on the film thickness distribution within elbows dueDesign 276 (2014) 142–152 143
to the complex nature of the flow. For example, deposition of theentrained liquid droplets within the vapor core on the outer wallwould thicken the film, while the high interfacial stress due to theacceleration of the vapor core would thin the film. Gravity can alsoplay a role depending on the flow condition and the orientationof the elbow. The flow visualizations of Da Silva Lima and Thome(2012) showed the onset of liquid impingement against the outerwall from the inner wall in the second elbow of a 180◦ bend.
The objectives of this investigation are to determine the masstransfer distribution and enhancement in back to back elbows inan out of plane configuration for different lengths of straight pipebetween the elbows under annular two phase flow conditions. Themass transfer is measured by using the dissolution of test sectionscast from gypsum in flowing water [Mazhar et al., 2013]. The dif-fusivity of gypsum in water has a Schmidt number of 1280, similarto that for the diffusion of the iron magnetite layer of carbon steelpiping in water, thus providing analogous mass transfer conditionsto flow accelerated corrosion in power generation plants. The masstransfer is measured under different annular two phase flow con-ditions for separation distances between the elbows of 0, 1 and 5times the pipe diameter. The experimental facility is described inthe next section, followed by a detailed discussion of the resultsand then the summary and conclusions.
2. Experimental facility
The experiments were performed under different annular two-phase air water flow conditions in the facility shown in Fig. 1. Acentrifugal pump drives the water flow through the loop, while airis supplied through a pressurized line. The air flow rate was mea-sured by two air rotameters, one for low flow rates and the other forhigh flow rates, while the water flow rate was measured using a tur-bine flow meter. The water passes through a perforated plate andhoney comb before mixing with the air. The air-water mixer is in theform of two concentric tubes with the inner tube, carrying the air,being perforated on the periphery to homogenously inject the airinto the water stream running in the annulus between the inner andouter tubes. The mixed air-water flow travels along a 160 cm longstraight acrylic tube before reaching the test section. The flow exitsthe test section to a 75 cm long acrylic tube before being directedto a phase separation reservoir with an air vent to release the sep-arated air. There are four pressure gages, three upstream and onedownstream of the test section to measure the changes in pressurealong the flow loop. The temperature of the water is maintainedat 25 ± 0.5 ◦C during the experiments using a manually adjustedcooling loop placed within the reservoir, while the air is at roomtemperature. A conductivity probe inside the tank measures theoverall electrical conductivity of the water. The overall amount ofgypsum dissolved can be calculated based on the electrical conduc-tivity readings and calibration curves relating the dissolved gypsumto the conductivity that are determined before the experiments.
The gypsum test sections are cast following a similar approachto Le et al. (2014). The nominal inner diameter of the test sections is2.5 cm, with a radius of curvature Rc/D of 1.5 for the elbows. The testsections are cast with 8D pipe upstream and 4D pipe downstream tominimize entrance and exit effects. The sections are allowed to fullydry under ambient conditions before and after testing and theirweight measured using a scale accurate to ±1 g. The test sectionsare then sectioned and laser scanned to obtain the worn surfacetopography [Mazhar et al., 2013]. The surface topography of theworn sections are compared to a scan of an unworn section that
was not tested to determine the local mass removed. The overallmass removed determined from the laser scans, the mass changedetermined from the change in the conductivity of the water dur-ing the tests and the difference in the weight of the test sections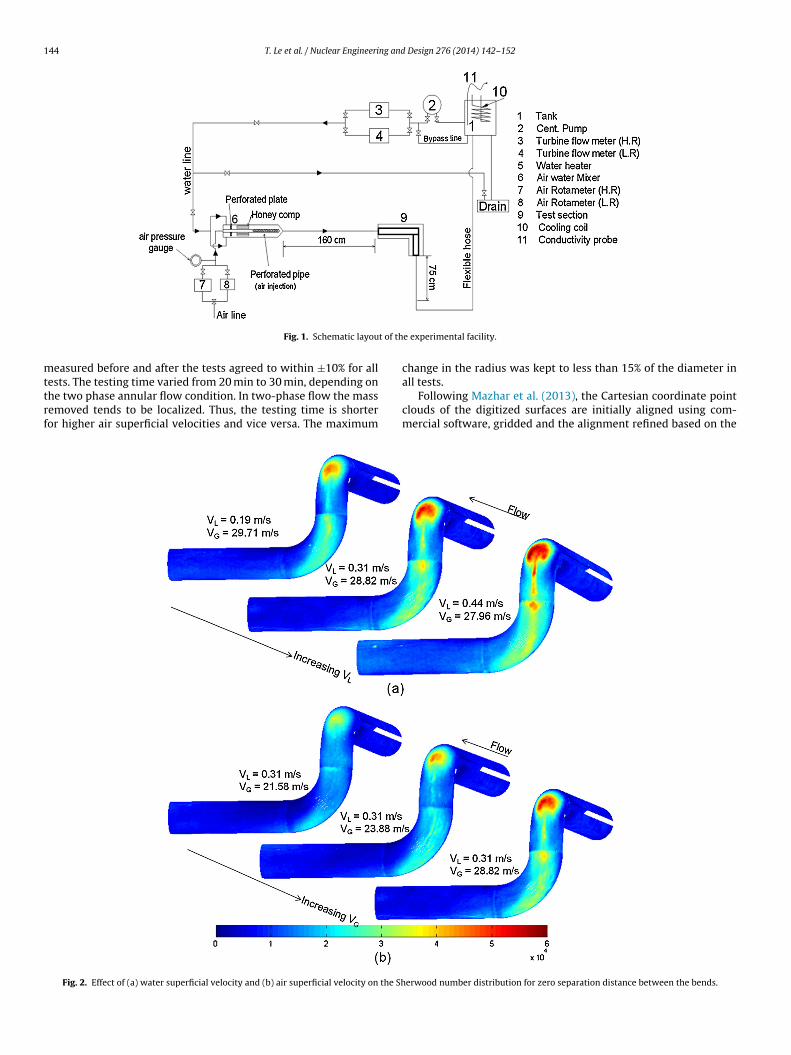
144 T. Le et al. / Nuclear Engineering and Design 276 (2014) 142–152
t of th
mttrf
Fig. 1. Schematic layou
easured before and after the tests agreed to within ±10% for all
ests. The testing time varied from 20 min to 30 min, depending onhe two phase annular flow condition. In two-phase flow the massemoved tends to be localized. Thus, the testing time is shorteror higher air superficial velocities and vice versa. The maximumFig. 2. Effect of (a) water superficial velocity and (b) air superficial velocity on the Sh
e experimental facility.
change in the radius was kept to less than 15% of the diameter in
all tests.Following Mazhar et al. (2013), the Cartesian coordinate pointclouds of the digitized surfaces are initially aligned using com-mercial software, gridded and the alignment refined based on the
erwood number distribution for zero separation distance between the bends.
T. Le et al. / Nuclear Engineering and Design 276 (2014) 142–152 145
F increaV
apatlh
ww
�
ig. 3. Azimuthal profiles of Sherwood number along the first and second elbow for
G = 28.82 m/s; (· · ·) VL = 0.44 m/s, VG = 27.96 m/s.
ssumption of symmetric flow in a mean sense in the upstreamipe. The overall mass removed and wear profiles of the two halvesre checked for any misalignment. The unworn surface is sub-racted from the worn surface of the tested section to obtain theocal wear ı over the entire surface. The mass transfer coefficient,
is then calculated from
�dı
d�= h�C0, (1)
here �C0 is the initial concentration difference between the pipe
all and water and � is a modified time defined by= 1�C0
∫ t
0
(Cw − Cb)dt (2)
sing water superficial velocity: (—) VL = 0.19 m/s, VG = 29.71 m/s; (- - -) VL = 0.31 m/s,
Here, Cb is the concentration in the bulk flowing fluid and Cw
is the wall concentration taken to be the saturated concentrationof gypsum in the water (2.4 g/l). The modified time accounts forthe increase in gypsum concentration within the close loop systemthat decreases the driving potential for mass transfer (Cw − Cb) overtime. The Sherwood number is then calculated by
Sh = hD
d, (3)
where D is the pipe diameter (2.54 cm) and d is the diffusivityof gypsum in water (6.49e−10 m2/s). The local Sherwood number
is averaged using a top hat filter that was 1.4 mm in the cross-wise direction and 2.8 mm in the streamwise direction to obtain anestimate of the local mean Sherwood number. The filter size waschosen based on the features of the surface to reduce or remove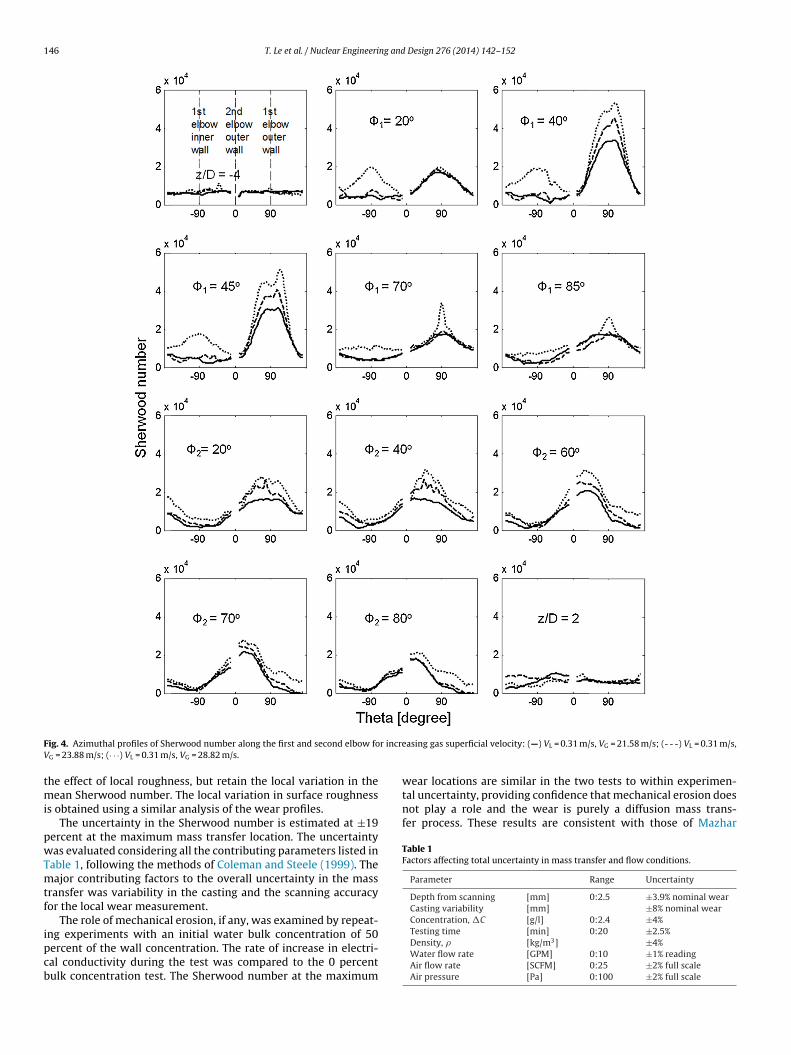
146 T. Le et al. / Nuclear Engineering and Design 276 (2014) 142–152
F r incrV
tmi
pwTmtf
ipcb
wear locations are similar in the two tests to within experimen-tal uncertainty, providing confidence that mechanical erosion doesnot play a role and the wear is purely a diffusion mass trans-fer process. These results are consistent with those of Mazhar
Table 1Factors affecting total uncertainty in mass transfer and flow conditions.
Parameter Range Uncertainty
Depth from scanning [mm] 0:2.5 ±3.9% nominal wearCasting variability [mm] ±8% nominal wearConcentration, �C [g/l] 0:2.4 ±4%Testing time [min] 0:20 ±2.5%
ig. 4. Azimuthal profiles of Sherwood number along the first and second elbow foG = 23.88 m/s; (· · ·) VL = 0.31 m/s, VG = 28.82 m/s.
he effect of local roughness, but retain the local variation in theean Sherwood number. The local variation in surface roughness
s obtained using a similar analysis of the wear profiles.The uncertainty in the Sherwood number is estimated at ±19
ercent at the maximum mass transfer location. The uncertaintyas evaluated considering all the contributing parameters listed in
able 1, following the methods of Coleman and Steele (1999). Theajor contributing factors to the overall uncertainty in the mass
ransfer was variability in the casting and the scanning accuracyor the local wear measurement.
The role of mechanical erosion, if any, was examined by repeat-
ng experiments with an initial water bulk concentration of 50ercent of the wall concentration. The rate of increase in electri-al conductivity during the test was compared to the 0 percentulk concentration test. The Sherwood number at the maximumeasing gas superficial velocity: (—) VL = 0.31 m/s, VG = 21.58 m/s; (- - -) VL = 0.31 m/s,
Density, � [kg/m3] ±4%Water flow rate [GPM] 0:10 ±1% readingAir flow rate [SCFM] 0:25 ±2% full scaleAir pressure [Pa] 0:100 ±2% full scale
T. Le et al. / Nuclear Engineering and
(2014a) 90 degree bend
(2014a) 90 degree bend
10
15
20
25
30
35
1.00.1
VG(m/s)
VL (m/s)
Out of plane
Poulson (1993) 180 degree bend
Mazhar et al., (2014a) 90 degree bend
8 88
5
8.2 7.9
6.9
95.3 6
7.4
4.5 6.3 7.5
5.03.5 5.8
2.2 2.5 3.5
(a)
10
15
20
25
30
35
1.00.1
VG(m/s)
VL (m/s)
Out of plane
Mazhar et al., (2014a) 90 degrees bend
3.8 4.7
3.0
2.8
5.0
3.3 4.7 5.6
2.92 3.4
1.5 2 2.4
(b)
10
15
20
25
30
35
1.00.1
VG(m/s)
VL (m/s)
5.14.7
3.9
3.3
4.2
(c)
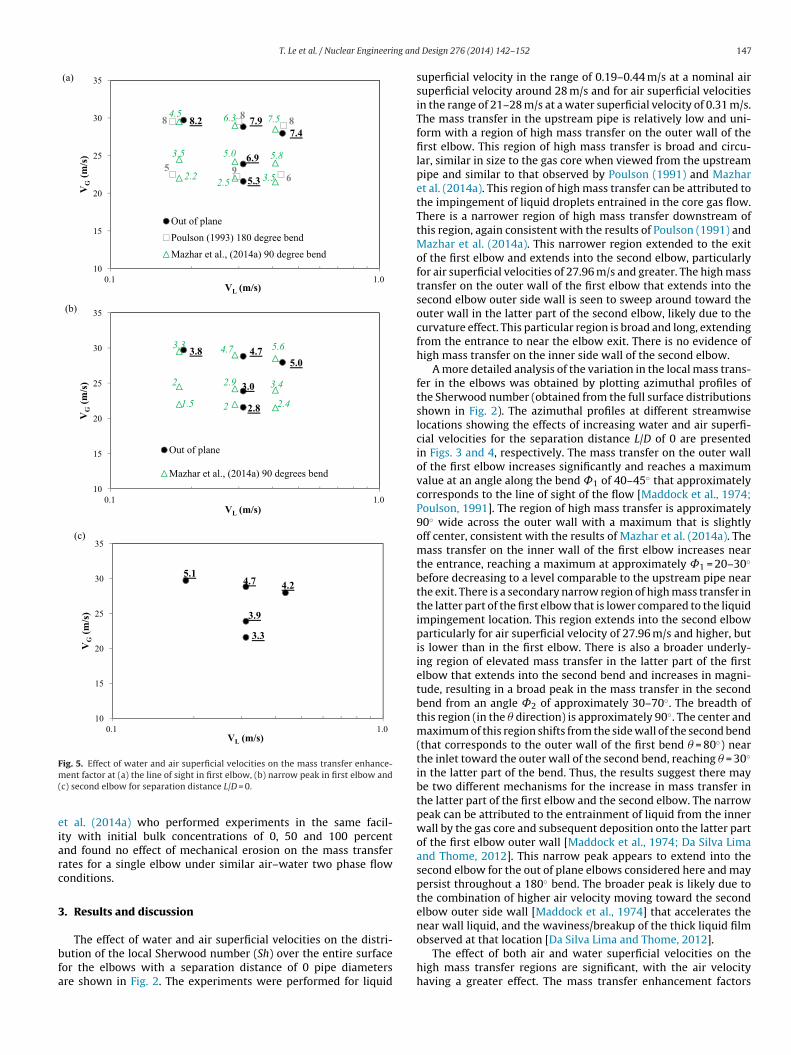
Fig. 5. Effect of water and air superficial velocities on the mass transfer enhance-m(
eiarc
3
bfa
ent factor at (a) the line of sight in first elbow, (b) narrow peak in first elbow andc) second elbow for separation distance L/D = 0.
t al. (2014a) who performed experiments in the same facil-ty with initial bulk concentrations of 0, 50 and 100 percentnd found no effect of mechanical erosion on the mass transferates for a single elbow under similar air–water two phase flowonditions.
. Results and discussion
The effect of water and air superficial velocities on the distri-ution of the local Sherwood number (Sh) over the entire surfaceor the elbows with a separation distance of 0 pipe diametersre shown in Fig. 2. The experiments were performed for liquid
Design 276 (2014) 142–152 147
superficial velocity in the range of 0.19–0.44 m/s at a nominal airsuperficial velocity around 28 m/s and for air superficial velocitiesin the range of 21–28 m/s at a water superficial velocity of 0.31 m/s.The mass transfer in the upstream pipe is relatively low and uni-form with a region of high mass transfer on the outer wall of thefirst elbow. This region of high mass transfer is broad and circu-lar, similar in size to the gas core when viewed from the upstreampipe and similar to that observed by Poulson (1991) and Mazharet al. (2014a). This region of high mass transfer can be attributed tothe impingement of liquid droplets entrained in the core gas flow.There is a narrower region of high mass transfer downstream ofthis region, again consistent with the results of Poulson (1991) andMazhar et al. (2014a). This narrower region extended to the exitof the first elbow and extends into the second elbow, particularlyfor air superficial velocities of 27.96 m/s and greater. The high masstransfer on the outer wall of the first elbow that extends into thesecond elbow outer side wall is seen to sweep around toward theouter wall in the latter part of the second elbow, likely due to thecurvature effect. This particular region is broad and long, extendingfrom the entrance to near the elbow exit. There is no evidence ofhigh mass transfer on the inner side wall of the second elbow.
A more detailed analysis of the variation in the local mass trans-fer in the elbows was obtained by plotting azimuthal profiles ofthe Sherwood number (obtained from the full surface distributionsshown in Fig. 2). The azimuthal profiles at different streamwiselocations showing the effects of increasing water and air superfi-cial velocities for the separation distance L/D of 0 are presentedin Figs. 3 and 4, respectively. The mass transfer on the outer wallof the first elbow increases significantly and reaches a maximumvalue at an angle along the bend ˚1 of 40–45◦ that approximatelycorresponds to the line of sight of the flow [Maddock et al., 1974;Poulson, 1991]. The region of high mass transfer is approximately90◦ wide across the outer wall with a maximum that is slightlyoff center, consistent with the results of Mazhar et al. (2014a). Themass transfer on the inner wall of the first elbow increases nearthe entrance, reaching a maximum at approximately ˚1 = 20–30◦
before decreasing to a level comparable to the upstream pipe nearthe exit. There is a secondary narrow region of high mass transfer inthe latter part of the first elbow that is lower compared to the liquidimpingement location. This region extends into the second elbowparticularly for air superficial velocity of 27.96 m/s and higher, butis lower than in the first elbow. There is also a broader underly-ing region of elevated mass transfer in the latter part of the firstelbow that extends into the second bend and increases in magni-tude, resulting in a broad peak in the mass transfer in the secondbend from an angle ˚2 of approximately 30–70◦. The breadth ofthis region (in the � direction) is approximately 90◦. The center andmaximum of this region shifts from the side wall of the second bend(that corresponds to the outer wall of the first bend � = 80◦) nearthe inlet toward the outer wall of the second bend, reaching � = 30◦
in the latter part of the bend. Thus, the results suggest there maybe two different mechanisms for the increase in mass transfer inthe latter part of the first elbow and the second elbow. The narrowpeak can be attributed to the entrainment of liquid from the innerwall by the gas core and subsequent deposition onto the latter partof the first elbow outer wall [Maddock et al., 1974; Da Silva Limaand Thome, 2012]. This narrow peak appears to extend into thesecond elbow for the out of plane elbows considered here and maypersist throughout a 180◦ bend. The broader peak is likely due tothe combination of higher air velocity moving toward the secondelbow outer side wall [Maddock et al., 1974] that accelerates thenear wall liquid, and the waviness/breakup of the thick liquid film
observed at that location [Da Silva Lima and Thome, 2012].The effect of both air and water superficial velocities on thehigh mass transfer regions are significant, with the air velocityhaving a greater effect. The mass transfer enhancement factors
148 T. Le et al. / Nuclear Engineering and Design 276 (2014) 142–152
rwood
(cat1aeoPelfibnMmotwTlT6wtw
fsctwmuwdodo
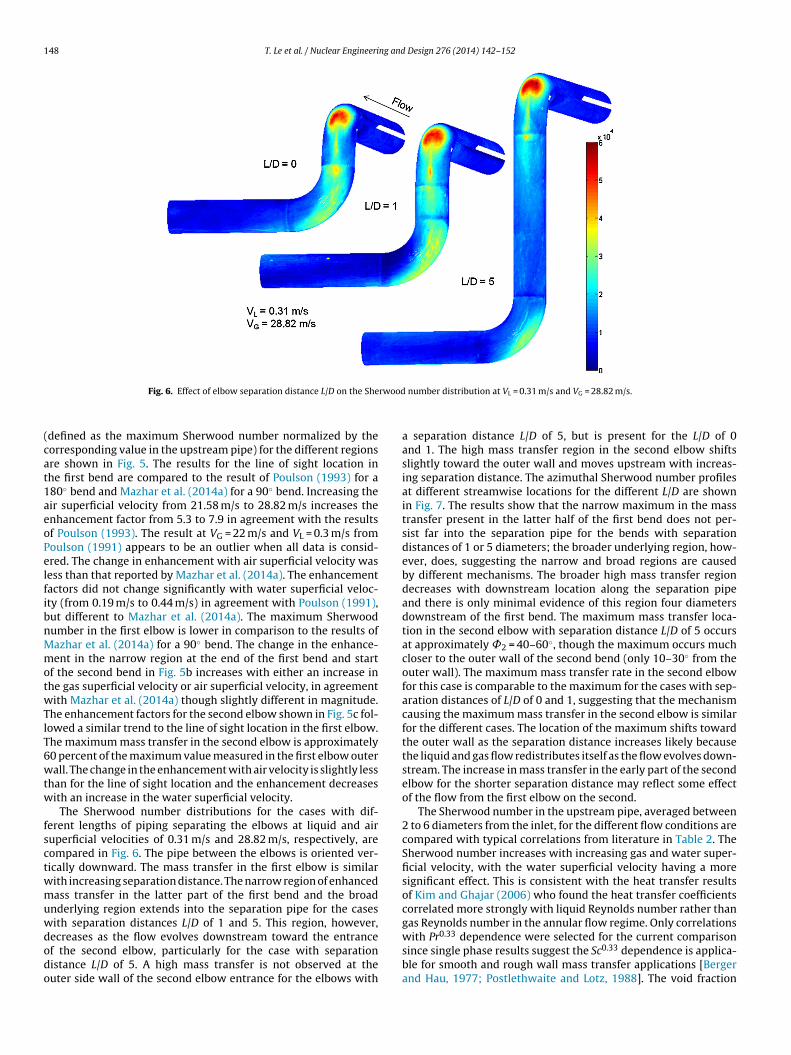
Fig. 6. Effect of elbow separation distance L/D on the She
defined as the maximum Sherwood number normalized by theorresponding value in the upstream pipe) for the different regionsre shown in Fig. 5. The results for the line of sight location inhe first bend are compared to the result of Poulson (1993) for a80◦ bend and Mazhar et al. (2014a) for a 90◦ bend. Increasing their superficial velocity from 21.58 m/s to 28.82 m/s increases thenhancement factor from 5.3 to 7.9 in agreement with the resultsf Poulson (1993). The result at VG = 22 m/s and VL = 0.3 m/s fromoulson (1991) appears to be an outlier when all data is consid-red. The change in enhancement with air superficial velocity wasess than that reported by Mazhar et al. (2014a). The enhancementactors did not change significantly with water superficial veloc-ty (from 0.19 m/s to 0.44 m/s) in agreement with Poulson (1991),ut different to Mazhar et al. (2014a). The maximum Sherwoodumber in the first elbow is lower in comparison to the results ofazhar et al. (2014a) for a 90◦ bend. The change in the enhance-ent in the narrow region at the end of the first bend and start
f the second bend in Fig. 5b increases with either an increase inhe gas superficial velocity or air superficial velocity, in agreementith Mazhar et al. (2014a) though slightly different in magnitude.
he enhancement factors for the second elbow shown in Fig. 5c fol-owed a similar trend to the line of sight location in the first elbow.he maximum mass transfer in the second elbow is approximately0 percent of the maximum value measured in the first elbow outerall. The change in the enhancement with air velocity is slightly less
han for the line of sight location and the enhancement decreasesith an increase in the water superficial velocity.
The Sherwood number distributions for the cases with dif-erent lengths of piping separating the elbows at liquid and airuperficial velocities of 0.31 m/s and 28.82 m/s, respectively, areompared in Fig. 6. The pipe between the elbows is oriented ver-ically downward. The mass transfer in the first elbow is similarith increasing separation distance. The narrow region of enhancedass transfer in the latter part of the first bend and the broad
nderlying region extends into the separation pipe for the casesith separation distances L/D of 1 and 5. This region, however,
ecreases as the flow evolves downstream toward the entrancef the second elbow, particularly for the case with separationistance L/D of 5. A high mass transfer is not observed at theuter side wall of the second elbow entrance for the elbows withnumber distribution at VL = 0.31 m/s and VG = 28.82 m/s.
a separation distance L/D of 5, but is present for the L/D of 0and 1. The high mass transfer region in the second elbow shiftsslightly toward the outer wall and moves upstream with increas-ing separation distance. The azimuthal Sherwood number profilesat different streamwise locations for the different L/D are shownin Fig. 7. The results show that the narrow maximum in the masstransfer present in the latter half of the first bend does not per-sist far into the separation pipe for the bends with separationdistances of 1 or 5 diameters; the broader underlying region, how-ever, does, suggesting the narrow and broad regions are causedby different mechanisms. The broader high mass transfer regiondecreases with downstream location along the separation pipeand there is only minimal evidence of this region four diametersdownstream of the first bend. The maximum mass transfer loca-tion in the second elbow with separation distance L/D of 5 occursat approximately ˚2 = 40–60◦, though the maximum occurs muchcloser to the outer wall of the second bend (only 10–30◦ from theouter wall). The maximum mass transfer rate in the second elbowfor this case is comparable to the maximum for the cases with sep-aration distances of L/D of 0 and 1, suggesting that the mechanismcausing the maximum mass transfer in the second elbow is similarfor the different cases. The location of the maximum shifts towardthe outer wall as the separation distance increases likely becausethe liquid and gas flow redistributes itself as the flow evolves down-stream. The increase in mass transfer in the early part of the secondelbow for the shorter separation distance may reflect some effectof the flow from the first elbow on the second.
The Sherwood number in the upstream pipe, averaged between2 to 6 diameters from the inlet, for the different flow conditions arecompared with typical correlations from literature in Table 2. TheSherwood number increases with increasing gas and water super-ficial velocity, with the water superficial velocity having a moresignificant effect. This is consistent with the heat transfer resultsof Kim and Ghajar (2006) who found the heat transfer coefficientscorrelated more strongly with liquid Reynolds number rather thangas Reynolds number in the annular flow regime. Only correlations
with Pr0.33 dependence were selected for the current comparisonsince single phase results suggest the Sc0.33 dependence is applica-ble for smooth and rough wall mass transfer applications [Bergerand Hau, 1977; Postlethwaite and Lotz, 1988]. The void fraction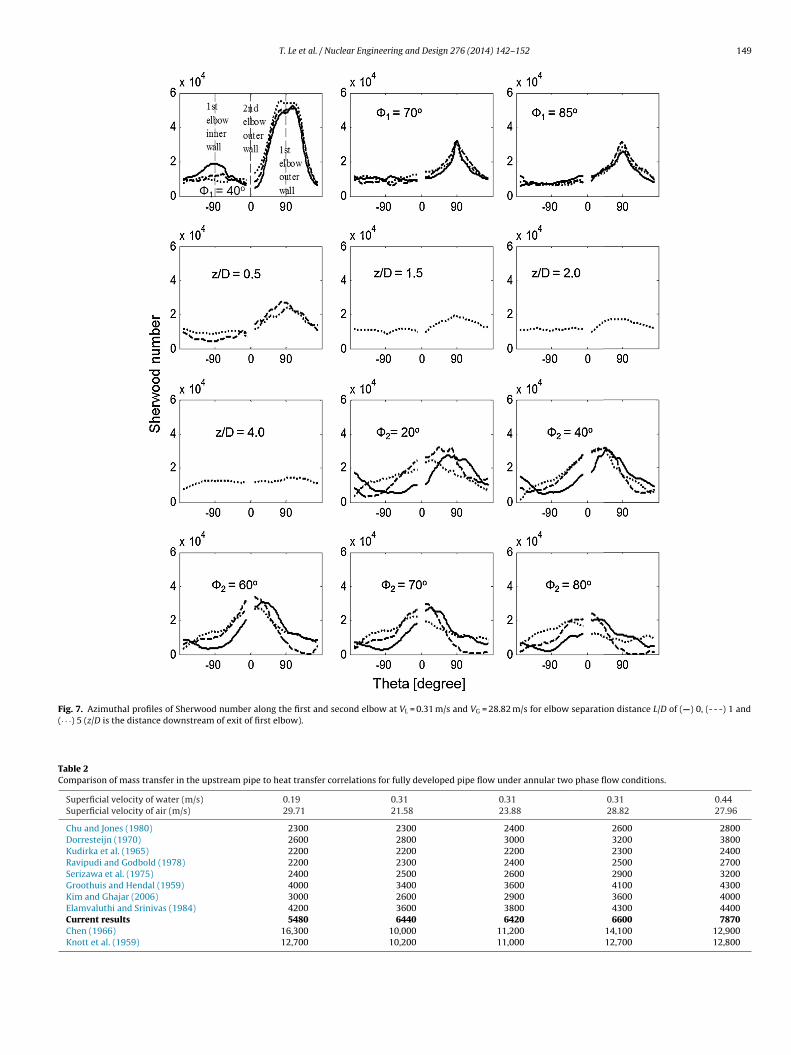
T. Le et al. / Nuclear Engineering and Design 276 (2014) 142–152 149
Fig. 7. Azimuthal profiles of Sherwood number along the first and second elbow at VL = 0.31 m/s and VG = 28.82 m/s for elbow separation distance L/D of (—) 0, (- - -) 1 and(· · ·) 5 (z/D is the distance downstream of exit of first elbow).
Table 2Comparison of mass transfer in the upstream pipe to heat transfer correlations for fully developed pipe flow under annular two phase flow conditions.
Superficial velocity of water (m/s) 0.19 0.31 0.31 0.31 0.44Superficial velocity of air (m/s) 29.71 21.58 23.88 28.82 27.96
Chu and Jones (1980) 2300 2300 2400 2600 2800Dorresteijn (1970) 2600 2800 3000 3200 3800Kudirka et al. (1965) 2200 2200 2200 2300 2400Ravipudi and Godbold (1978) 2200 2300 2400 2500 2700Serizawa et al. (1975) 2400 2500 2600 2900 3200Groothuis and Hendal (1959) 4000 3400 3600 4100 4300Kim and Ghajar (2006) 3000 2600 2900 3600 4000Elamvaluthi and Srinivas (1984) 4200 3600 3800 4300 4400Current results 5480 6440 6420 6600 7870Chen (1966) 16,300 10,000 11,200 14,100 12,900Knott et al. (1959) 12,700 10,200 11,000 12,700 12,800

150 T. Le et al. / Nuclear Engineering and Design 276 (2014) 142–152
(a) up
u(r2Cfm
rd1
Fig. 8. Typical surface relative roughness of
sed for the correlations was based on the model of Chisholm1983) based on inlet pressure of the test section. Most of the cor-elations in Table 2 predict pipe Sherwood number in the range of000–4400, lower than the current result; however, a few includinghen (1966) predicted much higher Sherwood numbers. Poulsonound good agreement with the correlation of Chen (1966) for low
ass qualities typical of the cases considered here.
The Sherwood number can be affected by the development ofoughness due to mass transfer to the flow. This is particularly evi-ent in single phase flow [Wilkin et al., 1983; Poulson and Robinson,988]. The surface roughness at different locations along the pipe
stream pipe and (b) first elbow outer wall.
was characterized by subtracting the mean surface from the localsurface. The roughness is estimated by examining the surfaces inprofile to obtain the valley to peak height. Typical surface relativeroughness e/D contours in the upstream pipe and the first elbowouter wall is shown in Fig. 8. The relative roughness in the pipeis approximately 1.5–2 × 10⁻³. This roughness is much lower thanthe case for single phase flow [Le et al., 2014], but consistent with
the results of Poulson (1991) for a 180◦ bend under annular twophase flow. The relative roughness increased sharply to approxi-mately 6 × 10⁻³ on the outer wall of the first elbow, correspondingto the liquid droplet impingement zone. The roughness decreased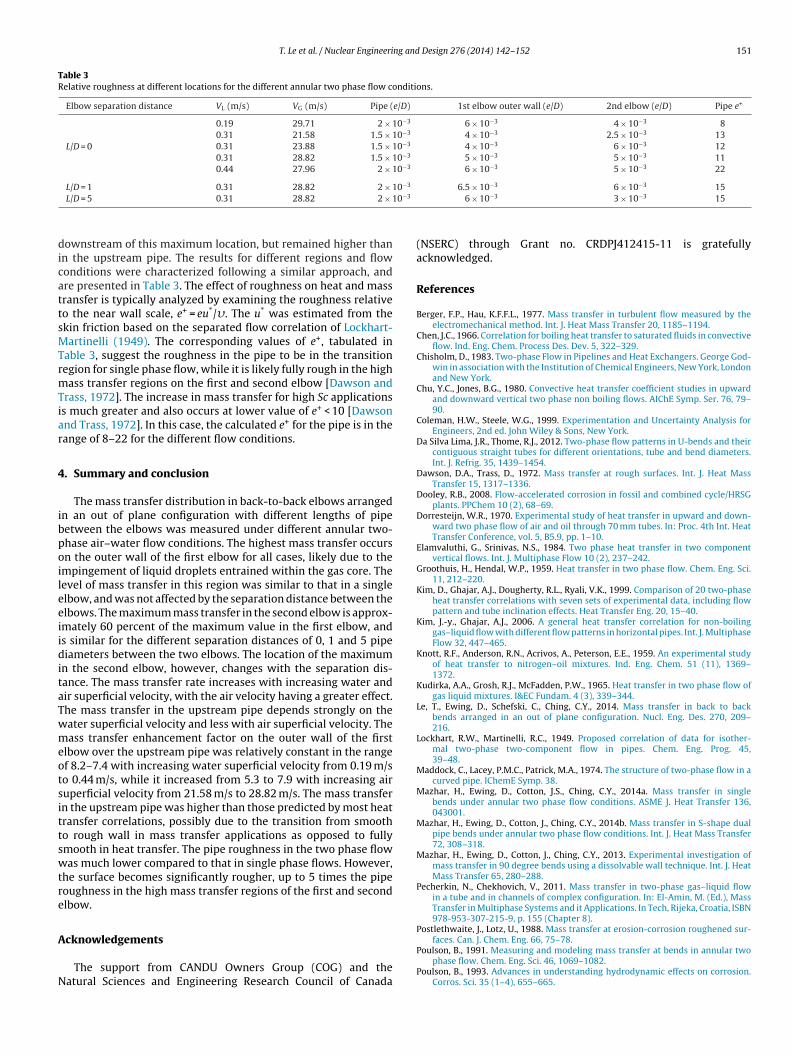
T. Le et al. / Nuclear Engineering and Design 276 (2014) 142–152 151
Table 3Relative roughness at different locations for the different annular two phase flow conditions.
Elbow separation distance VL (m/s) VG (m/s) Pipe (e/D) 1st elbow outer wall (e/D) 2nd elbow (e/D) Pipe e+
L/D = 0
0.19 29.71 2 × 10⁻³ 6 × 10⁻³ 4 × 10⁻³ 80.31 21.58 1.5 × 10⁻³ 4 × 10⁻³ 2.5 × 10⁻³ 130.31 23.88 1.5 × 10⁻³ 4 × 10⁻³ 6 × 10⁻³ 120.31 28.82 1.5 × 10⁻³ 5 × 10⁻³ 5 × 10⁻³ 110.44 27.96 2 × 10⁻³ 6 × 10⁻³ 5 × 10⁻³ 22
0−3 −3 −3
0−3
dicattsMTrmTiar
4
ibpoileeiiditaTwmeotsittswtre
A
N
L/D = 1 0.31 28.82 2 × 1L/D = 5 0.31 28.82 2 × 1
ownstream of this maximum location, but remained higher thann the upstream pipe. The results for different regions and flowonditions were characterized following a similar approach, andre presented in Table 3. The effect of roughness on heat and massransfer is typically analyzed by examining the roughness relativeo the near wall scale, e+ = eu*/�. The u* was estimated from thekin friction based on the separated flow correlation of Lockhart-artinelli (1949). The corresponding values of e+, tabulated in
able 3, suggest the roughness in the pipe to be in the transitionegion for single phase flow, while it is likely fully rough in the highass transfer regions on the first and second elbow [Dawson and
rass, 1972]. The increase in mass transfer for high Sc applicationss much greater and also occurs at lower value of e+ < 10 [Dawsonnd Trass, 1972]. In this case, the calculated e+ for the pipe is in theange of 8–22 for the different flow conditions.
. Summary and conclusion
The mass transfer distribution in back-to-back elbows arrangedn an out of plane configuration with different lengths of pipeetween the elbows was measured under different annular two-hase air–water flow conditions. The highest mass transfer occursn the outer wall of the first elbow for all cases, likely due to thempingement of liquid droplets entrained within the gas core. Theevel of mass transfer in this region was similar to that in a singlelbow, and was not affected by the separation distance between thelbows. The maximum mass transfer in the second elbow is approx-mately 60 percent of the maximum value in the first elbow, ands similar for the different separation distances of 0, 1 and 5 pipeiameters between the two elbows. The location of the maximum
n the second elbow, however, changes with the separation dis-ance. The mass transfer rate increases with increasing water andir superficial velocity, with the air velocity having a greater effect.he mass transfer in the upstream pipe depends strongly on theater superficial velocity and less with air superficial velocity. Theass transfer enhancement factor on the outer wall of the first
lbow over the upstream pipe was relatively constant in the rangef 8.2–7.4 with increasing water superficial velocity from 0.19 m/so 0.44 m/s, while it increased from 5.3 to 7.9 with increasing airuperficial velocity from 21.58 m/s to 28.82 m/s. The mass transfern the upstream pipe was higher than those predicted by most heatransfer correlations, possibly due to the transition from smootho rough wall in mass transfer applications as opposed to fullymooth in heat transfer. The pipe roughness in the two phase flowas much lower compared to that in single phase flows. However,
he surface becomes significantly rougher, up to 5 times the pipeoughness in the high mass transfer regions of the first and secondlbow.
cknowledgements
The support from CANDU Owners Group (COG) and theatural Sciences and Engineering Research Council of Canada
6.5 × 10 6 × 10 156 × 10−3 3 × 10⁻³ 15
(NSERC) through Grant no. CRDPJ412415-11 is gratefullyacknowledged.
References
Berger, F.P., Hau, K.F.F.L., 1977. Mass transfer in turbulent flow measured by theelectromechanical method. Int. J. Heat Mass Transfer 20, 1185–1194.
Chen, J.C., 1966. Correlation for boiling heat transfer to saturated fluids in convectiveflow. Ind. Eng. Chem. Process Des. Dev. 5, 322–329.
Chisholm, D., 1983. Two-phase Flow in Pipelines and Heat Exchangers. George God-win in association with the Institution of Chemical Engineers, New York, Londonand New York.
Chu, Y.C., Jones, B.G., 1980. Convective heat transfer coefficient studies in upwardand downward vertical two phase non boiling flows. AIChE Symp. Ser. 76, 79–90.
Coleman, H.W., Steele, W.G., 1999. Experimentation and Uncertainty Analysis forEngineers, 2nd ed. John Wiley & Sons, New York.
Da Silva Lima, J.R., Thome, R.J., 2012. Two-phase flow patterns in U-bends and theircontiguous straight tubes for different orientations, tube and bend diameters.Int. J. Refrig. 35, 1439–1454.
Dawson, D.A., Trass, D., 1972. Mass transfer at rough surfaces. Int. J. Heat MassTransfer 15, 1317–1336.
Dooley, R.B., 2008. Flow-accelerated corrosion in fossil and combined cycle/HRSGplants. PPChem 10 (2), 68–69.
Dorresteijn, W.R., 1970. Experimental study of heat transfer in upward and down-ward two phase flow of air and oil through 70 mm tubes. In: Proc. 4th Int. HeatTransfer Conference, vol. 5, B5.9, pp. 1–10.
Elamvaluthi, G., Srinivas, N.S., 1984. Two phase heat transfer in two componentvertical flows. Int. J. Multiphase Flow 10 (2), 237–242.
Groothuis, H., Hendal, W.P., 1959. Heat transfer in two phase flow. Chem. Eng. Sci.11, 212–220.
Kim, D., Ghajar, A.J., Dougherty, R.L., Ryali, V.K., 1999. Comparison of 20 two-phaseheat transfer correlations with seven sets of experimental data, including flowpattern and tube inclination effects. Heat Transfer Eng. 20, 15–40.
Kim, J.-y., Ghajar, A.J., 2006. A general heat transfer correlation for non-boilinggas–liquid flow with different flow patterns in horizontal pipes. Int. J. MultiphaseFlow 32, 447–465.
Knott, R.F., Anderson, R.N., Acrivos, A., Peterson, E.E., 1959. An experimental studyof heat transfer to nitrogen–oil mixtures. Ind. Eng. Chem. 51 (11), 1369–1372.
Kudirka, A.A., Grosh, R.J., McFadden, P.W., 1965. Heat transfer in two phase flow ofgas liquid mixtures. I&EC Fundam. 4 (3), 339–344.
Le, T., Ewing, D., Schefski, C., Ching, C.Y., 2014. Mass transfer in back to backbends arranged in an out of plane configuration. Nucl. Eng. Des. 270, 209–216.
Lockhart, R.W., Martinelli, R.C., 1949. Proposed correlation of data for isother-mal two-phase two-component flow in pipes. Chem. Eng. Prog. 45,39–48.
Maddock, C., Lacey, P.M.C., Patrick, M.A., 1974. The structure of two-phase flow in acurved pipe. IChemE Symp. 38.
Mazhar, H., Ewing, D., Cotton, J.S., Ching, C.Y., 2014a. Mass transfer in singlebends under annular two phase flow conditions. ASME J. Heat Transfer 136,043001.
Mazhar, H., Ewing, D., Cotton, J., Ching, C.Y., 2014b. Mass transfer in S-shape dualpipe bends under annular two phase flow conditions. Int. J. Heat Mass Transfer72, 308–318.
Mazhar, H., Ewing, D., Cotton, J., Ching, C.Y., 2013. Experimental investigation ofmass transfer in 90 degree bends using a dissolvable wall technique. Int. J. HeatMass Transfer 65, 280–288.
Pecherkin, N., Chekhovich, V., 2011. Mass transfer in two-phase gas–liquid flowin a tube and in channels of complex configuration. In: El-Amin, M. (Ed.), MassTransfer in Multiphase Systems and it Applications. In Tech, Rijeka, Croatia, ISBN978-953-307-215-9, p. 155 (Chapter 8).
Postlethwaite, J., Lotz, U., 1988. Mass transfer at erosion-corrosion roughened sur-
faces. Can. J. Chem. Eng. 66, 75–78.Poulson, B., 1991. Measuring and modeling mass transfer at bends in annular twophase flow. Chem. Eng. Sci. 46, 1069–1082.
Poulson, B., 1993. Advances in understanding hydrodynamic effects on corrosion.Corros. Sci. 35 (1–4), 655–665.

1 ng and
P
R
S
52 T. Le et al. / Nuclear Engineeri
oulson, B., Robinson, R., 1988. The local enhancement of mass transfer at 180◦
bends. Int. J. Heat Mass Transfer 31 (6), 1289–1297.avipudi, S.R., Godbold, T.M., 1978. The effect of mass transfer on heat transfer rates
for two phase flow in a vertical pipe. In: Proc. 6th Int. Heat Transfer Conf., vol. 1,pp. 505–510.
erizawa, A., Kataoka, I., Michiyoshi, I., 1975. Turbulence structure of air-water bubbly flow—III. Transport properties. Int. J. Multiphase Flow 2,247–259.
Design 276 (2014) 142–152
Tkaczyk, P.M., Morvan, H.P., 2011. Film thickness prediction in an annular two-phaseflow around C-shaped bend. J. Comput. Multiphase Flows 3, 27–39.
Usui, K., Aoki, S., Inoue, A., 1980. Flow behavior and pressure drop of two-phase
flow through C-shaped bend in vertical plane. J. Nucl. Sci. Technol. 17, 875–887.Wilkin, S.J., Oates, H.S., Coney, M.W.E., 1983. Mass Transfer in Straight Pipes and 90◦
Bends Measured by the Dissolution of Plaster. Technology Planning and ResearchDivision, Central Electricity Research Laboratories, Surrey, England.