Embed Size (px)
Citation preview
1
Mass transfer enhancement produced by laser
induced cavitation Peter R. Birkina, Hanne-Maria Hirsimäkiab , Jeremy G. Freya, Timothy G. Leightonb aSchool of Chemistry, bInstitute of Sound and Vibration Research
University of Southampton
Southampton
SO17 1BJ
United Kingdom
Abstract
A microelectrode is used to measure the mass transfer perturbation and characteristics
during the growth and subsequent collapse of a single bubble (which following its
initial expansion, achieved a maximum radius, Rm, of ~ 500-1000 µm). This mass
transfer enhancement was associated with the forced convection, driven by bubble
motion, as the result of a single cavitation event generated by a laser pulse beneath a
25 µm diameter Au microelectrode. Evidence for bubble growth and rebound is
gained from the electrochemical and acoustic measurements. This is supported with
high-speed video footage of the events generated. A threshold for the formation of
large cavitation bubbles in electrolyte solutions is suggested.
Keywords: cavitation, laser, mass transfer, pressure signal, high-speed imaging.
Corresponding author. Tel: + 44 2380 594172, Fax: + 44 2380 593781, e-mail: [email protected]

2
Introduction
The parasitic generation of cavitation can be extremely costly for industry. The
process termed ‘cavitation’ has been extensively investigated since its discovery
around the beginning of the 20th century [1]. Cavitation may be defined as the rapid
expansion and collapse of bubbles or voids within a liquid media. Cavitation can be
generated by a number of different techniques including ultrasound, hydrodynamic
flow and laser pulse within a liquid. However, it is important to note that the
generation of each cavitation event can differ depending on the technique employed.
For example cavitation bubbles generated in liquids by power ultrasound or
hydrodynamic flow are usually formed through the suitable excitation (e.g. local
pressure conditions) of pre-existing nuclei within the liquid. These nuclei can be free
floating or attached to a solid/liquid interface. The cavitation bubbles that form under
these conditions grow under tension and then can collapse providing that the physical
conditions are suitable. In turn the maximum size attained by the bubble at the end of
the growth phase is related to the local conditions within the liquid. For example the
maximum dimension achieved by bubbles, which are initially ~1 – 10 µm in radius,
can be as great as ~100 µm [2] to even ~1000 µm [3] (to cite example studies using
ultrasonic horns [2] and hydrodynamic flow [3]). This range of sizes, and the
unpredictability of the times and locations of cavitation nucleation, hinders
examination of individual hydrodynamic or ultrasonic cavitation events: measurement
of individual events may be required to validate models, or to correlate the results of
one sensor with those of another, as is done in this paper with mass transfer sensing
and high-speed photography. Furthermore hydrodynamic or ultrasonic cavitation

3
tends to produce clusters [4-6] and clouds of events within a particular reactor. While
this may be useful for bulk processing of materials, it makes the study of the
cavitation processes that are occurring more difficult as the locality of each event is
hard to predict and interactions between bubbles (cluster effects) may also occur. In
contrast to this, the generation of laser induced cavitation relies on a focused pulsed
beam which provides sufficient energy densities to break the liquid down into a
plasma [7]. This region then expands and cools to form a large (of mm dimensions)
single cavity within the liquid. The collapse of this bubble then occurs as the forces
acting on the bubble drive it to implode. Our understanding of cavitation has been
significantly enhanced by the study of these single bubbles created by large energy
densities (>1010 W cm-2) [7] into a suitable medium [8-11]. These single cavitation
events can, as well as being generated by laser pulses, be produced through spark
discharge into a liquid [12]. A significant advantage of these techniques is that they
are used to produce a sufficiently large (mm dimensions) cavitation event for imaging
with high-speed photography at a known location. One such study of cavitation
events was reported by Philipp and Lauterborn [11]. They detailed an extensive
investigation of the damage to a surface produced by single cavitation bubbles (Rmax
typically 1.45 mm) produced by laser action [11]. They showed, using high frame
rate photography techniques (frame rates up to 106 frames per second) and ex-situ
microscopy of various solid surfaces, that the damage caused by one or more (up to
5000) single bubble collapses depended strongly on the dimensionless distance
between the bubble and the solid liquid interface (defined as s/Rmax where s and Rmax
are the distance between the bubble centre and the solid interface and the maximum
bubble radius respectively). These authors showed that most surface damage

4
associated with single bubble collapse originates from shock wave emission. This
emission originates from the collapse phase of the bubble and is often associated with
the generation of a toroidal bubble as the result of microjet formation. Surface
damage, as the result of microjet impingement on the surface, was not found to be
extensive. Philipp and Lauterborn also showed that, even though the scale of the
damage they observed was of the order of µm in depth, the surface damage areas were
very complex in shape. However, this and previous studies have relied on the ex-situ
investigation of surface damage as the result of microjet or shock wave impact to
ascertain the individual effect of bubbles on surfaces. Furthermore these ex-situ
investigations were time integrated such that they examine only the cumulative result
of the entirety of each erosion event. While a great deal of important information has
been gathered in this manner, in situ investigations of surface effects and mass
transfer of material in the liquid have not been detailed to such an extent. In order to
gain further insight into these effects, and in particular the mass transfer of material
from a single cavitation event, an electrochemical investigation has been undertaken.
This approach has the additional advantage that the mass transfer (or erosion) can be
time resolved and correlated to the bubble dynamics (or even, as will be shown later,
the laser pulse).
Electrochemical investigations of cavitation date back to the 1930’s [13].
However, most of these studies have focussed on bulk effects of cavitation produced
by ultrasound. While this has merit in enabling study of the effects of cavitation
clouds on electrochemical processes (including bulk electrolysis, materials deposition
and electroanalytical processes [14-18] etc), it does not allow the individual effects of
single cavitation bubbles to be determined. Such analysis of single events is

5
important, as it can be used to validate CFD and other models of the system.
However, single event interrogation within a cavitation cloud is possible using a
microelectrode technique. Here the microelectrode can be placed within a cavitating
environment, and the perturbation of the mass transfer characteristics of the solution
determined under steady state conditions [19-21]. In such a technique the solution
contains a redox active material and the electrode is maintained under mass transfer
limited conditions. Each individual bubble collapse or motion will be registered as a
current time transient at the microelectrode. This idea can be extended to the study of
the erosive nature of individual cavitation bubbles [22-24]. In this case a passivated
electrode surface is maintained under electrochemical control. Erosion due to
cavitation above a passivated surface results in fresh deposition of material to ‘heal’
or repassivate the electrode surface. Hence individual cavitation erosion events are
detected as a series of anodic current time transients. This technology can then be
used to study material effects or determine the local effects of single cavitation events.
This is because there are a number of mechanisms induced in a cavitation
environment which can cause mass transfer enhancements as a result of forced
convection [19, 25]. However, surface erosion is strongly related to transient or
inertial collapse. Clearly distinguishing between these mechanisms requires local
knowledge of both mass transfer and surface erosion. This has recently been achieved
through the deployment of a novel dual microelectrode into a cavitation environment
[23, 26-28].
While the electrochemical effects of cavitation have been extensively studied in
relation to bubbles generated through an ultrasonic sound field, the study of laser
induced cavitation has yet to be reported using this microelectrode approach.

6
Considering the potential benefits of this approach, it would seem desirable to
perform studies in this area. The following manuscript reports preliminary results
obtained from an investigation of cavitation produced by a laser pulse. In this
arrangement a large (maximum bubble radius, Rm, ~ 0.5-1.0 mm) single bubble is
formed by a single Nd:YAG laser pulse (5 ns) focussed inside an electrochemical cell.
The following details the results and findings of a preliminary electrochemical
investigation of the mass transfer effects of laser induced cavitation.

7
Experimental
Cavitation bubbles were generated by focusing an electro-optically Q-switched
Nd:YAG laser (Continuum SL II-10, Photonics Solutions PLC) into an
electrochemical cell. The laser produced 5 ns pulses at the wavelength of 532 nm and
delivered energies up to 170 mJ per pulse. The beam diameter was 6 mm. The beam
was typically first expanded with a concave lens L3 (Comar optics, f = -40 mm,
where f represents the focal length), then collimated with a convex lens L2 (Comar
optics, f = 150 mm) and finally focused with another convex lens L1 (Mellesgriot, f =
18 mm) that was mounted onto the front window of the electrochemical cell (see
figure 1 frame (u)). The electrochemical cell had four windows, access for the
working electrode and hydrophone from the top and separate holders for the reference
and counter electrode. The laser power was adjusted by changing the Q switch delay.
A powermeter (Coherent Fieldmaster) was employed to measure the applied power as
a function of the Q switch setting.
A 25 µm diameter Au microelectrode sealed in glass was constructed and used
as the working electrode [29]. The diameter of the electrodes fabricated this way was
very small (~2.3 mm). Platinum gauze served as the counter electrode and a saturated
calomel electrode (SCE) was used as the reference.
The position of the working electrode was controlled by micropositioner
(Time and Precision). The micropositioner had manual 25 mm X and Y stages and a
motorised 50 mm Z stage, all with 10 m resolution. The stepper motor was
controlled by stepper drive (Parker automation) and in-house written software. The
micropositioner was placed on a home built stand and a metal holder for the working
electrode was designed and attached to the positioner. The current was measured by

8
in-house built potentiostat that was interfaced with a computer through an ADC card
(Talisman electronics, PCI-DAS6040) and software written in-house. The current (or
hydrophone response) was also recorded by a Tektronix TDS 2014 4-channel 100
MHz oscilloscope that was triggered by a photodiode (Thorlabs) placed close to the
beam path. A schematic of the experimental arrangement is shown in figure 1 frame
(u).
The solutions were made up using water from an USF Elga Purelab Option
E10 water purification system. Water purified in this manner had a resistivity of at
least 15 MΩ cm and a low organic content (TOC < 30 ppb)1. Sodium sulphate (BDH,
AnalaR), potassium ferrocyanide (Aldrich, 99%) and potassium iodide (Timstar
laboratory suppliers) were used as received. The electrolyte was filtered through a 0.2
µm to remove particulate matter and degassed prior to the electrochemical
experiments.
A Photosonics Phantom v7 high-speed video camera (borrowed from EPSRC
instrument pool) was also employed in the experiments. The camera recorded images
with the maximum speed 150 000 fps and used SR-CMOS sensors with a maximum
resolution of 800 x 600 pixels at up to 4,800 fps giving 1.2 seconds of recording time.
The resolution decreases as the recording speed increases, giving the resolution of 32
x 32 pixels at the highest recording speed (~150,000 fps). A Pentium 4 PC that was
connected to camera processor via 10/100 Ethernet controlled the camera. The camera
recorded continuously and therefore both pre and post-trigger images were available.
Macro lenses were used to focus the camera to the target. The images could be saved
1 manufacturer quoted figure

9
in a TIF-form and they could be downloaded and edited with the Cineview-software
provided. The high-speed camera was also triggered by the photodiode.
A G.R.A.S. 10DB needle hydrophone that measures high frequencies (1-20
MHz with < 2 dB over this range2) and high pressure amplitudes (up to 100 MPa 3)
was employed to detect the cavitation events. It is within these limits that the
hydrophone calibration is valid. A more significant restriction is the sampling
frequency of 5 MHz. The hydrophone signals are impulsive and, as will be shown in
Figures 3(b) and 4(b), the largest signals detected at the position of the hydrophone
were around 3 MPa, and corresponded to the shock emitted as the liquid is broken
down by the focussed laser action (denoted LS2 in Figure 4 (b)). As expected for such
impulsive signals, their spectral content is broadband (see figure 4 (b) insert), and as
the hydrophone signal was used only to note the timing of the arrival of the impulsive
pressure wave at the hydrophone, then this will be achieved with high accuracy by
measurement at one position by this hydrophone.
In order to avoid damage, the hydrophone was placed at least 3 mm away from
the focal spot of the laser beam where the bubbles were generated.
2 obtained from manufacturer
3 manufacturer quoted figure

10
Results and Discussion
Figure 1 shows the shape and size of a bubble event created in the apparatus used to
study single cavitation bubbles generated by laser pulse. In this set of frames it can be
seen that the bubble is generated below the electrode substrate (highlighted in figure 1
frame (a)). The bubble can be seen to grow over a period of ~ 60 µs and then
collapse between frame (h) and (i) (after ~110 µs). Bubble rebound is observed
through frames (i) to (n), after which time the bubble fragments leaving a cloud of
small bubbles close to the electrode surface. In addition to this growth and collapse
phases of the bubble, it is observed that the bubble moves towards the microelectrode.
This motion can be attributed to both buoyancy and Bjerkness forces [1] driving the
bubble towards the microelectrode. Jetting onto the surface appears most prominent
in frame (l) after the primary collapse and rebound.
In order to discriminate between processes that are associated with the laser
pulse (and its possible effects on the electrode surface) a number of experiments were
performed to investigate the effect of laser power on the electrochemical current time
transients recorded. During these experiments it was noted that a strong audible
acoustic signature (a distinct ‘cracking’ sound) could be observed only above a certain
critical laser energy (controlled through adjustment of the Q switch delay used in the
experiment). Considering the nature of the experimental arrangement employed, it is
likely that this observation is associated with a threshold for the formation of a large
cavity within the liquid and its subsequent collapse. This hypothesis was supported
by observation of high-speed video images recorded above and below this critical
threshold. Below the threshold for formation of the audible acoustic signature from
the cell (which was also found to be dependant on the solution constituents), bubble

11
formation was found not to occur as determined by either electrochemical or high-
speed imaging data. For example figure 2 (a) shows the effect of laser pulse focussed
into the liquid directly below a 25 µm diameter Au microelectrode held in a solution
containing a redox probe (specifically potassium ferrocyanide). In this case the
electrode was held under mass transfer limiting conditions (+0.4 V vs. SCE). Hence,
any perturbation in the diffusion field, caused by forced convection processes, will be
detected as a positive current at the microelectrode. In the absence of such
mechanisms, a steady state oxidation current of ~10-14 nA corresponding to the
conversion of ferrocyanide to ferricyanide species at the electrode surface. This was
observed at times < -120 µs with respect to the laser pulse. It should be noted that the
data acquisition was triggered by a photodiode which recorded the discharge of the
laser at time t = 0 s. In this experimental setup (gain, electrode and laser) the
operation of the Q switch and the laser pulse causes a number of transients which
operate over time = -120 µs to ~220 µs. However, after this period the
electrochemical response returns to a value close to the steady state current in the
absence of the laser event. The exact origin of these transients is unknown but can be
linked to the laser pulse. For example the positive transient prior to time t = 0 s
corresponds to the laser Q switch delay. The events after t = 0 s also appear to be a
result of the laser pulse4 as figure 2 (b) shows that there is no strong acoustic signature
4 Note that these ‘interference transients’ appear prior to and after the laser pulse (indeed appear at the
start of the Q switch delay), are dependant on the experimental apparatus employed, the gain of the
electrochemical equipment and without solution breakdown to form a bubble or associated
shockwaves. Hence, we can conclude that some of these interference effects are due to pickup from
the laser. Nevertheless further investigation of other real effects (for example pressure waves and
12
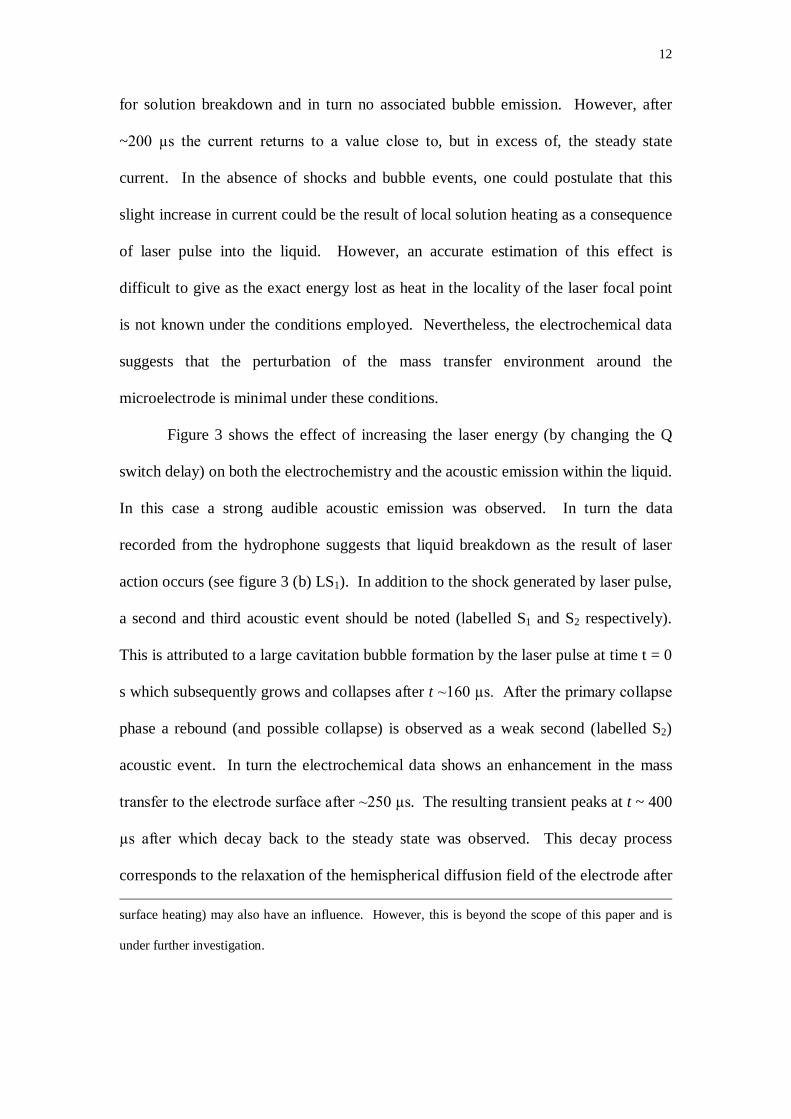
for solution breakdown and in turn no associated bubble emission. However, after
~200 µs the current returns to a value close to, but in excess of, the steady state
current. In the absence of shocks and bubble events, one could postulate that this
slight increase in current could be the result of local solution heating as a consequence
of laser pulse into the liquid. However, an accurate estimation of this effect is
difficult to give as the exact energy lost as heat in the locality of the laser focal point
is not known under the conditions employed. Nevertheless, the electrochemical data
suggests that the perturbation of the mass transfer environment around the
microelectrode is minimal under these conditions.
Figure 3 shows the effect of increasing the laser energy (by changing the Q
switch delay) on both the electrochemistry and the acoustic emission within the liquid.
In this case a strong audible acoustic emission was observed. In turn the data
recorded from the hydrophone suggests that liquid breakdown as the result of laser
action occurs (see figure 3 (b) LS1). In addition to the shock generated by laser pulse,
a second and third acoustic event should be noted (labelled S1 and S2 respectively).
This is attributed to a large cavitation bubble formation by the laser pulse at time t = 0
s which subsequently grows and collapses after t ~160 µs. After the primary collapse
phase a rebound (and possible collapse) is observed as a weak second (labelled S2)
acoustic event. In turn the electrochemical data shows an enhancement in the mass
transfer to the electrode surface after ~250 µs. The resulting transient peaks at t ~ 400
µs after which decay back to the steady state was observed. This decay process
corresponds to the relaxation of the hemispherical diffusion field of the electrode after surface heating) may also have an influence. However, this is beyond the scope of this paper and is
under further investigation.

13
the perturbation by the bubble growth and collapse has occurred. Note that this
process will operate over the ms timescale (considering the electrode size and redox
system employed) and so extends beyond the time window monitored. Interestingly
the electrochemical data suggests a single event rather than an event with rebound (as
indicated by the acoustic measurements and the high-speed imaging of similar events
shown in figure 1). This may be due to the sensitivity limit of the electrochemical
data in comparison with the acoustic signal. It should also be noted that the threshold
between the breakdown of the liquid (and the subsequent formation of a large
cavitation bubble), and non-breakdown of the liquid, was found to be dependent on
the solution constituents (see figure 1 vs. figure 3 and 4 for example).
Figure 4 shows the electrochemical and acoustic data recorded as the laser
power (and hence bubble size) is increased. Figure 4 (b) shows that a shock is emitted
as the liquid is broken down by the focussed laser action (denoted LS2). In this case
the magnitude of the LS2 is considerably bigger (> 2.5 MPa) than that shown in figure
2 (b) (LS1 ~ 0.8 MPa). In addition the signal from the bubble collapse is also
considerable (S3 ~ 0.9 MPa) and the rebound signal (S4 ~ 0.55 MPa) is clearly
defined. Interestingly the bubble lifetime (defined here as the time taken from laser
pulse to primary collapse) has increased in comparison to figure 3 (b) to t ~ 208 µs in
agreement with the assertion that the bubble size has increased. The rebound event
was found to occur at t ~ 314 µs with respect to the laser pulse. The electrochemical
data also shows interesting features not seen before. Figure 4 (a) shows two mass
transfer enhancement events (denoted as B1 and B2) after the events associated with
the laser pulse. The separation in time between these two mass transfer events was
found to be of the order of 120 9 µs. This is in close agreement with the separation
14
between primary collapse and rebound of the bubble (106 µs) determined from the
acoustic trace (note some degree of difference between these separate measurements
is expected even though the laser power and other experimental conditions were kept
the same). This evidence suggests that the events labelled B1 and B2 are associated
with primary bubble collapse and rebound events respectively.
The mass transfer coefficients recorded from these experiments are of the
order of 0.16 cm s-1. Considering that the rate constant for heterogeneous electron
transfer has been reported for this system to be 0.3-0.4 cm s-1 [30] and that the
potential of the electrode is on the mass transfer limiting plateau of the redox system
(as determined from voltammetry not shown), we can assume that electrode kinetic
effects will not play a significant role in the interpretation of the data.
Finally, it should be noted that due to the high gain (used to ensure a good
signal to noise ratio for this system) employed (107 V A-1), the response time of the
current follower is likely to be limiting5. Hence the absolute current magnitude at the
event peaks will be restricted by op-amp response. Clearly under these conditions
conclusions regarding the absolute magnitude of the mass transfer enhancement
require further investigation. This is currently underway.
It is interesting to note that the mass transfer enhancements (where strong
rebound was observed – see figure 4) are most prominent after the primary collapse
and rebound: whereas the acoustic signature as a result of bubble action is strongest
5 The response time of the current follower employed was measured by applying a potential step across
a dummy resistor (1 x 10⁷ Ω) at a gain of 1 x 10⁷ V A-1. The maximum response time was found to be
10.2 0.5 mA s-1 while the maximum response obtained from the current time trace (defined as the
gradient of the steepest section of the i-t trace) at ~ 185 µs, figure 4 (a)) was 10.6 0.6 mA s-1.

15
from the primary collapse (see S3). This observation may indicate that the motion of
the bubble towards the interface (observed in the high-speed video footage) may
result in the secondary collapse of the bubble providing more mass transfer
enhancement (and hence higher currents) when compared to the primary collapse.
However, it should be noted that the video sequence shown in figure 1 was not
recorded at the same time as the electrochemical data shown in figures 2 through 4.
Hence further evidence for this link can only be obtained if simultaneous video and
electrochemical data is obtained. This investigation is currently underway.
16
Conclusions
The mass transfer enhancement from a single large cavitation bubble has been
measured using a microelectrochemical technique. Significant enhancements in mass
transfer (mass transfer coefficients of up to 0.16 cm s-1) have been demonstrated when
single bubbles are generated by laser pulse close to the electrode surface. Evidence
for bubble growth and rebound has been gained from electrochemical, acoustic and
high-speed video footage. A threshold in electrolyte solutions for the formation of
large cavitation bubbles has been noted from both electrochemical and acoustic data.
Acknowledgements
We thank the EPSRC and MoD (JGS system) for funding for HMH (GR/S01764/01),
The Engineering Loan pool for the use of the high-speed camera used in this work and
Dr Graham Ball for useful discussions.

17
Figure legends
Figure 1. High-speed video sequence of a single laser generated bubble below a
microelectrode. Frame rate = 68,000 fps. The laser power was ~9 mJ. The solution
consisted of 1 mM KI in 0.2 M Na2SO4. The experiments were performed at room
temperature (~20 oC). The scale bar (see frame (a)) represents 1 mm. The bubble
maximum radius was measured at 535 µm with an s/Rmax value of 1.76. Note the
microelectrode (denoted by ‘M’) boundary is highlighted by the dotted line in frame
(a). Frame (a) is assigned as time t = 0 s for the discussion shown in the text (the
times of each frame are given in µs). Frame (u) shows a schematic representation of
the lens arrangement described in the experimental section. Note PD is the
photodiode, WE the working electrode, CE the counter electrode and RE the reference
electrode.
Figure 2. (a) Plots showing the simultaneous measurement of the response of the
photodiode and the electrochemical signal recorded by a microelectrode (25 µm
diameter Au) following a laser pulse into the solution The electrode was held at +0.4
V vs. SCE. (b) shows the acoustic trace detected with a G.R.A.S. 10DB needle
hydrophone in comparison to the laser pulse (shown as the photodiode output, EPD).
The laser power was ~7 mJ. The electrolyte consisted of a filtered and degassed6 5
mM K4Fe(CN)6/0.1 M Sr(NO3)2 solution. The microelectrode was positioned ~1.5
mm from the focal point of the laser. The experiments were performed at room
temperature (~20 oC). 6 although the electrolyte was degassed prior to use, some gas reintroduction may occur over the time
period of the experiment
18
Figure 3. (a) Plots showing the simultaneous measurement of the response of the
photodiode and the electrochemical signal recorded by a microelectrode (25 µm
diameter Au) following a laser pulse into the solution. The electrode was held at +0.4
V vs. SCE. (b) shows the acoustic trace detected with a G.R.A.S. 10DB needle
hydrophone in comparison to the laser pulse (shown as the photodiode output, EPD).
The laser power was ~23 mJ. All other experimental details are reported in figure 2
legend.
Figure 4. (a) Plots showing the simultaneous measurement of the response of the
photodiode and the electrochemical signal recorded by a microelectrode (25 µm
diameter Au) following a laser pulse into the solution. The electrode was held at +0.4
V vs. SCE. (b) shows the acoustic trace detected with a G.R.A.S. 10DB needle
hydrophone in comparison to the laser pulse (shown as the photodiode output, EPD).
The laser power was ~44 mJ. The insert shows an FFT analysis (Power Spectral
Density/AU) of the signal denoted LS2. Note the pressure time trace was sampled at 5
MHz. All other experimental details are reported in figure 2 legend.

19
References [1] T. G. Leighton, The Acoustic Bubble, Academic Press, London, 1994. [2] D. G. Offin, An investigation of fast surface re-formation in the presence of
inertial (transient) cavitation, University of Southampton, Southampton, 2006. [3] T. G. Leighton, M. Farhat, J. E. Field, and F. Avellan, Journal of Fluid
Mechanics, 480 (2003) 43. [4] I. Hansson, V. Kedrinskii, and K. A. Morch, Journal of Physics D: Applied
Physics, 15 (1982) 1725. [5] I. Hansson and K. A. Morch, Journal of Applied Physics, 51 (1980) 4651. [6] B. Vyas and C. M. Preece, Journal of Applied Physics, 47 (1976) 5133. [7] A. Vogel, K. Nahen, D. Theisen, and J. Noack, IEEE Journal of Selected
Topics in Quantum Electronics 2(1996) 847. [8] Y. Tomita and A. Shima, Acustica, 71 (1990) 161. [9] W. Lauterborn and C. D. Ohl, Ultrasonics Sonochemistry, 4 (1997) 67. [10] O. Lindau and W. Lauterborn, Journal Of Fluid Mechanics, 479 (2003) 327. [11] A. Philip and W. Lauterborn, Journal of Fluid Mechanics, 361 (1998) 75. [12] R. H. Mellen, Journal Of The Acoustical Society Of America, 28 (1956) 447. [13] N. Moriguchi, Journal of the Chemical Society of Japan, 55 (1934) 749. [14] C. E. Banks and R. G. Compton, Chemia Analityczna, 48 (2003) 159. [15] S. Floate, J. L. Hardcastle, E. Cordemans, and R. G. Compton, Analyst, 127
(2002) 1094. [16] J. Kruusma, C. E. Banks, E. Lust, H. Keis, L. Nei, and R. G. Compton,
Electroanalysis, 16 (2004) 596. [17] J. Kruusma, L. Nei, J. L. Hardcastle, R. G. Compton, E. Lust, and H. Keis,
Electroanalysis, 16 (2004) 399. [18] J. Kruusma, C. E. Banks, L. Nei, and R. G. Compton, Analytica Chimica Acta,
510 (2004) 85. [19] P. R. Birkin and S. Silva-Martinez, Journal of Electroanalytical Chemistry,
416 (1996) 127. [20] P. R. Birkin and S. Silva-Martinez, Journal of the Chemical Society Chemical
Communications, (1995) 1807 [21] E. Maisonhaute, P. C. White, and R. G. Compton, Journal of Physical
Chemistry B, 105 (2001) 12087. [22] P. R. Birkin, R. O'Connor, C. Rapple, and S. Silva-Martinez, Journal of the
Chemical Society Faraday Transactions, 94 (1998) 3365. [23] P. R. Birkin, D. G. Offin, and T. G. Leighton, Electrochemistry
Communications, 6 (2004) 1174. [24] S. Silva-Martinez, Applications of Ultrasound in Electrochemistry, University
of Southampton, Southampton, 1997. [25] P. R. Birkin, Y. E. Watson, and T. G. Leighton, Journal of the Chemical
Society Chemical Communications, (2001) 2650. [26] P. R. Birkin, D. G. Offin, P. F. Joseph, and T. G. Leighton, Journal Of
Physical Chemistry B, 109 (2005) 16997. [27] P. R. Birkin, D. G. Offin, and T. G. Leighton, Physical Chemistry Chemical
Physics, 7 (2005) 530. [28] P. R. Birkin, D. G. Offin, and T. G. Leighton, Wear, 258 (2005) 623. [29] G. Denuault, Chemistry in Industry, 18 (1996) 678.

20
[30] C. Beriet and D. Pletcher, Journal of Electroanalytical Chemistry, 361 (1993) 93.

21
Figure 1
(u)
(a) 0 (b) 15 (c) 29 (d) 44 (e) 58
(f) 73 (g) 87 (h) 92 (i) 106 (a)
(k) 135 (l) 150 (m) 164 (n) 179 (o) 193
(p) 208 (q) 212 (r) 227 (s) 241 (t) 256
M
(j) 121

22
t/µs0 500 1000 1500 2000
i/nA
-80
-60
-40
-20
0
20
40
60
80
100E
PD /V
0.0
0.5
1.0
1.5
2.0
2.5
3.0(a)
t/µs0 100 200 300 400
Pa/k
Pa
-1000
-800
-600
-400
-200
0
200
400
600
800
1000
EP
D /V
0
1
2
3
4
5(b)
Figure 2

23
Figure 3
t/µs
0 500 1000 1500 2000
i/nA
-100
-50
0
50
100
150
200
250E
PD /V
0
1
2
3
4(a)
t/µs0 100 200 300 400
Pa/k
Pa
-800
-600
-400
-200
0
200
400
600
800
1000
EPD /V
0
1
2
3
4
5
6
7
LS1S1
S2
(b)

24
t/µs0 500 1000 1500 2000
i/nA
0
50
100
150
200
250
300
350
400
EP
D /V
0
2
4
6
8
10
12
B1
B2(a)
t/µs0 100 200 300 400
Pa/k
Pa
-1000
-500
0
500
1000
1500
2000
2500
3000
EP
D /V
0
2
4
6
8
10
12
14
16
18
S3
S4
LS2(b)
Figure 4