Embed Size (px)
Citation preview
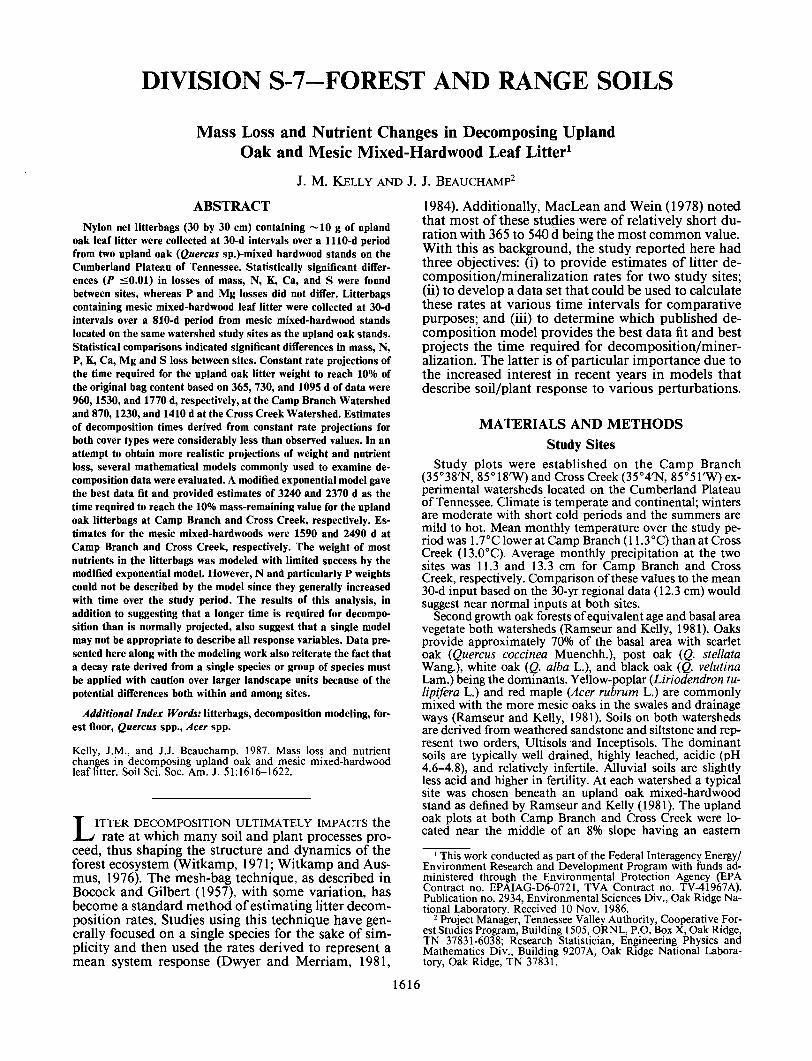
DIVISION S-7-FOREST AND RANGE SOILS
Mass Loss and Nutrient Changes in Decomposing UplandOak and Mesic Mixed-Hardwood Leaf Litter1
J. M. KELLY AND J. J. BEAUCHAMPZ
ABSTRACT
Nylon net litterbags (30 by 30 cm) containing —10 g of uplandoak leaf litter were collected at 30-d intervals over a 1110-d periodfrom two upland oak (Quercus sp.(-mixed hardwood stands on theCumberland Plateau of Tennessee. Statistically significant differ-ences (P <0.01) in losses of mass, N, K, Ca, and S were foundbetween sites, whereas P and Mg losses did not differ. Litterbagscontaining mesic mixed-hardwood leaf litter were collected at 30-dintervals over a 810-d period from mesic mixed-hardwood standslocated on the same watershed study sites as the upland oak stands.Statistical comparisons indicated significant differences in mass, N,P, K, Ca, Mg and S loss between sites. Constant rate projections ofthe time required for the upland oak litter weight to reach 10% ofthe original bag content based on 365, 730, and 1095 d of data were960,1530, and 1770 d, respectively, at the Camp Branch Watershedand 870,1230, and 1410 d at the Cross Creek Watershed. Estimatesof decomposition times derived from constant rate projections forboth cover types were considerably less than observed values. In anattempt to obtain more realistic projections of weight and nutrientloss, several mathematical models commonly used to examine de-composition data were evaluated. A modified exponential model gavethe best data fit and provided estimates of 3240 and 2370 d as thetime required to reach the 10% mass-remaining value for the uplandoak litterbags at Camp Branch and Cross Creek, respectively. Es-timates for the mesic mixed-hardwoods were 1590 and 2490 d atCamp Branch and Cross Creek, respectively. The weight of mostnutrients in the litterbags was modeled with limited success by themodified exponential model. However, N and particularly P weightscould not be described by the model since they generally increasedwith time over the study period. The results of this analysis, inaddition to suggesting that a longer time is required for decompo-sition than is normally projected, also suggest that a single modelmay not be appropriate to describe all response variables. Data pre-sented here along with the modeling work also reiterate the fact thata decay rate derived from a single species or group of species mustbe applied with caution over larger landscape units because of thepotential differences both within and among sites.
Additional Index Words: litterbags, decomposition modeling, for-est floor, Quercus spp., Acer spp.
Kelly, J.M., and J.J. Beauchamp. 1987. Mass loss and nutrientchanges in decomposing upland oak and mesic mixed-hardwoodleaf litter. Soil Sci. Soc. Am. J. 51:1616-1622.
LITTER DECOMPOSITION ULTIMATELY IMPACTS therate at which many soil and plant processes pro-
ceed, thus shaping the structure and dynamics of theforest ecosystem (Witkamp, 1971; Witkamp and Aus-mus, 1976). The mesh-bag technique, as described inBocock and Gilbert (1957), with some variation, hasbecome a standard method of estimating litter decom-position rates. Studies using this technique have gen-erally focused on a single species for the sake of sim-plicity and then used the rates derived to represent amean system response (Dwyer and Merriam, 1981,
1984). Additionally, MacLean and Wein (1978) notedthat most of these studies were of relatively short du-ration with 365 to 540 d being the most common value.With this as background, the study reported here hadthree objectives: (i) to provide estimates of litter de-composition/mineralization rates for two study sites;(ii) to develop a data set that could be used to calculatethese rates at various time intervals for comparativepurposes; and (iii) to determine which published de-composition model provides the best data fit and bestprojects the time required for decomposition/miner-alization. The latter is of particular importance due tothe increased interest in recent years in models thatdescribe soil/plant response to various perturbations.
MATERIALS AND METHODS
Study SitesStudy plots were established on the Camp Branch
(35°38'N, 85°18'W) and Cross Creek (SSM'N, 85°51'W) ex-perimental watersheds located on the Cumberland Plateauof Tennessee. Climate is temperate and continental; wintersare moderate with short cold periods and the summers aremild to hot. Mean monthly temperature over the study pe-riod was 1.7°C lower at Camp Branch (11.3°C) than at CrossCreek (13.0°C). Average monthly precipitation at the twosites was 11.3 and 13.3 cm for Camp Branch and CrossCreek, respectively. Comparison of these values to the mean30-d input based on the 30-yr regional data (12.3 cm) wouldsuggest near normal inputs at both sites.
Second growth oak forests of equivalent age and basal areavegetate both watersheds (Ramseur and Kelly, 1981). Oaksprovide approximately 70% of the basal area with scarletoak (Quercus coccinea Muenchh.), post oak (Q. stellataWang.), white oak (Q. alba L.), and black oak (Q. velutinaLam.) being the dominants. Yellow-poplar (Liriodendron tu-lipifera L.) and red maple (Acer rubrum L.) are commonlymixed with the more mesic oaks in the swales and drainageways (Ramseur and Kelly, 1981). Soils on both watershedsare derived from weathered sandstone and siltstone and rep-resent two orders, Ultisols and Inceptisols. The dominantsoils are typically well drained, highly leached, acidic (pH4.6-4.8), and relatively infertile. Alluvial soils are slightlyless acid and higher in fertility. At each watershed a typicalsite was chosen beneath an upland oak mixed-hardwoodstand as denned by Ramseur and Kelly (1981). The uplandoak plots at both Camp Branch and Cross Creek were lo-cated near the middle of an 8% slope having an eastern
1 This work conducted as part of the Federal Interagency Energy/Environment Research and Development Program with funds ad-ministered through the Environmental Protection Agency (EPAContract no. EPAIAG-D6-0721, TVA Contract no. TV-41967A).Publication no. 2934, Environmental Sciences Div., Oak Ridge Na-tional Laboratory. Received 10 Nov. 1986.
2 Project Manager, Tennessee Valley Authority, Cooperative For-est Studies Program, Building 1505, ORNL, P.O. B9x X, Oak Ridge,TN 37831-6038; Research Statistician, Engineering Physics andMathematics Div., Building 9207A, Oak Ridge National Labora-tory, Oak Ridge, TN 37831.
1616
KELLY & BEAUCHAMP: DECOMPOSING UPLAND OAK AND MESIC MIXED-HARDWOOD LEAF LITTER 1617
Table 1. Summary of statistical comparison between sites forthe upland oak and mesic mixed-hardwood litterbags.
Cover type
Upland oakMain effects
SiteDate
InteractionSite x Date
Mesic mixed-hardwoodMain effects
SiteDate
InteractionSite x Date
Percentweight
remaining
**
NSt
**
NS
Element weight remaining
N
*
NS
*NS
NS
P K
NS »
NS *
NS *
NS *
Ca Mg
* NS
NS NS
* *
* NS
S
*
NS
*
NS* Significant at P < 0.01. t NS indicates P > 0.01.
exposure. Mesic mixed-hardwood plots were located on rel-atively flat alluvial sites with an eastern exposure. Addi-tional information on stand composition and litterfall inputscan be found in Ramseur and Kelly (1981) and Kelly (1984a,b).
Field and Laboratory ProceduresFreshly fallen leaves were collected from typical upland
oak-mixed hardwood stands at Camp Branch and CrossCreek during November 1976. Leaves were air-dried in thelaboratory and placed in 30- by 30-cm nylon net bags. Thebottom layer of netting had 2-mm openings, and the toplayer had 10-mm openings in order to provide access forlarger invertebrate decomposers. Each bag contained ~ 10 g(oven-dry basis) of mixed oak litter in the following pro-portions based on relative species contribution to litterfall:white oak (30%), scarlet oak (20%), post oak (20%), chestnutoak (20%), and black oak (10%). Bags were placed on theforest floor in four groups containing 36 bags each. A heavysnowfall in early February 1977 helped to incorporate thelitterbags into the forest floor. Bags were collected at 30-dintervals from May 1977 through February 1980. On eachsampling date one bag was chosen at random from each ofthe four groups and freed of any external contamination. Inthe laboratory an attempt was made to remove any mineralsoil or other foreign material inside the bag. Bags with ex-cessive soil contamination or rodent damage were excludedfrom further analysis. The contents of the bag were thenoven dried at 80°C, weighed, ground to pass a 0.4 /tm (40-mesh) sieve, and analyzed chemically for N, P, K, Ca, andMg using the procedures of Horowitz (1980) and for S ac-cording to Tiedemann and Anderson (1971).
Leaves for the mesic mixed-hardwood study were col-lected in September and October 1977, placed in bags fol-lowing the procedures described previously, and returned tothe field during November 1977. Litterbags used in the mesicmixed-hardwood study contained white oak (50%), yellow-poplar (30%), and red maple (20%). Sample collection beganin February 1978 and ran through February 1980. Collec-tion, processing, and chemical analysis procedures were thesame as those previously described. A total of 144 litterbagswere collected from the upland oak-mixed hardwood siteand 96 from the mesic mixed-hardwood site at each wa-tershed.
Statistical ProceduresAn unbalanced approach to statistical analysis was neces-
sitated by the fact that certain cells had fewer observationsthan others as a result of the previously mentioned exclu-sions. A separate analysis of variance was conducted foreach response variable within a litter type and contained
100 7
90
80
70
60
50
40
30
20
10
0
$ 5 0 -
I I I I I I I I I IUPLAND OAK -
• CAMP BRANCHo CROSS CREEK
A J A O D i F A J A O D i F A J A O D j FI ...,. 19791977 1978 1980
jft
oi<Ulc1-1
1UO t 1 1 1 1 1 1 1 1 1 1 1 190
80
70
60
50
40
30
20
10
0 ———— ————————————————————————————
1. (b) MESIC MIXED-HARDWOOD _
-V —V.-K
- X .V.\ ^V\
"X'x ̂ ^^ A A -
*~'X"*'" \ • "A "• fr- '/v. V V-— —
I I I I I I I I I I I ID i F A J A O D | F A J A O D | F
1977 1978 ' 1979 1980
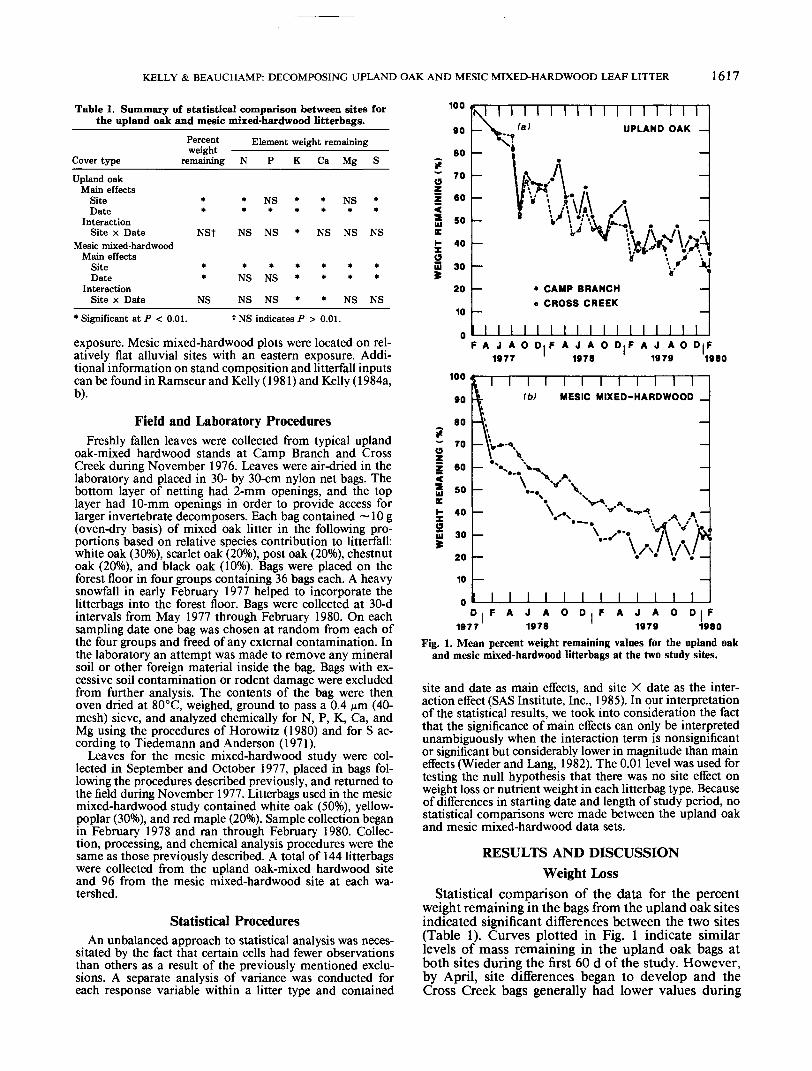
Fig. 1. Mean percent weight remaining values for the upland oakand mesic mixed-hardwood litterbags at the two study sites.
site and date as main effects, and site X date as the inter-action effect (SAS Institute, Inc., 1985). In our interpretationof the statistical results, we took into consideration the factthat the significance of main effects can only be interpretedunambiguously when the interaction term is nonsignificantor significant but considerably lower in magnitude than maineffects (Wieder and Lang, 1982). The 0.01 level was used fortesting the null hypothesis that there was no site effect onweight loss or nutrient weight in each litterbag type. Becauseof differences in starting date and length of study period, nostatistical comparisons were made between the upland oakand mesic mixed-hardwood data sets.
RESULTS AND DISCUSSIONWeight Loss
Statistical comparison of the data for the percentweight remaining in the bags from the upland oak sitesindicated significant differences between the two sites(Table 1). Curves plotted in Fig. 1 indicate similarlevels of mass remaining in the upland oak bags atboth sites during the first 60 d of the study. However,by April, site differences began to develop and theCross Creek bags generally had lower values during
1618 SOIL SCI. SOC. AM. J., VOL. 51, 1987
the remainder of the study. A statistically significantdifference in percent weight-remaining as a functionof site was also observed for the mesic mixed-hard-wood bags (Table 1). However, in this case the CampBranch mesic mixed-hardwood bags lost more massover time than did the Cross Creek bags (Fig. 1). Also,in contrast to the upland oak bags, the mesic mixed-hardwood curves plotted in Fig. 1 separated imme-diately and generally remained separated throughoutthe study.
Annual weight loss values reported in the literaturefor litter types similar to the ones used in this studyrange from 17 to 60% with most values in the 30 to40% range (Lunt, 1935; Bocock and Gilbert, 1957; Ku-cera, 1959;Olson, 1963;Crossleyand Witkamp, 1964;Thomas, 1970; Cromack and Monk, 1975; Dwyer andMerriam, 1984). MacLean and Wein (1978) report lit-ter weight loss of 38 to 58% after 365 d and 47 to 62%after 730 d from two hardwood stands in New Bruns-wick. Attiwill (1968) in a study of eucalyptus (Euca-lyptus obliqua L'Herit.) leaves found a 49% weight lossafter 365 d and a 54% loss after 730 d. Data from thepresent study are consistent with values previouslyreported and further illustrate that litter decomposi-tion, as reflected by percent of original weight re-maining, slows greatly with time as the recalcitrantfraction comes to dominate the remaining material.
Differences in decomposition curves within a littertype appear to be a function of microclimate consid-erations more than any other factor. As noted byDeBoois (1974) and Dwyer and Merriam (1981),moisture appears to be the most important consider-ation in decomposition. Visual observations duringthe study indicate that the Cross Creek upland oaksite provided a more mesic environment as a resultof slightly higher precipitation inputs combined withother site factors. However, the same observation didnot hold true for the mesic mixed-hardwood site atCross Creek even though it received approximatelythe same amount of direct precipitation input as theupland oak site. Other site factors such as the degreeof forest floor shading and a lower level of subsurfacemoisture movement combined to make it less moistthan the mesic mixed-hardwood site at Camp Branch,which appears to receive more subsurface moistureinput.
Modeling Weight LossAfter evaluating several of the models summarized
by Wieder and Lang (1982), the following double ex-ponential model was considered to provide the mostrealistic description of the observed data.
7 = ^exp(-/c,0 + (100 - A)exp(-k2t) + e . [1]In this model, Y is the observed litter weight remain-ing, expressed as a percentage of the initial weight,after time t; e is the random component with a meanof 0 and variance a2; and A, k{, and k2 are unknownparameters estimated from the data. A modificationof the double exponential model was also considered,which allowed for a time-dependent relative decom-position rate through the introduction of the powerparameter p. The model given by Eq. [2]
Y = 100 exp(-fa') + e [2]
has many of the advantages of the double exponentialmodel (Y = 100 at t = 0 and Y _ 0 as t -» oo) withfewer parameters (2 vs. 3).
Both models have constraints on the parameters thatmust be satisfied to produce a realistic model for pre-dictive or extrapolation purposes. For example, in Eq.[1] A must satisfy 0 < A < 100 and in both modelsthe fc's must be >0. It should be noted that as A —» 0or 100, Eq. [1] takes the form of a single exponentialmodel. In addition, the modified exponential modeltakes the form of a single exponential model when p= 1.
The observed data can be used to estimate, at eachvalue of t, a mean value of Y based on the observa-tions from n litterbags. Since the values of n may beunequal, the estimates of the parameters in the modelof interest are obtained by minimizing the followingweighted sum of squares (WSS):
N
wss = 2>,. [Y, - M e)]2i-l
where Yt is the observed mean weight loss of «, lit-terbags at time thj(th 0) is the regression function givenin Eq. [1] and [2] and 6 is the vector containing themodel parameters to be estimated. The nonlinear es-timation procedure NLIN (SAS Institute, Inc., 1985)and the E04KCF optimization routine (Numerical Al-gorithms Group, Inc., 1977) were used to calculate theparameter estimates and their associated standard er-rors.
Two problems were apparent from an examinationof the results of the unconstrained nonlinear estimatesfor the double exponential model. First, negative es-timates of k2 were found for two of the four data sets.This is disastrous for extrapolation, since Y would ul-timately increase for large values of t. Second, nu-merical instability was exhibited for the data from themesic mixed-hardwood type at the Cross Creek site.This instability ultimately resulted in the useless es-timate of k\ = 106. The above problems imply thatthe double exponential model may be an over-speci-fied model without applicability for these data sets.The constrained estimation for the upland oak dataresulted in estimates of k2 that went to the boundary(k2 = 0) for both data sets.
Table 2 contains a summary of the results of theunconstrained estimation for the modified exponen-tial model. A review of the results leads to the follow-ing conclusions pertaining to the choice of this modelfor describing the weight loss data. First, no estima-tion problems were encountered with any of the datasets. Second, only a 4 to 8% increase in WSS was ob-served from the use of the simpler model [2]. In fact,WSS decreased for the mesic mixed-hardwood datafrom Cross Creek. Third, the estimated p parameter
Table 2. Parameter estimates for the modified exponentialmodel applied to the weight-remaining data.
Type Site SB SE WSS
Upland oak Camp Branch 4.63 x 10'sCross Creek 4.36 x 10''
2.65 x 10-'2.26 x 10-'
0.77 0.088 64280.81 0.080 5972
Mesic mixed- Camp Branch 3.38 x 10'' 9.47 x 10'! 0.57 0.049 2014hardwood Cross Creek 1.89 x 10'1 4.07 x lO'3 0.61 0.035 783
KELLY & BEAUCHAMP: DECOMPOSING UPLAND OAK AND MESIC MIXED-HARDWOOD LEAF LITTER 1619
100
ozz
> 50ccI-
10
I I
o CAMP BRANCHA CROSS CREEK
J_ J_ J_ _L I I365 730 1230 1410 1530 1770 1825870 960 1095
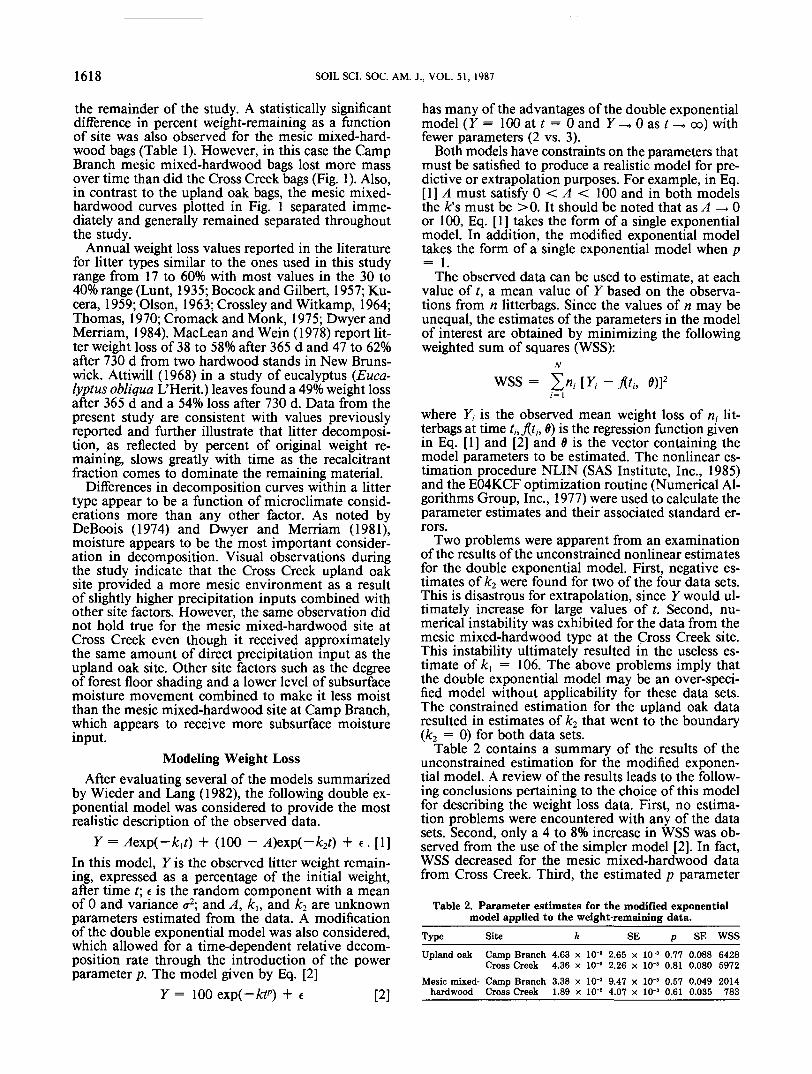
TIME (days)Fig. 2. Projection of time required (d) to reach a level of 10% weight remaining based on a constant decomposition rate using 365-, 730-, or
1095-d data from the Camp Branch Upland Oak site.
was significantly <1 for all data sets, indicating thatthe single exponential model would not be appropri-ate. Fourth, the upland oak type produced smaller es-timated values of k but larger estimated values of p.This implies a significant difference in the behavior ofweight change for the upland oak vs. mesic mixed-hardwood type. Finally, no significant differences ap-pear to exist between the estimated values of p fromthe two sites within a given type.
Using the modified exponential model (Eq. [2]), itis possible to estimate the time needed for litter massto decrease to any specified percent of the initial litterweight. Estimates of the time required to reach the5(ts) and \0(tw)% remaining values for the differentlitter types and locations are summarized in Table 3.Since we are using the model to extrapolate beyondthe region of observation, these estimates must be usedwith some caution. If there is another component notaccounted for in the assumed model that comes intoplay in this extrapolated region, then the estimates of110 and £5 could be inaccurate. However, estimates givenin Table 3 seem to be much more realistic than thoseobtained by assuming a constant decomposition rate,as shown graphically in Fig. 2, using the Camp Branchupland oak weight loss data as an example. If the re-sults of 365 d of decomposition are used to project aconstant rate of decay, then approximately 960 d wouldbe required to reach the 10% weight-remaining value.Actual percent weight remaining at 960 d was 52%.The 1080-d data set using a constant decay rate wouldprovide an estimate of ~ 1770 d (Fig. 2), whereas themodel prediction is on the order of 3270 d. Both ofthese values are certainly much longer than those nor-
Table 3. Estimates of time for litter weight to decrease to5 and 10% of initial weight based on the modified
exponeital model (Eq. [2]).Type Site
Upland oak
Mesic mixed-hardwood
Camp BranchCross CreekCamp BranchCross Creek
3240 45902370 327015902490
25203840
mally proposed in the literature and may be an ov-erestimate due to the possible movement of materialsinto the litterbags. In either case, use of constant decayrates derived from short-term studies has the potentialto underestimate the time required for decompositionof this type of litter.
Changes in Litterbag Nutrient ContentUpland oak litterbags exhibited a general decline in
nutrient content with the passage of time for all ele-ments except P. The P content of the upland oak bagsactually increased approximately fourfold (Table 4)based on comparison of initial and final nutrient con-tent. Nitrogen weights also exhibited an increase dur-ing the early part of the study, but declined below thestarting value by the end of the study. Concentrationvalues for N, P, and S generally increased with timeat both sites, while changes in Ca and K concentra-tions were inconsistent (Table 4). Magnesium concen-tration was essentially unchanged (Table 4). Statisticalcomparison of the element weight-remaining data forthe upland oak bags indicated significant site differ-ences in N, K, Ca, and S weight remaining (Table 1);there is a degree of ambiguity in the K response sincethe interaction term from the ANOVA was significant(Table 1).
Nutrient response in the mesic mixed-hardwoodbags was similar to the response observed in the up-land oak bags. The P weight response, however, wasnot as consistent since the Camp Branch bags de-creased in P weight by ~24%, whereas Cross Creekbags increased by ~10%. Increases in N, P, and Sconcentrations were again observed (Table 4), whereK and Mg concentrations exhibited clear declines. Re-sponse of Ca was again inconsistent. Statistical com-parison of the mesic mixed-hardwood element weightremaining data indicated that the two sites differedsignificantly for all elements, although the ANOVAinteraction terms were significant in the analysis ofboth the K and Ca data (Table 1).
Gosz et al. (1973) and MacLean and Wein (1978)suggest that the initial elemental concentration of thelitter and the microbial demand for nutrients may ac-count for the diversity of responses reported in the
1620 SOIL SCI. SOC. AM. J., VOL. 51, 1987
Table 4. Mean element concentration and weight values for the upland oak and mesic mixed-hardwood litterbags at thestart and end of the study period for the Camp Branch and Cross Creek sites.
N
Parameter
Concentration, g kg"'
Weight, mg bag-'
Site
Camp BranchCross CreekCamp BranchCross Creek
Start
7.26.8
63.361.2
End
18.116.555.838.9
Start
0.30.32.52.4
P K
End Start
Upland Oak1.1 0.81.7 1.73.3 7.02.6 15.1
Ca
End
1.10.83.41.9
Start
10.211.390.5
101.0
End
9.616.629.340.2
Mg
Start
0.70.76.16.5
End
0.70.82.01.9
S
Start
0.91.17.9
10.2
End
1.81.75.53.9
Mesic mixed-hardwoodConcentration, g kg"'
Weight, mg bag"1
Camp BranchCross CreekCamp BranchCross Creek
5.46.3
47.955.8
15.016.334.043.6
0.30.32.52.6
0.8 3.11.0 3.41.9 27.42.9 29.7
0.70.81.72.4
12.915.8
114.4139.6
6.218.213.545.3
1.81.6
15.614.0
0.60.71.51.9
1.11.39.4
12.4
1.61.83.74.6
literature with respect to trends in nutrient flux in de-composing litter. Nitrogen and P have been reportedto exhibit increases in both concentration and weightremaining in some studies (Anderson, 1973; Bocock,1964; Gilbert and Bocock, 1969; Gosz et al., 1973,1976; Yount, 1975) as well as declines in others (At-tiwill, 1968; Kelly and Henderson, 1978; Lousier andParkinson, 1978; Reiners and Reiners, 1970). Mc-Brayer (1977) suggested that P may be one of the mostimportant nutrients controlling decomposer popula-tions in many forests in eastern Tennessee due to itsextremely low availability. In most studies Ca releaseappears to parallel litter mass loss rather closely whileMg and K, after an initial reduction due to leaching,are retained and lost at slower rates (Attiwill, 1968;Thomas, 1970; Gosz et al., 1973, 1976; Lousier andParkinson, 1978; MacLean and Wein, 1978). As pre-viously observed by Gosz et al. (1973), S concentra-tion increased with time in both litter types; however,
trends in S loss were more consistent with generalweight loss. Other work on soil from the Camp Branchsite has suggested that most of the S accumulated inthe litter layers and soil organic matter is probably inan ester-sulfate form and is not readily mineralizableunder normal circumstances (Kelly and Johnson,1982).
Modeling Changes in Litter Nutrient ContentThe modified exponential model [Eq. (2)] was ap-
plied to the nutrient weight loss data, and since thenutrient weight loss data were expressed in terms ofgrams per bag, it was necessary to include an addi-tional parameter in the model associated with the in-itial (t = 0) nutrient mass:
Y = a e\p(-kt") + [3]In the previous section, a was fixed at 100, whereas itis now a parameter to be estimated. The estimates of
Table 5. Results from fitting modified exponential model y = a exp(-ktp) to elemental weight loss data.
Cover type Site a(SE) k (SE) p(SE)
Upland oak
Mesic mixed-hardwood
Upland oak
CampCrossCampCross
Camp
BranchCreekBranchCreek
BranchCross Creek
Mesic mixed-hardwood
Upland oak
CampCross
Camp
BranchCreek
BranchCross Creek
Mesic mixed-hardwood
Upland oak
Mesic mixed-hardwood
Upland oak
Mesic mixed-hardwood
Upland oak
Mesic mixed-hardwood
CampCross
CampCrossCampCross
CampCrossCampCross
CampCrossCampCross
BranchCreek
BranchCreekBranchCreek
BranchCreekBranchCreek
BranchCreekBranchCreek
tT
47.855.8
7.9910.139.36
12.40
tttt
6.9915.1327.4929.73
6.216.52
15.5914.10
85.85102.00113.84139.52
(2.94)(2.18)
(0.50)(0.55)(0.40)(0.37)
(0.63)(0.53)(0.51)(0.54)
(0.40)(0.35)(0.38)(0.21)
(4.93)(6.17)(2.99)(4.97)
1.8 X4.9 X
Sulfur2.5 X4.5 X9.1 x2.4 X
Phosphorus
Potassium4.3 X3.0 x
Magnesium2.1 x2.9 x1.7 x1.9 x
Calcium2.3 x4.1 x1.8 x1.2 x
tt
10"3 (4.610"' (6.4
10"' (1.110"' (5.010"' (4.110"' (7.3
tttt
10-2 (5.010"' (9.91.3 (3.51.3 (3.5
10"2 (1.610-2 (1.810"1 (3.210"' (3.1
10"' (3.910-1 (3.910"* (5.310-s (9.1
x 10"")x 10"')
x 10"3)x 10"3)x 10"2)x 10"2)
x 1Q-2)x 10"')x 10"')x 10"')
x 10"2)x 10"2)x lO"2)x 10"s)
x 10-)x 10"4)x 10"3)x 10-4)
7.9 x1.8 x
7.3 x3.6 x1.9 x
4.2 x2.6 x1.0 x9.9 x
5.7 x5.2 x4.0 x3.5 x
7.1 x
tr10-' (3.810"' (2.0
1.0 (6.210"' (1.610"1 (7.110"' (4.9
tttt
10"' (1.710"' (5.210"' (4.410"' (4.0
10-' (1.210"' (9.110"' (3.210-' (2.7
1.19 (2.51.08 (2.610-' (4.91.04 (1.2
x 10-')x 10-')
x 10"')x 10"')x 10"')x 10"2)
x 10"')x 10"2)x 10"2)x 10"')
x 10-')x 10"')X 10"2)x 10-')
x 10"')x 10"')x 10-')x 10-)
83403.6 x 10'
909052207440
1.7 x 10'
1.4 x 10⁴
2190210510
40204200630
1080
23402850990
1470
t Indicates convergence problems. t Indicates model not appropriate.
KELLY & BEAUCHAMP: DECOMPOSING UPLAND OAK AND MESIC MIXED-HARDWOOD LEAF LITTER 1621
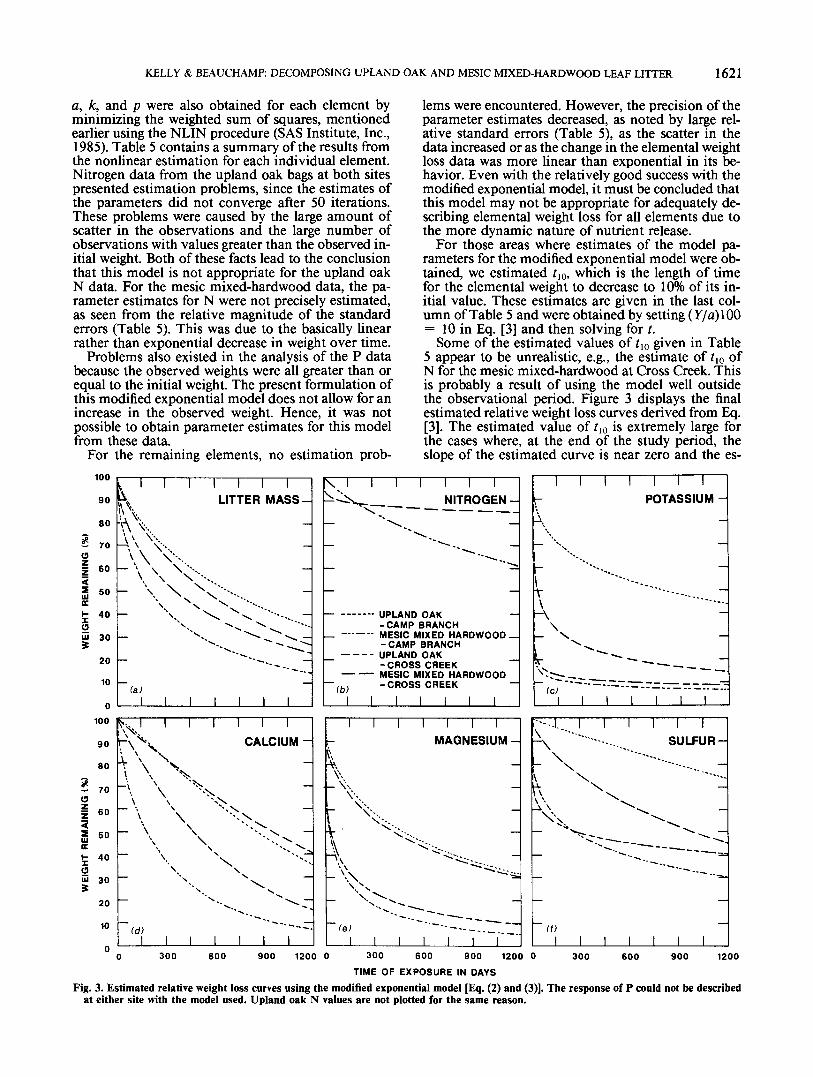
a, k, and p were also obtained for each element byminimizing the weighted sum of squares, mentionedearlier using the NLIN procedure (SAS Institute, Inc.,1985). Table 5 contains a summary of the results fromthe nonlinear estimation for each individual element.Nitrogen data from the upland oak bags at both sitespresented estimation problems, since the estimates ofthe parameters did not converge after 50 iterations.These problems were caused by the large amount ofscatter in the observations and the large number ofobservations with values greater than the observed in-itial weight. Both of these facts lead to the conclusionthat this model is not appropriate for the upland oakN data. For the mesic mixed-hardwood data, the pa-rameter estimates for N were not precisely estimated,as seen from the relative magnitude of the standarderrors (Table 5). This was due to the basically linearrather than exponential decrease in weight over time.
Problems also existed in the analysis of the P databecause the observed weights were all greater than orequal to the initial weight. The present formulation ofthis modified exponential model does not allow for anincrease in the observed weight. Hence, it was notpossible to obtain parameter estimates for this modelfrom these data.
For the remaining elements, no estimation prob-
lems were encountered. However, the precision of theparameter estimates decreased, as noted by large rel-ative standard errors (Table 5), as the scatter in thedata increased or as the change in the elemental weightloss data was more linear than exponential in its be-havior. Even with the relatively good success with themodified exponential model, it must be concluded thatthis model may not be appropriate for adequately de-scribing elemental weight loss for all elements due tothe more dynamic nature of nutrient release.
For those areas where estimates of the model pa-rameters for the modified exponential model were ob-tained, we estimated tw, which is the length of timefor the elemental weight to decrease to 10% of its in-itial value. These estimates are given in the last col-umn of Table 5 and were obtained by setting (7/a)100= 10 in Eq. [3] and then solving for t.
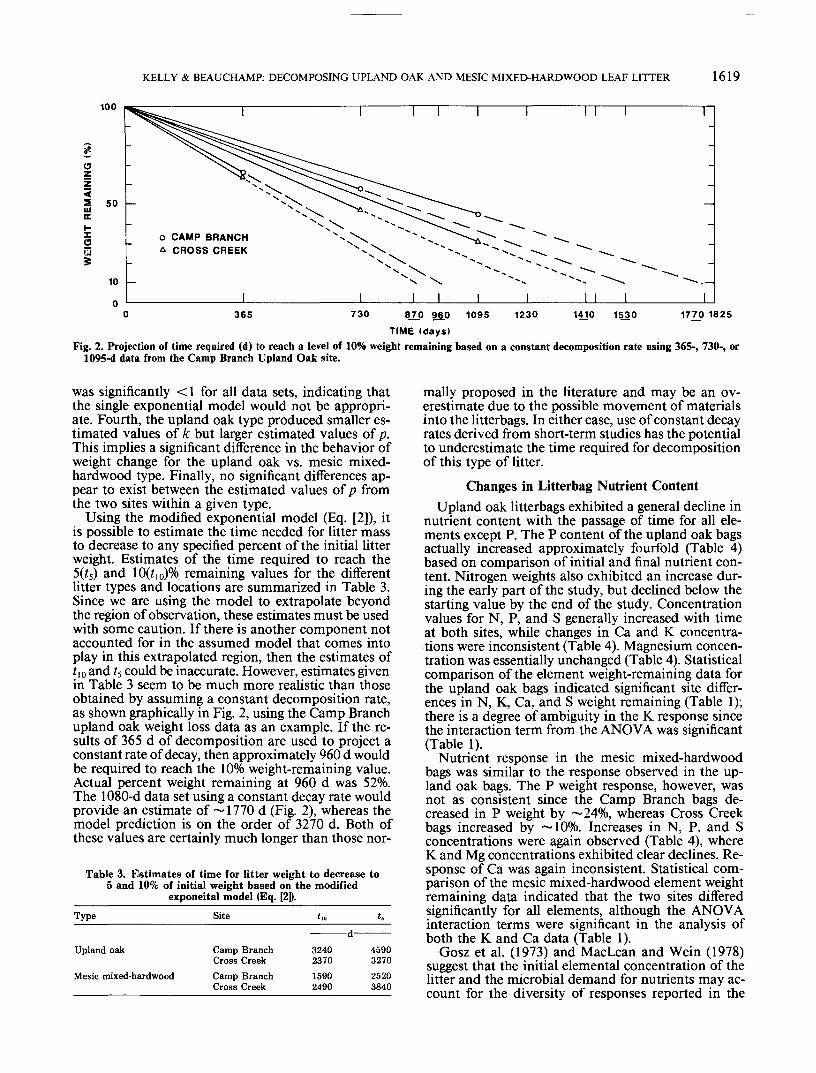
Some of the estimated values of tw given in Table5 appear to be unrealistic, e.g., the estimate of tto ofN for the mesic mixed-hardwood at Cross Creek. Thisis probably a result of using the model well outsidethe observational period. Figure 3 displays the finalestimated relative weight loss curves derived from Eq.[3]. The estimated value of t\0 is extremely large forthe cases where, at the end of the study period, theslope of the estimated curve is near zero and the es-
100
90
80
2 70a
I 6°S 50oct- 40oui 30
20
10
0100
90
80
2 70O| 60
i 5°cc£ 40(3UI 30
20
10
. I I I I I I I
^ LITTER MASS-
A V-\\ \N
'̂ \ \ '•~ \ \ X\--,- \ \ x\
\ NX v\ "'"---.N\ ^ ̂ ^ ̂ "---
_ X, ^ .̂ ^ ̂ _">s-. ^~ •— ^__^~
~-^ ^
~ "~~— — . ~^~--
~ (a) ~I I I I I I I
J-v I I I I I I I
k-\^^ CALCIUM -\ \ \\ \ ^^ ""
~\ \ Xx\ \ Xx
~ \ \ '^>^- \ \ ^>^ -\ N >> ^^- \ xx "<
N, X
— 'N'' ^ ̂ ^ —X ^
"~ ^ "^-^ "^'••>
~td> ~~~—--~-.I I I I I I I
\ l l l l l l l^^s^_ NITROGEN -
*»
- ^"^. _^""•"-^_
— —
— —
— —— — UPLAND OAK --CAMP BRANCH
_ _.._.. MES|C M|XED HARDWOOD —-CAMP BRANCH
— —— - UPLAND OAK-CROSS CREEK
—— —— MESIC MIXED HARDWOOD— (b) -CROSS CREEK -
I I I I I I I
I I I I I I I
MAGNESIUM -v\\\
- K\ -,^•-, _
\ X<^--\\ "Ci";^- :̂. ""\ v "^**--Cj - -
~ X-x^X. ^^X--C"~^- ~~<e> """"~"-"--^--7.77~~1
i i i i i i "T
i i i i I i ir POTASSIUM -
A —— X. —
'•-.,_~ v%-* — '
r ""•---.... -\ "---\\- X —
^ ^_"̂ * ^^
Sr ~~ — _ ___ ~v^-*^^ - —
"" 7 """"""' ~~ ~'~—--—~-~—^~^-~- —^7^17°l 1 1 1 1 1 1
•--!., 1 1 1 1 1 1
\ " -... SULFUR -\ ""----.\ ---.... ~
k ^^ ~v\ ^^x\ ^\- vi>-^~^_ ^^^-^ -
^-t,^~---— ___ _ "1 -̂— """""'--^ '^^
"•— . . __— "̂ ^
~ U) ~1 1 1 1 1 1 1
300 600 900 1200 0 300 600 900 1200 0
TIME OF EXPOSURE \N DAYS
300 600
Fig. 3. Estimated relative weight loss curves using the modified exponential model [Eq. (2) and (3)]. The response of P couldat either site with the model used. Upland oak N values are not plotted for the same reason.
900 1200
not be described
1622 SOIL SCI. SOC. AM. J., VOL. 51, 1987
timated weight is > 10% of the initial weight. The use-fulness of this value is dependent upon the appropri-ateness of this model beyond the observational period,i.e., the extrapolation problem discussed earlier. Forthose cases when the observed weight decreased to <10% of the initial weight during the study period (e.g.,K), the resulting estimates of tlo seem plausible.
CONCLUSIONSThe time required to achieve a high degree of weight
and nutrient loss from freshly deposited leaf litter ap-pears to be somewhat longer than those values typi-cally projected from short-term data sets using a con-stant decomposition rate. Historically, a variety ofmathematical models have been used to describe and,to some degree, project weight and nutrient loss. Al-though many of these models are quite satisfactorywithin the range of the data used to test them, someof them can be less useful in projecting further changeswith the passage of time because of their unrealisticbehavior over an extended time period. The results ofthis analysis, in addition to suggesting that a longertime is required for decomposition than is normallyprojected, also suggest that a single model may not beappropriate to describe all response variables. This isevidenced by the fact that some variables (N and P)actually increased in weight remaining during part orall of the study period and thus did not lend them-selves to description by the model used. The data pre-sented here along with the modeling work also reiter-ate the fact that a decay rate derived from a singleplant species or group of species must be applied withcaution over larger landscape units because of the po-tential differences between sites within a litter type aswell as differences between types. Weighted valuesbased on litter type occurrence would appear to bemore appropriate than the representative species ap-proach used in the past. As our understanding andability to model decomposition/mineralization in-creases, the impact of changes in various soil-chemicalparameters should be integrated into future analyses.The results of this analysis should be of particular in-terest to those concerned with estimating the releaseof nutrients in forested ecosystems, particularly if theestimates derived are to be used for impact analysis.
ACKNOWLEDGMENTThe authors wish to express their appreciation for the
technical assistance provided by P.A. Mays in the collectionand processing of the samples, L.C. Taylor in the area ofdata management, S.G. Lawson for the typing of the man-uscript, and Drs. D.L. DeAngelis and J. Pastor for their crit-ical reviews of the manuscript.