Embed Size (px)
Citation preview
© C
op
yrig
ht 2
007:
Inst
ituto
de
Ast
rono
mía
, Uni
vers
ida
d N
ac
iona
l Aut
óno
ma
de
Mé
xic
o
Revista Mexicana de Astronomıa y Astrofısica, 43, 155–171 (2007)
MASS DETERMINATION FOR T TAURI STARS FROM JHK
PHOTOMETRY
Tania A. Lopez-Chico and Luis Salas
Instituto de AstronomıaUniversidad Nacional Autonoma de Mexico, Ensenada, B. C., Mexico
Received 2006 February 2; accepted 2006 November 14
RESUMEN
Presentamos un metodo que utiliza modelos de discos para determinar masasde estrellas T Tauri a partir de fotometrıa JHK. Encontramos que el exceso infrar-rojo producido por el disco se comporta de forma similar a un vector de extincioncuando se grafica en diagramas color-color y color-magnitud, pero son linealmenteindependientes. Mediante la manupulacion de estos vectores como si fueran unabase de un espacio vectorial, llevamos a cabo una transformacion de coordenadasque nos permite encontrar la masa de la estrella central para una edad dada. Paraprobar este metodo basado en vectores principales (PV), comparamos los valo-resde masa obtenidos (MPV ) en 14 objetos T Tauri de la region de Taurus-Auriga conlos valores de masa calculados por metodos dinamicos. Tambien analizamos cuatrosistemas multiples (GG Tau, FO Tau, FS Tau y V773 Tau) y determinamos la masade cada componente del sistema. Estudiamos el efecto que se produce al utilizardiferentes modelos evolutivos y la variacion de otros parametros en la determinacionde masas por este metodo.
ABSTRACT
We present a method that uses disk models to determine stellar masses forPre-Main sequence T Tauri stars from JHK photometry. We find that the infraredexcess produced by the disk behaves in a similar way to the extinction vectorwhen plotted on color-color and color-magnitude diagrams, but that it is linearlyindependent. Employing these vectors as a basis of a vector space we carry out acoordinate transformation that allows us to find the mass of a central star for agiven age. To test this Principal Vectors (PV) method we compare the mass values(MPV ) obtained for 14 T Tauri objects in the Taurus-Auriga region with massvalues known from dynamical methods. Furthermore, we analyze 4 systems withmultiple components (GG Tau, FO Tau, FS Tau, and V773 Tau) and determinethe mass for each component of the system. We analyze the effect of using differentevolutionary models and other parameter values.
Key Words: STAR: FORMATION — STAR: PRE-MAIN SEQUENCE —
TECHNIQUES: PHOTOMETRIC
1. INTRODUCTION
The only direct method to determine stellarmasses is through the analysis of dynamical param-eters. This can be accomplished by measuring peri-ods of orbiting components, radial velocities of un-resolved companions, or from the kinematics of acircumstellar disk. Obtaining the necessary data isoften impossible, or else difficult, and so dynamicalmethods have been used only for a few pre-main se-
quence (PMS) stellar objects. As a consequence ofthis, most of the mass values are obtained by sec-ondary methods.
The usual secondary method is to place the ob-jects on a temperature-luminosity diagram alongwith evolutionary models (Cohen & Kuhi 1979).Many circumstances encumber this task. First, tem-perature could be characterized from the colors ofthe objects. But colors are affected by circumstellar
155
© C
op
yrig
ht 2
007:
Inst
ituto
de
Ast
rono
mía
, Uni
vers
ida
d N
ac
iona
l Aut
óno
ma
de
Mé
xic
o
156 LOPEZ-CHICO & SALAS
disks. The disks obscure optical observations andproduce infrared (IR) excesses; also, accretion ontothe surface of the star increases the UV part of thespectrum and veils the optical, and reddening is pro-duced by extinction from the dusty medium.
Therefore, temperature is better determinedfrom the spectral type of the object, obtainedthrough spectroscopy (Levine et al. 2006; Dahm2005; Luhman et al. 2005; Luhman et al. 2003;Briceno et al. 2002; Luhman 2000; Luhman et al.2000; Luhman 1999; Luhman & Rieke 1999; Luh-man et al. 1998). To determine the luminosity ofthe source, extinction corrections have to be ap-plied.These corrections can also be determined fromthe spectral type of the source by comparing the ob-served colors with the intrinsic ones. In doing thistask, the use of colors where either the UV excessdue to accretion or the IR excess due to disk emis-sion is usually avoided, because both effects contami-nate the colors. Thus, colors involving the bandpasesR, I and J are preferred (Luhman et al. 2003; Luh-man 2000). Among several improvements, Hartiganet al. (1991) have refined the method by modelingthe veiling to correct the spectrum and so, in thisway, obtaining a better estimate of the spectral typeand the extinction corrections. However, the acqui-sition of spectroscopic data is a difficult task for faintobjects in dusty environments, which constitute thevast majority of PMS stellar objects. This has leadmany authors to explore the initial mass function(IMF) of clusters in the IR.
The most used measure of the IMF is the K lu-minosity function (KLF) because it is likely to pro-duce a faithful representation of the true IMF of acluster (Muench et al. 2002). This is so becausethe IR excess is only a small correction when largeKLF bins are employed. However, the K luminosi-ties of objects in clusters are affected by extinction.Although this problem sometimes is not accountedfor, most authors either correct for extinction usingthe color-color diagram (C-C D) (Leistra, Cotera, &Liebert 2006; Herbig & Dahm 2006; McCabe et al.2006; Figueredo et al. 2002; Bontemps et al. 2001;Luhman 2000; Porras, Cruz-Gonzalez, & Salas 2000)or the color-magnitude diagram (C-M D) (Leistra etal. 2006; Porras et al. 2000). On the other hand,the K luminosity is seldomly corrected by the IRexcess emission (however see Figueredo et al. 2002),and authors that worry about it sometimes favor theuse of the JLF or HLF, where the contamination issmaller (Liu et al. 2003; Nielbock, Chini, & Muller2003; Brandl et al. 1999; Oasa, Tamura, & Sugitani1999).
But the IR excess emission has been clearly iden-tified and shown to have a definite effect in C-C andC-M diagrams. Lada & Adams (1992) and Hillen-brand et al. (1992) show that objects of differentevolutionary states occupy definite regions of the C-C D (see also Palla 1993). The classical T Tauristar locus (Meyer, Calvet, & Hillenbrand 1997) isa well defined linear region in the C-C D. This lo-cus is occupied by dereddened T Tauri stars from aTaurus sample. In their work Meyer et al. (1997)displace T Tauri stars along the reddening vectorby an amount determined from the E(Rc-Ic) excessabove the intrinsic colors known from the spectraltype of each source. The resulting locus lies alonga narrow line redwards of the main sequence col-ors corresponding to stars of spectral types aroundM. That is, the excesses in the colors, in particularE(J-H) and E(H-K), are related to each other anddefine an excess vector in the C-C D. Then, Meyeret al. (1997) model the excess emission from accre-tion disks around K5 to M5 stars to show that thislocus is indeed well explained and expected, due tothe existence of circumstellar disks. Therefore, it isproven that by adding an excess vector and an in-terstellar extinction vector to a stellar photosphere,one can recover the position of a particular T Tauristar on the C-C D. However, if the spectral type ofthe star is not known, the magnitudes of the vectorscannot be assessed.
The existence of a vector-like excess, this time forthe K vs. H-K diagram, has been found by Hillen-brand & Carpenter (2000). They analyzed a similarsample of T Tauri stars in Taurus and found a linearrelationship between the K excess emission and theexcess in H-K. Again, the excesses are determinedfrom the dereddened colors and magnitudes if theintrinsic colors are known from the spectral types ofthe sources. In their work, Hillenbrand & Carpen-ter (2000) go on to obtain the IMF of the trapeziumcluster by using the vector sum of this excess vec-tor and the interstellar extinction vector. However,since they only used the C-M D, they had incom-plete information to obtain the magnitudes of thesetwo vectors, so they relied on a statistical approachthat treats these unknown quantities as probabilitydistributions.
Therefore, it has been shown that IR excess emis-sion affects both near infrared (NIR) C-C and C-Mdiagrams in a similar way as the interstellar extinc-tion. However, the two diagrams have not been usedsimultaneously to obtain the magnitude values of IRexcess and extinction. In this work we will explorethis possibility. We will begin by analyzing the effect

© C
op
yrig
ht 2
007:
Inst
ituto
de
Ast
rono
mía
, Uni
vers
ida
d N
ac
iona
l Aut
óno
ma
de
Mé
xic
o
MASS DETERMINATION FOR T TAURI STARS FROM JHK PHOTOMETRY 157
of a circumstellar disk on the NIR colors and mag-nitudes. Theoretical models to explain disks mayturn out to be very complicated and include manyparameters (Johns-Kull & Valenti 2001). The firstcircumstellar disk models were assumed geometri-cally thin and optically thick (Shakura & Sunyaev1973). Kenyon & Hartmann (1987) realized that thethickness of the disk should increase radially, lead-ing to a flared disk. This resulted in a better fit tothe spectral energy distribution (SED) for many TTauri stars. This disk model assumed that the tem-perature was only dependent on the disk radius. Thevertical temperature gradients in the disk were firsttaken into account by Calvet et al. (1991, 1992), withfurther analysis by D’Alessio et al. (1998, 1999), andChiang et al. (1997, 1999). In these models the ab-sorption of stellar radiation occurs only in the topdisk layers, so the heating of the internal disk is pro-duced by viscous dissipation. D’Alessio et al. (1998,1999) calculated the spectral emission of a disk as-suming the same structure for the gas and dust inthe disk, while Chiang et al. (1999) ignored the gascontribution. D’Alessio et al. (1998) showed that ifthere is a low coupling between the gas and dustat the surface of the disk, the gas temperature de-creases. In that case, the dust dominates the diskemission in classical T Tauri stars observations.
Dullemond, Dominik, & Natta (2001) extendedthe Chiang & Goldreich (1997) model to include apuffed-up inner rim for Ae/Be stars. Muzerolle et al.(2003) showed that the emission of a puffed rim alsofits the SED of T-Tauri stars in the 2-5µm region.The rim models were rather simplified treating themas a vertical walls (as in models by D’Alessio et al.2005). Rounded-off rims seem to be more consistentwith observations (Isella & Natta 2005).
We will explore the effects of the disk excess emis-sion in the C-C and C-M Diagrams using reprocess-ing models and more complicated accretion models.We will show that in certain cases the produced ex-cess can be interpreted as a reddening vector. Then,we will show on the diagrams that these vectors pointout in a different direction from that of the interstel-lar extinction one, and so we will identify a pair ofprincipal vectors (PV’s) produced by the disk ( ~D)
and interstellar extinction ( ~X). These vectors canbe used as a tool to determine stellar masses fromJHK photometry, without the need of spectral types.
A set of PMS tracks at the cluster’s age will beneeded to read out the mass of the star. We willtake advantage of recent work on evolutionary mod-els like those of D’Antona & Mazzitelli (1994, 1997,hereafter DM97); Palla & Stalher (1999, hereafter
PS99); Siess, Dufour, & Forestini (2000, hereafterS00); Baraffe et al. (1998, hereafter BCAH98); andthe Yale Group (Yi et al. 2001, hereafter Y201).Hillenbrand & White (2004) reviewed these modelslisting the basic parameters employed by each one.
In §2 we proceed with the calculation of the NIRexcess emission of disks from reprocessing and ac-cretion models and obtain the PV for each diagram.Also, we will describe the procedure to obtain massvalues with the PV method (MPV ) using syntheticevolutionary models for intermediate to low-massstars. In §3, we test our method by applying it toa set of 14 objects of the Taurus-Auriga association(d ∼140 pc) with previous mass determinations bydynamical methods. In addition, we will apply themethod to multiple systems and determine the massfor each component. The conclusions are given in §4.
2. PV METHOD
We will begin by calculating the NIR effect ofdisks and showing that the excess seen in CC andCM diagrams is similar to the behavior of the red-dening vector produced by interstellar extinction.We will first illustrate this effect with a simple re-processing disk via a simple and easy-to-manage cal-culation. The real situation, however, is more com-plex. Heating of the disk is also accomplished viaviscous dissipation during accretion, and a plethoraof parameters contribute to the process. Thus, wepresent the NIR colors and magnitudes of accretiondisk models (D’Alessio et al. 2005) in the follow-ing section. Extinction is briefly described followingthat, and then we identify the principal vectors, de-scribe how these vectors can be used to determinestellar masses and discuss the expected limits of ap-plicability of the method.
2.1. Excess emision vector for reprocessing disks
models
Passive disks models do not have an intrinsic lu-minosity and only re-emit the energy absorbed fromthe central star. Thus the surface disk temperaturecan be approximated by a power law (like in Natta,Meyer, & Beckwith 2000, hereafter N00):
T (rD) ∼ T0 (rD/R∗)−q
, (1)
where the rD is disk radius, and T∗ and R∗ are theeffective temperature and the stellar radius, respec-tively. N00 find that the parameters T0 = 0.75T∗
and q = 0.47 provide a good agreement with mostobservations. We considered a collection of con-centric rings, each one emitting as a blackbody in

© C
op
yrig
ht 2
007:
Inst
ituto
de
Ast
rono
mía
, Uni
vers
ida
d N
ac
iona
l Aut
óno
ma
de
Mé
xic
o
158 LOPEZ-CHICO & SALAS
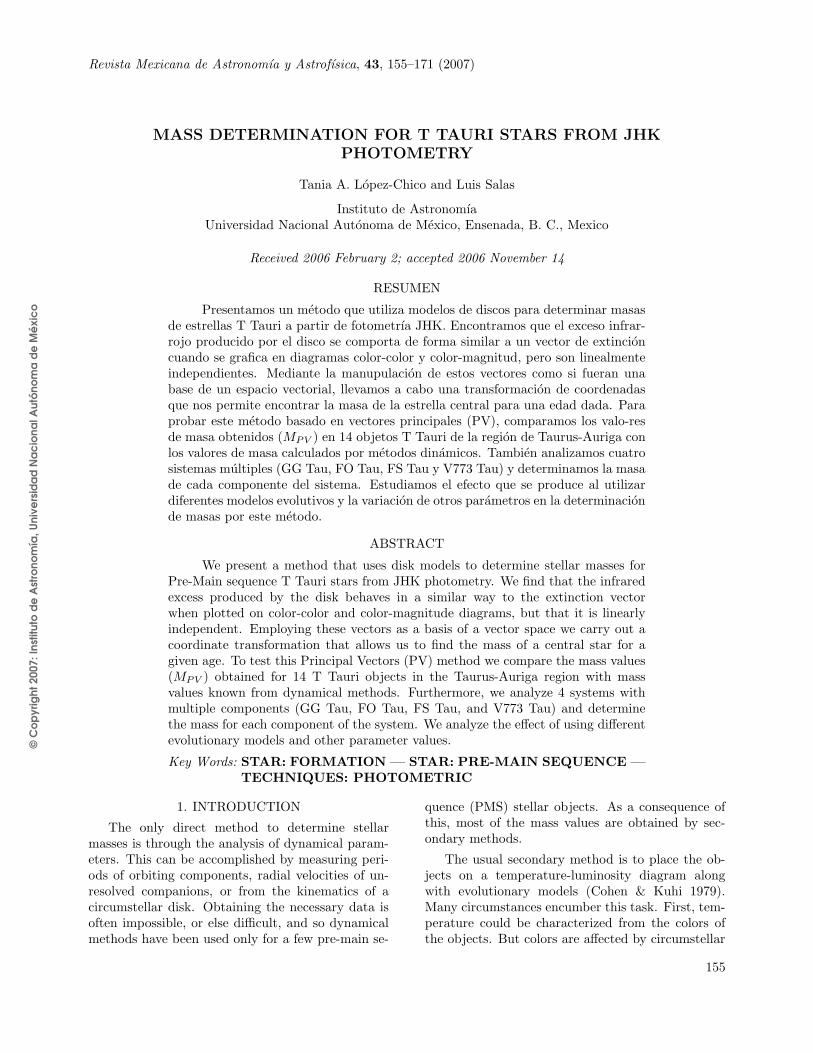
Fig. 1. (a)(J-H) vs. (H-K) and (b)(K) vs. (J-K) diagrams used to determine the PV generated by the disk reprocessingvector ( ~D) and interstellar extinction vector ( ~X). We use stars with spectral types from A0 to M6, with a value ofε = 0.4 that corresponds to a 66 of inclination from the line of sight . The directions of the vectors are shown on thetop left part on each figure.
agreement with Equation 1. The range of temper-ature goes from an inner radius with Tin=1500 K(dust sublimation temperature) to a maximum ra-dius with Tout=100K. Taking into account these con-siderations we calculate the predicted JHK disk flux.The total disk flux at a given frequency is given by,
f [D]ν =
∫Ω
Bν(T (rD))dΩ, (2)
where Bν(T (rD)) is the Planck function and T (rD)is the local temperature as a function of the diskradius.
To carry out the integral we write the next ex-pression:
f [D]ν = αβ2κ2/q
∫ γTout
γTin
x−( 2
q+1)
e1/x − 1dx, (3)
where α = 4πhν3/qc2, β = R∗/dobs, and κ =kT0/hν. The integral limits are given as a functionof the disk temperature, Tin and Tout being the val-ues previously mentioned and γ = k/hν. To obtainresults from Equation 3, we only need to know theeffective temperature of the central star, T∗ = Teff ,the stellar radius R∗, and the frequency ν. Oncethe disk flux is calculated, we add it to the stellarflux following the next expression that constitutesthe star-disk system [s + d]
f [s + d]ν = f [MS∗]ν + εf [D]ν , (4)
where ε represents several parameters such as theinclination angle to the line of sight and circumstellardust properties.
We use a set of intermediate to low mass main-sequence stars (spectral type from A0 to M6) andconstruct the s + d system using effective temper-atures and bolometric magnitudes from Schmidt-Kaler (1982) to calculate the stellar radius, and stan-dard JHK photometric values from Bessell & Brett(1988). In Figures 1a and 1b we show the C-C (J-Hvs. H-K) and C-M (K vs. J-K) diagrams with theset of main sequence stars and the s+d systems. Theresults are similar to those of other authors. Lada& Adams (1992) made use of C-C D to show howthe IR colors are affected by the presence of circum-stellar disks on intermediate to low mass stars, andachieved similar results. Another useful diagram isthe color-magnitude diagram. We use the K vs. J-Kdiagram because with this combination we get themaximum contrast between the IR excess producedby the presence of the disk, which affects mostly K,and the interstellar extinction which has a greatereffect on J.
The main sequence is labeled with the spectraltype of the star, the open circles represent the s + dmodel, the solid lines joining the two marks are thedisk’s vector direction and length, that is, the dis-placement produced by the presence of the disk. Weshow the case for ε = 0.4 that corresponds to a 66

© C
op
yrig
ht 2
007:
Inst
ituto
de
Ast
rono
mía
, Uni
vers
ida
d N
ac
iona
l Aut
óno
ma
de
Mé
xic
o
MASS DETERMINATION FOR T TAURI STARS FROM JHK PHOTOMETRY 159
(b)
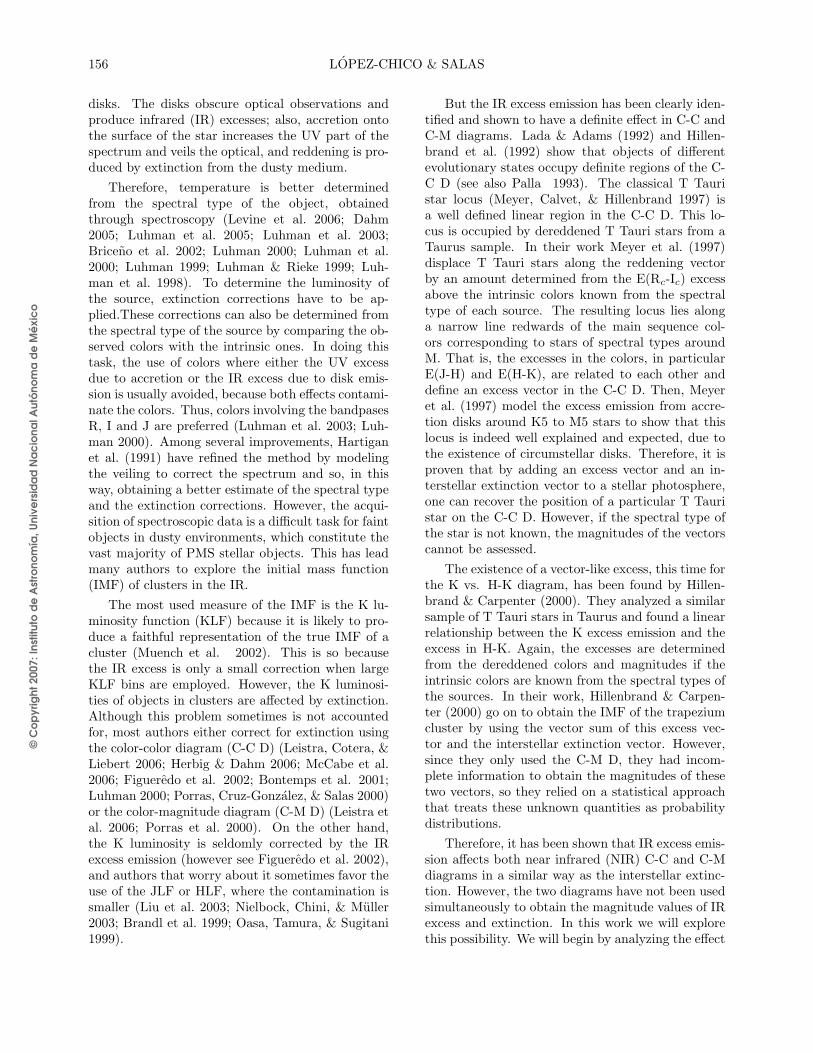
Fig. 2. (a)(J-H) vs. (H-K) and (b)(K) vs. (J-K) diagrams used to determine the PV. The disk vector ( ~D) is generatedby the median value of ∼ 730 accretion disk models and the interstellar extinction vector is represented by ~X.
angle of inclination from the line of sight. From Fig-ures 1a and 1b we perceive that it is possible to rep-resent the IR excess produced by the disk as vecto-rial quantity in each diagram. This vector points innearly the same direction for stars of all masses inthe low to intermediate range. We only start to see adiscrepancy in the direction for stars earlier than A0.For the rest of the spectral types, the median value ofthe displacements, represented by ~D, reproduces themean effect of the disk. The length of the vector ishowever different for each case, but this only impliesthat an amount ‖ ~D‖ of disk emission should be inter-preted differently for each spectral type. This sameprocedure was repeated for a collection of 10,000 ran-domly oriented viewing angles from 0 to 90 degrees.The resultant median vector ~D shows little variationin the direction. In the C-C D the slope of the excessemission vector is 0.43±0.107 and in the C-M D theslope is -1.097±0.02 . Thus, the obtained compo-nents of the excess vectors are: ~Dcc=(0.731, 0.317)
and ~Dcm=(1.05, -1.15) in magnitude units.
2.2. IR excess vectors for accretion models
Following the modeling work of D’Alessio andcollaborators (1998, 1999, 2001), they have pub-lished the SED’s for a grid of 3000 accretion disksmodels that cover a wide range of parameters(D’Alessio et al. 2005). These models include accre-tion rates between 10−7 to 10−9 M/yr, onto centralstars of 0.8 to 4 M with temperatures from 4000 to10000K and ages from 1 to 10 Myr. Disk sizes range
from 100 to 800 AU, and have inner radii that de-pend on the dust destruction temperature, taken tobe around 1400 K, where the disk develops a wallwhose scale height is also considered. Gas and dustare well mixed in the disk, with dust size distribu-tions given by power laws with indexes of 2.5 and3.5 and maximum particle sizes of 1 µm to 10 cm.The systems are viewed at two inclination angles;cos(i) = 0.5 and cos(i) = 0.86.
From this collection of models, we have chosenthose that provide a clear view of the star [cos(i) =0.86] so that the effects of extinction can be sepa-rated from those of IR excess. The effects of extinc-tion will be addressed in the next section. For claritywe also limit the following analysis to a particular ageof 10 Myr. Thus we are left with ∼ 730 disk models.From the SED’s of the star+disk systems we com-pute the magnitudes in the J, H and K bands (cali-brating according to Bessell & Brett 1988) as well asthe corresponding magnitudes for each central star,also given in D’Alessio et al. (2005).
In Figure 2 we present the C-C and C-M dia-grams. In each panel the colors and magnitudes ofthe central star are represented by circles labeledwith the stellar masses (0.8, 1.1, 1.4, 1.6, 1.7, 1.9,2.0 and 2.3 M), and the crosses represent the cor-responding star+disk systems.
The circles that correspond to masses around2 M tend to pile up, as the masses themselvesare very close together. However we have decidedto keep the same scale to allow a direct comparison

© C
op
yrig
ht 2
007:
Inst
ituto
de
Ast
rono
mía
, Uni
vers
ida
d N
ac
iona
l Aut
óno
ma
de
Mé
xic
o
160 LOPEZ-CHICO & SALAS
with Figure 1. In the C-M diagram it is evident thatthe disk models for each star occupy a very definiteregion, lying along a unique direction to the upperright, that is, going redder in J-K and brighter inK. The median direction is indicated by an arrow,and it is very close to the direction found for simplereprocessing models (previous section). In the C-Cdiagram, the disk models corresponding to each staralso tend to occupy the upper right region, that is,redder in both colors, although the directions show alittle more dispersion than in the previous case (re-processing models). In fact, the deviation from acommon direction of all vectors in this figure is 0.15radian, while it is only 0.02 radian for the C-M di-agram. Also note that the deviations become moreimportant as the mass of the star increases, in thesense that the vectors curve upwards. This fact willlimit the range of applicability of the method that weare proposing, since we will rely on a common direc-tion for this excess vector, as indicated by the arrowin the C-C figure. Another important fact is that ifwe divide the magnitude of each excess disk vectorin the C-M diagram by its corresponding magnitudein the C-C diagram, we get a constant ratio, 1.73± 0.14, indicating that the vectors behave similarlyin both diagrams. Thus, we may define the mediandisk vectors with components ~Dcc=(0.767, 0.221) in
the C-C D and ~Dcm= (1.014, -1.105) in the C-M D(actual median values have been arbitrarily multi-plied by 13 to allow a better comparison), which areindeed very similar to the ones derived for the simplereprocessing disk models of the previous section.
2.3. Extinction Reddening Vector
Normal interstellar extinction can be representedas a reddening vector with components [E(J −K), AK ] and [E(H −K), E(J −H)] in the C-M andC-C diagrams respectively. In Figures 1 and 2, wedenoted by ~X the vector corresponding to AV =10and normal colors given in Rieke & Lebofsky (1985).It is our intention to use these vectors to quantifythe reddening produced by the ISM, the circumstel-lar envelope and the disk itself, on the photosphereof the star and the NIR emitting region of the disk.However, we must proceed carefully in this task. Itis known that R, the ratio of total to selective ex-tinction, attains larger than normal values in densecores and dark clouds associated to star forming re-gions. This is thought to arise because the shieldedconditions of high opacity regions favor the coales-cence of small grains into larger particles. Largerparticles in turn produce a more geometrical atten-uation of visible and NIR light, resulting in a “gray”extinction.
In a recent paper, Moore et al. (2005) has ob-served the hydrogen NIR recombination lines to-wards UC-HII regions, to show that the 2µm opac-ity becomes flatter than normal only when AV > 25mag. If an appropriate value of R can be determinedfor these dense cores, the components of the redden-ing vector can be readily obtained.
The mid planes of circumstellar disks are also re-gions of high opacity that can affect the observationsof a central star with abnormal extinction. However,D’Alessio et al. (2001) argue that this is only a prob-lem for a small (15%) fraction of T Tauri stars inTaurus (a typical star forming region). The increas-ing size of dust particles results in a growing criticalviewing inclination at which the obscuring AV > 30condition is reached.
We can therefore assume that a normal extinc-tion reddening vector is appropriate for ≈ 85% ofPMS stars in a SFR similar to Taurus. Sources forwhich this is not the case (which should be a smallnumber) can be distinguished by an unusually large(∼30 mag) extinction value. For these sources, theextinction reddening vector would rotate in the C-M diagram to become nearly vertical, signaling thatonly attenuation of light and no reddening is present.In the C-C diagram the vector would decrease inmagnitude significantly, and even disappear, inval-idating the application of the method that we areproposing. This includes the most extreme cases ofa disk viewed edge-on, when the light of the star be-comes completely extincted and the spectral energydistribution is dominated by scattered light from thepolar regions of the disk.
2.4. Principal Vectors
From Figures 1 and 2 we perceive that it is pos-sible to represent the IR excess produced by thedisk (either reprocessing or accretion) as a vecto-rial quantity in each C-C and C-M diagram. Thisvector points nearly in the same direction for starsof all masses in the low-to-intermediate range. Formasses grater that ≈ 2.5 M or spectral types ear-lier than A0 the vector starts to rotate, so we regardthis as the upper limit for the mass. For lower stel-lar masses, the median value of the displacements,represented by ~D, reproduces the mean effect of thedisk. The magnitude of the effect is however dif-ferent for each case, but this only implies that anamount ‖ ~D‖ of disk emission should be interpreteddifferently for each case, depending on the stellarmass. To achieve a more realistic approach, we willconsider the ~D vectors corresponding to the accre-tion models that were derived in §2.2. Furthermore,

© C
op
yrig
ht 2
007:
Inst
ituto
de
Ast
rono
mía
, Uni
vers
ida
d N
ac
iona
l Aut
óno
ma
de
Mé
xic
o
MASS DETERMINATION FOR T TAURI STARS FROM JHK PHOTOMETRY 161
TABLE 1
JHK PHOTOMETRY VALUES FORTAURUS-AURIGA OBJECTS WITH
DYNAMICAL MASS VALUES
object J H K Multiple?
BP Tau1 9.30 8.42 8.05 No
CY Tau1 9.76 8.90 8.42 No
DL Tau1 9.69 8.77 8.12 Yes
DF Tau1 8.32 7.40 6.81 Yes
DM Tau1 10.41 9.70 9.45 No
FO Tau2 10.33 9.34 8.81 Yes
FS Tau2 10.66 9.14 7.74 Yes
GG Tau1 8.79 7.85 7.25 Yes
GM Aur2 9.37 8.73 8.48 No
LkCa152 9.51 8.68 8.22 No
UZ Tau E1 8.45 7.60 7.02 Yes
V397 Aur3 9.21 8.46 8.27 Yes
V773 Tau A1 7.63 6.83 6.48 Yes
ZZ Tau1 9.52 8.78 8.54 No
1Strom et al. (1989).2Kenyon & Hartmann (1995).3Walter et al. (1988).
we note that the direction of ~D is very different fromthe reddening vector produced by extinction ~X. Thisvector seems appropriate for star forming regions notaffected by dense cores of AV > 25 mag and disksnot viewed at inclination angles such that AV > 30mag, that would be affected by abnormal extinction.
Therefore, we have a pair of vectors ~D and ~Xfor each diagram. We call them ~Dcc and ~Xcc forthe C-C D and ~Dcm and ~Xcm for the C-M D. Thecomponents of the vectors are: ~Dcc=(0.767,0.221),~Xcc=(0.6127, 1.064), ~Dcm=(1.01, -1.105) and~Xcm=(1.676, 1.1613) in magnitude units. These twosets of vectors are linearly independent, so they rep-resent an alternative basis for both diagrams. Bythis way we can make new C-C and C-M diagramsusing ~D and ~X as a basis with respect to an arbitraryorigin.
So if we have a diskless standard star withoutextinction (and at a given distance), it will occupya certain position in each diagram. If we now adda certain amount of extinction and disk IR excess itwill move accordingly in each diagram. On the otherhand, if we start from a s+d system, we can subtracta certain amount of ~D and ~X to recover the originallocation of the star on the diagrams. Moreover, ifwe do not know the original stellar mass (or spec-
tral type), we can follow the same procedure for allthe possible standard stars (for example, the mainsequence), and find in which case we get the same~D and ~X values for the same standard star on eachdiagram. In the next section, we will show that thisprocedure leads us to identify the star’s mass withan acceptable error.
To proceed, we need to locate the main sequenceon the transformed diagrams; and if we are dealingwith young stars we need to place the isochrones gen-erated by evolutionary models at a certain age. Thispresents a problem, since different models disagreeby up to factors of 2 in the masses predicted for thesame age and spectral type. We will consider severalmodels (see §3.3) but in order to proceed here, wewill start by using PS99 as a first example of the useof the method. To plot the isochrones on the newdiagrams we need to know the absolute JHK mag-nitudes. We use the results of Testi, Palla, & Natta(1998) for the bolometric corrections made to thePS99 evolutionary tracks. Later on, we transformthe C-C and C-M diagrams coordinates to the newbasis formed by the principal vectors (PV).
3. APPLICATION TO A DYNAMICALLYSELECTED SAMPLE OF YSO’S
To test the PV method, we use a sample ofTaurus-Auriga objects (d ∼140 pc) PMS with stel-lar masses known by dynamical methods (Tamazianet al. 2002, hereafter TD02; Schaefer et al. 2003;Simon, Dutrey, & Guilloteau 2000). The majorityof the Taurus-Auriga objects are intermediate-to-low mass and include a large fraction of binary ormultiple systems. According to the study made byKenyon & Hartmann (1995), the objects are at anevolutionary status of no more than 2 Myr, showinga great amount of IR excesses (see Haisch, Lada, &Lada 2001). The star-forming region is believed tobe nearly coeval (Hartmann 2001), which is one ofthe advantages of studying stellar clusters: we canassume that all the members have an age similar tothe age of the cluster (Scalo 1986). For this reasonwe first assumed an age of 2 Myr [log(t)=6.3 dex] forall objects.
Our dynamical sample consists of 14 objects (Ta-ble 1) that have JHK photometry reported by sev-eral authors (Strom et al. 1989; Kenyon & Hartmann1995; Walter et al. 1988). The extinction reportedfor these objects is generally small (AV 30), so itis not likely that any of them are viewed edge on, andso the PV method can be applied. Some of the ob-jects in the sample are known to be multiple systems.For this first calculation we took the combined pho-
© C
op
yrig
ht 2
007:
Inst
ituto
de
Ast
rono
mía
, Uni
vers
ida
d N
ac
iona
l Aut
óno
ma
de
Mé
xic
o
162 LOPEZ-CHICO & SALAS
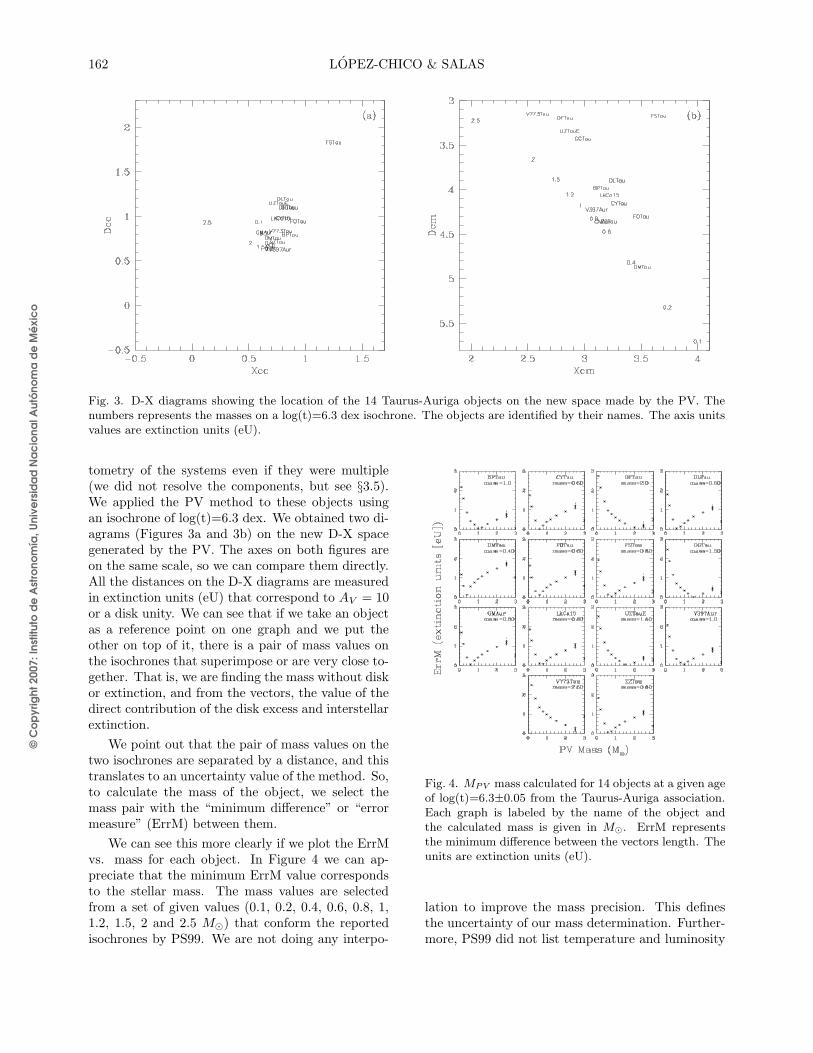
Fig. 3. D-X diagrams showing the location of the 14 Taurus-Auriga objects on the new space made by the PV. Thenumbers represents the masses on a log(t)=6.3 dex isochrone. The objects are identified by their names. The axis unitsvalues are extinction units (eU).
tometry of the systems even if they were multiple(we did not resolve the components, but see §3.5).We applied the PV method to these objects usingan isochrone of log(t)=6.3 dex. We obtained two di-agrams (Figures 3a and 3b) on the new D-X spacegenerated by the PV. The axes on both figures areon the same scale, so we can compare them directly.All the distances on the D-X diagrams are measuredin extinction units (eU) that correspond to AV = 10or a disk unity. We can see that if we take an objectas a reference point on one graph and we put theother on top of it, there is a pair of mass values onthe isochrones that superimpose or are very close to-gether. That is, we are finding the mass without diskor extinction, and from the vectors, the value of thedirect contribution of the disk excess and interstellarextinction.
We point out that the pair of mass values on thetwo isochrones are separated by a distance, and thistranslates to an uncertainty value of the method. So,to calculate the mass of the object, we select themass pair with the “minimum difference” or “errormeasure” (ErrM) between them.
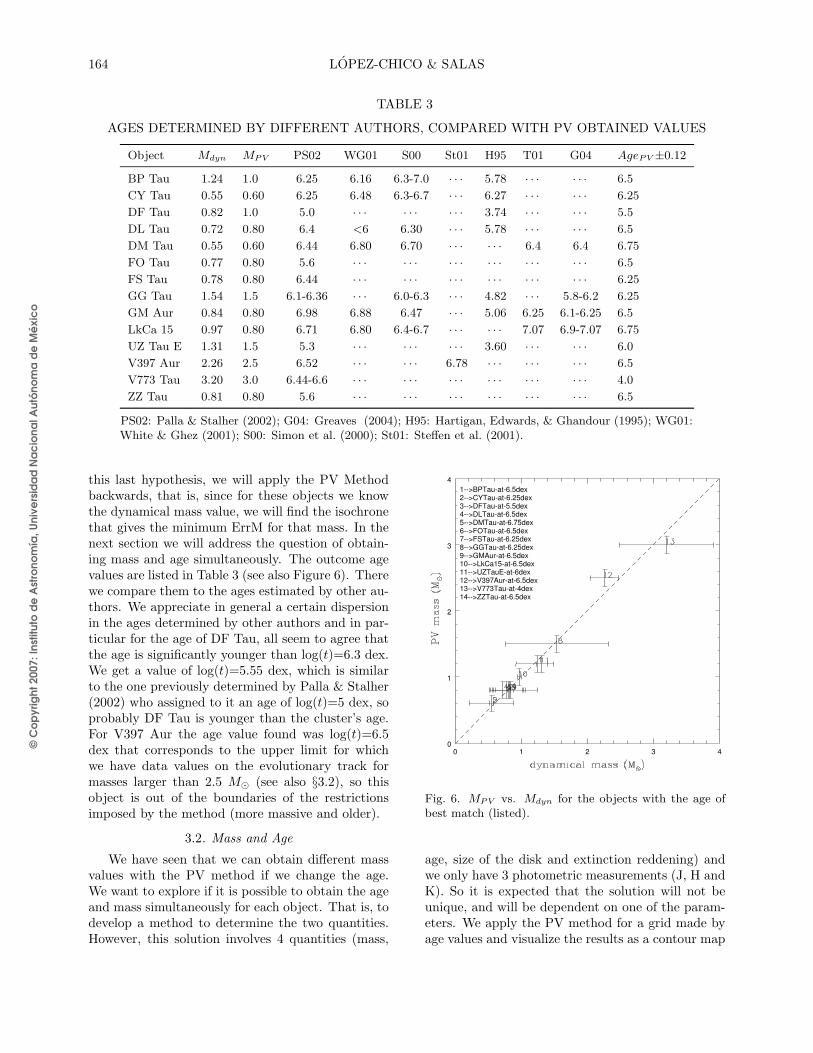
We can see this more clearly if we plot the ErrMvs. mass for each object. In Figure 4 we can ap-preciate that the minimum ErrM value correspondsto the stellar mass. The mass values are selectedfrom a set of given values (0.1, 0.2, 0.4, 0.6, 0.8, 1,1.2, 1.5, 2 and 2.5 M) that conform the reportedisochrones by PS99. We are not doing any interpo-
Fig. 4. MPV mass calculated for 14 objects at a given ageof log(t)=6.3±0.05 from the Taurus-Auriga association.Each graph is labeled by the name of the object andthe calculated mass is given in M. ErrM representsthe minimum difference between the vectors length. Theunits are extinction units (eU).
lation to improve the mass precision. This definesthe uncertainty of our mass determination. Further-more, PS99 did not list temperature and luminosity

© C
op
yrig
ht 2
007:
Inst
ituto
de
Ast
rono
mía
, Uni
vers
ida
d N
ac
iona
l Aut
óno
ma
de
Mé
xic
o
MASS DETERMINATION FOR T TAURI STARS FROM JHK PHOTOMETRY 163
TABLE 2
RESULTS OBTAINED FOR THETAURUS-AURIGA OBJECTS WITH THE PVMETHOD FOR AN AGE log(t)=6.3±0.05 dex
Object Mdyn ±err MPV ±err ~D ~X ErrM
BP Tau 1.242 +0.25−0.32 1.0±0.1 0.192 0.178 0.045
CY Tau 0.552 0.33 0.60±0.1 0.112 0.320 0.004
DF Tau 0.824 0.24 2.0±0.25 0.303 0.431 0.078
DL Tau 0.722 0.11 0.60±0.1 0.110 0.553 0.053
DM Tau 0.552 0.03 0.40±0.1 0.067 0.004 0.127
GM Aur 0.842 0.05 0.60±0.1 0.045 0.136 0.048
FO Tau 0.774 0.25 0.60±0.1 0.275 0.227 0.126
FS Tau 0.784 0.25 0.80±0.1 0.569 1.172 0.034
GG Tau 1.540 0.78 1.5±0.15 0.247 0.452 0.019
LkCa15 0.972 0.03 0.80±0.1 0.118 0.301 0.080
UZ Tau E 1.312 0.08 1.5±0.15 0.141 0.519 0.062
V397 Aur 2.263 0.21 1.0±0.1 0.129 0.023 0.044
V773 Tau 3.204 0.71 2.5±0.25 0.596 0.011 0.200
ZZ Tau 0.811 +0.44−0.25 0.60±0.1 0.038 0.084 0.074
0Guilloteau, Dutrey, & Simon (1999); White et al.(1999).1Schaefer et al. (2003).2Simon et al. (2000).3Steffen et al. (2001).4Tamazian et al. (2002).
values uniformly with respect to age for each con-sidered mass. Because of this, it was necessary totake an age dispersion of log(t) = 6.3 ± 0.05 dex,that corresponds to an uncertainty value in age of∼ 0.3 Myr. In the cases where the same mass valueappears several times in any given age interval, wecalculated the ErrM for each one, and then obtainedthe mean value. The variations with respect to themean values are shown on Figure 4 as vertical barson each point.
3.1. Comparing the PV method to dynamical mass
values
In the last section we obtained the mass valuesfor 14 objects applying the PV method. Now, wecompare these PV masses with the values found bydynamical methods, using orbital information of bi-nary systems (TD02; Schaefer et al. 2003) or circum-stellar disk rotation kinematics (Simon et al. 2000).
Table 2 (see also Figure 5) shows this compari-son. We list the MPV , the magnitude of the diskvector ~D, the interstellar extinction and the mini-mum ErrM value. An overall difference of 29% withdynamical masses can be appreciated. However, formost cases the mass value fits the dynamical valuewithin the dynamical error margins. Of the 14 ob-jects, the uncertainty is less than 1σ in 6 cases, less
1-->BPTau2-->CYTau3-->DFTau4-->DLTau5-->DMTau6-->FOTau7-->FSTau8-->GGTau9-->GMAur10-->LkCa1511-->UZTauE12-->V397Aur13-->V773Tau14-->ZZTau
Fig. 5. MPV vs. Mdyn for the objects on a given age.
than 1.5σ in 4 more and less than 3σ in 2 more. Thelast 2 cases are V397 Aur (∆M = 1.26) and DF Tau(∆M = 1.18). We will explore possible causes forthe discrepancies.
There is a controversy on the distance of DF Tau.Hipparcos measurements (Favata et al. 1998) place itat a distance between 31-52 pc. Lamzin et al. (2001)based on HST measurements debate this value andplace it at 70 pc. However, Schaefer et al. (2003), de-termine the system’s dynamical mass to be 0.9 M
assuming a distance of 140 pc, the same distanceused by TD02. On the other hand, if the distancewere as small as 70 pc, DF Tau would not be a Tau-rus member (extension ∼20 pc), and the dynamicalmass would change as d3. So we will take the fidu-cial distance of 140 pc for DF Tau. V397 Aur (NTT045251+3016) is a spectroscopic binary (Walter etal. 1988) and is classified as a naked T Tauri. Thedistance is also a problem, Steffen et al. (2001) cal-culated the dynamical masses setting the system at145±8 pc. If we took DF Tau out of the comparisonwe would obtain a 20% agreement with dynamicalmasses.
We remark the fact that the calculation has beenmade taking a given age (coeval). However thereare indications that star clusters have an age dis-persion. For the Taurus region several authors havementioned that this variation is ±0.3 dex for the age(Hartigan & Kenyon 2003; Palla & Stalher 2002).This can be another issue to take into account totry to explain the observed differences. To prove
© C
op
yrig
ht 2
007:
Inst
ituto
de
Ast
rono
mía
, Uni
vers
ida
d N
ac
iona
l Aut
óno
ma
de
Mé
xic
o
164 LOPEZ-CHICO & SALAS
TABLE 3
AGES DETERMINED BY DIFFERENT AUTHORS, COMPARED WITH PV OBTAINED VALUES
Object Mdyn MPV PS02 WG01 S00 St01 H95 T01 G04 AgePV ±0.12
BP Tau 1.24 1.0 6.25 6.16 6.3-7.0 · · · 5.78 · · · · · · 6.5
CY Tau 0.55 0.60 6.25 6.48 6.3-6.7 · · · 6.27 · · · · · · 6.25
DF Tau 0.82 1.0 5.0 · · · · · · · · · 3.74 · · · · · · 5.5
DL Tau 0.72 0.80 6.4 <6 6.30 · · · 5.78 · · · · · · 6.5
DM Tau 0.55 0.60 6.44 6.80 6.70 · · · · · · 6.4 6.4 6.75
FO Tau 0.77 0.80 5.6 · · · · · · · · · · · · · · · · · · 6.5
FS Tau 0.78 0.80 6.44 · · · · · · · · · · · · · · · · · · 6.25
GG Tau 1.54 1.5 6.1-6.36 · · · 6.0-6.3 · · · 4.82 · · · 5.8-6.2 6.25
GM Aur 0.84 0.80 6.98 6.88 6.47 · · · 5.06 6.25 6.1-6.25 6.5
LkCa 15 0.97 0.80 6.71 6.80 6.4-6.7 · · · · · · 7.07 6.9-7.07 6.75
UZ Tau E 1.31 1.5 5.3 · · · · · · · · · 3.60 · · · · · · 6.0
V397 Aur 2.26 2.5 6.52 · · · · · · 6.78 · · · · · · · · · 6.5
V773 Tau 3.20 3.0 6.44-6.6 · · · · · · · · · · · · · · · · · · 4.0
ZZ Tau 0.81 0.80 5.6 · · · · · · · · · · · · · · · · · · 6.5
PS02: Palla & Stalher (2002); G04: Greaves (2004); H95: Hartigan, Edwards, & Ghandour (1995); WG01:White & Ghez (2001); S00: Simon et al. (2000); St01: Steffen et al. (2001).
this last hypothesis, we will apply the PV Methodbackwards, that is, since for these objects we knowthe dynamical mass value, we will find the isochronethat gives the minimum ErrM for that mass. In thenext section we will address the question of obtain-ing mass and age simultaneously. The outcome agevalues are listed in Table 3 (see also Figure 6). Therewe compare them to the ages estimated by other au-thors. We appreciate in general a certain dispersionin the ages determined by other authors and in par-ticular for the age of DF Tau, all seem to agree thatthe age is significantly younger than log(t)=6.3 dex.We get a value of log(t)=5.55 dex, which is similarto the one previously determined by Palla & Stalher(2002) who assigned to it an age of log(t)=5 dex, soprobably DF Tau is younger than the cluster’s age.For V397 Aur the age value found was log(t)=6.5dex that corresponds to the upper limit for whichwe have data values on the evolutionary track formasses larger than 2.5 M (see also §3.2), so thisobject is out of the boundaries of the restrictionsimposed by the method (more massive and older).
3.2. Mass and Age
We have seen that we can obtain different massvalues with the PV method if we change the age.We want to explore if it is possible to obtain the ageand mass simultaneously for each object. That is, todevelop a method to determine the two quantities.However, this solution involves 4 quantities (mass,
0 1 2 3 40
1
2
3
41-->BPTau-at-6.5dex2-->CYTau-at-6.25dex3-->DFTau-at-5.5dex4-->DLTau-at-6.5dex5-->DMTau-at-6.75dex6-->FOTau-at-6.5dex7-->FSTau-at-6.25dex8-->GGTau-at-6.25dex9-->GMAur-at-6.5dex10-->LkCa15-at-6.5dex11-->UZTauE-at-6dex12-->V397Aur-at-6.5dex13-->V773Tau-at-4dex14-->ZZTau-at-6.5dex
Fig. 6. MPV vs. Mdyn for the objects with the age ofbest match (listed).
age, size of the disk and extinction reddening) andwe only have 3 photometric measurements (J, H andK). So it is expected that the solution will not beunique, and will be dependent on one of the param-eters. We apply the PV method for a grid made byage values and visualize the results as a contour map
© C
op
yrig
ht 2
007:
Inst
ituto
de
Ast
rono
mía
, Uni
vers
ida
d N
ac
iona
l Aut
óno
ma
de
Mé
xic
o
MASS DETERMINATION FOR T TAURI STARS FROM JHK PHOTOMETRY 165
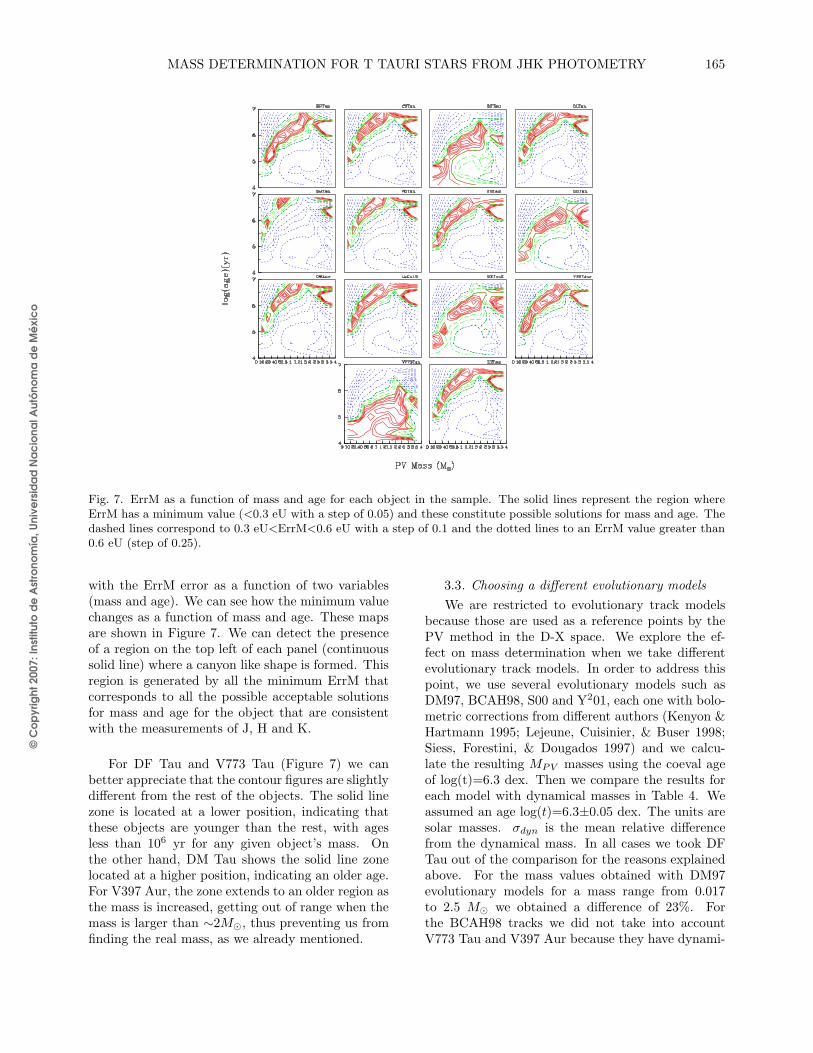
Fig. 7. ErrM as a function of mass and age for each object in the sample. The solid lines represent the region whereErrM has a minimum value (<0.3 eU with a step of 0.05) and these constitute possible solutions for mass and age. Thedashed lines correspond to 0.3 eU<ErrM<0.6 eU with a step of 0.1 and the dotted lines to an ErrM value greater than0.6 eU (step of 0.25).
with the ErrM error as a function of two variables(mass and age). We can see how the minimum valuechanges as a function of mass and age. These mapsare shown in Figure 7. We can detect the presenceof a region on the top left of each panel (continuoussolid line) where a canyon like shape is formed. Thisregion is generated by all the minimum ErrM thatcorresponds to all the possible acceptable solutionsfor mass and age for the object that are consistentwith the measurements of J, H and K.
For DF Tau and V773 Tau (Figure 7) we canbetter appreciate that the contour figures are slightlydifferent from the rest of the objects. The solid linezone is located at a lower position, indicating thatthese objects are younger than the rest, with agesless than 106 yr for any given object’s mass. Onthe other hand, DM Tau shows the solid line zonelocated at a higher position, indicating an older age.For V397 Aur, the zone extends to an older region asthe mass is increased, getting out of range when themass is larger than ∼2M, thus preventing us fromfinding the real mass, as we already mentioned.
3.3. Choosing a different evolutionary models
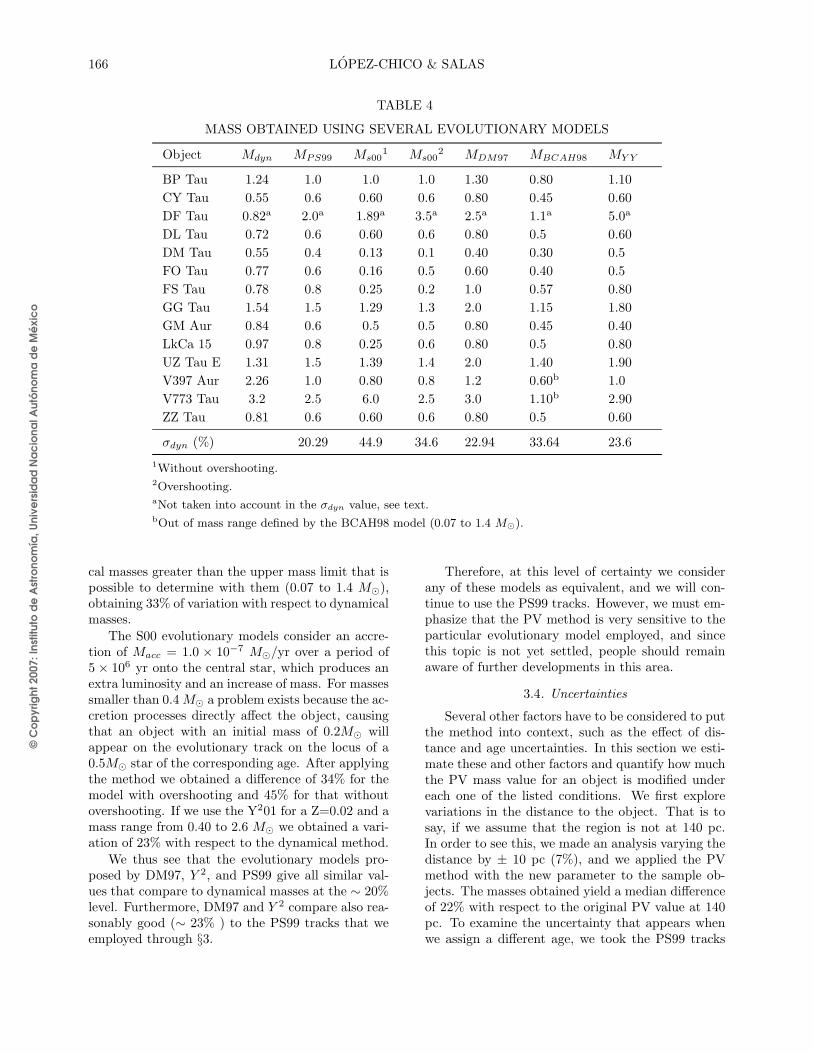
We are restricted to evolutionary track modelsbecause those are used as a reference points by thePV method in the D-X space. We explore the ef-fect on mass determination when we take differentevolutionary track models. In order to address thispoint, we use several evolutionary models such asDM97, BCAH98, S00 and Y201, each one with bolo-metric corrections from different authors (Kenyon &Hartmann 1995; Lejeune, Cuisinier, & Buser 1998;Siess, Forestini, & Dougados 1997) and we calcu-late the resulting MPV masses using the coeval ageof log(t)=6.3 dex. Then we compare the results foreach model with dynamical masses in Table 4. Weassumed an age log(t)=6.3±0.05 dex. The units aresolar masses. σdyn is the mean relative differencefrom the dynamical mass. In all cases we took DFTau out of the comparison for the reasons explainedabove. For the mass values obtained with DM97evolutionary models for a mass range from 0.017to 2.5 M we obtained a difference of 23%. Forthe BCAH98 tracks we did not take into accountV773 Tau and V397 Aur because they have dynami-
© C
op
yrig
ht 2
007:
Inst
ituto
de
Ast
rono
mía
, Uni
vers
ida
d N
ac
iona
l Aut
óno
ma
de
Mé
xic
o
166 LOPEZ-CHICO & SALAS
TABLE 4
MASS OBTAINED USING SEVERAL EVOLUTIONARY MODELS
Object Mdyn MPS99 Ms001 Ms00
2 MDM97 MBCAH98 MY Y
BP Tau 1.24 1.0 1.0 1.0 1.30 0.80 1.10
CY Tau 0.55 0.6 0.60 0.6 0.80 0.45 0.60
DF Tau 0.82a 2.0a 1.89a 3.5a 2.5a 1.1a 5.0a
DL Tau 0.72 0.6 0.60 0.6 0.80 0.5 0.60
DM Tau 0.55 0.4 0.13 0.1 0.40 0.30 0.5
FO Tau 0.77 0.6 0.16 0.5 0.60 0.40 0.5
FS Tau 0.78 0.8 0.25 0.2 1.0 0.57 0.80
GG Tau 1.54 1.5 1.29 1.3 2.0 1.15 1.80
GM Aur 0.84 0.6 0.5 0.5 0.80 0.45 0.40
LkCa 15 0.97 0.8 0.25 0.6 0.80 0.5 0.80
UZ Tau E 1.31 1.5 1.39 1.4 2.0 1.40 1.90
V397 Aur 2.26 1.0 0.80 0.8 1.2 0.60b 1.0
V773 Tau 3.2 2.5 6.0 2.5 3.0 1.10b 2.90
ZZ Tau 0.81 0.6 0.60 0.6 0.80 0.5 0.60
σdyn (%) 20.29 44.9 34.6 22.94 33.64 23.6
1Without overshooting.2Overshooting.aNot taken into account in the σdyn value, see text.bOut of mass range defined by the BCAH98 model (0.07 to 1.4 M).
cal masses greater than the upper mass limit that ispossible to determine with them (0.07 to 1.4 M),obtaining 33% of variation with respect to dynamicalmasses.
The S00 evolutionary models consider an accre-tion of Macc = 1.0 × 10⁻⁷ M/yr over a period of5 × 106 yr onto the central star, which produces anextra luminosity and an increase of mass. For massessmaller than 0.4 M a problem exists because the ac-cretion processes directly affect the object, causingthat an object with an initial mass of 0.2M willappear on the evolutionary track on the locus of a0.5M star of the corresponding age. After applyingthe method we obtained a difference of 34% for themodel with overshooting and 45% for that withoutovershooting. If we use the Y201 for a Z=0.02 and amass range from 0.40 to 2.6 M we obtained a vari-ation of 23% with respect to the dynamical method.
We thus see that the evolutionary models pro-posed by DM97, Y 2, and PS99 give all similar val-ues that compare to dynamical masses at the ∼ 20%level. Furthermore, DM97 and Y 2 compare also rea-sonably good (∼ 23% ) to the PS99 tracks that weemployed through §3.
Therefore, at this level of certainty we considerany of these models as equivalent, and we will con-tinue to use the PS99 tracks. However, we must em-phasize that the PV method is very sensitive to theparticular evolutionary model employed, and sincethis topic is not yet settled, people should remainaware of further developments in this area.
3.4. Uncertainties
Several other factors have to be considered to putthe method into context, such as the effect of dis-tance and age uncertainties. In this section we esti-mate these and other factors and quantify how muchthe PV mass value for an object is modified undereach one of the listed conditions. We first explorevariations in the distance to the object. That is tosay, if we assume that the region is not at 140 pc.In order to see this, we made an analysis varying thedistance by ± 10 pc (7%), and we applied the PVmethod with the new parameter to the sample ob-jects. The masses obtained yield a median differenceof 22% with respect to the original PV value at 140pc. To examine the uncertainty that appears whenwe assign a different age, we took the PS99 tracks
© C
op
yrig
ht 2
007:
Inst
ituto
de
Ast
rono
mía
, Uni
vers
ida
d N
ac
iona
l Aut
óno
ma
de
Mé
xic
o
MASS DETERMINATION FOR T TAURI STARS FROM JHK PHOTOMETRY 167
and we varied the age by ± 0.1 dex (22%) and ob-tained a 18% of variation in the MPV determinationwith respect to the coeval age of log(t)=6.3 dex.
Another source of uncertainties could be due tothe principal vectors themselves. If a different valueof R is assumed, the slope of ~X vector will onlychange in the C-M D. But it will remain the samein the C-C D. To quantify the magnitude of the PVmass produced by this change of slope we tried dif-ferent values of R (3.2 and 4) instead of the nor-mal value of R=3.1 for the ISM. The resulting PVmasses differ by 1.5% and 37% respectively. There-fore, small changes in the value of R have no signifi-cant effect on the mass but a larger change, such asrequired for dense cores (R∼4), should be carefullyexamined.
Next, we want to evaluate the change in PV masswhen the slope of the excess vector ~D varies. Weuse the slope of 0.58 obtained by Meyer et al. (1997)for the locus of the T Tauris as the slope for theexcess vector ~D. We assign the magnitude ‖ ~D‖ ob-tained through the models of D’Alessio et al. (2005)
of ‖ ~Dcc‖ = 0.798. With these, values we applythe coordinate transformation to the D-X space at agiven age of log(t)=6.3 dex. We need two diagramsto find the mass values but Meyer et al. (1997) ob-tained his T Tauris locus only in the C-C D. So, wedecided to use the C-M D slope for the excess vectorthat was obtained with the D’Alessio et al. (2005) ac-cretion models, which has a slope of -1.09. When wechanged these parameters, we obtained a mass vari-ation of 12% with respect to the values calculated in§3.1.
3.5. Binaries
Many of the objects on our list belong to mul-tiple systems and we have analyzed them as a sin-gle object. So the next question emerges. Can weapply the method to the components of a systemand find the individual masses in a consistent way?To answer this, we need to know individual pho-tometry for the components and we apply the PVmethod for each one to determine the mass for agiven age. However, we have dynamical mass val-ues only for V773 Tau; the masses of the other sys-tems were calculated by evolutionary tracks (White& Ghez 2001, hereafter WG01), and were taken sothat the sum of the components matched the massvalues obtained by dynamical methods. We decidedto apply the PV method to the system componentsand to compare these values with mass values de-termined by evolutionary tracks. Only GG Tau, FOTau, FS Tau, and V773 Tau, meet the requirements,
as they have complete component photometry anddetermined masses (see Table 5). For the prelimi-nary determination we fixed the age to log(t)=6.3dex for all the systems, following the work of Har-tigan, Strom, & Strom (1994) where they studied39 binary systems in the Taurus-Auriga and Orionregions, finding that 2/3 of the sample was coeval.GG Tau is a quadruple interactive system (Leinertet al. 1991) of two binary pairs identified as GG TauA and GG Tau B separated by a distance of 10.′′1(1,414 AU). For the GG Tau A components the sep-aration is 0.′′25 (35 AU)( named GG Tau Aa andGG Tau Ab) (see mass values in Table 6). The GGTau B components are separated by 1.′′48 (207 AU).In Table 4 we show the JHK photometric values re-ported by White et al. (1999) and Ghez, White, &Simon (1997).
The FS Tau system (Haro 6-5 A) has two ob-jects separated by a distance of 0.′′25, and the sec-ondary component is 12 times weaker than the pri-mary (Chen et al. 1990). TD02 determined for thefirst time the dynamical value for the system’s mass.
V773 Tau is a multiple system, at distance of 148pc (Lestrade et al. 1999). Welty (1995) observed itas triple system with a very close pair (0.3AU) andthe other component separated by 0.′′15 (∼22 AU).But in 2003, several authors reported a fourth com-ponent (Duchene et al. 2003; Woitas 2003). Ducheneet al. (2003) renamed the close binary pair (SystemV773 Tau AB) as V773 Tau A and V773 Tau B, anddesignated as V773 Tau C the component located at0.′′15 and as V773 Tau D the new component, whichwas catalogued as an IR Source.
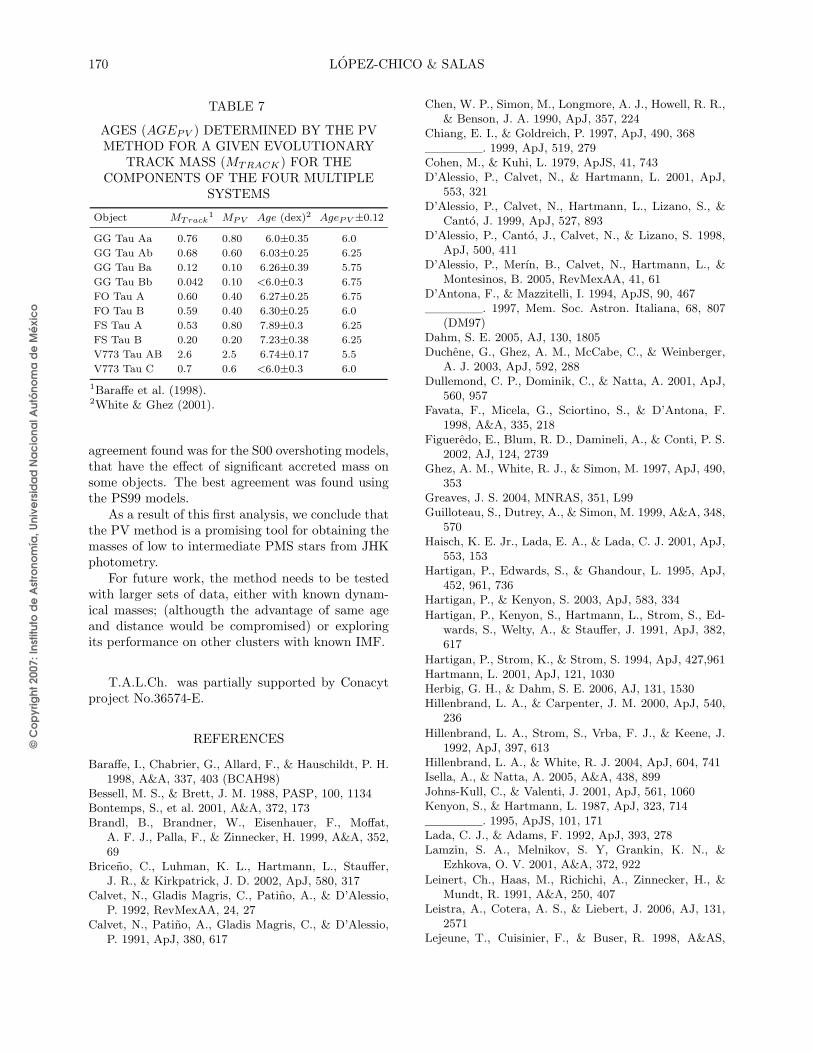
In Table 6 and Figure 8 we show the resultingmass values with the PV Method at a given ageof log(t)=6.3 dex. In general we can see that themethod converges for most of the sample objects.Only for the case of GG Tau Bb we can not find theminimum because we are mass limited. We predictfor this component a mass of <0.1 M having anErrM of 0.84 eU. Out of 10 objects listed in Table 6(Figure 9), 7 coincide to better than 1.5σ accordingto track mass uncertainties and one to better than2σ. Only 2 cases are >3σ away (GG Tau Aa and FOTau B). We applied the PV method with a varyingage to see if we could explain these discrepancies byfinding the object age. We show the results in Table7 and Figure 10. We can see that we can obtain afitting value within 1σ if the ages of GG Tau Aa andFO Tau B are log(t)=6.0 dex. The age determinedfor GG Tau Aa matches the estimated by WG01,and for FO Tau B we are within the uncertainties.

© C
op
yrig
ht 2
007:
Inst
ituto
de
Ast
rono
mía
, Uni
vers
ida
d N
ac
iona
l Aut
óno
ma
de
Mé
xic
o
168 LOPEZ-CHICO & SALAS
TABLE 5
MULTIPLE SYSTEMS PHOTOMETRY
System Components J ∆J H ∆H K ∆K
GG Tau A GG Tau Aa1 9.24 0.09 8.27 0.09 7.73 0.05
GG Tau Ab1 10.12 0.02 9.07 0.08 8.53 0.08
GG Tau B GG Tau Ba1 11.48 0.16 10.63 0.15 10.20 0.12
GG Tau Bb1 13.16 0.12 12.38 0.06 12.01 0.22
FS Tau FS Tau A2 10.85 0.0 9.32 0.0 7.78 0.0
FS Tau B2 12.66 0.0 11.17 0.0 10.03 0.0
FO Tau FO Tau A2 10.13 0.0 9.35 0.0 8.76 0.0
FO Tau B2 10.95 0.0 9.59 0.0 9.14 0.0
V773 Tau V773 Tau AB2 7.77 0.05 7.03 0.03 6.77 0.09
V773 Tau C2 10.13 0.09 8.91 0.15 8.09 0.31
1White et al. (1999).2Woitas, Leinert, & Kohler (2001).
TABLE 6
MASS DETERMINATION FOR MULTIPLE SYSTEMS COMPAREDTO GIVEN MASS BY EVOLUTIONARY TRACKS (WG01)a
Object MTrack±err MPV ±err ~D ~X ErrM
GG TauAa 0.76±0.09 1.0±0.1 0.194 0.294 0.150
GG TauAb 0.68±0.02 0.60±0.1 0.257 0.172 0.174
GG TauBa 0.12±0.03 0.20±0.05 0.148 0.0191 0.255
GG TauBb 0.042±0.019 0.10±0.05 0.285 0.462 0.844
FO TauA 0.60±0.09 0.40±0.1 0.004 0.378 0.296
FO TauB 0.59±0.09 0.80±0.1 0.648 0.236 0.188
FS TauA 0.53±0.08 0.60±0.1 0.497 1.240 0.270
FS TauB 0.20±0.08 0.20±0.5 0.599 0.556 0.217
V773 TauAB 2.61±0.2 2.50±0.25 0.590 0.266 0.175
V773 TauC 0.71±0.1 0.80±0.1 0.374 0.466 0.187
1Dynamical mass by Duchene et al. (2003).aPV mass values shown on column 3. Columns 4, 5 and 6 displaythe calculated disk and interstellar extinction vectors and ErrM.
4. CONCLUSION
We explored the effects of excess emission fromdisks on the JHK-NIR colors on C-C and C-M di-agrams. After analyzing reprocessing and accretiondisk models, a pattern in the J-H vs. H-K and Kvs. J-K diagrams was found, which gave origin to aset of principal vectors (PV), originated by the IRexcess produced by a disk and by the interstellar ex-tinction. We applied a space transformation to verifythe possibility of determining the mass of an objectat a given age.
To test our PV method we applied it to a sam-ple of 14 Taurus-Auriga PMS objects, first withoutresolving the components if they were multiple, withthe purpose to determining the object’s mass. Wefound a fair agreement for 12 cases when we used acoeval asumption. For the other 2 cases, in particu-lar for DF Tau, we showed that an agreement withthe dynamical mass is reached for a different age, asit had been already pointed out by other authors.
We also applied the method to four multiple sys-tems and determined the mass of their individualcomponents, getting a better than 1.5σ agreement

© C
op
yrig
ht 2
007:
Inst
ituto
de
Ast
rono
mía
, Uni
vers
ida
d N
ac
iona
l Aut
óno
ma
de
Mé
xic
o
MASS DETERMINATION FOR T TAURI STARS FROM JHK PHOTOMETRY 169
Fig. 8. Determined PV mass for the components of GGTau, FS Tau , FO Tau and V773 Tau. The PV massvalues are shown in each graph below the object name.
1-->GGTauAa2-->GGTauAb3-->GGTauBa4-->GGTauBb5-->FOTauA6-->FOTauB7-->FSTauA8-->FSTauB9-->V773TauAB10-->V773TauC
Fig. 9. MPV vs. MTrack for the system componentsof GG Tau, FO Tau and FS Tau. The masses for thesystem V773 Tau are dynamical determinations madeby Duchene et al. (2003). We assume a coeval age oflog(t)=6.3±0.05 dex for all the systems.
for most of the components when compared withevolutionary track mass determinations.
Thus, we have shown that this method works fora particular kind of PMS objects, that is, Class IIclassical T Tauri stars. The method still has to betested on youger (class I) or older systems. Currentlywe can apply the PV method only to a mass rangeof 0.1 to 2.5M. Evolutionary tracks for a wider
0 1 2 30
1
2
3
1-->GGTauAa-at-6dex2-->GGTauAb-at-6.25dex3-->GGTauBa-at-5.75dex4-->GGTauBb-at-6.75dex5-->FOTauA-at-6.75dex6-->FOTauB-at-6dex7-->FSTauA-at-6.25dex8-->FSTauB-at-6.25dex9-->V773TauAB-at-5.5dex10-->V773TauC-at-6dex
Fig. 10. MPV vs. Mtrack diagram, used to determine theages for the system components at given mass that fit themass value determined by evolutionary tracks. The topleft labels display the name of each object and its age,as determined by the PV method.
range of masses would be useful to expand the lowermass limit of the method. For the upper mass limit,we have the additional problem that the disk vectorshows a steeper slope in the C-C D. Accretion modelswill be needed to further investigate if an appropriateset of vectors for higher stellar masses can be found.Also, the method needs to be tested in regions withabnormal extinction AV > 25 or R higher than nor-mal, where an appropriate extinction vector wouldhas to be calculated. For the small fraction of starsthat would be viewed nearly edge-on, gray extinc-tion will appear and the method will fail. Howeverthese cases should be distinguished by their unusu-ally large extinction.
Variations in the calculated mass due to distanceand age uncertainties have been also evaluated. Weconsidered reasonable variations in distance (7%)and age (22%) for the objects in our Taurus sam-ple and found a variation in the MPV mass of 20%.This value is similar to the 20% residual error of thePV method with respect to dynamical masses, sug-esting that most differences can be explained as anage and distance dispersion effect.
Although we mainly used PS99 tracks, we alsoconsidered different evolutionary models. The re-sults differed from 20% to 45% with most around22% with respect to dynamical masses. The worst
© C
op
yrig
ht 2
007:
Inst
ituto
de
Ast
rono
mía
, Uni
vers
ida
d N
ac
iona
l Aut
óno
ma
de
Mé
xic
o
170 LOPEZ-CHICO & SALAS
TABLE 7
AGES (AGEPV ) DETERMINED BY THE PVMETHOD FOR A GIVEN EVOLUTIONARY
TRACK MASS (MTRACK) FOR THECOMPONENTS OF THE FOUR MULTIPLE
SYSTEMS
Object MTrack1 MPV Age (dex)2 AgePV ±0.12
GG Tau Aa 0.76 0.80 6.0±0.35 6.0
GG Tau Ab 0.68 0.60 6.03±0.25 6.25
GG Tau Ba 0.12 0.10 6.26±0.39 5.75
GG Tau Bb 0.042 0.10 <6.0±0.3 6.75
FO Tau A 0.60 0.40 6.27±0.25 6.75
FO Tau B 0.59 0.40 6.30±0.25 6.0
FS Tau A 0.53 0.80 7.89±0.3 6.25
FS Tau B 0.20 0.20 7.23±0.38 6.25
V773 Tau AB 2.6 2.5 6.74±0.17 5.5
V773 Tau C 0.7 0.6 <6.0±0.3 6.0
1Baraffe et al. (1998).2White & Ghez (2001).
agreement found was for the S00 overshoting models,that have the effect of significant accreted mass onsome objects. The best agreement was found usingthe PS99 models.
As a result of this first analysis, we conclude thatthe PV method is a promising tool for obtaining themasses of low to intermediate PMS stars from JHKphotometry.
For future work, the method needs to be testedwith larger sets of data, either with known dynam-ical masses; (althougth the advantage of same ageand distance would be compromised) or exploringits performance on other clusters with known IMF.
T.A.L.Ch. was partially supported by Conacytproject No.36574-E.
REFERENCES
Baraffe, I., Chabrier, G., Allard, F., & Hauschildt, P. H.1998, A&A, 337, 403 (BCAH98)
Bessell, M. S., & Brett, J. M. 1988, PASP, 100, 1134Bontemps, S., et al. 2001, A&A, 372, 173Brandl, B., Brandner, W., Eisenhauer, F., Moffat,
A. F. J., Palla, F., & Zinnecker, H. 1999, A&A, 352,69
Briceno, C., Luhman, K. L., Hartmann, L., Stauffer,J. R., & Kirkpatrick, J. D. 2002, ApJ, 580, 317
Calvet, N., Gladis Magris, C., Patino, A., & D’Alessio,P. 1992, RevMexAA, 24, 27
Calvet, N., Patino, A., Gladis Magris, C., & D’Alessio,P. 1991, ApJ, 380, 617
Chen, W. P., Simon, M., Longmore, A. J., Howell, R. R.,& Benson, J. A. 1990, ApJ, 357, 224
Chiang, E. I., & Goldreich, P. 1997, ApJ, 490, 368. 1999, ApJ, 519, 279
Cohen, M., & Kuhi, L. 1979, ApJS, 41, 743D’Alessio, P., Calvet, N., & Hartmann, L. 2001, ApJ,
553, 321D’Alessio, P., Calvet, N., Hartmann, L., Lizano, S., &
Canto, J. 1999, ApJ, 527, 893D’Alessio, P., Canto, J., Calvet, N., & Lizano, S. 1998,
ApJ, 500, 411D’Alessio, P., Merın, B., Calvet, N., Hartmann, L., &
Montesinos, B. 2005, RevMexAA, 41, 61D’Antona, F., & Mazzitelli, I. 1994, ApJS, 90, 467
. 1997, Mem. Soc. Astron. Italiana, 68, 807(DM97)
Dahm, S. E. 2005, AJ, 130, 1805Duchene, G., Ghez, A. M., McCabe, C., & Weinberger,
A. J. 2003, ApJ, 592, 288Dullemond, C. P., Dominik, C., & Natta, A. 2001, ApJ,
560, 957Favata, F., Micela, G., Sciortino, S., & D’Antona, F.
1998, A&A, 335, 218Figueredo, E., Blum, R. D., Damineli, A., & Conti, P. S.
2002, AJ, 124, 2739Ghez, A. M., White, R. J., & Simon, M. 1997, ApJ, 490,
353Greaves, J. S. 2004, MNRAS, 351, L99Guilloteau, S., Dutrey, A., & Simon, M. 1999, A&A, 348,
570Haisch, K. E. Jr., Lada, E. A., & Lada, C. J. 2001, ApJ,
553, 153Hartigan, P., Edwards, S., & Ghandour, L. 1995, ApJ,
452, 961, 736Hartigan, P., & Kenyon, S. 2003, ApJ, 583, 334
Hartigan, P., Kenyon, S., Hartmann, L., Strom, S., Ed-wards, S., Welty, A., & Stauffer, J. 1991, ApJ, 382,617
Hartigan, P., Strom, K., & Strom, S. 1994, ApJ, 427,961Hartmann, L. 2001, ApJ, 121, 1030Herbig, G. H., & Dahm, S. E. 2006, AJ, 131, 1530Hillenbrand, L. A., & Carpenter, J. M. 2000, ApJ, 540,
236
Hillenbrand, L. A., Strom, S., Vrba, F. J., & Keene, J.1992, ApJ, 397, 613
Hillenbrand, L. A., & White, R. J. 2004, ApJ, 604, 741Isella, A., & Natta, A. 2005, A&A, 438, 899Johns-Kull, C., & Valenti, J. 2001, ApJ, 561, 1060Kenyon, S., & Hartmann, L. 1987, ApJ, 323, 714
. 1995, ApJS, 101, 171Lada, C. J., & Adams, F. 1992, ApJ, 393, 278Lamzin, S. A., Melnikov, S. Y, Grankin, K. N., &
Ezhkova, O. V. 2001, A&A, 372, 922
Leinert, Ch., Haas, M., Richichi, A., Zinnecker, H., &Mundt, R. 1991, A&A, 250, 407
Leistra, A., Cotera, A. S., & Liebert, J. 2006, AJ, 131,2571
Lejeune, T., Cuisinier, F., & Buser, R. 1998, A&AS,
© C
op
yrig
ht 2
007:
Inst
ituto
de
Ast
rono
mía
, Uni
vers
ida
d N
ac
iona
l Aut
óno
ma
de
Mé
xic
o
MASS DETERMINATION FOR T TAURI STARS FROM JHK PHOTOMETRY 171
130, 65Lestrade, J. F., Preston, R. A., Jones, D. L., Phillips,
R. B., Rogers, A. E. E., Titus, M. A., Rioja, M. J.,& Gabuzda, D. C. 1999, A&A, 344, 1014
Levine, J. L., Steinhauer, A., Elston, R. J., & Lada, E. A.2006, ApJ, 646, 1215
Liu, W. M., Meyer, M. R., Cotera, A. S., & Young, E. T.2003, AJ, 126, 1665
Luhman, K. L. 1999, ApJ, 525, 466. 2000, ApJ, 544, 1044
Luhman, K. L., Lada, E. A., Muench, A. A., & Elston,R. J. 2005, ApJ, 618, 810
Luhman, K. L., & Rieke, G. H. 1999, ApJ, 525, 440Luhman, K. L., Rieke, G. H., Lada, C. J., & Lada, E. A.
1998, ApJ, 508, 347Luhman, K. L., Rieke, G. H., Young, E. T., Cotera, A. S.,
Chen, H., Rieke, M. J., Schneider, G., & Thompson,R. I. 2000, ApJ, 540, 1016
Luhman, K. L., Stauffer, J. R., Muench, A. A., Rieke,G. H., Lada, E. A., Bouvier, J., & Lada, C. J. 2003,ApJ, 593, 1093
McCabe, C., Ghez, A. M., Prato, L., Duchene, G., Fisher,R. S., & Telesco, C. 2006, ApJ, 636, 932
Meyer, R. M., Calvet, N., & Hillenbrand, L. A. 1997, AJ,114, 288
Moore, T. J. T., Lumsden, S. L., Ridge, N. A., & Puxley,P. J. 2005, MNRAS, 359, 589
Muench, A., Lada, E. A., Lada, C. J., & Alves, J. 2002,ApJ, 573, 366
Muzerolle, J., Calvet, N., Hartmann, L., & D’Alessio, P.2003, ApJ, 597, L149
Natta, A., Meyer, M., & Beckwith, S. 2000, ApJ, 534,838 (N00)
Nielbock, M., Chini, R., & Muller, S. A. H. 2003, A&A,408, 245
Oasa, Y., Tamura, M., & Sugitani, K. 1999, ApJ, 526,336
Palla, F. 1993, in Infrared Astronomy, ed. A. Mampaso,
T. Lopez-Chico and L. Salas: Instituto de Astronomıa, Universidad Nacional Autonoma de Mexico, Apdo.Postal 877, 22830 Ensenada, B. C., Mexico (tania, [email protected]).
M. Prieto, & F. Sanchez (Cambridge: CambridgeUniv. Press), 1
Palla, F., & Stalher, S. W. 1999, ApJ, 525, 772 (PS99). 2002, ApJ, 581, 1194
Porras, A., Cruz-Gonzalez, I., & Salas, L. 2000, A&A,361, 660
Rieke, G. H., & Lebofsky, M. J. 1985, ApJ, 288, 618Scalo, J. M. 1986, Fundamentals of Cosmic Physics, 11,
1Schaefer, G. H., Simon, M., Nelan, E., & Holfeltz, S. T.
2003, ApJ, 126, 1971Schmidt-Kaler, T. H. 1982, in Landolt-Bornstein, Group
VI, Vol. 2b, Stars and Star Clusters, ed. K. Schaifer& H. H. Voigt (Berlin: Springer), 15
Shakura, N. I., & Sunyaev, R. A. 1973, A&A, 24, 337Siess, L., Dufour, E., & Forestini, M. 2000, A&A, 358,
593 (S00)Siess, L., Forestini, M., & Dougados, C. 1997, A&A, 324,
556Simon, M., Dutrey, A., & Guilloteau, S. 2000, ApJ, 545,
1034Steffen, A. T., et al. 2001, AJ, 122, 997Strom, K., Strom, S., Edwards, S., Cabrit, S., & Skrut-
skie, M. 1989, AJ, 97, 1451Tamazian, V. S., Docobo, J. A., White, R. J., & Woitas,
J. 2002, ApJ, 578, 92 (TD02)Testi, L., Palla, F., & Natta, A. 1998, A&A, 133, 81Walter, F. M., Brown, A., Mathieu, R. D., Myers, P. C.,
& Vrba, F. J. 1988, AJ, 96, 297Welty, A. D. 1995, AJ, 110, 776White, R. J., & Ghez, A. M. 2001, ApJ, 556, 265 (WG01)White, R. J., Ghez, A. M., Reid, I. N., & Schultz, G.
1999, ApJ, 520, 811Woitas, J. 2003, A&A, 406, 685Woitas, J., Leinert, Ch., & Kohler, R. 2001, A&A, 376,
982Yi, S., Demarque, P., Kim, Y. C., Lee, Y. W., Ree, C. H.,
Lejeune, T., & Barnes, S. 2001, ApJS, 136, 417 (Y201)