Embed Size (px)
Citation preview

www.theanalyticalscientist.com
Mass Data Made Simple Welcome to a new era of mass detection, where simplicity meets robustness to open up a new world of possibilities. Here, we tell the stories of four very different scientists, discover the truth behind innovation, and ask an important question: where is your mass data?
the
Analytical Scientist

the
Analytical Scientist
Contents
04 Ultra Pure Proof Putting robust detection on the frontlines of method development andmassconfirmation. By Alex Brien, Reach Separations, UK.
06 Changing the Rules Howsimplifieddetectors can provide mass data for every analytical run and speed up method development. With Davy Guillarme, University of Geneva, Switzerland
08 Trailblazing a New Kind of Innovation What are the challenges when translating complexity into simplicity – and how do we measure success in such an endeavor? With Daniel Kenny, Waters, UK
13 Building a Perfect PurificationPlatform Adding 90,000 novel candidates to our compound collection each year is challenging. Choosing the right technology is crucial – so it’s great when innovation makes the decision clear-cut. By Gerard Rosse, Dart NeuroScience, California, USA.
16 MissionImprobable:Rapid TotalSugarReporting How mass detection allows us to tell the beautiful truth about beer. By Larissa Burns, Lion - NSW, Australia.
18 MethodsDevelopment Workflows
20 IncreasingSpecificityandSensitivity inRoutinePeptideAnalysesUsing Mass Detection with the ACQUITYQDaDetector
22 SeamlessIntegrationof Mass Detection into the UV ChromatographicWorkflow
13
16
08
B ack in 2013, the ACQUITY QDa Detector was awarded a top spot in the inaugural TASIAs – The Analytical Scientist Innovation Awards. Launched just months ear lier by
Waters, the ACQUITY QDa immediately caught the attention of the independent judging panel; one judge noted: “[The QDa] turns MS into a regular detector that can be operated by all users. Important improvement in terms of reliability of the analysis.” Unlike many of the other innovations in 2013, the ACQUITY QDa had a special quality: the focus was on simplicity and robustness rather than scoring points for being more sensitive, more accurate or more complex. The ACQUITY QDa falls into a direction of development that I like to call “sideways innovation,” where the primary aim is to increase usability and adoption.
The Analytical Scientist Innovation Awards always focus on the “potential impact” of the product. The Waters nomination read: “Armed with MS data, separations scientists can be more valuable and more confidentcontributors to the laboratory. The ACQUITY QDa Detector answers many of their questions: Did I synthesize what I intended to and how do I know? Is this peak really pure? Have I accounted for all components in my sample? What is the component represented by this peak? Will my method pass validation? The result: greater productivity.”
Just how accurate was this statement? Well, over the last few months I’ve been speaking with QDa users who have been directly impacted by the innovation introduced exactly three years ago. And it’s fair to say the vision within the nomination was prophetic; the ACQUITY QDa has been Waters’ fastest selling MS product to date. However, as Director of MS Development Daniel Kenny notes on page 8, “... Many users will simply see it as ‘ just another detector,’ which I think is fantastic.” In other words, mission accomplished...
Within the pages of this compendium, four ACQUITY QDa users share their diverse stories, from speeding up methoddevelopmenttobuildingaperfectpurificationplatform to reporting low sugar levels in Australian beer. What do all the stories share in common? The ease with whichmassdetectionwasintegratedintoeachworkflow.Is there a market for mass spectrometry with push-button simplicity? Absolutely.
Rich WhitworthEditor
Successful Sideways InnovationThree years on: how far has mass detection come?
www.waters.com/qda
Int roduct ion

the
Analytical Scientist
Sponsored Supplement4
Before joining the newly formed Reach Separations in February 2012, I spent five years at AstraZeneca in analysisandpurification(latterlyasgroupleadinreversedphaseandchiralpurification).This experience gives me a good perspective of both the needs of ‘big pharma’ and, more recently, the needs of a specialist separation solution provider. My time atAstraZeneca allowedmeto get ‘hands on’ with a number of chromatography and mass spectrometry platforms, and provided me with an acute awareness of the need for reliable data and robust instrumentation – something that was reinforced when I joined Reach Separations.
Reach Separations started out of the blocks very fast, in part because we had the expertise to address enantiomer separation challenges faced by the pharmaceutical industry in light of tighter regulations; indeed, we started out primarily as a chiral chromatography-focused business, serving the pharma market. However, over the last four years, we’ve branched out into agrochemical andfinechemicalmarketsand,aswe’vegrown, achiral work has become a much bigger part of our business.
Key analyticsInadditiontoourchiralpurificationwork(we tackle everything frommg to kgscale),weofferachiralpurificationservicesto produce ‘ultra pure’ material that goes onto later stage testing. We also work with manufacturers at the opposite end of the spectrum, by offering isolation and
identificationofimpurities.Whenitcomestopurification,themost
important(andchallenging)aspectistheanalysis. From a separations standpoint, we use several UPLC systems and we also have an SFC equivalent – the Waters ACQUITY UPC2. Those two separation systems are now coupled with a Waters ACQUITY QDa mass detector and this allows us to cover any project that comes into the laboratory.
We’ve had the QDa for 18 months – with only one preventive maintenance and zero downtime. The investment coincided with a sudden surge in company growth, and the need to expand our mass detection capability. Prior to that, we had been working with legacy single-quad mass spec systems that suffered from reliability as well as compatibility issues. The QDa was an obvious fit,ticking several important boxes for our lab. Firstly, it’s competitively priced – any small but fast-growing lab will appreciate this parameter; consequently, return on investment is near unbeatable. Secondly, compatibility with our UPLC and UPC2 systems was assured. Thirdly, because we were growing rapidly, lab space was at a premium, which is where the QDa wins hands down – its small footprint is what makes it feel more like a detector thananMSsystem,anditfitsneatlyinwith the other modules. Of course, it also needs to be able to do the job – and we wouldn’t invest in a system that gives results that are not comparable to other service providers in our space. Mass data quality from the QDa is excellent for our needs and provides us with 100 percent confidenceinallourresults.
Headache-free mass detectionPossibly the biggest plus point for the QDa is its usability. As we ramped up the business, we needed additional staff members. Rather than wasting precious resources on training fresh talent on the nuances of quirky, old MS systems, we
could get them up and running with ease. Indeed, the new members of our team were quickly able to apply theoretical knowledge of mass spectrometry to real-lifesamples,whichreflectsmyopinionthat the ACQUITY QDa is one of the most user-friendly pieces of equipment on the market. Even so, if you’re running a team of analysts with different experience levels,it’sgreattobeabletoconfidentlyrely on the ACQUITY QDa’s internal calibration,which significantly reducesthe potential for operator error... In a competitive contract environment, getting analysesrightfirsttimeisessential.
Even as an experienced user of mass spectrometry, the ACQUITY QDa’s usability is very welcome. I think it’s the firsttimeI’vefeltthatmassdetectionhastruly integrated itself with the rest of the separation workflow. Companies thatdon’t have mass spectrometry ‘super users’ onstafffinallyhaveawaytoaccessqualitymassdatawithconfidence.Thesimplefactthat it can be treated like a pump or a UV detector is a real bonus to our team.
On the other side of that coin, you do sometimes have to remind yourself that you are looking at mass spectrometry data. An easy to use system needs backing up with easy to use software. Here again, users of the QDa are presented with a software package
Ultra Pure ProofPutting robust detection on the frontlines of method development and mass confirmation.
By Alex Brien
“I think it’s the first time I’ve felt that
mass detection has truly integrated
itself with the rest of the separation
workflow.”

www.waters.com/qda
(WatersEmpower3ChromatographyDataSoftware)thatallowssomeoftheeasiestdata interpretation I’ve seen – another huge plus.
It’s not a toyWith a focus on usability and affordability, it might be tempting to consider the ACQUITY QDa a plaything, and though it is relatively fun to use, we throw it some serious tasks. Forexample,weuseitformassconfirmationof samples as they enter and leave the lab. We’ve started using it very heavily with the UPC2 system for chiral separation method development. We recently introduced ‘chiral pooling,’ which allows us to analyze as many as six compounds in a single run to assess optimal conditions for separating isomers (1).Withoutmassdata,thiswouldnotbepossible – we’ve estimated that we are runningfivetimesfaster(55samplesaday)than if we used conventional, sequential SFC runs with UV detection alone. Any piece of technology that enables higher throughput is always welcome in a service environment.
Today, UPLC, UPC2 and QDa mass detection is our frontline analytical platform.
Over the next 12 months, as we continue to grow, I can expect to see us scaling up that platform, including several more QDa detectors. We feel it puts us in a great position to serve our customers with top-quality but very competitive analytical and purificationservices.If, likeme,you’veworkedwith (and
been frustratedby) legacysingle-quadMS systems in the past, you’ll likely be surprised and delighted in equal measure by the ACQUITY QDa’s simplicity and robustness. If you’re new to mass detection, you’ll have to settle for delighted.
Alex Brien is Senior Purification Scientist at Reach Separations, UK.
Reference
1. http://www.waters.com/webassets/cms/library/
docs/720005792en.pdf
“Companies that don’t have mass spectrometry ‘super users’ on staff finally have a way to access quality mass data with confidence.”

the
Analytical Scientist
With access to multiple mass spectrometry systems of varying degrees of sophistication, DavyGuillarme (University ofGeneva,Switzerland)wasn’tactivelylookingfornewmass detection solutions. Nevertheless, the Waters ACQUITY QDa mass detector caught his eye. Why? Because it opens a new door to mass spectral data. Here, Guillarme – a chromatography specialist – explains why simple but robust mass detection has found an important role in method development in his world: pharmaceutical analysis.
What are your analytical goals?Myfieldofexpertiseisliquidchromatography(LC),supercriticalfluidchromatography(SFC)andtheirhyphenationwithseveraldetectors, including UV, UV-DAD, ELSD, fluorescence, MS, MS/MS and high-resolution (HR)MS. Our laboratory isparticularly interested in investigating modern LC and SFC technologies; for example, the use of advanced columns (sub-2µmporousparticlesor sub-3µmsuperficiallyporousparticles)inconjunctionwith chromatographic systems at very high pressures. Our overarching goal is todevelopultra-fast and/or very high-resolution separations for pharmaceutical samples of varying levels of complexity – and that means the analysis of small and very large molecules in simple pharmaceutical formulations,butalsoinbiologicalfluids(usingsuitablesamplepreparation).
What are the analytical challenges your lab faces?A few years ago, one of the main constraints was the limited acquisition speed of mass
spectrometers, when combined with UHPLC. The problem has now been largely resolved; most MS systems are now able to meet the requirements of fast LC.
We now face two more practical challenges when it comes to acquiring mass data:
i. the inherent complexity of MS instruments(particularlycriticalfortechniciansandinterns);
ii. thecost(bothintermsofinitialpurchaseandongoingmaintenance).
Another challenge, which emphasizes the rapid development in mass spectrometry, is the fact that MS systems can become obsolete after only a few years. New models are released so regularly that it’s difficulttostayatthecuttingedgewhenitcomes to sensitivity in a given application.
What MS systems do you have at your disposal?We have several MS systems from different manufacturers, including two single quadrupoles, two triple quadrupoles, one TOF-MS,oneQTOF/MSandoneOrbitrap.Dependingontheapplication(targetedoruntargeted)andtherequiredsensitivity,wehave the ability to hyphenate different inlet instruments(capillaryelectrophoresis,LCorSFC)totheseMSplatforms.
What motivated you seek other solutions?The MS systems in our laboratory are somewhat expensive to operate and not always convenient or easy to use, which means they tend to be devoted to projects that deal with the analysis of complex matrices(forexample,urine,blood,plasma,cerebrospinalfluid,andplantextracts).Thesignificantoperatingcosts(andthe
highdemandfortheMSinstruments)haveprevented us from using mass spectrometry to speed up method development in chromatography – even though it’s known to be a very powerful tool. Over
the last few years, we have used various commercial software packages, including a peak match tool, for peak tracking based on UV absorbance, for successful HPLC method development. However, based on our experience, we believed that the method development process could be fasterandthattheconfidenceinourresultswould be increased with the help of mass detection. To that end, the launch of the QDa – a simple, relatively sensitive, low-cost mass detector, which was compatible with our Empower chromatographic software – caught my eye.
Notably, high-powered MS instruments are not always needed. Sometimes, a very simple mass detector can have a real impact in the laboratory when it comes to method development, which is now one of the main roles of our QDa instrument.
HowdoesQDafitintoyour currentworkflows?QDa is based on proven technology – the novelty of this system lies in its miniaturized format, as well as the fact
Changing the RulesHow simplified detectors can provide mass data for every analytical run and speed up method development.
“In my opinion, the simplicity of
the QDa is comparable with
spectroscopic detectors, so can even be used by people with very
limited MS backgrounds”
Sponsored Supplement6

www.waters.com/qda
that it is easy to use. In our laboratory, the QDa is used for both service and research projects; for example:
iii. fasterHPLC/SFCmethoddevelopment, using MS peak tracking;
iv. identificationofimpuritiesproducedduring chemical synthesis or in a commercial pharmaceutical product;
v. the analysis of small molecular weight compounds in relatively simple matrixes – especially when UVsensitivityisnotsufficientor compounds do not possess chromophores.
In our UHPLC-UV-QDa set-up, a dilution pump with a splitter is included between the UV and QDa detectors to attain concentration levels that are compatible with both detectors. In general, the QDa is around 100 times more sensitive than a UVdetector(thoughthisfactorstronglydepends on the chemical nature of the analyzedcompounds);byusingthisset-up, the signal of both detectors can be recorded at the same time.
How would you assess the QDa from a laboratory management standpoint? From an economic point of view, the QDa is extremely attractive, as the purchase and operatingcostsaresignificantlylowerthanany other MS instrument on the market. Intermsoflabefficiency,theQDais
extremely easy to use and controlled by Empower – a widely used chromatographic package, which means that technicians and interns can be trained to use the QDa in less than one day! In my opinion, the simplicity of the QDa is comparable with spectroscopic detectors, so can even be used by people with very limited MS backgrounds. Thanks to these positive features, we are now able to use mass detection for more applications, improving confidenceinourresultsandincreasingtheamount of information that can be gained from a single injection.
Bench space in most laboratories is at a premium – but because the QDa is fully integrated with the UHPLC instrument, it doesn’t take up additional space.
Another surprising advantage of the QDa mass detector has to do with comfort. The primary pumps of other MS instruments are noisy and typically run 24/7, making laboratory environmentstiring.TheQDa(anditsprimarypump)can easily be switched off when not in use, which is a clear advantage. After turning the instrument on, only a few minutes are needed before the system can analyze samples. And because the primary pump is much smaller than other MS devices, the noise remains reasonable even when the QDa is in use.
Willrobust,simplifiedsystemschangehow mass detection is adopted?Many laboratories could benefit fromthe excellent sensitivity, high selectivity and mass information provided by mass spectrometry, which perfectly complements chromatographic methods. However, as noted above, such MS instruments are not always available, either because of the associated cost or a lack ofhighlyqualifiedtechnicians.TheQDa
changestherules.Ithasbeenspecificallydesigned for chromatographers and not for mass spectroscopists – and it makes mass detection much more affordable.
Where do you see the future of mass detectioninyourfield?Mass detection is extremely useful in analytical chemistry and will certainly continue to develop at a rapid pace. I see two different trends in the MS market. On the one hand, many providers will continue to offer MS instruments with increasingly high performance; such state-of-the-art instruments are obviously dedicated to mass spectroscopists, with specifictraining and expertise. For this category of instruments, I suspect that IMS-MS will be more and more widely used in the future.
On the other hand, there is a clear drive towards making mass data more accessibletonon-massspectroscopists(forexample,chromatographers).Here,lowercost,simplifiedoperation,reducedsize,and reduced maintenance are the most important factors. In the future, I expect – and would like to see – other types of mass analyzer enter into this second category, including triple quadrupole and time-of-flightinstruments.
Mass Data Made Simple 7

the
Analytical Scientist
What was the starting point for the ACQUITY QDa Detector?We believe in the power of mass spectrometry – what it can do and what it can deliver. So we started by considering what barriers were preventing people from adopting MS technology – affordability and footprint came into play, but the big focus was on the question: “Why is mass spectrometry seen as being scary?” We knew that we needed to address the complexity behind mass spectrometry for our customers, which is why accessibility and usability are integral to the design of the ACQUITY QDa.
Most people will be aware of ‘triple constraint’ triangles – but we were working with a square, needing to balance usability/robustness,miniaturization,cost,and also performance. For example, with the source, instead of trying to achieve ultimate performance for any one compound or any one assay, we focused on ensuring good quality data for most analyses, most of the time by simplifying the design. Minimizing the degree of compromise on any one corner of our square required serious innovation.
Is that why the concept-to-product timeline was longer than usual? The ACQUITY QDa is an absolute g round -up r edes i gn of a ma s s
spectrometer. Typically, new instruments come about through evolution – ‘borrowing’ several components from an existing product while introducing a new innovation that boosts sensitivity, for example. You don’t normally have to reinvent absolutely everything for a new instrument – especially when you already havecomponentsthatarefitforpurpose.However, this was not the case with the QDa. I believe it was over four years from firstinformaldiscussionstofinallyputtingthe instrument in our customers’ hands. Within that time, the ‘engineering model’ phase was essential, allowing us to make – and learn – from mistakes as we focused on miniaturizing and simplifying various aspects of the evolving design.
Could you share some examples of “ground-up” design in the QDa?Wefilednumerouspatentapplicationsfor inventions related to the ACQUITY QDa – and not the sort of patents that we have historically filed (which tendto be focused on performance – new ways of manipulating ions, getting more sensitivity,andsoon).Agoodexampleis the electrospray probe – something that a user will almost certainly have to interact with at some point, because the capillaries within can become blocked or deteriorate over time. We wanted to make maintenance as painless as possible (ittakesquiteabitofaskilltodismantleatypicalprobeandfitanewcapillary)andthat led to a very different probe design. The probe is an all-in-one component, with the capillary already crimped to the PEEK tube that will connect to the column or UV detector. You can literally swap the whole probe in a matter of seconds rather than taking up to an hour to do so. And, perhaps more importantly, the process is more reproducible, which ensures consistent performance that does not rely upon on user aptitude. An all-in-one design also allows us to minimize dead volume–anotherbenefittotheuser.
Trailblazing a New Kind of InnovationWhat are the challenges when translating complexity into simplicity – and how do we measure success in such an endeavor? Daniel Kenny, Director of MS Development at Waters, shares the motivation, inspiration and celebration behind the development of the ACQUITY QDa Detector.
Sponsored Supplement8

the
Analytical Scientist
Another aspect of usability is robustness. We’ve built the QDa detector as something that is going to be used day in, day out – perhaps by someone who may not have worked with mass spectrometry before. To that end, we assumed that users were either not accustomed to – or simply did not enjoy – cleaning the samplingorificeorconeastheywouldhave to do in a typical electrospray MS system. So instead of having a very small sampling aperture at the apex of the
sample cone, we decided to hide the aperture down a tunnel that protects it from spray that would lead to charging problems over time. And with cost also in mind, we engineered a solution that was inexpensive and so easy to replace that anovicecandoitwithconfidence.Thecomponent is effectively disposable; when it becomes dirty or blocked, you vent the instrument,throwtheorificeinthetrashand insert a new one. And because the pumping volume of the ACQUITY QDa
is very small, you can be up and running again in another ten minutes.
Going back to the electrospray source, in traditional mass spectrometry we have almostinfiniteflexibility–wecanmovethe probe up and down, left and right, we can move the capillary within the probe,wecanchangethegasflow,thetemperature, entrance voltages. All the variables allow us to optimize performance for a given analytical need – but they also add a great degree of complexity. In the
Early ACQUITY QDa Detector engineering prototype

www.waters.com/qda
ACQUITY QDa, we reduced complexity (andthereforeflexibility)bydesigningacompletely pre-optimized geometry with fixedgasflowsandsoon.Theresult:itjust works.
Many other engineering solutions and innovations came into play during development to bring the push-button simplicity and footprint of the QDa Detector.
Clearly, there was a lot of hardware innovation – what about software?
We applied the same rules to the software – we wanted to maximize usability and create something that will be familiar to chromatographers. To that end we locked down certain parameters and automated complex tasks. But there’s a lot going on ‘behind the scenes’, with many‘advanced’(butlittle-used)settingshidden from view and set to optimal defaults. We also looked very closely at the software interfaces we had in place for other LC detectors, and tried as best we could to use the same language and terminology. We wanted interaction with the ACQUITY QDa to be highly familiar with chromatographers coming from a UV or PDA detector background.
Was everyone involved as passionate about the project as you? It was one of those great times when we had great deal of ‘buy in’ – everybody understood the concept and was fully focused on delivering it. It really was a massive team effort – it took the efforts of hundreds of people to make the ACQUITY QDa happen. Without the passion and determination, I don’t think we could have achieved what we set out to do: create an extremely user-
friendly mass detector with appropriate performance at the right cost – and in a formatthatfitsintoaregularHPLCstack.
Why has it taken so long for a mass detector like the ACQUITY QDa? I suspect there have been several
“The QDa is actually our fastest-
selling mass spectrometry product – but
many users will just see it as ‘simply
another detector,’ which I think is
fantastic. It means we’ve succeeded!”
Reverse cone geometry evolution
Mass Data Made Simple 11

the
Analytical Scientist
attempts before – but they probably strayed away from the original concept and core objective. Sometimes it seems safer to ‘hedge your bets’ and end up with a product that is too far removed from the initial remit. We were brave enough to maintain the clarity around our original vision right through to production
– and I guess that’s quite unusual in a per formance-obsessed industry. By choosing instead to focus on ease of use, size and cost – and accepting that some customers don’t need the highest levels of sensitivity or the widest possible mass range – we’ve found success where others have failed, by opening up mass detection to a new audience.
The development of the ACQUITY QDa –andtheresponsethatit’sreceived(bothinternallyandexternally)–hasemboldenedus; we now realize that ultimate usability is something that is truly valued. We’ve recognized that we can successfully move in a new direction of innovation and I am sure thatwill be reflected in productsthat we commercialize in the future. Waters has always driven by performance (andweseeourselvesasaheadof thetechnologycurveinthemarketplace)–now, we will also be driven by the need to provide a well-rounded experience for our customers.
The ACQUITY QDa is actually our fastest-selling mass spectrometry product – but many users will simply see it as ‘just another detector,’ which I think is fantastic. It means we’ve succeeded! We never wanted
to supplant UV detection, which is still a gold standard for many things, rather we wanted to supplement UV with additional valuable information that was previously out of reach. Witnessing the uptake of QDa, andseeingcustomersbenefitfromwhatwe have achieved is immensely satisfying. Disruptive products tend to spur surprise applications – has anything caught your eye?In the beginning and through development, we were aiming the ACQUITY QDa squarelyat(liquid)chromatographers–and so yes, some applications have been unexpected and also very interesting. For example, we’ve heard of QDa detectors being wheeled around on laboratory trolleys to take the analysis to the sample – others are being used in fume-hoods to monitor reactions. And we literally put one into a rucksack and carried it to the top of a mountain to do analysis with a special prototype probe. Many of these exciting applications are ‘point-of-use’ direct analyses that simply take advantage of being able to do something new. And that’s perhaps more satisfying than anything else.
“The development of the QDa – and the response that it’s received – has emboldened us; we now realize that ultimate usability is something that is truly valued.”
ACQUITY QDa Sample Cone Robustness.
Sponsored Supplement12
www.waters.com/qda
Dart NeuroScience is one of the largest privately owned biotech companies in SanDiegowitharound250employees– and we have an interesting focus: memory.Morespecifically,ouraimistodevelop new technologies and therapies that can maintain or improve memory function and cognitive vitality.
Much of our research is built on the work of Tim Tully, who was a professor and Head of the Division of Neurogenetics at Cold Spring Harbor
Laboratory in New York before founding Dart NeuroScience – he’s now our Executive Vice President of R&D and Chief ScientificOfficer. In brief, Tullydiscovered the important role that the CREB gene plays in the formation of long-term memory; our target compounds aim to modulate that CREB pathway.
Curating a compound collectionI ’ve worked in the pharmaceutical industryformorethan15years–startingat Hoffmann-La Roche in Switzerland before moving over to the US to join Sanofi-Aventis and then Cephalon/Teva. I joined Dar t NeuroScience in 2011 to help build the Structure Guided Chemistry department – an essential component of our ambitious program.Mygrouphasaveryspecificmission: to develop novel technologies and chemistries to create a proprietary and prospective compound collection designed from 3D surface features of proteins. When I joined the company, myfirst jobwastobuildatechnologyplatform for the automated synthesis, purificationandanalysisofcompounds.
Our aim is to add 90,000 compounds to the collection each year, so it’s certainly a large-scale project with a number of challenges. Our laboratory looks like something in between a manufacturing plant and a typical research lab...
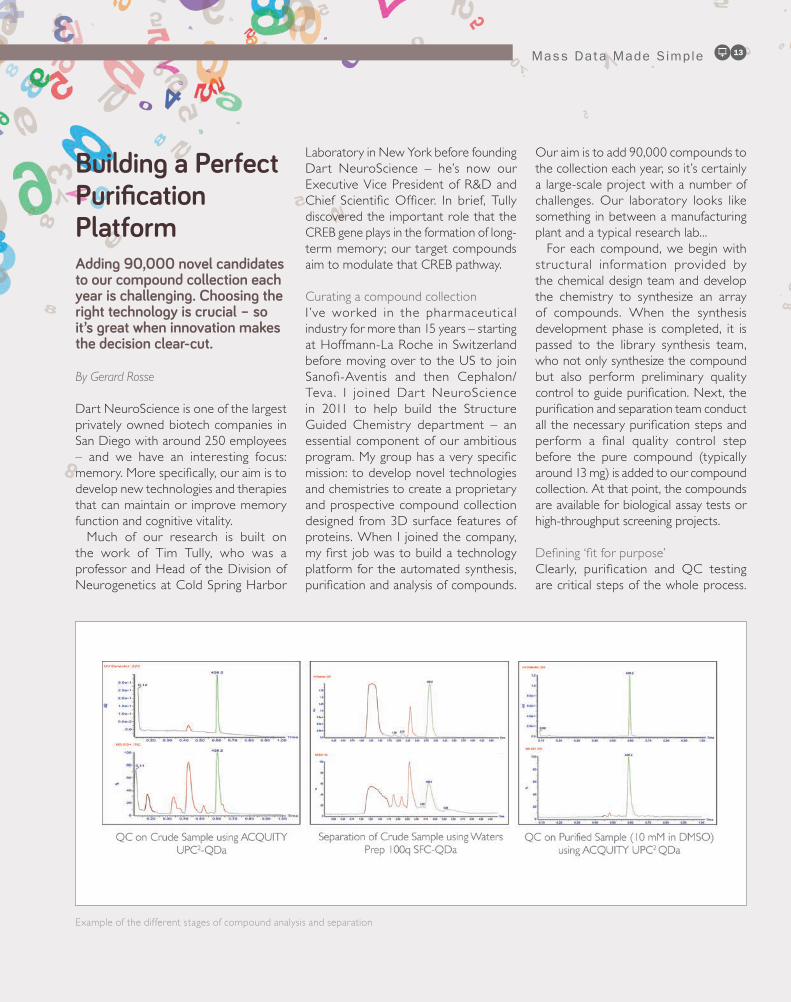
For each compound, we begin with structural information provided by the chemical design team and develop the chemistry to synthesize an array of compounds. When the synthesis development phase is completed, it is passed to the library synthesis team, who not only synthesize the compound but also perform preliminary quality controltoguidepurification.Next,thepurificationandseparationteamconductallthenecessarypurificationstepsandperform a final quality control stepbefore the pure compound (typicallyaround13mg)isaddedtoourcompoundcollection. At that point, the compounds are available for biological assay tests or high-throughput screening projects.
Defining‘fitforpurpose’Clearly, purification and QC testingare critical steps of the whole process.
Building a Perfect Purification PlatformAdding 90,000 novel candidates to our compound collection each year is challenging. Choosing the right technology is crucial – so it’s great when innovation makes the decision clear-cut.
By Gerard Rosse
Mass Data Made Simple 13
Example of the different stages of compound analysis and separation
the
Analytical Scientist
And using the right analytical tools is key. Right at the beginning, as I noted earlier, we perform preliminary QC on the whole crude compounds. Based on those results, our analysts – through a semi-automated workflow – confirmwhich compound will be the focus of the purificationprocess.Afterpurificationanother QC step is performed as the compound is transferred from the fraction tubes to the corporate vial, where it is stored in a DMSO stock
solution.Here,afinalQCstepprovidesthe data that is linked to the compound in the library. Our platform is about 75 percent
SFC and 25 percent (HP)LC. SFC isour predominant method because it’s faster and more cost effective; in purification, we’ve found that SFCallows pooled fractions to be dried down about 10 times faster than HPLC and reduces solvent use and waste by a third – you can read more here:
www.waters.com/dart.Theintroductionof ACQUITY UPC2 was a game-changer for us, because it allows us to analytically support SFCpurification.All of our separation instruments are hyphenated with mass spectrometry, which we use to complement UV and evaporative light scattering detection (ELSD).OurMSsystemsareamixtureof older single-quadrupole instruments, such as the SQD and SQD2, and several newer ACQUITY QDa mass detectors.
Sponsored Supplement14

www.waters.com/qda
In terms of per formance and reproducibility, the SQ detectors and ACQUITY QDa are comparable. And both detectors are fully compatible with our UPLC and SFC techniques, which is clearly essential. We use the ACQUITY QDa with our Waters Prep 100q SFC System – an open-bed collection MS-directed system – and in our ACQUITY UPLC and UPC2 analytical platforms, which gives us confidence across the whole platform.
Mass detection for the pragmatistFrankly, I’ve been waiting for many years for a mass detector like the ACQUITY QDa. In fact, I openly asked several vendors, “Could you please make something smaller, cheaper and easier to use?” For our application, we simply don’t need all the capability of advanced MS systems, so I was very pleased when the QDa detector came onto the market. Almost immediately, we tested its capability, found that it met our needs and invested.
Importantly, the ACQUITY QDa is capable of doing an auto calibration and automatedresolutionverification;at thepush of a button, the instrument is quickly up and running, and we are assured of data reproducibility. That’s a major difference for the user – there are few parameters thatmustbedefined,whichmakesmassspectrometry much simpler. And if you need to train a new scientist, there is little training to be done. Chromatographers who may have been hesitant to use mass detection in the past should probably revisit the option.Werunthousandsofpurificationsand
analyses each month – all instruments are running24/7–somaintenanceisalwaysa key concern. We’re pushing everything to the limit; I guess we’re the perfect
test lab for instrument robustness tests! Fortunately, the ACQUITY QDa requires very little maintenance; there are very few parts that need to be changed – but, for those that do, the job is virtually foolproof. Acoupleofpragmaticpoints:first,the
ACQUITY QDa can run on a 110-volt supply(particularlyimportanthereintheUSA).Itmayseemlikeatrivialthingbut,with other systems, putting in additional higher voltage lines is another cost added to infrastructure. The QDa just plugs into a regular socket, which is very convenient. I’ll also add that it’s surprisingly quiet, which should not be taken so lightly – good laboratory design should always take the noise factor into account.
All of the above factors add up to one important reality: it’s very easy to build a business case for investing in ACQUITY QDa mass detection. Indeed, if the ACQUITY QDa had been available when wefirstbuiltourpurificationandanalyticalplatforms, I would have had no hesitation in using ACQUITY QDa systems throughout – perhaps a few with the high performance pump for added flexibility in terms ofsensitivity. For general applications, especially in small molecule analysis, the ACQUITY QDa is the mass detection instrument of the future.
I for one would welcome the approach that Waters has taken with the ACQUITY QDa for our whole platform. SFC has seen some serious breakthroughs in the last few years, several from Waters – and I hope they continue innovating in this area. Making all instrumentation robust, low maintenance, and more accessible to a wider group of users can only be a good thing when it comes to our kind of workflow.TheACQUITYQDaDetectoris a huge step forward in this regard and could well revolutionize analytical chemistry – and the use of MS – in many laboratories.
Gerard Rosse is Associate Director, Structure Guided Chemistry at Dart NeuroScience, San Diego, California, USA.
Mass Data Made Simple 15
“We run thousands of purifications and
analyses each month – all instruments are running 24/7 – so maintenance is always a key
concern.”

the
Analytical Scientist
I’ve been working at Lion as their analytical specialist for eight years, predominantly using and developing methods for the enviable task of analyzing beer. I have around 20 years of chromatography experience in several different fields,including food and pharma – and I’m pleased to say I still love analytical chemistry and chromatography; there’s always a sense of discovery as you tackle new challenges. You never quite know where the problem solving process might take you – but it’s exciting when you get there.
Lionhasaround6700employees inAustraliaandNewZealand,making itone of the largest food and beverage companies. There are essentially two parts to the business: “Dairy & Drinks” and “Beer, Spirits & Wine” – but beer production is a huge part of what we do. Many readers will be familiar with our XXXX beer and Tooheys brands, but we’ve also got a fast-growing craft beer portfolio(ledbyourJamesSquirebrand)and we also produce international beers, including Heineken, Guinness and Kirin under strict license agreements.
Mission Improbable: Rapid Total Sugar ReportingHow mass detection allows us to tell the beautiful truth about beer.
By Larissa Burns
Sponsored Supplement16
www.waters.com/qda
Sweet focusEach of our breweries has a laboratory for quality control analysis. I work in a centralized lab that focuses on supporting our brewery operations at a higher level, with a focus on spotting trends or gathering information across our portfolio. For example, we might perform projects that focus on calcium levels, cer tain hop compounds, or volatile aroma compounds. We’re also there to support the quality control (QC) labs if they detect a problemby troubleshooting to determine what might be going wrong in the brewing process.
Lately, we’ve been working on several projects that demand the quantitation of low levels of sugar. Sugar analysis isn’t something new to us – we monitor sugar levels at various early stages of the brewing process. However, Lion was also interested in monitoring fermentation profilestocompletion–andwewantedto introduce voluntary nutritional panels across our beer portfolio. The latter feeds into a larger education program
called “Beer the Beautiful Truth,” which aims to bust common myths about beer and communicate some analytically-supported evidence, including the fact that Lion’s beers contain, on average, less than 0.1 percent total sugar.
We were using electrochemical detection to measure the relatively high levelsofsugar inwort(theliquidextracted fromthemashingprocess),but when it came to beer quantitation, it was much more challenging because of the inherently low sugar levels. Our runtimes were long, we were struggling with sensitivity, and there were some interferences. It’s fair to say we were working at the limit, so it seemed the opportune time to seek out alternatives. The Waters ACQUITY UPLC H-Class with ACQUITY QDa mass detector was a combination that had a lot going for it – not least the fact that Waters demonstrated a cost-effective and robust proof of concept for our application. Another important factor in our decision to go with the ACQUITY QDa was the fact that it was easy to use – you switch it on, wait for it to complete its start-up cycle, and you’re ready to run samples. We were already familiar with Empower software, so that made the decision even easier. Working with a mass detector is much like working with any other detector – you set up your sample set, add your vials, and hit “go.” When you come back after the run, even the data processing is similar to what you’d expect with something like a PDA detector. Our method makes things slightly more complicated, because we’re monitoring six sugars at four different ion masses, so we need four channels. But we found pretty quickly that it’s really not that different to running an LC system with one channel.
ConfidenceinthebeautifultruthEven though beer is 90 percent water
andtypicallyaround5percentalcohol,it’s actually a pretty complex mixture; there are proteins, carbohydrates, sugars, hop compounds, esters, and so on – but all at low concentrations. Notably, the contract analytical food labs that we approached about sugar analysis in beer could not offer the repor ting l imit we were look ing for – they typically deal with higher concentrations(asfoundinotherfoods).So we had to develop our own method. The QDa mass detector is sensitive enough to work at the concentration levels of sugars we are interested in (LODisaround1–2µg/mL)butcrucially,by combining retention time and mass information, we are also now able to achieve greater selectivity.
In the nutritional project mentioned above, we needed to analyze around 1500samplesinjustacoupleofweeks– and it was quite a task. Put simply, we couldn’t have done it without the new system. With the old system, each injection would have taken 30 minutes, and we needed to get through 100 samples per day – sadly, there aren’t 50hours inaday...UpgradingtotheACQUITY UPLC and QDa as a package was fantastic – we got a double boost to our method. Each injection is around 5minutes,sowecouldrun100samplesovernight, doing the sample preparation and data processing during the day. Ultimately, that means getting through our work much faster. And because we were able to combine mass information with retention times, we were a lot moreconfident intheresults thatwegenerated. It’s great to have the power of mass data in our lab without the usual headaches – or the need for a mass spectrometrist!
“Because we were able to combine mass information
with retention times, we were a lot more confident in the results that we generated.”
Mass Data Made Simple 17

the
Analytical Scientist
METHODS DEVELOPMENT WORKFLOWS POTENTIAL ISSUES DURING METHOD DEVELOPMENT
CHALLENGES OR INEFFICIENCIES WITHOUT MASS DETECTION IMPROVED WORKFLOW WITH MASS DETECTION
UVspectraaloneareoftensufficientto identify a peak. However it can be challenging or impossible to identify a peak using UV spectra alone when:-- An analyte is non-chromophoric
- Two analytes have very similar UV absorbance(exampleabove)
Delays in the development of a method through reliance on:
"Repeat injections of individual standardsforpeakidentification"Availability of traditional MS resourceforpeakidentification
The Mass Analysis window in Empower 3 combines UV and mass data together in the same view. Peaks in the UV trace are annotated with mass informationtoproviderapididentificationandconfidence.Theorthogonal
massdetectordataenablestheidentificationofnon-chromophoricanalytes and provides further selectivity where UV spectra are
inconclusive.
Peak homogeneity can be evaluated using UV spectra alone, however, the presence of non-chromophoric peak
co-elutions or co-elutions with extreme concentration differences can result in peaks being incorrectly
considered homogeneous. In addition “summed” spectra from co-elutingpeaksmaynotalwaysflag
the peak homogeneity.
Delays in the development of a method through reliance on:
"Injection of individual standards to evaluate peak co-elutions/homogeneity "Availability of traditional MS resourceforconfirmation
Complementarymassspectrausedinpeakpurityassessmentcan:(1)immediatelyconfirmanon-chromophoriccoelution,(2)confirmtheidentityofcoelutinganalytewhere“summed”UVspectraisinconclusive,and(3)confirmthepresenceofacoelutionwhereextremeconcentration
differences mask the minor peak spectrum.
ThechallengesinPeakIdentificationand Peak Homogeneity, when relying
on UV spectra alone, can result in inefficientpeaktracking.Inaddition,solvatochromic effects, particularly
when changing pH, can lead to changes in the analyte UV spectra
resulting in further uncertainty.
Delays in the development of a method through reliance on:
"Repeat injections of individual standards to assist in peak tracking"Availability of traditional MS resourceforpeakidentification In addition to immediate visual certainty in the Mass Analysis Window,
Empower 3 FR3 introduces further peak tracking functionality. It is possible totrackandreportpeaksusingthenewAssignedMassfield,showinga
characteristic analyte mass tracked across experiments.
Pea
k Id
entifi
catio
n
P
eak
Hom
ogen
eity
Pea
k Tr
acki
ng
Final Method Selection using Empower Scoring Reports
OptimizationpH
Other Parameters
Gradient slope
Temperature
Define Criteria
Define System & Verify Performance
Option 1
Rapid Scouting• “Go to” LC column• Standard gradient• Low/HighpH
Option 2
Screening• 4-6 Columns• ACN & MeOH• Low/HighpH
Sponsored Supplement18

www.waters.com/qda
METHODS DEVELOPMENT WORKFLOWS POTENTIAL ISSUES DURING METHOD DEVELOPMENT
CHALLENGES OR INEFFICIENCIES WITHOUT MASS DETECTION IMPROVED WORKFLOW WITH MASS DETECTION
UVspectraaloneareoftensufficientto identify a peak. However it can be challenging or impossible to identify a peak using UV spectra alone when:-- An analyte is non-chromophoric
- Two analytes have very similar UV absorbance(exampleabove)
Delays in the development of a method through reliance on:
"Repeat injections of individual standardsforpeakidentification"Availability of traditional MS resourceforpeakidentification
The Mass Analysis window in Empower 3 combines UV and mass data together in the same view. Peaks in the UV trace are annotated with mass informationtoproviderapididentificationandconfidence.Theorthogonal
massdetectordataenablestheidentificationofnon-chromophoricanalytes and provides further selectivity where UV spectra are
inconclusive.
Peak homogeneity can be evaluated using UV spectra alone, however, the presence of non-chromophoric peak
co-elutions or co-elutions with extreme concentration differences can result in peaks being incorrectly
considered homogeneous. In addition “summed” spectra from co-elutingpeaksmaynotalwaysflag
the peak homogeneity.
Delays in the development of a method through reliance on:
"Injection of individual standards to evaluate peak co-elutions/homogeneity "Availability of traditional MS resourceforconfirmation
Complementarymassspectrausedinpeakpurityassessmentcan:(1)immediatelyconfirmanon-chromophoriccoelution,(2)confirmtheidentityofcoelutinganalytewhere“summed”UVspectraisinconclusive,and(3)confirmthepresenceofacoelutionwhereextremeconcentration
differences mask the minor peak spectrum.
ThechallengesinPeakIdentificationand Peak Homogeneity, when relying
on UV spectra alone, can result in inefficientpeaktracking.Inaddition,solvatochromic effects, particularly
when changing pH, can lead to changes in the analyte UV spectra
resulting in further uncertainty.
Delays in the development of a method through reliance on:
"Repeat injections of individual standards to assist in peak tracking"Availability of traditional MS resourceforpeakidentification In addition to immediate visual certainty in the Mass Analysis Window,
Empower 3 FR3 introduces further peak tracking functionality. It is possible totrackandreportpeaksusingthenewAssignedMassfield,showinga
characteristic analyte mass tracked across experiments.
Mass Data Made Simple 19
Risk
s of
rele
asin
g a
met
hod
that
incl
udes
an
unde
tect
ed o
r unr
esol
ved
anal
yte
Regu
lato
ry ri
sks
Red
evel
opm
ent o
f the
met
hod
D
elay
in p
rodu
ct re
leas
e
Met
hod
rele
ased
soo
ner a
nd w
ith c
onfid
ence
!Retention Time Summarized by Assigned Mass
pH 182 (min)
196 (min)
202 (min)
224 (min)
258(min)
286 (min)
300 (min)
316 (min)
342 (min)
1 pH = 3.0 2.141 2.695 3.265 4.011 1.783 2.902 2.371 2.216
2 pH = 4.0 2.415 0.813 2.149 3.275 4.021 2.190 2.474 2.697 2.556

the
Analytical Scientist
Increasing Specificity and Sensitivity in Routine Peptide Analyses Using Mass Detection with the ACQUITY QDa DetectorBy Robert E. Birdsall and Sean M. McCarthy, Waters Corporation.
Peptide analyses are frequently used during protein-based biotherapeutics development, to assess critical quality attributes(CQAs)ofcandidatemolecules(1, 2). Throughout the developmentprocess, many optical based assays, often developed from mass spectrometric based characterization, are used to assess product identity, purity, and monitor CQAs. While optical detection provides a level of assurance, often there is a need to add an orthogonal detection technique, such as mass detection, to improve specificity, expand detectionlimits,andincreaseconfidenceaboutpeakhomogeneity(3).TheACQUITYQDaDetector provides a simple and cost-effective solution for the acquisition of optical and MS-based data, for increased specificityinroutinepeptidemonitoringassays associated with monoclonal antibodies(mAbs),whilestrengtheningconf idence in the biotherapeutic production environment.
ExperimentalAn ACQUITY UPLC Peptide CSH Column was conditioned as outlined by the column care and use manual.
Chemical reagents were purchased from Sigma Aldrich and used as received. SequencegrademodifiedtrypsinfromPromega was used to prepare a digest of trastuzumab(reducedandalkylated)ataconcentrationof0.5mg/mL,asoutlinedby the manufacturers’ protocol.
ACQUITY QDa Detector settingsSamplerate:2points/secMassrange:350–1250DaCone voltage: 10 VCapillaryvoltage:1.5kVProbetemperature:500°C
Results and DiscussionOptical based assays are often used in the biotherapeutic production environment to assess CQAs that impact product efficacyandsafety.Forbiotherapeutics,such as mAbs, monitoring peptides that contain complementary determining region(CDR)sequencesarecritical inassuring product identity, and to ensure safety standards (4,5).Opticalbased
techniques that are easily deployed and universally accessible across sites are often used in the development of peptidemapprofileassays.
A s s h o w n i n F i g u r e 1A , a chromatographic region containing critical peptidessuchastheCDRpeptide(L3)anditsassociateddeamidatedform(L3D)are eluting with non-related neighboring peptides (5).These factors, combinedwith baseline noise associated with the use of formic acid, raise the possibility of peak heterogeneity, which can impact the accurate assessment of CQAs. Optimizationofsuchpeptidemapprofilesmay require an iterative process where parameters such as gradient, column, temperature, solvent, and ion-pairing agents are systematically changed and evaluated to produce robust separations and ensure peak homogeneity.
With the addition of the ACQUITY QDaDetectorintoexistingworkflows,accurate assessment of CQAs can be made with minimal impact on
Applicat ion Note 20
Figure 1. Peptide mapping with the ACQUITY QDa Detector. A peptide map of trastuzumab was acquired usingA)opticalandB)massspectraldetectorssimultaneously.UniquemassesidentifiedfromthemassspectracollectedforeachpeakwereusedtogenerateanXIC,confirmingmultiplespecieswereco-elutinginthe chromatographic region containing the CDR peptide L3 and its deamidated form L3D.

www.waters.com/qda
productivity, or the need to modify chromatographic methods.
Using the Empower CDS Software, opticaldata(Figure1A)wasanalyzedtogenerate an extracted ion chromatogram (XIC) profile (Figure 1B) using massspectral information acquired with the ACQUITY QDa Detector. From the XIC profile,multiplespecieswereconfirmedto be coeluting with the critical pair of interest, demonstrating the ACQUITY QDa Detector’s ability to enable rapid assessment of peak homogeneity through the addition of mass detection.Difficultseparationsthatcontainpartial
or perfectly coeluting peptide species can require extensive optimization and often result in marginal improvements inseparationefficiencyandsubsequentquantification. The ACQUITY QDaDetector features the ability to perform
Single-Ion-Recording(SIR)formaximumspecificityandsensitivityinroutineassayssuchaspeptidemappingprofiles.
For peptides with characterized elution times, such as the L3 peptide species containing a critical CDR sequence, timed SIR events can be entered under the advanced option through the instrument method setup screen within the instrument method. As shown in Figure 2A, two timed SIR events were programmed to acquire the +2 and +3 charge state for the non-deamidated (L3),andmaindeamidated(L3D)formof the L3 peptide species.
Through the use of SIRs, only ions exhibiting the mass of interest are recorded as shown in Figure 3B, resulting in two chromatograms that exhibit high signaltonoiseratio(SNR),andarefreeof co-eluting species (Figure 1) that
could otherwise impact the accuracy of quantification, when using optical based techniques.
ConclusionDeveloping efficientmethods for theaccurate assessment of CQAs that impactproductefficacyandsafetyarehighly desirable in the biopharmaceutical production environment. This study has demonstrated orthogonal detection techniques, such as mass detection, can bereadilyadaptedtoexistingworkflowsforincreasedspecificityandsensitivityinroutine monitoring assays.
The ACQUITY QDa Detector in conjunction with Empower 3 CDS Software affords a means for cost-effective mass detection, with increased productivity, and confidence in thedevelopment and analysis of routine monitoring assays.
For full experiment set up and more information, download the full application note: www.waters.com/720005377
References
1. A Rathore and H Winkle, “Quality by design
for biopharmaceuticals”, Nat Biotechnol, 27(1),
26–34 (2009).
2. A Goetze, M Schenauer, and G Flynn,
“Assessing monoclonal antibody product
quality attribute criticality through clinical
studies”, mAbs, 2(5), 500–507 (2010).
3. R Birdsall, E Cosgrave, and S McCarthy,
“Adding mass detection to routine peptide-
level biotherapeutic analyses with the
ACQUITY QDa Detector”, Waters Applicaton
Note (2015). p/n 720005266EN.
4. J Vlasak et al, “Identification and
characterization of asparagine deamidation in
the light chain CDR1 of a humanized IgG1
antibody”, Anal Biochem, 392(2), 14–54
(2009).
5. R Harris et al, “Identification of multiple
sources of charge heterogeneity in a
recombinant antibody”, J Chromatogr B
Biomed Sci Appl, 752(2), 233–45 (2001).
Figure2.SIRwiththeACQUITYQDaDetector.A)TimedSIRswereprogrammedtoacquirenon-deamidated(m/z664.73,m/z996.59)anddeamidated(m/z665.05,m/z997.08)massesfrom30.00–36.50minand36.50–43.00min,respectivelyfortheL3peptidecontainingaCDRsequence(underlined).B)Resultingionchromatogramsforeachspeciesweresummedusingaderivedchannelandplottedwithay-axisoffsetof3x106(non-deamidatedform)and5x106(deamidatedform)tocontrastthe two unique data channels.
Applicat ion Note 21

the
Analytical Scientist
Seamless Integration of Mass Detection into the UV Chromatographic WorkflowBy Paula Hong, John Van Antwerp, and Patricia McConville, Waters Corporation.
Aliquidchromatography(LC)systemthatincludesanultraviolet(UV)detectorserves as the chromatographer’s traditional method development tool. Incorporating mass detection capabilities enhances the analyticalrangeandefficacyofsuchsystems.Specifically,itprovidesthechromatographerwith additional analytical capabilities, including the detection of analytes that give no UV response; identifying non-homogeneous or coeluting peaks; providing information to help identify a novel or unknown sample component; and tracking peaks.
In the past, setting up and verifying the performance of quadrupole instruments before acquiring mass data required significantexpertise.Thisprocessincludesmultiple steps such as calibration and tuning the detector for a specific analyte andchromatographic conditions. Consequently, for analysts new to mass spectrometry, such aprocesscanpresentasignificantchallenge.
In recent years, instrument developers have invested heavily in improving the reliability and ease of use of mass spectrometry hardware, and many of these improvements have lead to increased system stability and more robust equipment. Automation of the hardware and acquisition software has also been an area of focus. These technological advances have given rise to mass detectors that are as intuitive to operate as UV detectors, and capable of
generating high-quality mass-spectral data (1).Thiswhitepaperwilldescribeintegratingone such mass detector, the ACQUITY QDa Detector, with chromatography data software(CDS),Empower3Software,intotheUVchromatographicworkflow.
Automated startupMassdetectionprovidesmanybenefitstoUV liquid chromatographic separations, from providing an orthogonal mode of detection to streamlining method development. Yet mass spectrometers typically require a start-up procedure that is manual and can be time-consuming. However, with the ACQUITY QDa Detector, startup is fully automated. Operating the system from a cold start requires simply turning it on. The instrument’s automated startup tests include a source pressure test, critical read-back checks, and calibration and resolution verification–alloccurringwithinminutesof startup. The calibration and resolution verificationtestsuseaninternalcalibrant,which eliminates the need for separate sample preparation. If a calibration check is required, the analyst can select it from a drop-down menu. Once run, the calibration check automatically generates a
report that evaluates the results and applies the new data as an updated calibration.Empower3Softwaresimplifiesadding
mass detection to a chromatography project even further. For example, analysts wishing to collect mass detection create the appropriate system in the software, and select the appropriate detection techniques intheproject.Likephotodiode-array(PDA)detection, mass detection is included in the software as a project option and is incorporated into the instrument method.
Acquiring mass spectral data with minimal adjustments ForMSquantificationstudies,optimizingthe various MS detection parameters is often necessary. This process, which can include adjusting parameter settings that affect ionization, can prove time-consuming and challenging. If the parameters are not chosen carefully, the response of the analytes can be negatively affected. With the advancements in mass detection hardware and software, the ACQUITY QDa Detector requires adjustment of far fewerparameters.Defininganinstrumentmethodrequiresselectingafunction(full-scan or selected ion recording (SIR))and a mass range or value. The default
White Paper 22
Figure 1. Empower 3 Software provides a view of mass and UV chromatograms and spectra. The UV chromatogram can be labeled with most intense ion at the peak apex. This view provides the tools for streamlinedpeaktrackingandidentificationofcoelutingpeaks.

www.waters.com/qda
settings provide quality data for a range of compounds. If adjustment is necessary, a few key parameter settings, each relating toaspecificchromatographicproperty,are adjustable. For example, the probe temperaturerelatesmostlytoflowrateand mobile phase composition. The capillary voltage relatesmostly toflowrate. The cone voltage is truly sample-specific,andthedatarateisdefinedbychromatographic peak width and the “range” of the MS data to be acquired.
Comprehensive mass and UV spectral data reviewHistorically, integrating mass-spectral data intotheworkflowofachromatographerperforming UV analysis has proven challenging. Both sets of data can contain individual chromatographic and spectral windows. Processing and reviewing the results of studies is, therefore, often cumbrous, requiring evaluation of UV and mass-spectral data individually. By providing a single window for reviewing mass and UV information simultaneously (Figure1),Empower3Softwaresimplifiesdata evaluation.
The chromatographic display appearing in the lower portion of the window includes both the UV chromatogram and mass data– a total-ion chromatogram (TIC)and in its bottom trace an extracted-ion chromatogram(XIC)fortheseparation.
Automatically generated, the XIC is an overlay of the extracted-ion chromatograms corresponding to the apex base peak extracted from the TIC for each integrated UVpeak(Figure2).
The spectral information for each peak appears in the upper portion of the screen. It shows the UV and mass spectra. To help identify possible coelutions, these spectra can be displayed as three separate views:
1. thebasepeakatapex(Figure1);2. a combined view that shows the apex
and(average)combinedspectra;3. a purity view, which displays the
leading, apex, and trailing segments ofapeak(Figure2).Thiscombinedview is assembled automatically accordingtospecificationsintheprocessing method.
ConclusionsAnalytes that lack a UV-detectable chromophore require a means of orthogonal detection such as mass detection. Until recently, incorporating mass detection as part of the UV chromatographicworkflowhasrequiredMS method development and instrument expertise. Also, reviewing chromatographic and spectral data for both detectors has traditionally meant viewing each set of data separately, making data evaluation burdensome. Utilizing an intuitive,
automated mass detector, such as the ACQUITY QDa Detector, controlled by a compliant-ready data system like Empower 3Softwareprovidesthesebenefits:
• Simpleon/offcapabilityofthe mass detector, reducing startup time and enabling data acquisition within minutes.
• Using an “intelligent” CDS system, mass detection can be integrated as partoftheworkflowbyselectingtheappropriate instrument modules and detection capability from among the project properties.
• Automated startup and instrument checksprovidegreaterconfidencein results.
• Reviewing both chromatographic and spectral results from UV and mass detectors in a single window enables efficient,peak-by-peakdatareview.
• The ability of mass detection to identify coeluting peaks provides additional information.
With the addition of an automated mass detector that has been designed to be a synergistic element of a chromatographic system, analytical chemists performing UV chromatographic separations now havetheabilitytosignificantly increasetheir method development capabilities without the complexity of a traditional mass spectrometer.
To learn how easily results can be summarized as a report and for more information on how mass detection aids method development, please view the full version of this white paper: www.waters.com/720005054
Reference
1. P Hong and PR McConville, “Combining Mass and
UV Spectral Data with Empower 3 Software to
Streamline Peak Tracking and Coelution
Detection.” Application Note 720004846EN,
Waters Corporation (2014).
White Paper 23
Figure 2. For the analysis of an API and related impurities, UV detection alone indicates the presence of four analytes by the number of chromatographically separated peaks. The addition of mass detection suggests the presence of two coeluting analytes present in peak 4. Analysis of the leading, apex, and trailing segments of thepeakdemonstratevaryingionratiosofthetwomajorions,therebyconfirmingthecoelution.

www.theanalyticalscientist.com
A Sponsored Supplement from