Embed Size (px)
Citation preview
11
MarylandCivic HealthReport:A Look at Civic Engagement in Maryland and the U.S.
September 2021
1
Preferred Citation:Dietz, Nathan. 2021. “Maryland Civic Health Report: A Look at Civic Engagement in Maryland and the U.S.” Research Report: Do Good Institute, University of Maryland.
Acknowledgments
The Do Good Institute at the School of Public Policy provides hands-on learning experiences, immersive programs and events, research, and supportive resources to develop the next generation of nonprofit leaders, social innovators, and civic-minded students. Across campus, students engage in hands-on, project-based, and research-focused social impact, philanthropy, and leadership courses, giving them needed skills to make a difference, taught by a growing group of respected scholars and accomplished practitioners. The Institute and its faculty engage in civic research to better understand and share the importance of volunteering, giving, and other community-based actions. To learn more, visit dogood.umd.edu.
This report is made possible by the work of many people, including the following faculty and staff at the University of Maryland, College Park.
• Nathan Dietz, author, senior researcher, Do Good Institute; research director, CivIC Maryland
• Bob Grimm, director, Do Good Institute; Levenson Family Chair in Philanthropy and Nonprofit Leadership
• Kaitlin Ahmad, communications manager, Do Good Institute
• Paul Brown, director, CivIC Maryland, School of Public Policy
• Mike Hanmer, professor of government and politics and research director, Center for Democracy and Civic
Engagement, College of Behavioral and Social Sciences
• Stella Rouse, professor and director, Center for Democracy and Civic Engagement, College of Behavioral and
Social Sciences
A special thank you to:
• The Civic Innovation Center for their support in the production and release of this report.
• The National Conference on Citizenship, where preliminary results from this report were presented at their annual meeting in November 2019.
Produced By
1
For more than two hundred years, widespread participation in civic affairs has been a defining characteristic of American society. In the late 1990s, however, scholars such as Robert Putnam (in Bowling Alone) began to warn us about the decline in social engagement and involvement with groups and associations. According to Putnam, this decline in participation in social and civic life threaten the health and resiliency of American society by reducing social capital – that is, by weakening the social ties that encourage us to do things for and with each other.
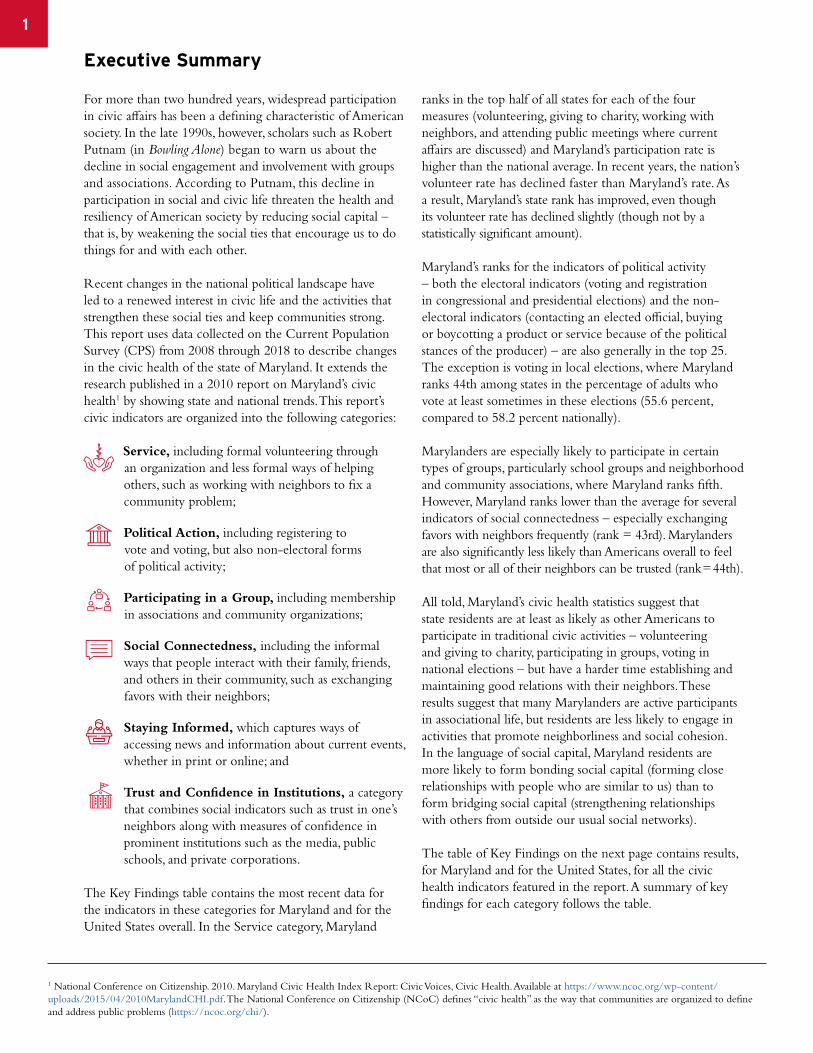
Recent changes in the national political landscape have led to a renewed interest in civic life and the activities that strengthen these social ties and keep communities strong. This report uses data collected on the Current Population Survey (CPS) from 2008 through 2018 to describe changes in the civic health of the state of Maryland. It extends the research published in a 2010 report on Maryland’s civic health1 by showing state and national trends. This report’s civic indicators are organized into the following categories:
Service, including formal volunteering through an organization and less formal ways of helping
others, such as working with neighbors to fix a community problem;
Political Action, including registering to vote and voting, but also non-electoral forms of political activity;
Participating in a Group, including membership in associations and community organizations;
Social Connectedness, including the informal ways that people interact with their family, friends, and others in their community, such as exchanging
favors with their neighbors;
Staying Informed, which captures ways of accessing news and information about current events, whether in print or online; and
Trust and Confidence in Institutions, a category that combines social indicators such as trust in one’s
neighbors along with measures of confidence in prominent institutions such as the media, public
schools, and private corporations.
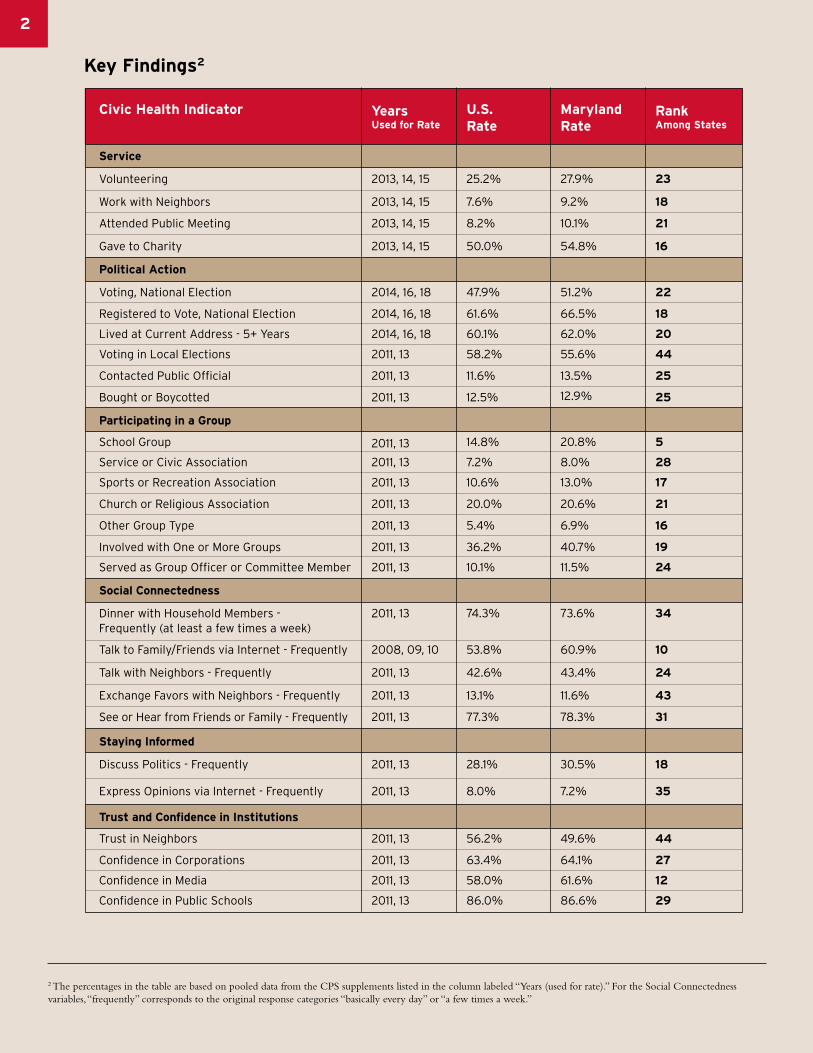
The Key Findings table contains the most recent data for the indicators in these categories for Maryland and for the United States overall. In the Service category, Maryland
ranks in the top half of all states for each of the four measures (volunteering, giving to charity, working with neighbors, and attending public meetings where current affairs are discussed) and Maryland’s participation rate is higher than the national average. In recent years, the nation’s volunteer rate has declined faster than Maryland’s rate. As a result, Maryland’s state rank has improved, even though its volunteer rate has declined slightly (though not by a statistically significant amount).
Maryland’s ranks for the indicators of political activity – both the electoral indicators (voting and registration in congressional and presidential elections) and the non-electoral indicators (contacting an elected official, buying or boycotting a product or service because of the political stances of the producer) – are also generally in the top 25. The exception is voting in local elections, where Maryland ranks 44th among states in the percentage of adults who vote at least sometimes in these elections (55.6 percent, compared to 58.2 percent nationally).
Marylanders are especially likely to participate in certaintypes of groups, particularly school groups and neighborhood and community associations, where Maryland ranks fifth. However, Maryland ranks lower than the average for several indicators of social connectedness – especially exchanging favors with neighbors frequently (rank = 43rd). Marylanders are also significantly less likely than Americans overall to feel that most or all of their neighbors can be trusted (rank =44th).
All told, Maryland’s civic health statistics suggest that state residents are at least as likely as other Americans to participate in traditional civic activities – volunteering and giving to charity, participating in groups, voting in national elections – but have a harder time establishing and maintaining good relations with their neighbors. These results suggest that many Marylanders are active participants in associational life, but residents are less likely to engage in activities that promote neighborliness and social cohesion. In the language of social capital, Maryland residents are more likely to form bonding social capital (forming close relationships with people who are similar to us) than to form bridging social capital (strengthening relationships with others from outside our usual social networks).
The table of Key Findings on the next page contains results, for Maryland and for the United States, for all the civic health indicators featured in the report. A summary of key findings for each category follows the table.
1
Executive Summary
1 National Conference on Citizenship. 2010. Maryland Civic Health Index Report: Civic Voices, Civic Health. Available at https://www.ncoc.org/wp-content/uploads/2015/04/2010MarylandCHI.pdf. The National Conference on Citizenship (NCoC) defines “civic health” as the way that communities are organized to define and address public problems (https://ncoc.org/chi/).
1
Key Findings2
Civic Health Indicator
Service
Volunteering
Work with Neighbors
Attended Public Meeting
Gave to Charity
Political Action
Voting, National Election
Registered to Vote, National Election
Lived at Current Address - 5+ Years
Voting in Local Elections
Contacted Public Official
Bought or Boycotted
Participating in a Group
School Group
Service or Civic Association
Sports or Recreation Association
Church or Religious Association
Other Group Type
Involved with One or More Groups
Served as Group Officer or Committee Member
Social Connectedness
Dinner with Household Members -Frequently (at least a few times a week)
Talk to Family/Friends via Internet - Frequently
Talk with Neighbors - Frequently
Exchange Favors with Neighbors - Frequently
See or Hear from Friends or Family - Frequently
Staying Informed
Discuss Politics - Frequently
Express Opinions via Internet - Frequently
Trust and Confidence in Institutions
Trust in Neighbors
Confidence in Corporations
Confidence in Media
Confidence in Public Schools
2013, 14, 15
2013, 14, 15
2013, 14, 15
2013, 14, 15
2014, 16, 18
2014, 16, 18
2014, 16, 18
2011, 13
2011, 13
2011, 13
2011, 13
2011, 13
2011, 13
2011, 13
2011, 13
2011, 13
2011, 13
2011, 13
2008, 09, 10
2011, 13
2011, 13
2011, 13
2011, 13
2011, 13
2011, 13
2011, 13
2011, 13
2011, 13
25.2%
7.6%
8.2%
50.0%
47.9%
61.6%
60.1%
58.2%
11.6%
12.5%
14.8%
7.2%
10.6%
20.0%
5.4%
36.2%
10.1%
74.3%
53.8%
42.6%
13.1%
77.3%
28.1%
8.0%
56.2%
63.4%
58.0%
86.0%
27.9%
9.2%
10.1%
54.8%
51.2%
66.5%
62.0%
55.6%
13.5%
12.9%
20.8%
8.0%
13.0%
20.6%
6.9%
40.7%
11.5%
73.6%
60.9%
43.4%
11.6%
78.3%
30.5%
7.2%
49.6%
64.1%
61.6%
86.6%
23
18
21
16
22
18
20
44
25
25
5
28
17
21
16
19
24
34
10
24
43
31
18
35
44
27
12
29
YearsUsed for Rate
U.S.Rate
MarylandRate
RankAmong States
2 The percentages in the table are based on pooled data from the CPS supplements listed in the column labeled “Years (used for rate).” For the Social Connectedness variables, “frequently” corresponds to the original response categories “basically every day” or “a few times a week.”
2
1
3
3 All indicators in the Service category are calculated for those age 16 and over, because 16 is the age at which most Americans can work full-time for pay without permission from their parents. See the Appendix for more details about the population used to calculate the statistics in the other categories.
Service
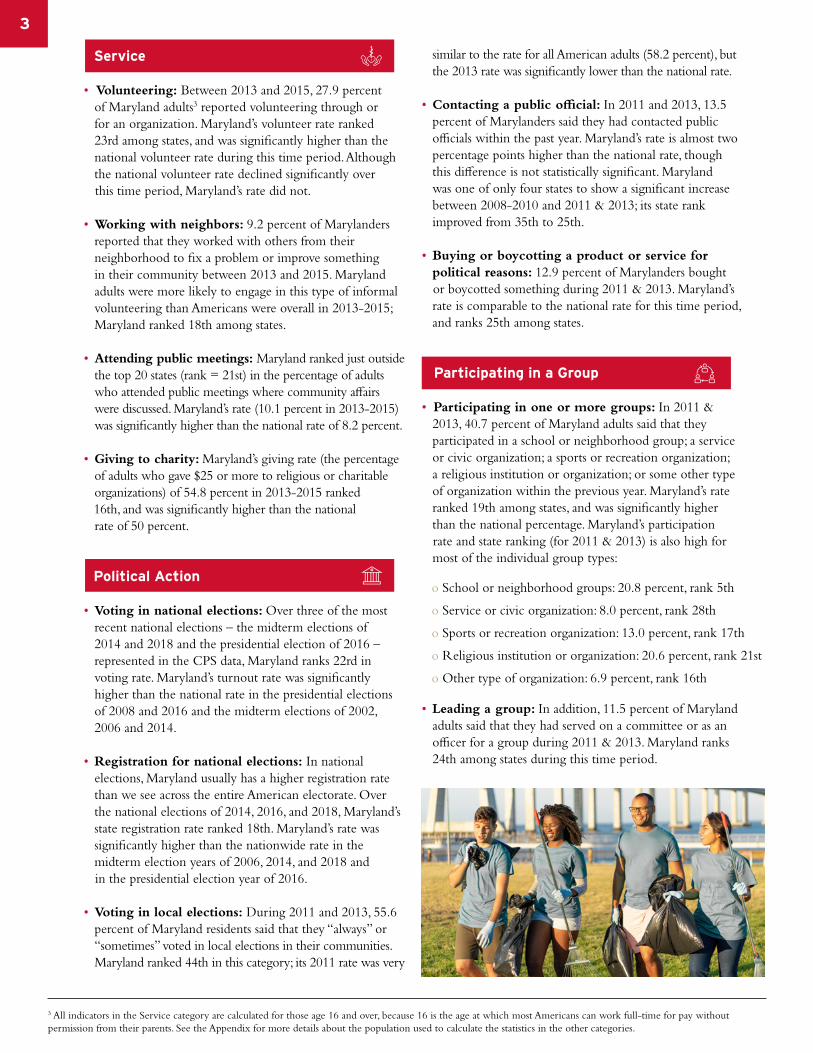
• Volunteering: Between 2013 and 2015, 27.9 percent of Maryland adults3 reported volunteering through or for an organization. Maryland’s volunteer rate ranked 23rd among states, and was significantly higher than the national volunteer rate during this time period. Although the national volunteer rate declined significantly over
this time period, Maryland’s rate did not.
• Working with neighbors: 9.2 percent of Marylanders reported that they worked with others from their neighborhood to fix a problem or improve something in their community between 2013 and 2015. Maryland adults were more likely to engage in this type of informal volunteering than Americans were overall in 2013-2015; Maryland ranked 18th among states.
• Attending public meetings: Maryland ranked just outside the top 20 states (rank = 21st) in the percentage of adults who attended public meetings where community affairs were discussed. Maryland’s rate (10.1 percent in 2013-2015) was significantly higher than the national rate of 8.2 percent.
• Giving to charity: Maryland’s giving rate (the percentage of adults who gave $25 or more to religious or charitable organizations) of 54.8 percent in 2013-2015 ranked
16th, and was significantly higher than the national rate of 50 percent.
Political Action
• Voting in national elections: Over three of the most recent national elections – the midterm elections of 2014 and 2018 and the presidential election of 2016 – represented in the CPS data, Maryland ranks 22rd in voting rate. Maryland’s turnout rate was significantly higher than the national rate in the presidential elections of 2008 and 2016 and the midterm elections of 2002, 2006 and 2014.
• Registration for national elections: In national elections, Maryland usually has a higher registration rate than we see across the entire American electorate. Over the national elections of 2014, 2016, and 2018, Maryland’s state registration rate ranked 18th. Maryland’s rate was significantly higher than the nationwide rate in the midterm election years of 2006, 2014, and 2018 and
in the presidential election year of 2016.
• Voting in local elections: During 2011 and 2013, 55.6 percent of Maryland residents said that they “always” or “sometimes” voted in local elections in their communities. Maryland ranked 44th in this category; its 2011 rate was very
similar to the rate for all American adults (58.2 percent), but the 2013 rate was significantly lower than the national rate.
• Contacting a public official: In 2011 and 2013, 13.5 percent of Marylanders said they had contacted public officials within the past year. Maryland’s rate is almost two percentage points higher than the national rate, though this difference is not statistically significant. Maryland was one of only four states to show a significant increase between 2008-2010 and 2011 & 2013; its state rank improved from 35th to 25th.
• Buying or boycotting a product or service for political reasons: 12.9 percent of Marylanders bought
or boycotted something during 2011 & 2013. Maryland’s rate is comparable to the national rate for this time period, and ranks 25th among states.
Participating in a Group
• Participating in one or more groups: In 2011 & 2013, 40.7 percent of Maryland adults said that they participated in a school or neighborhood group; a service or civic organization; a sports or recreation organization; a religious institution or organization; or some other type of organization within the previous year. Maryland’s rate ranked 19th among states, and was significantly higher than the national percentage. Maryland’s participation
rate and state ranking (for 2011 & 2013) is also high for most of the individual group types:
• Leading a group: In addition, 11.5 percent of Maryland adults said that they had served on a committee or as an officer for a group during 2011 & 2013. Maryland ranks 24th among states during this time period.
o School or neighborhood groups: 20.8 percent, rank 5th
o Service or civic organization: 8.0 percent, rank 28th
o Sports or recreation organization: 13.0 percent, rank 17th
o Religious institution or organization: 20.6 percent, rank 21st
o Other type of organization: 6.9 percent, rank 16th
3
14
Social Connectedness
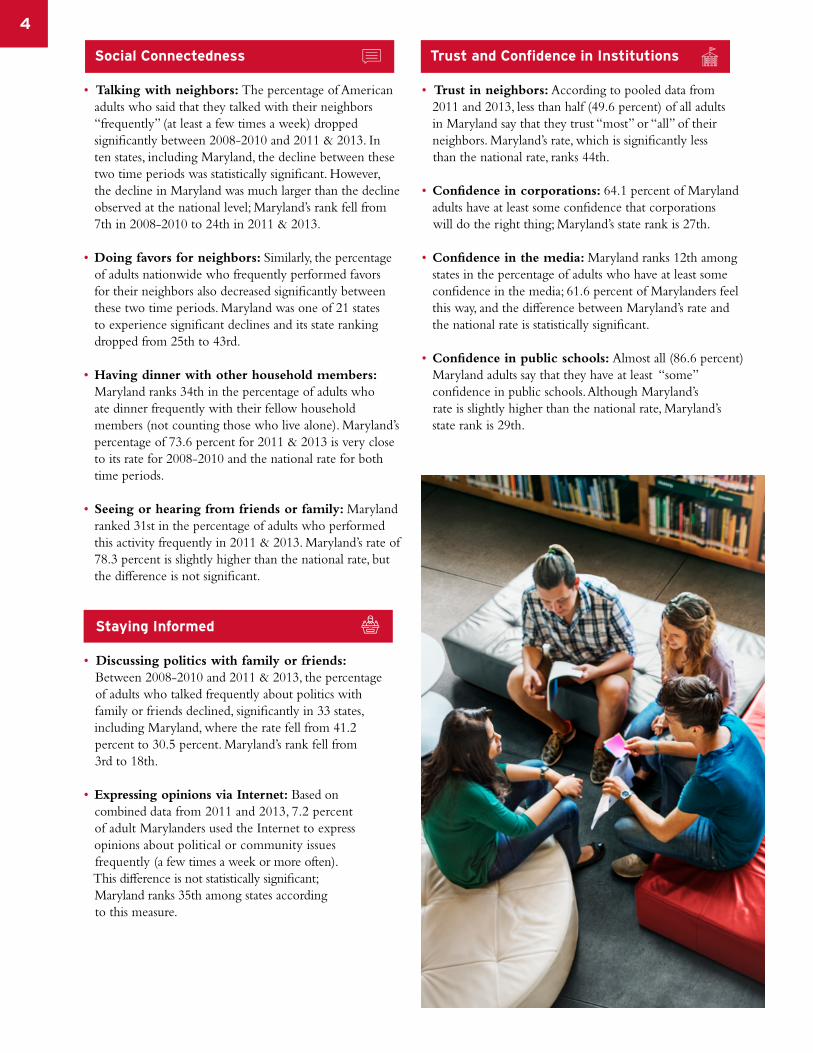
• Talking with neighbors: The percentage of American adults who said that they talked with their neighbors “frequently” (at least a few times a week) dropped significantly between 2008-2010 and 2011 & 2013. In ten states, including Maryland, the decline between these two time periods was statistically significant. However, the decline in Maryland was much larger than the decline observed at the national level; Maryland’s rank fell from 7th in 2008-2010 to 24th in 2011 & 2013.
• Doing favors for neighbors: Similarly, the percentage of adults nationwide who frequently performed favors for their neighbors also decreased significantly between these two time periods. Maryland was one of 21 states to experience significant declines and its state ranking dropped from 25th to 43rd.
• Having dinner with other household members: Maryland ranks 34th in the percentage of adults who ate dinner frequently with their fellow household members (not counting those who live alone). Maryland’s percentage of 73.6 percent for 2011 & 2013 is very close to its rate for 2008-2010 and the national rate for both time periods.
• Seeing or hearing from friends or family: Maryland ranked 31st in the percentage of adults who performed this activity frequently in 2011 & 2013. Maryland’s rate of 78.3 percent is slightly higher than the national rate, but the difference is not significant.
Staying Informed
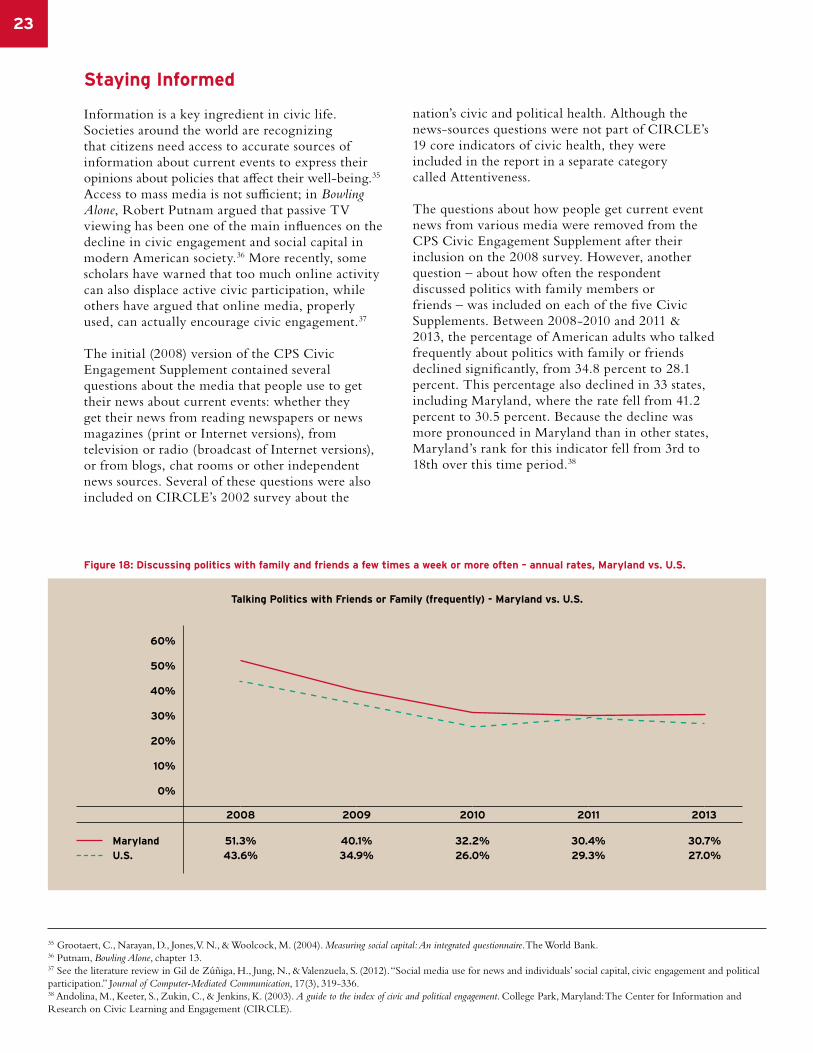
• Discussing politics with family or friends: Between 2008-2010 and 2011 & 2013, the percentage of adults who talked frequently about politics with family or friends declined, significantly in 33 states,
including Maryland, where the rate fell from 41.2 percent to 30.5 percent. Maryland’s rank fell from 3rd to 18th.
• Expressing opinions via Internet: Based on combined data from 2011 and 2013, 7.2 percent of adult Marylanders used the Internet to express opinions about political or community issues frequently (a few times a week or more often). This difference is not statistically significant; Maryland ranks 35th among states according to this measure.
Trust and Confidence in Institutions
• Trust in neighbors: According to pooled data from 2011 and 2013, less than half (49.6 percent) of all adults in Maryland say that they trust “most” or “all” of their neighbors. Maryland’s rate, which is significantly less
than the national rate, ranks 44th.
• Confidence in corporations: 64.1 percent of Maryland adults have at least some confidence that corporations
will do the right thing; Maryland’s state rank is 27th.
• Confidence in the media: Maryland ranks 12th among states in the percentage of adults who have at least some confidence in the media; 61.6 percent of Marylanders feel this way, and the difference between Maryland’s rate and the national rate is statistically significant.
• Confidence in public schools: Almost all (86.6 percent) Maryland adults say that they have at least “some” confidence in public schools. Although Maryland’s
rate is slightly higher than the national rate, Maryland’s state rank is 29th.
15
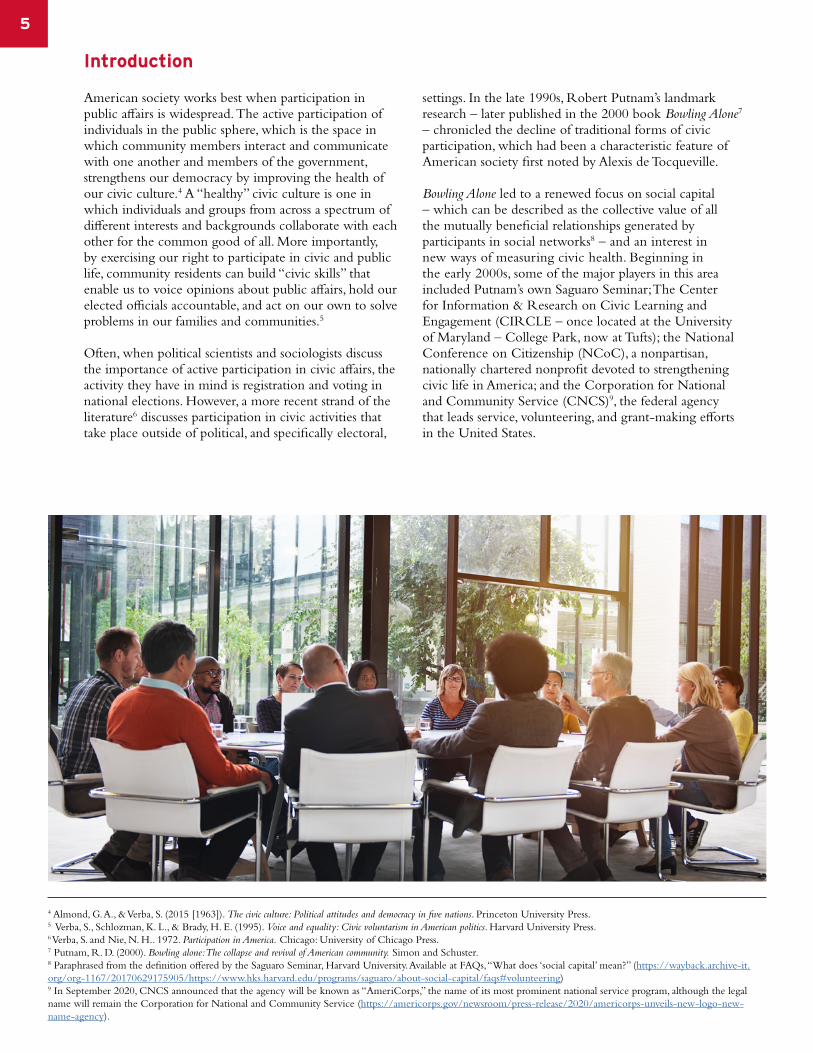
American society works best when participation in public affairs is widespread. The active participation of individuals in the public sphere, which is the space in which community members interact and communicate with one another and members of the government, strengthens our democracy by improving the health of our civic culture.4 A “healthy” civic culture is one in which individuals and groups from across a spectrum of different interests and backgrounds collaborate with each other for the common good of all. More importantly, by exercising our right to participate in civic and public life, community residents can build “civic skills” that enable us to voice opinions about public affairs, hold our elected officials accountable, and act on our own to solve problems in our families and communities.5
Often, when political scientists and sociologists discuss the importance of active participation in civic affairs, the activity they have in mind is registration and voting in national elections. However, a more recent strand of the literature6 discusses participation in civic activities that take place outside of political, and specifically electoral,
settings. In the late 1990s, Robert Putnam’s landmark research – later published in the 2000 book Bowling Alone7 – chronicled the decline of traditional forms of civic participation, which had been a characteristic feature of American society first noted by Alexis de Tocqueville.
Bowling Alone led to a renewed focus on social capital – which can be described as the collective value of all the mutually beneficial relationships generated by participants in social networks8 – and an interest in new ways of measuring civic health. Beginning in the early 2000s, some of the major players in this area included Putnam’s own Saguaro Seminar; The Center for Information & Research on Civic Learning and Engagement (CIRCLE – once located at the University of Maryland – College Park, now at Tufts); the National Conference on Citizenship (NCoC), a nonpartisan, nationally chartered nonprofit devoted to strengthening civic life in America; and the Corporation for National and Community Service (CNCS)9, the federal agency that leads service, volunteering, and grant-making efforts in the United States.
Introduction
4 Almond, G. A., & Verba, S. (2015 [1963]). The civic culture: Political attitudes and democracy in five nations. Princeton University Press.5 Verba, S., Schlozman, K. L., & Brady, H. E. (1995). Voice and equality: Civic voluntarism in American politics. Harvard University Press.6 Verba, S. and Nie, N. H.. 1972. Participation in America. Chicago: University of Chicago Press.7 Putnam, R. D. (2000). Bowling alone: The collapse and revival of American community. Simon and Schuster.8 Paraphrased from the definition offered by the Saguaro Seminar, Harvard University. Available at FAQs, “What does ‘social capital’ mean?” (https://wayback.archive-it.org/org-1167/20170629175905/https://www.hks.harvard.edu/programs/saguaro/about-social-capital/faqs#volunteering)9 In September 2020, CNCS announced that the agency will be known as “AmeriCorps,” the name of its most prominent national service program, although the legal name will remain the Corporation for National and Community Service (https://americorps.gov/newsroom/press-release/2020/americorps-unveils-new-logo-new-name-agency).
1
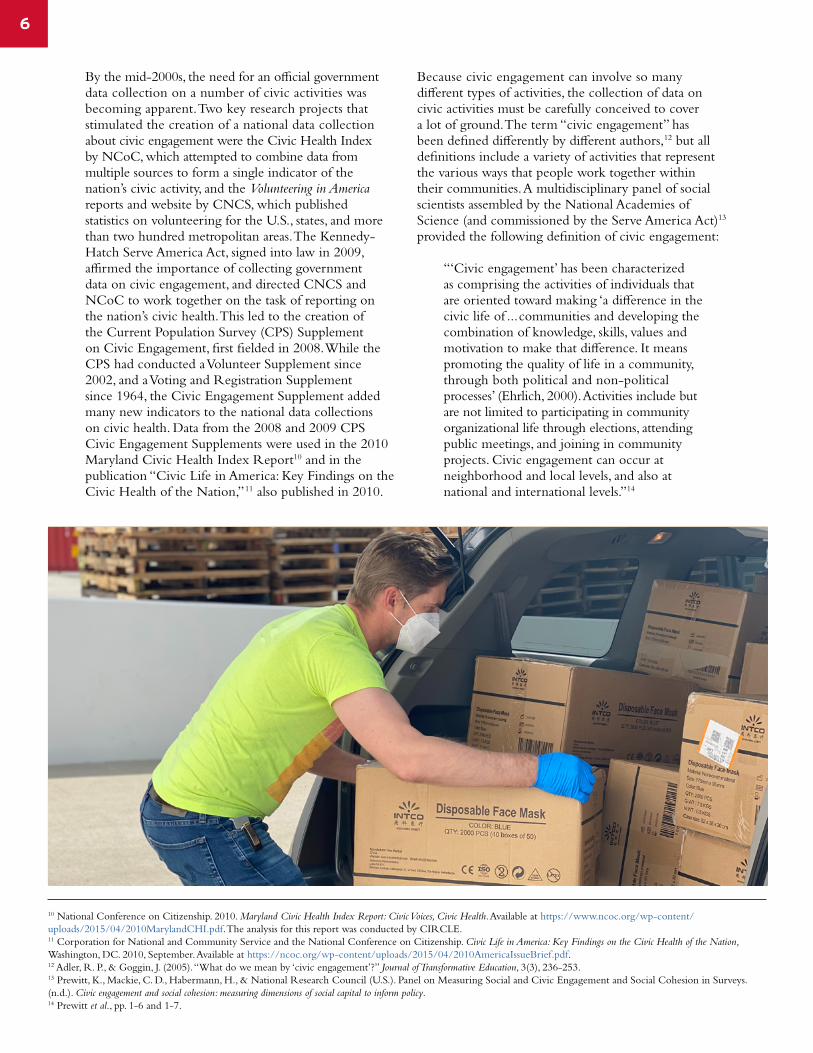
By the mid-2000s, the need for an official government data collection on a number of civic activities was becoming apparent. Two key research projects that stimulated the creation of a national data collection about civic engagement were the Civic Health Index by NCoC, which attempted to combine data from multiple sources to form a single indicator of the nation’s civic activity, and the Volunteering in America reports and website by CNCS, which published statistics on volunteering for the U.S., states, and more than two hundred metropolitan areas. The Kennedy-Hatch Serve America Act, signed into law in 2009, affirmed the importance of collecting government data on civic engagement, and directed CNCS and NCoC to work together on the task of reporting on the nation’s civic health. This led to the creation of the Current Population Survey (CPS) Supplement on Civic Engagement, first fielded in 2008. While the CPS had conducted a Volunteer Supplement since 2002, and a Voting and Registration Supplement since 1964, the Civic Engagement Supplement added many new indicators to the national data collections on civic health. Data from the 2008 and 2009 CPS Civic Engagement Supplements were used in the 2010 Maryland Civic Health Index Report10 and in the publication “Civic Life in America: Key Findings on the Civic Health of the Nation,”11 also published in 2010.
Because civic engagement can involve so many different types of activities, the collection of data on civic activities must be carefully conceived to cover a lot of ground. The term “civic engagement” has been defined differently by different authors,12 but all definitions include a variety of activities that represent the various ways that people work together within their communities. A multidisciplinary panel of social scientists assembled by the National Academies of Science (and commissioned by the Serve America Act)13 provided the following definition of civic engagement:
“‘Civic engagement’ has been characterized as comprising the activities of individuals that are oriented toward making ‘a difference in the civic life of ... communities and developing the combination of knowledge, skills, values and motivation to make that difference. It means promoting the quality of life in a community, through both political and non-political processes’ (Ehrlich, 2000). Activities include but are not limited to participating in community organizational life through elections, attending public meetings, and joining in community projects. Civic engagement can occur at neighborhood and local levels, and also at national and international levels.”14
6
10 National Conference on Citizenship. 2010. Maryland Civic Health Index Report: Civic Voices, Civic Health. Available at https://www.ncoc.org/wp-content/uploads/2015/04/2010MarylandCHI.pdf. The analysis for this report was conducted by CIRCLE.11 Corporation for National and Community Service and the National Conference on Citizenship. Civic Life in America: Key Findings on the Civic Health of the Nation, Washington, DC. 2010, September. Available at https://ncoc.org/wp-content/uploads/2015/04/2010AmericaIssueBrief.pdf. 12 Adler, R. P., & Goggin, J. (2005). “What do we mean by ‘civic engagement’?” Journal of Transformative Education, 3(3), 236-253.13 Prewitt, K., Mackie, C. D., Habermann, H., & National Research Council (U.S.). Panel on Measuring Social and Civic Engagement and Social Cohesion in Surveys. (n.d.). Civic engagement and social cohesion: measuring dimensions of social capital to inform policy.14 Prewitt et al., pp. 1-6 and 1-7.
1
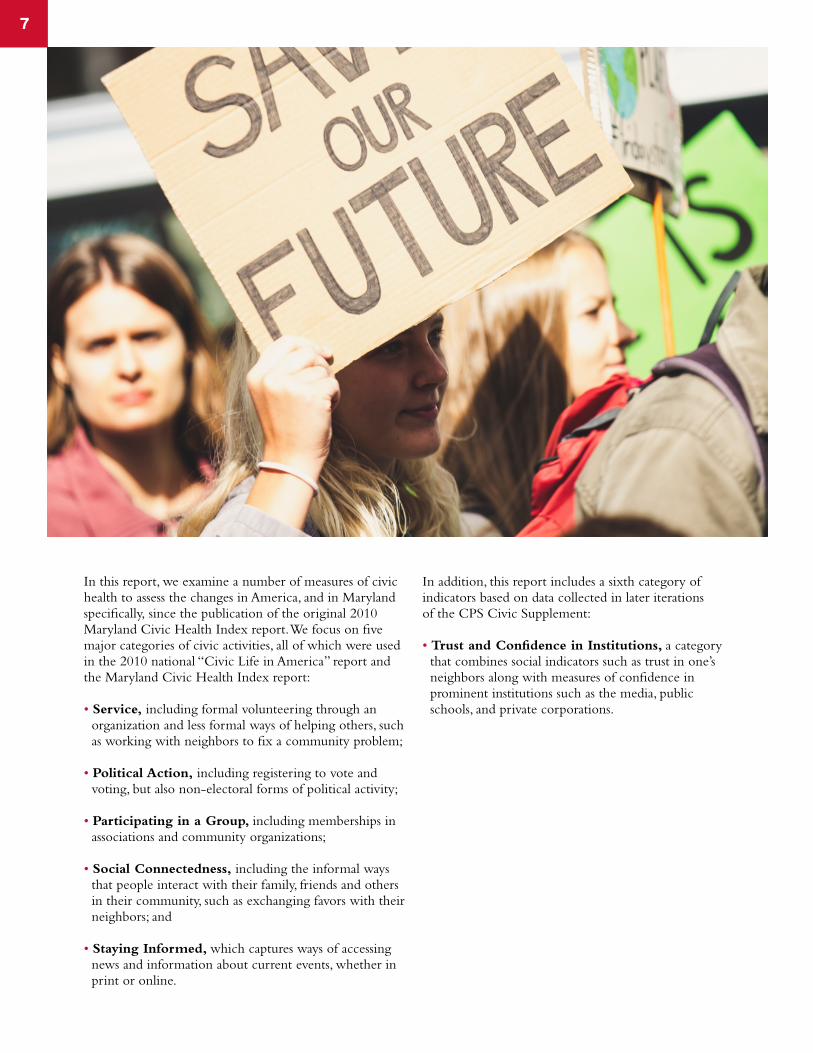
In this report, we examine a number of measures of civic health to assess the changes in America, and in Maryland specifically, since the publication of the original 2010 Maryland Civic Health Index report. We focus on five major categories of civic activities, all of which were used in the 2010 national “Civic Life in America” report and the Maryland Civic Health Index report:
• Service, including formal volunteering through an organization and less formal ways of helping others, such as working with neighbors to fix a community problem;
• Political Action, including registering to vote and voting, but also non-electoral forms of political activity;
• Participating in a Group, including memberships in associations and community organizations;
• Social Connectedness, including the informal ways that people interact with their family, friends and others in their community, such as exchanging favors with their neighbors; and
• Staying Informed, which captures ways of accessing news and information about current events, whether in print or online.
In addition, this report includes a sixth category of indicators based on data collected in later iterations of the CPS Civic Supplement:
• Trust and Confidence in Institutions, a category that combines social indicators such as trust in one’s neighbors along with measures of confidence in prominent institutions such as the media, public schools, and private corporations.
7
1
Most of the statistics reported here come from the CPS Civic Engagement Supplement, which was conducted by the U.S. Census Bureau in November between 2008 and 2013 as part of the Current Population Survey (CPS). The November 2008 CPS Civic Engagement Supplement was administered to about 90,000 adults (ages 18 and over) in 54,000 households nationwide, with a representative sample drawn from each state and the District of Columbia.
A cut-down version of the survey (with several questions deleted) was fielded again the following year, November 2009, but only to one-fourth of CPS households. The 2009 version of the survey was administered to all CPS households in November 2010. In 2011, several questions were added to the survey instrument, including questions about voting in local elections, expressing opinions on the Internet, trust in one’s neighbors, and confidence in institutions. This larger survey was administered to all CPS households in November 2011. Census did not field a Civic Engagement Supplement in November 2012, but did administer the November 2011 survey instrument in 2013 to one-half of CPS households.
In 2008 and 2010, the CPS Civic Engagement Supplement was combined with the CPS Voting Supplement, which the Census Bureau has used for more than forty years to produce data on voting and registration in national elections. The CPS Voting Supplement is the data source for the voting and registration results, as well as the information about the length of time that respondents have lived at their current addresses, featured in this report.
The civic engagement indicators in the Service category – volunteering with an organization, attending a public meeting and working with neighbors to fix a community problem – were collected through the CPS Volunteer Supplement, which was first administered by the Bureau of Labor Statistics and the Census Bureau in September 2002 and fielded every September until 2015.15
Most of the questions on the CPS supplement surveys have a yes-no format. However, several indicators in the Social Connectedness and Connecting to Information and Current Events categories each had five response options
in the CPS Supplement. For our purposes, the category “frequently” includes the original response categories “basically every day” and “a few times a week.”
Please see the Appendix for the wordings of the original CPS questions used to create these indicators.
Service Indicators
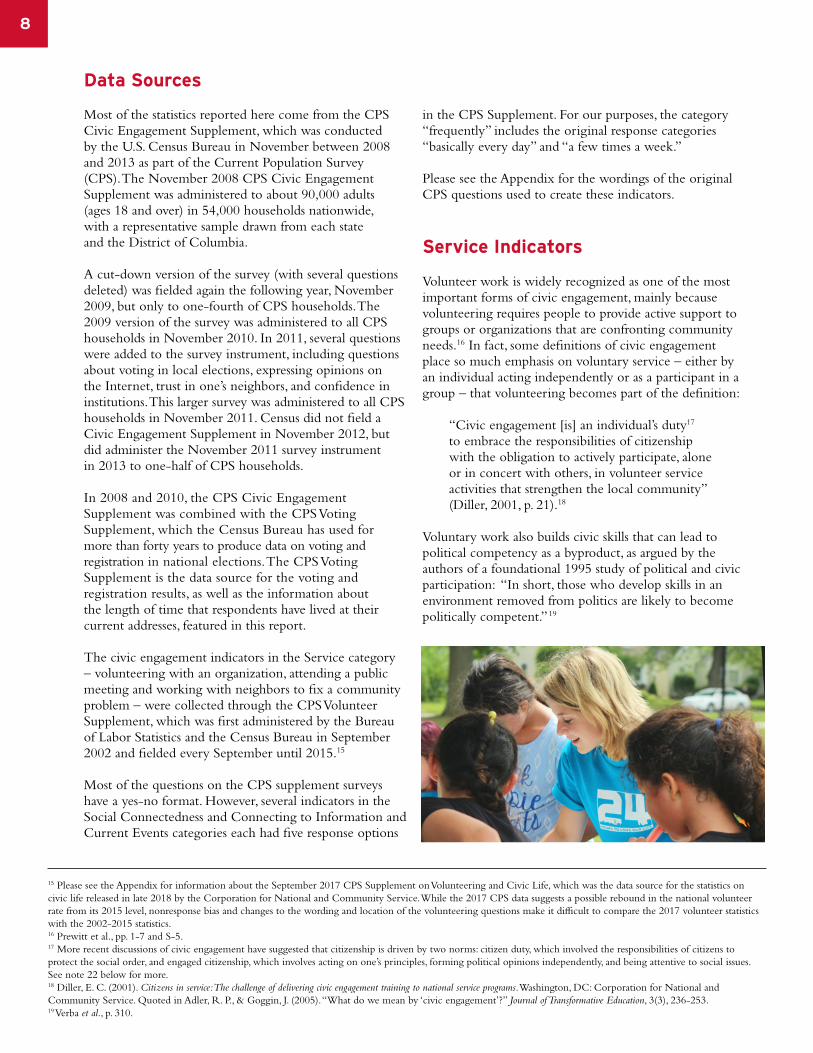
Volunteer work is widely recognized as one of the most important forms of civic engagement, mainly because volunteering requires people to provide active support to groups or organizations that are confronting community needs.16 In fact, some definitions of civic engagement place so much emphasis on voluntary service – either by an individual acting independently or as a participant in a group – that volunteering becomes part of the definition:
“Civic engagement [is] an individual’s duty17 to embrace the responsibilities of citizenship with the obligation to actively participate, alone or in concert with others, in volunteer service activities that strengthen the local community” (Diller, 2001, p. 21).18
Voluntary work also builds civic skills that can lead to political competency as a byproduct, as argued by the authors of a foundational 1995 study of political and civic participation: “In short, those who develop skills in an environment removed from politics are likely to become politically competent.” 19
Data Sources
15 Please see the Appendix for information about the September 2017 CPS Supplement on Volunteering and Civic Life, which was the data source for the statistics on civic life released in late 2018 by the Corporation for National and Community Service. While the 2017 CPS data suggests a possible rebound in the national volunteer rate from its 2015 level, nonresponse bias and changes to the wording and location of the volunteering questions make it difficult to compare the 2017 volunteer statistics with the 2002-2015 statistics. 16 Prewitt et al., pp. 1-7 and S-5.17 More recent discussions of civic engagement have suggested that citizenship is driven by two norms: citizen duty, which involved the responsibilities of citizens to protect the social order, and engaged citizenship, which involves acting on one’s principles, forming political opinions independently, and being attentive to social issues. See note 22 below for more.18 Diller, E. C. (2001). Citizens in service: The challenge of delivering civic engagement training to national service programs. Washington, DC: Corporation for National and Community Service. Quoted in Adler, R. P., & Goggin, J. (2005). “What do we mean by ‘civic engagement’?” Journal of Transformative Education, 3(3), 236-253.19 Verba et al., p. 310.
8
19
The U.S. government has used labor force surveys – specifically, the CPS Volunteer Supplement – to collect data on formal volunteering (performing unpaid work through or for an organization) since the mid-1960s, and annually from 2002 through 2015. The 2002-2015 version of the Volunteer Supplement is well-suited for the study of trends in these types of civic behaviors: it documented the post-9/11 rise in formal volunteering to its peak, when the national volunteer rate stayed at 28.8 percent for three straight years (2003-2005). Following that historic high, the volunteer rate declined in 2006, after which followed a period that featured more declines than increases in the volunteer rate until volunteering hit its lowest point in 2015.
Volunteering: The 2002-2015 CPS Volunteer Supplement survey began by asking respondents two primary questions about their activities in the preceding twelve months: whether they did any volunteer activities (unpaid work) through or for an organization, and (if the response was “no”) whether they did any volunteer activities through children’s schools or youth organizations. The respondent was counted as a volunteer if he or she answered “yes” to either of these two questions.
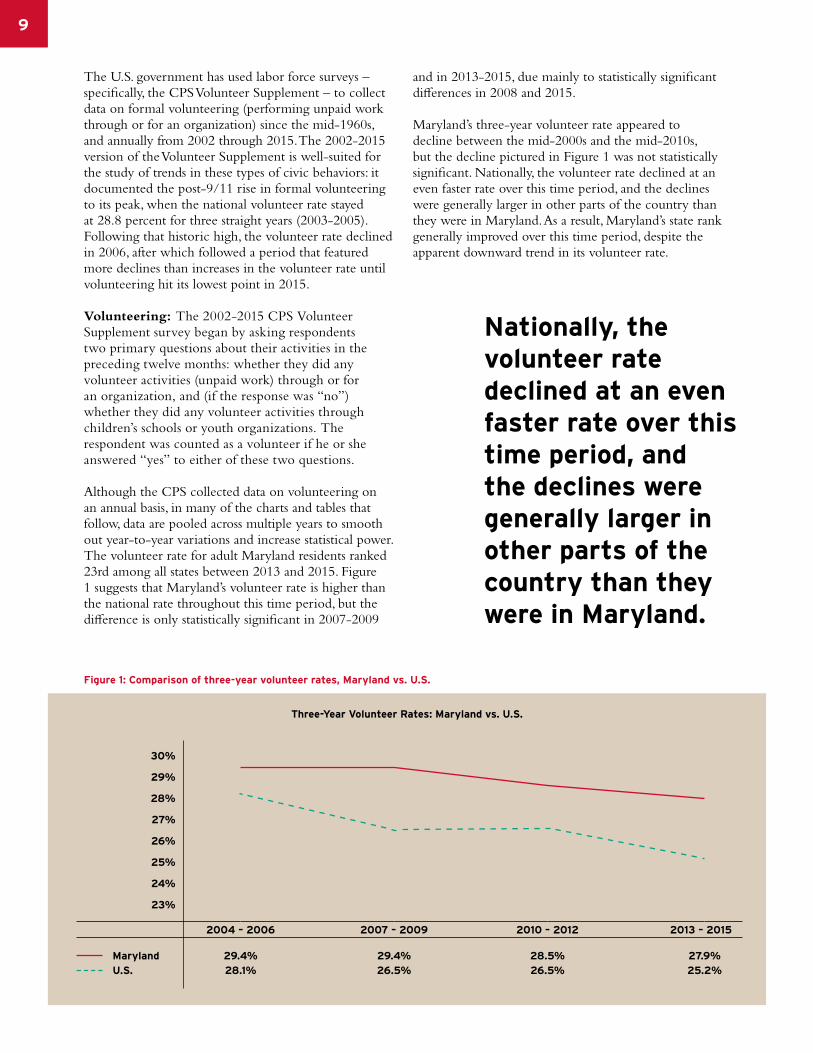
Although the CPS collected data on volunteering on an annual basis, in many of the charts and tables that follow, data are pooled across multiple years to smooth out year-to-year variations and increase statistical power. The volunteer rate for adult Maryland residents ranked 23rd among all states between 2013 and 2015. Figure 1 suggests that Maryland’s volunteer rate is higher than the national rate throughout this time period, but the difference is only statistically significant in 2007-2009
and in 2013-2015, due mainly to statistically significant differences in 2008 and 2015.
Maryland’s three-year volunteer rate appeared to decline between the mid-2000s and the mid-2010s, but the decline pictured in Figure 1 was not statistically significant. Nationally, the volunteer rate declined at an even faster rate over this time period, and the declines were generally larger in other parts of the country than they were in Maryland. As a result, Maryland’s state rank generally improved over this time period, despite the apparent downward trend in its volunteer rate.
30%
29%
28%
27%
26%
25%
24%
23%
2004 – 2006
29.4%28.1%
2007 – 2009
29.4%26.5%
28.5%26.5%
2010 – 2012 2013 – 2015
27.9%25.2%
Three-Year Volunteer Rates: Maryland vs. U.S.
Figure 1: Comparison of three-year volunteer rates, Maryland vs. U.S.
MarylandU.S.
Nationally, the volunteer rate declined at an even faster rate over this time period, and the declines were generally larger in other parts of the country than they were in Maryland.
1
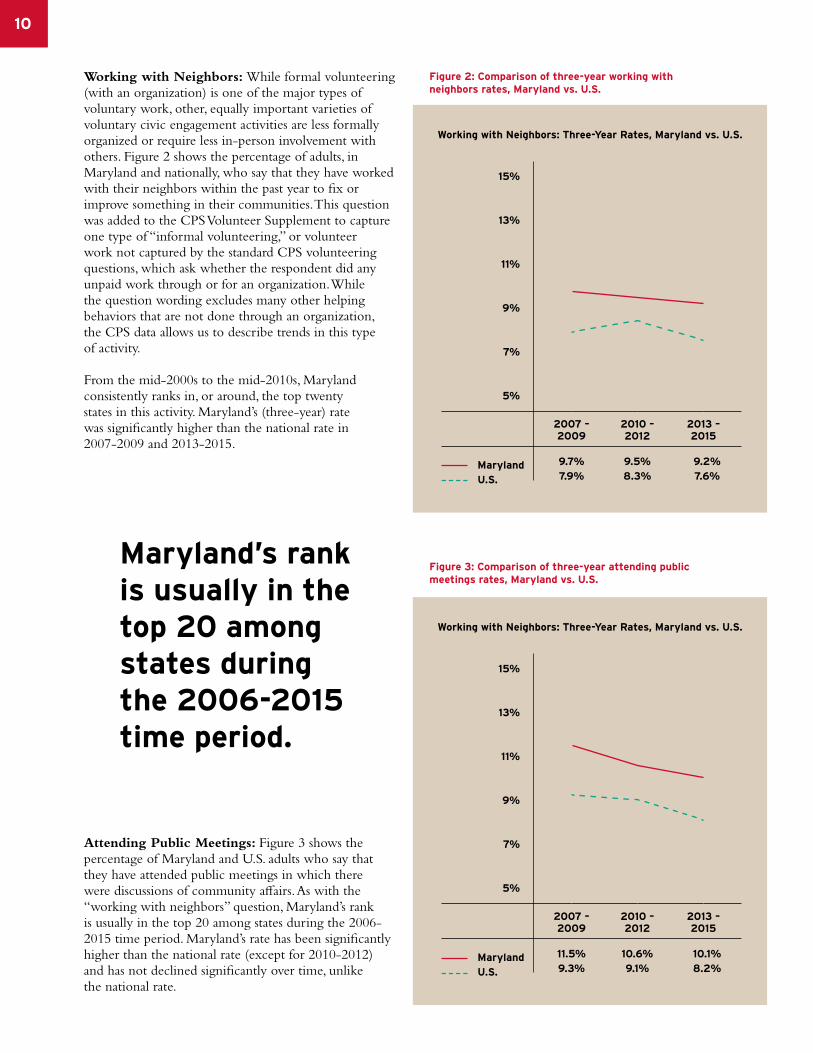
Working with Neighbors: While formal volunteering (with an organization) is one of the major types of voluntary work, other, equally important varieties of voluntary civic engagement activities are less formally organized or require less in-person involvement with others. Figure 2 shows the percentage of adults, in Maryland and nationally, who say that they have worked with their neighbors within the past year to fix or improve something in their communities. This question was added to the CPS Volunteer Supplement to capture one type of “informal volunteering,” or volunteer work not captured by the standard CPS volunteering questions, which ask whether the respondent did any unpaid work through or for an organization. While the question wording excludes many other helping behaviors that are not done through an organization, the CPS data allows us to describe trends in this type of activity.
From the mid-2000s to the mid-2010s, Maryland consistently ranks in, or around, the top twenty states in this activity. Maryland’s (three-year) rate was significantly higher than the national rate in 2007-2009 and 2013-2015.
Attending Public Meetings: Figure 3 shows the percentage of Maryland and U.S. adults who say that they have attended public meetings in which there were discussions of community affairs. As with the “working with neighbors” question, Maryland’s rank is usually in the top 20 among states during the 2006-2015 time period. Maryland’s rate has been significantly higher than the national rate (except for 2010-2012) and has not declined significantly over time, unlike the national rate.
10
15%
13%
11%
9%
7%
5%
15%
13%
11%
9%
7%
5%
Figure 2: Comparison of three-year working with neighbors rates, Maryland vs. U.S.
Figure 3: Comparison of three-year attending public meetings rates, Maryland vs. U.S.
MarylandU.S.
MarylandU.S.
2007 –2009
2007 –2009
9.7%7.9%
11.5%9.3%
9.5%8.3%
10.6%9.1%
2010 –2012
2010 –2012
2013 –2015
2013 –2015
9.2%7.6%
10.1%8.2%
Working with Neighbors: Three-Year Rates, Maryland vs. U.S.
Working with Neighbors: Three-Year Rates, Maryland vs. U.S.
Maryland’s rank is usually in the top 20 among states during the 2006-2015 time period.
111
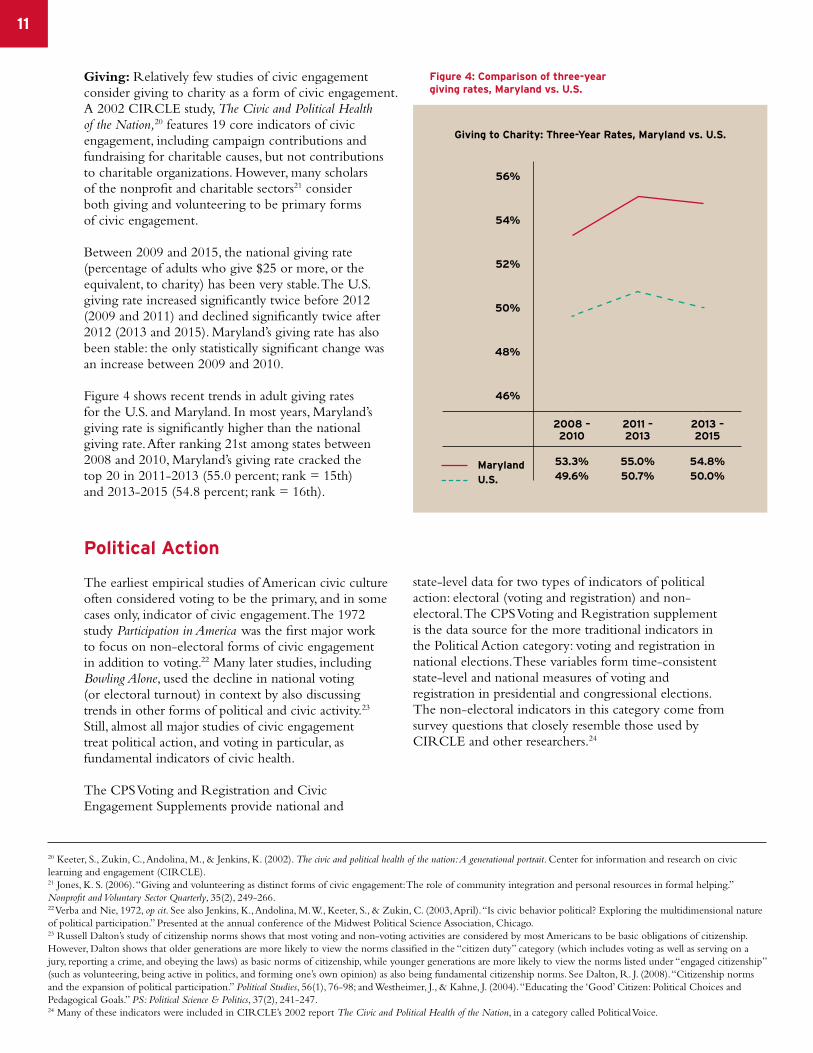
Giving: Relatively few studies of civic engagement consider giving to charity as a form of civic engagement. A 2002 CIRCLE study, The Civic and Political Health of the Nation,20 features 19 core indicators of civic engagement, including campaign contributions and fundraising for charitable causes, but not contributions to charitable organizations. However, many scholars of the nonprofit and charitable sectors21 consider both giving and volunteering to be primary forms of civic engagement.
Between 2009 and 2015, the national giving rate (percentage of adults who give $25 or more, or the equivalent, to charity) has been very stable. The U.S. giving rate increased significantly twice before 2012 (2009 and 2011) and declined significantly twice after 2012 (2013 and 2015). Maryland’s giving rate has also been stable: the only statistically significant change was an increase between 2009 and 2010.
Figure 4 shows recent trends in adult giving rates for the U.S. and Maryland. In most years, Maryland’s giving rate is significantly higher than the national giving rate. After ranking 21st among states between 2008 and 2010, Maryland’s giving rate cracked the top 20 in 2011-2013 (55.0 percent; rank = 15th) and 2013-2015 (54.8 percent; rank = 16th).
Political Action
The earliest empirical studies of American civic culture often considered voting to be the primary, and in some cases only, indicator of civic engagement. The 1972 study Participation in America was the first major work to focus on non-electoral forms of civic engagement in addition to voting.22 Many later studies, including Bowling Alone, used the decline in national voting (or electoral turnout) in context by also discussing trends in other forms of political and civic activity.23 Still, almost all major studies of civic engagement treat political action, and voting in particular, as fundamental indicators of civic health.
The CPS Voting and Registration and Civic Engagement Supplements provide national and
state-level data for two types of indicators of political action: electoral (voting and registration) and non-electoral. The CPS Voting and Registration supplement is the data source for the more traditional indicators in the Political Action category: voting and registration in national elections. These variables form time-consistent state-level and national measures of voting and registration in presidential and congressional elections. The non-electoral indicators in this category come from survey questions that closely resemble those used by CIRCLE and other researchers.24
56%
54%
52%
50%
48%
46%
Figure 4: Comparison of three-year giving rates, Maryland vs. U.S.
MarylandU.S.
2008 –2010
53.3%49.6%
55.0%50.7%
2011 –2013
2013 –2015
54.8%50.0%
Giving to Charity: Three-Year Rates, Maryland vs. U.S.
20 Keeter, S., Zukin, C., Andolina, M., & Jenkins, K. (2002). The civic and political health of the nation: A generational portrait. Center for information and research on civic learning and engagement (CIRCLE).21 Jones, K. S. (2006). “Giving and volunteering as distinct forms of civic engagement: The role of community integration and personal resources in formal helping.” Nonprofit and Voluntary Sector Quarterly, 35(2), 249-266.22 Verba and Nie, 1972, op cit. See also Jenkins, K., Andolina, M. W., Keeter, S., & Zukin, C. (2003, April). “Is civic behavior political? Exploring the multidimensional nature of political participation.” Presented at the annual conference of the Midwest Political Science Association, Chicago. 23 Russell Dalton’s study of citizenship norms shows that most voting and non-voting activities are considered by most Americans to be basic obligations of citizenship. However, Dalton shows that older generations are more likely to view the norms classified in the “citizen duty” category (which includes voting as well as serving on a jury, reporting a crime, and obeying the laws) as basic norms of citizenship, while younger generations are more likely to view the norms listed under “engaged citizenship” (such as volunteering, being active in politics, and forming one’s own opinion) as also being fundamental citizenship norms. See Dalton, R. J. (2008). “Citizenship norms and the expansion of political participation.” Political Studies, 56(1), 76-98; and Westheimer, J., & Kahne, J. (2004). “Educating the ‘Good’ Citizen: Political Choices and Pedagogical Goals.” PS: Political Science & Politics, 37(2), 241-247.24 Many of these indicators were included in CIRCLE’s 2002 report The Civic and Political Health of the Nation, in a category called Political Voice.
112
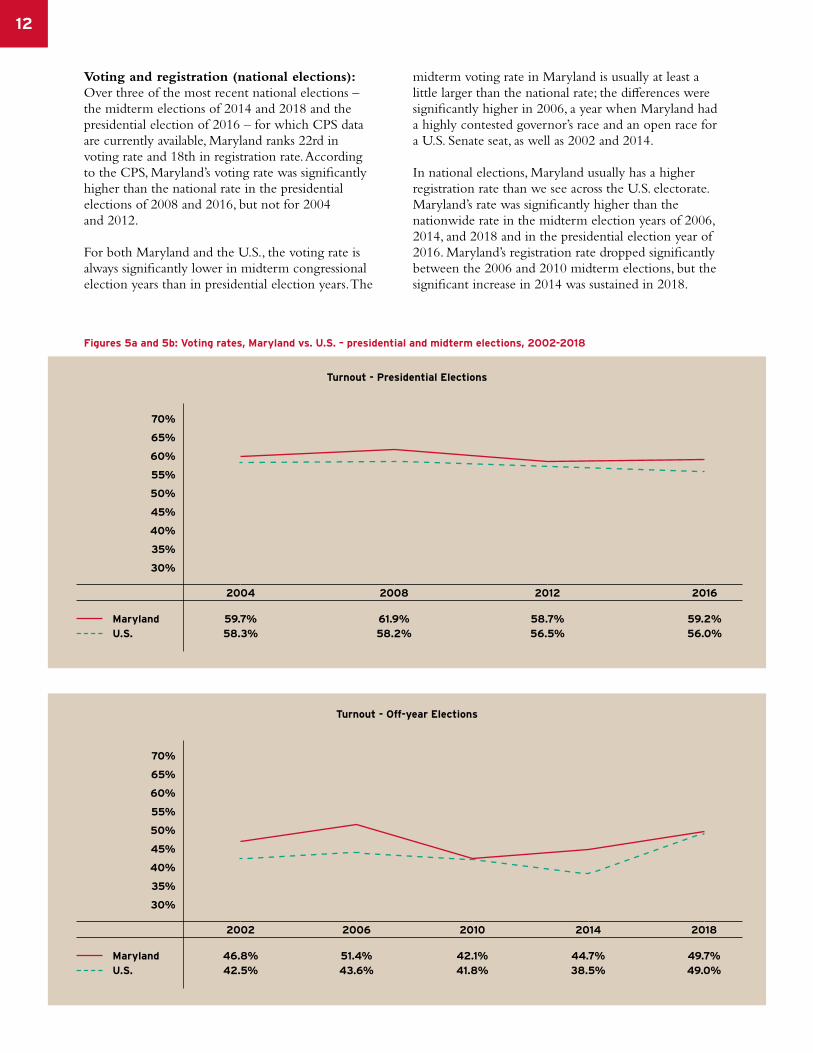
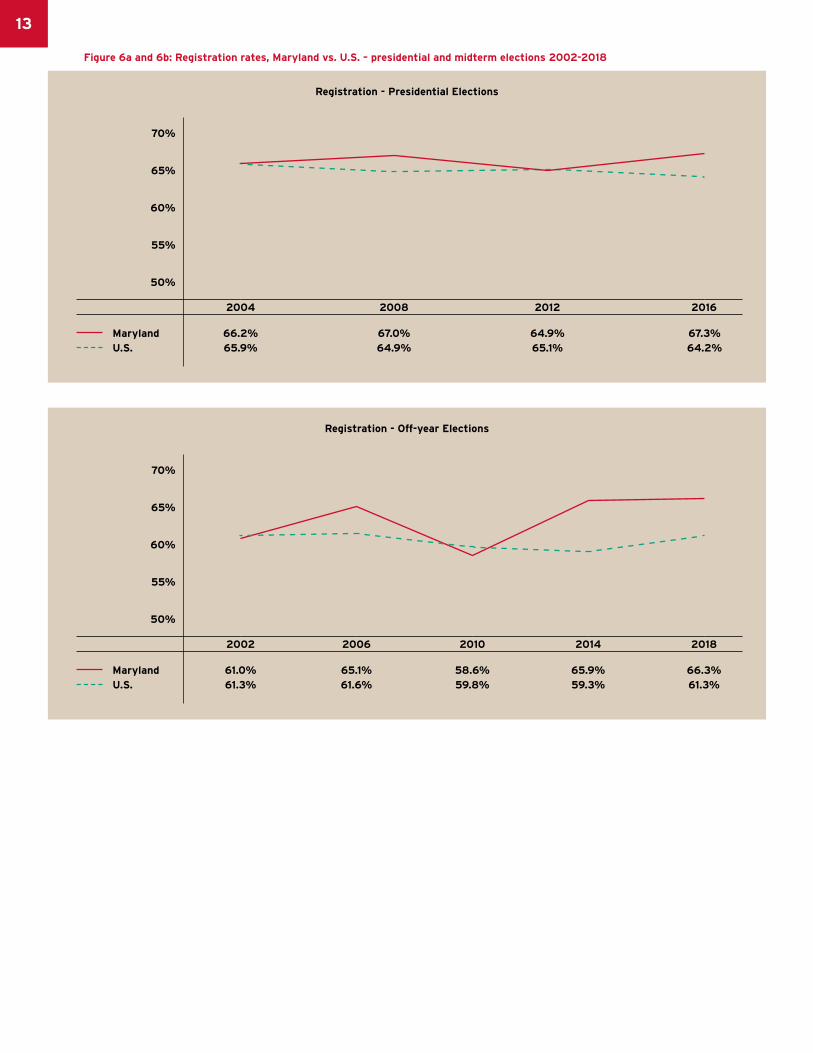
Voting and registration (national elections): Over three of the most recent national elections – the midterm elections of 2014 and 2018 and the presidential election of 2016 – for which CPS data are currently available, Maryland ranks 22rd in voting rate and 18th in registration rate. According to the CPS, Maryland’s voting rate was significantly higher than the national rate in the presidential elections of 2008 and 2016, but not for 2004 and 2012.
For both Maryland and the U.S., the voting rate is always significantly lower in midterm congressional election years than in presidential election years. The
midterm voting rate in Maryland is usually at least a little larger than the national rate; the differences were significantly higher in 2006, a year when Maryland had a highly contested governor’s race and an open race for a U.S. Senate seat, as well as 2002 and 2014.
In national elections, Maryland usually has a higher registration rate than we see across the U.S. electorate. Maryland’s rate was significantly higher than the nationwide rate in the midterm election years of 2006, 2014, and 2018 and in the presidential election year of 2016. Maryland’s registration rate dropped significantly between the 2006 and 2010 midterm elections, but the significant increase in 2014 was sustained in 2018.
70%
65%
60%
55%
50%
45%
40%
35%
30%
70%
65%
60%
55%
50%
45%
40%
35%
30%
2004
59.7%58.3%
2002
46.8%42.5%
2008
61.9%58.2%
2006
51.4%43.6%
58.7%56.5%
2012
42.1%41.8%
2010
2016
59.2%56.0%
2018
49.7%49.0%
2014
44.7%38.5%
Turnout - Presidential Elections
Turnout - Off-year Elections
Figures 5a and 5b: Voting rates, Maryland vs. U.S. – presidential and midterm elections, 2002-2018
MarylandU.S.
MarylandU.S.
113
70%
65%
60%
55%
50%
70%
65%
60%
55%
50%
2004
66.2%65.9%
2002
61.0%61.3%
2008
67.0%64.9%
2006
65.1%61.6%
64.9%65.1%
2012
58.6%59.8%
2010
2016
67.3%64.2%
2018
66.3%61.3%
2014
65.9%59.3%
Registration - Presidential Elections
Registration - Off-year Elections
Figure 6a and 6b: Registration rates, Maryland vs. U.S. – presidential and midterm elections 2002-2018
MarylandU.S.
MarylandU.S.
114
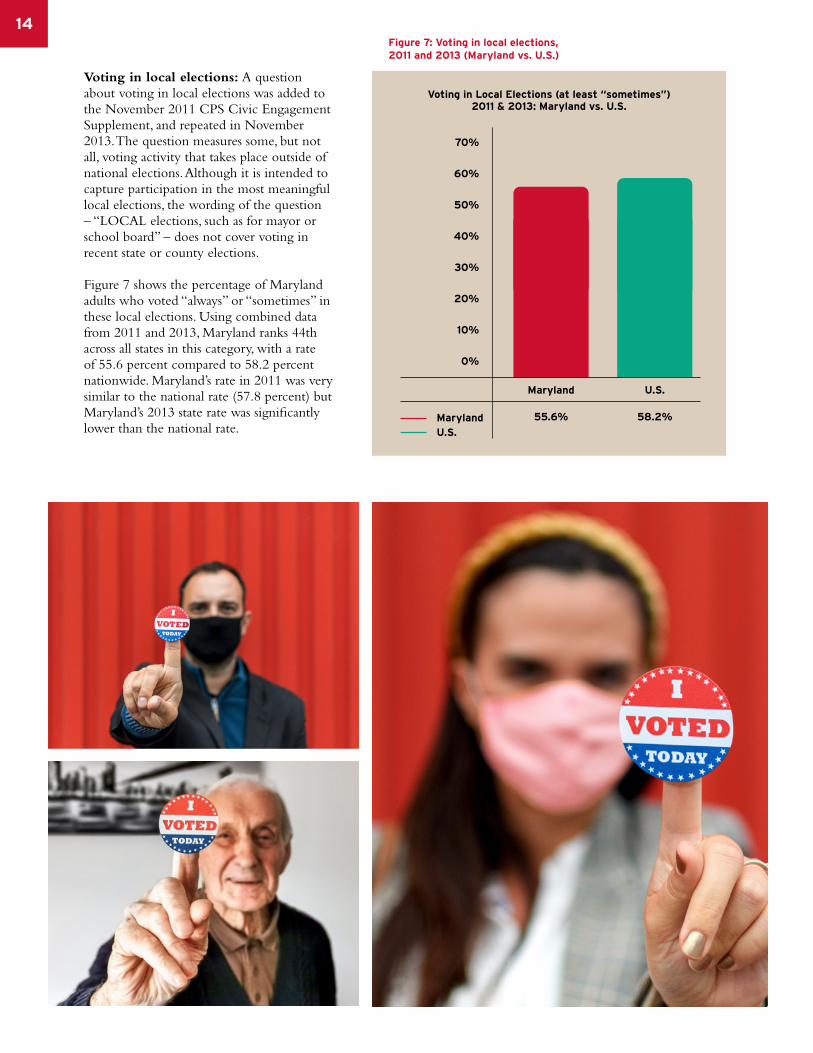
Voting in local elections: A question about voting in local elections was added to the November 2011 CPS Civic Engagement Supplement, and repeated in November 2013. The question measures some, but not all, voting activity that takes place outside of national elections. Although it is intended to capture participation in the most meaningful local elections, the wording of the question – “LOCAL elections, such as for mayor or school board” – does not cover voting in recent state or county elections.
Figure 7 shows the percentage of Maryland adults who voted “always” or “sometimes” in these local elections. Using combined data from 2011 and 2013, Maryland ranks 44th across all states in this category, with a rate of 55.6 percent compared to 58.2 percent nationwide. Maryland’s rate in 2011 was very similar to the national rate (57.8 percent) but Maryland’s 2013 state rate was significantly lower than the national rate.
70%
60%
50%
40%
30%
20%
10%
0%
Figure 7: Voting in local elections, 2011 and 2013 (Maryland vs. U.S.)
MarylandU.S.
Maryland
55.6%
U.S.
58.2%
Voting in Local Elections (at least “sometimes”)2011 & 2013: Maryland vs. U.S.
115
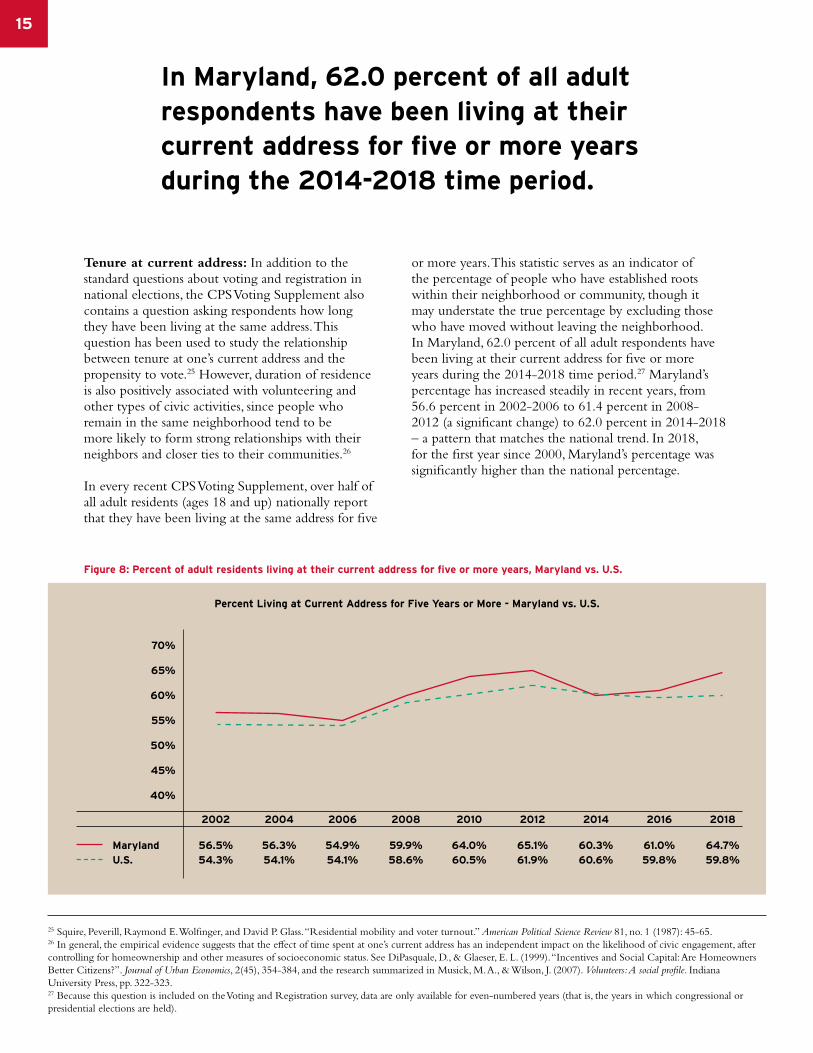
Tenure at current address: In addition to the standard questions about voting and registration in national elections, the CPS Voting Supplement also contains a question asking respondents how long they have been living at the same address. This question has been used to study the relationshipbetween tenure at one’s current address and the propensity to vote.25 However, duration of residence is also positively associated with volunteering and other types of civic activities, since people who remain in the same neighborhood tend to be more likely to form strong relationships with their neighbors and closer ties to their communities.26
In every recent CPS Voting Supplement, over half of all adult residents (ages 18 and up) nationally report that they have been living at the same address for five
or more years. This statistic serves as an indicator of the percentage of people who have established roots within their neighborhood or community, though it may understate the true percentage by excluding those who have moved without leaving the neighborhood. In Maryland, 62.0 percent of all adult respondents have been living at their current address for five or more years during the 2014-2018 time period.27 Maryland’s percentage has increased steadily in recent years, from 56.6 percent in 2002-2006 to 61.4 percent in 2008-2012 (a significant change) to 62.0 percent in 2014-2018 – a pattern that matches the national trend. In 2018, for the first year since 2000, Maryland’s percentage was significantly higher than the national percentage.
In Maryland, 62.0 percent of all adult respondents have been living at their current address for five or more years during the 2014-2018 time period.
70%
65%
60%
55%
50%
45%
40%
2002 2004 2006 2008 2010 2012 2014 2016 2018
56.5%54.3%
56.3%54.1%
54.9%54.1%
59.9%58.6%
64.0%60.5%
65.1%61.9%
60.3%60.6%
61.0%59.8%
64.7%59.8%
Percent Living at Current Address for Five Years or More - Maryland vs. U.S.
Figure 8: Percent of adult residents living at their current address for five or more years, Maryland vs. U.S.
MarylandU.S.
25 Squire, Peverill, Raymond E. Wolfinger, and David P. Glass. “Residential mobility and voter turnout.” American Political Science Review 81, no. 1 (1987): 45-65.26 In general, the empirical evidence suggests that the effect of time spent at one’s current address has an independent impact on the likelihood of civic engagement, after controlling for homeownership and other measures of socioeconomic status. See DiPasquale, D., & Glaeser, E. L. (1999). “Incentives and Social Capital: Are Homeowners Better Citizens?”. Journal of Urban Economics, 2(45), 354-384, and the research summarized in Musick, M. A., & Wilson, J. (2007). Volunteers: A social profile. Indiana University Press, pp. 322-323.27 Because this question is included on the Voting and Registration survey, data are only available for even-numbered years (that is, the years in which congressional or presidential elections are held).
116
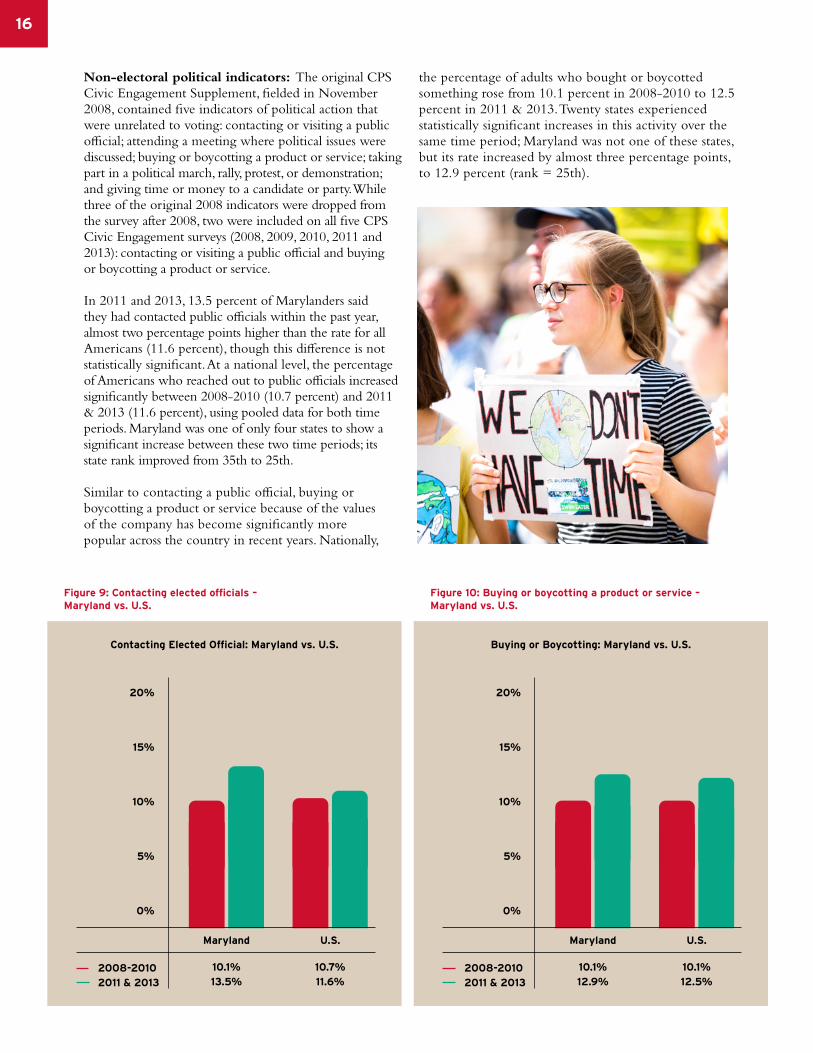
Non-electoral political indicators: The original CPS Civic Engagement Supplement, fielded in November 2008, contained five indicators of political action that were unrelated to voting: contacting or visiting a public official; attending a meeting where political issues were discussed; buying or boycotting a product or service; taking part in a political march, rally, protest, or demonstration; and giving time or money to a candidate or party. While three of the original 2008 indicators were dropped from the survey after 2008, two were included on all five CPS Civic Engagement surveys (2008, 2009, 2010, 2011 and 2013): contacting or visiting a public official and buying or boycotting a product or service.
In 2011 and 2013, 13.5 percent of Marylanders said they had contacted public officials within the past year, almost two percentage points higher than the rate for all Americans (11.6 percent), though this difference is not statistically significant. At a national level, the percentage of Americans who reached out to public officials increased significantly between 2008-2010 (10.7 percent) and 2011 & 2013 (11.6 percent), using pooled data for both time periods. Maryland was one of only four states to show a significant increase between these two time periods; its state rank improved from 35th to 25th.
Similar to contacting a public official, buying or boycotting a product or service because of the values of the company has become significantly more popular across the country in recent years. Nationally,
the percentage of adults who bought or boycotted something rose from 10.1 percent in 2008-2010 to 12.5 percent in 2011 & 2013. Twenty states experienced statistically significant increases in this activity over the same time period; Maryland was not one of these states, but its rate increased by almost three percentage points, to 12.9 percent (rank = 25th).
20%
15%
10%
5%
0%
Figure 9: Contacting elected officials – Maryland vs. U.S.
Figure 10: Buying or boycotting a product or service – Maryland vs. U.S.
2008-20102011 & 2013
Maryland
10.1%13.5%
U.S.
10.7%11.6%
Contacting Elected Official: Maryland vs. U.S.
20%
15%
10%
5%
0%
2008-20102011 & 2013
Maryland
10.1%12.9%
U.S.
10.1%12.5%
Buying or Boycotting: Maryland vs. U.S.
117
Participating in a Group
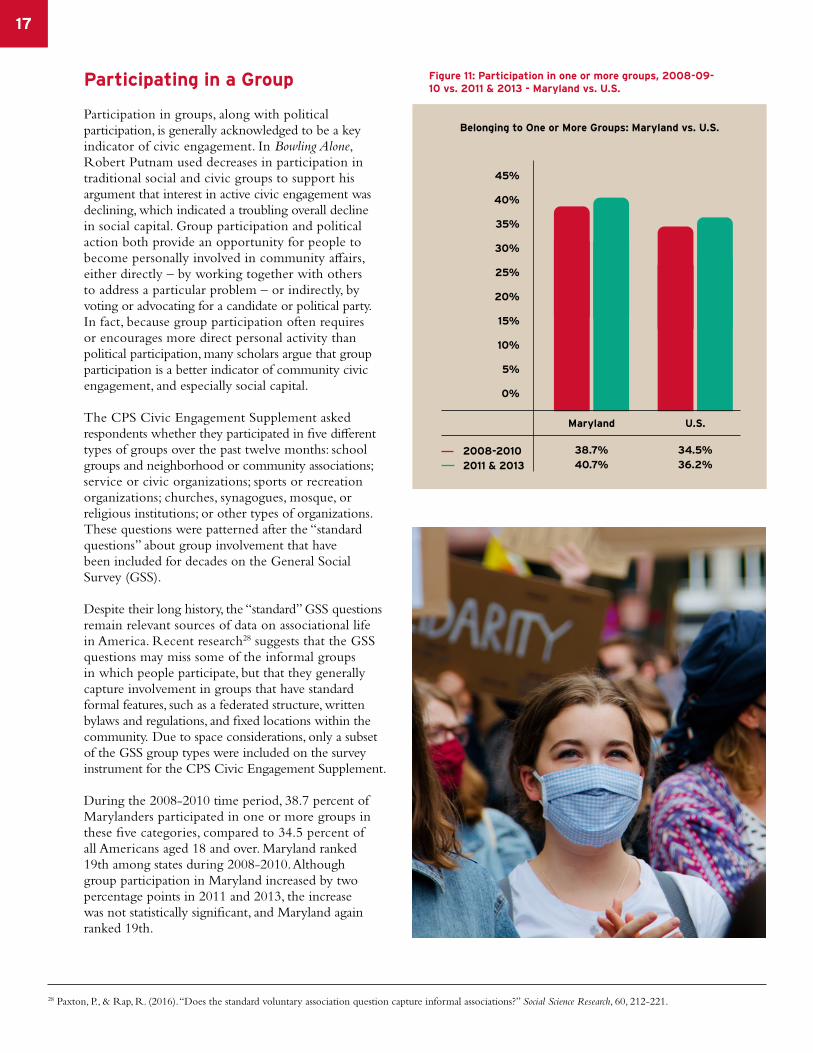
Participation in groups, along with political participation, is generally acknowledged to be a key indicator of civic engagement. In Bowling Alone, Robert Putnam used decreases in participation in traditional social and civic groups to support his argument that interest in active civic engagement was declining, which indicated a troubling overall decline in social capital. Group participation and political action both provide an opportunity for people to become personally involved in community affairs, either directly – by working together with others to address a particular problem – or indirectly, by voting or advocating for a candidate or political party. In fact, because group participation often requires or encourages more direct personal activity than political participation, many scholars argue that group participation is a better indicator of community civic engagement, and especially social capital.
The CPS Civic Engagement Supplement asked respondents whether they participated in five different types of groups over the past twelve months: school groups and neighborhood or community associations; service or civic organizations; sports or recreation organizations; churches, synagogues, mosque, or religious institutions; or other types of organizations. These questions were patterned after the “standard questions” about group involvement that have been included for decades on the General Social Survey (GSS).
Despite their long history, the “standard” GSS questions remain relevant sources of data on associational life in America. Recent research28 suggests that the GSS questions may miss some of the informal groups in which people participate, but that they generally capture involvement in groups that have standard formal features, such as a federated structure, written bylaws and regulations, and fixed locations within the community. Due to space considerations, only a subset of the GSS group types were included on the survey instrument for the CPS Civic Engagement Supplement.
During the 2008-2010 time period, 38.7 percent of Marylanders participated in one or more groups in these five categories, compared to 34.5 percent of all Americans aged 18 and over. Maryland ranked 19th among states during 2008-2010. Although group participation in Maryland increased by two percentage points in 2011 and 2013, the increase was not statistically significant, and Maryland again ranked 19th.
28 Paxton, P., & Rap, R. (2016). “Does the standard voluntary association question capture informal associations?” Social Science Research, 60, 212-221.
Figure 11: Participation in one or more groups, 2008-09-10 vs. 2011 & 2013 - Maryland vs. U.S.
45%
40%
35%
30%
25%
20%
15%
10%
5%
0%
2008-20102011 & 2013
Maryland
38.7%40.7%
U.S.
34.5%36.2%
Belonging to One or More Groups: Maryland vs. U.S.
118
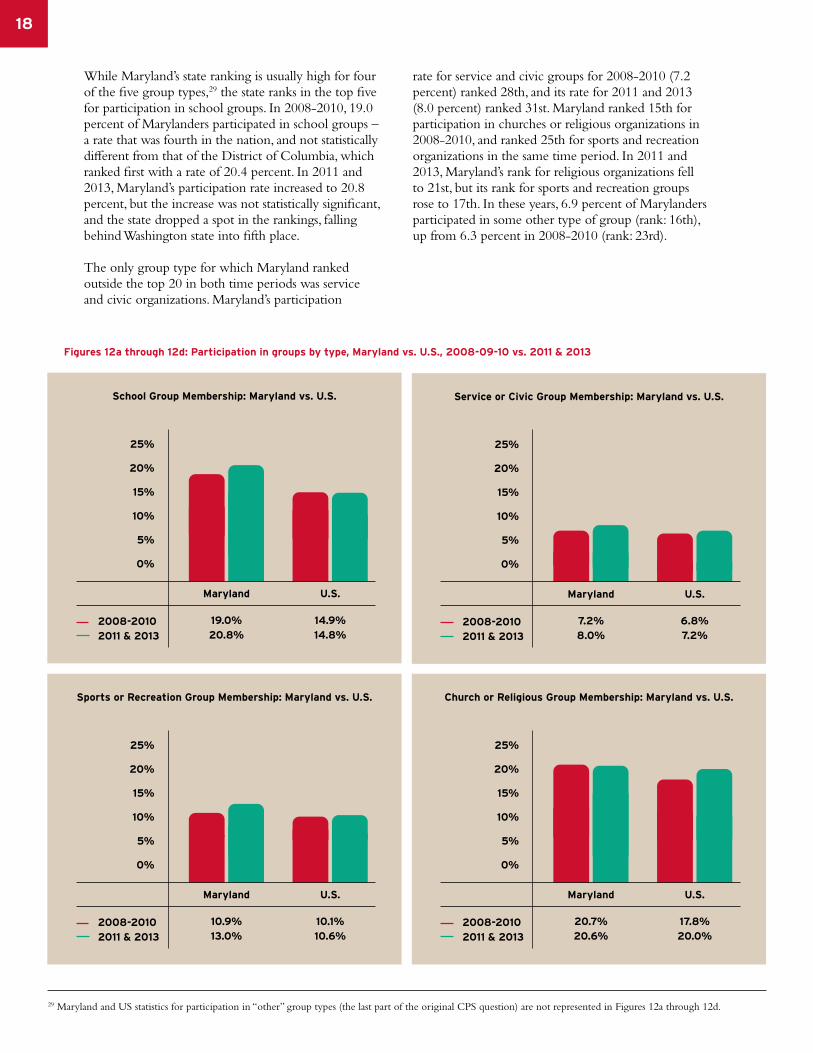
While Maryland’s state ranking is usually high for four of the five group types,29 the state ranks in the top five for participation in school groups. In 2008-2010, 19.0 percent of Marylanders participated in school groups – a rate that was fourth in the nation, and not statistically different from that of the District of Columbia, which ranked first with a rate of 20.4 percent. In 2011 and 2013, Maryland’s participation rate increased to 20.8 percent, but the increase was not statistically significant, and the state dropped a spot in the rankings, falling behind Washington state into fifth place.
The only group type for which Maryland ranked outside the top 20 in both time periods was service and civic organizations. Maryland’s participation
rate for service and civic groups for 2008-2010 (7.2 percent) ranked 28th, and its rate for 2011 and 2013 (8.0 percent) ranked 31st. Maryland ranked 15th for participation in churches or religious organizations in 2008-2010, and ranked 25th for sports and recreation organizations in the same time period. In 2011 and 2013, Maryland’s rank for religious organizations fell to 21st, but its rank for sports and recreation groups rose to 17th. In these years, 6.9 percent of Marylanders participated in some other type of group (rank: 16th), up from 6.3 percent in 2008-2010 (rank: 23rd).
29 Maryland and US statistics for participation in “other” group types (the last part of the original CPS question) are not represented in Figures 12a through 12d.
Figures 12a through 12d: Participation in groups by type, Maryland vs. U.S., 2008-09-10 vs. 2011 & 2013
25%
20%
15%
10%
5%
0%
2008-20102011 & 2013
Maryland
19.0%20.8%
U.S.
14.9%14.8%
School Group Membership: Maryland vs. U.S.
25%
20%
15%
10%
5%
0%
2008-20102011 & 2013
Maryland
10.9%13.0%
U.S.
10.1%10.6%
Sports or Recreation Group Membership: Maryland vs. U.S.
25%
20%
15%
10%
5%
0%
2008-20102011 & 2013
Maryland
20.7%20.6%
U.S.
17.8%20.0%
Church or Religious Group Membership: Maryland vs. U.S.
25%
20%
15%
10%
5%
0%
2008-20102011 & 2013
Maryland
7.2%8.0%
U.S.
6.8%7.2%
Service or Civic Group Membership: Maryland vs. U.S.
119
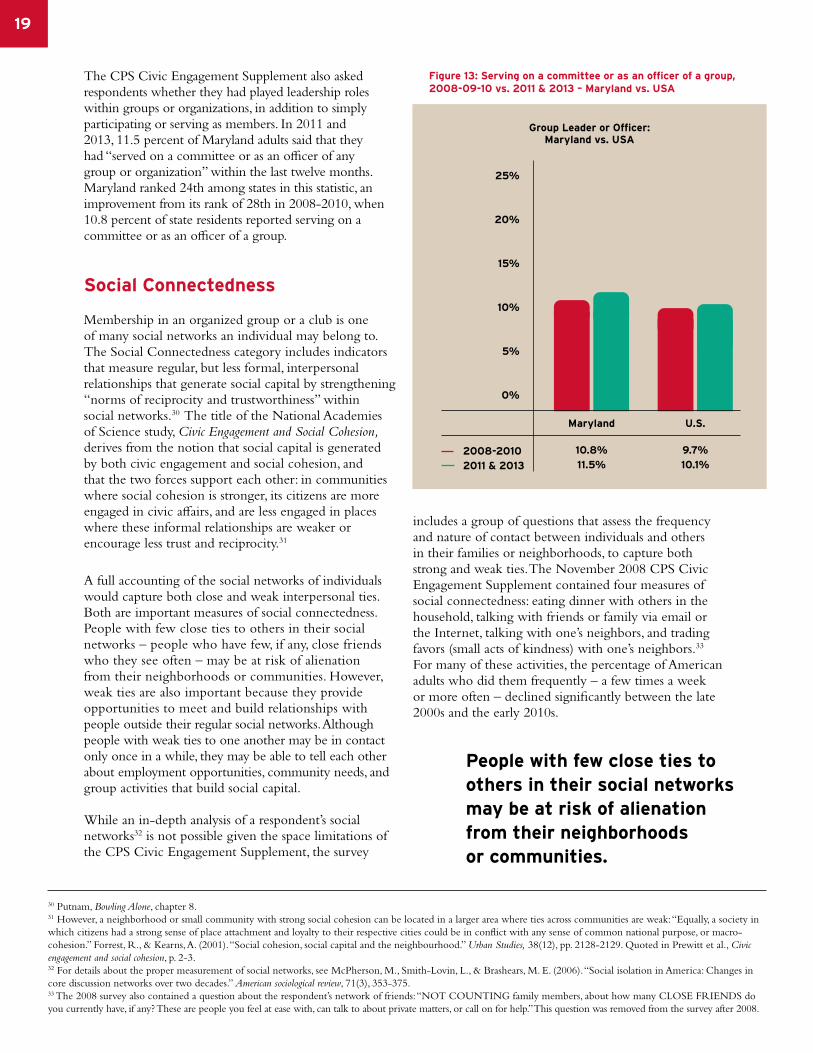
The CPS Civic Engagement Supplement also asked respondents whether they had played leadership roles within groups or organizations, in addition to simply participating or serving as members. In 2011 and 2013, 11.5 percent of Maryland adults said that they had “served on a committee or as an officer of any group or organization” within the last twelve months. Maryland ranked 24th among states in this statistic, an improvement from its rank of 28th in 2008-2010, when 10.8 percent of state residents reported serving on a committee or as an officer of a group.
Social Connectedness
Membership in an organized group or a club is one of many social networks an individual may belong to. The Social Connectedness category includes indicators that measure regular, but less formal, interpersonal relationships that generate social capital by strengthening “norms of reciprocity and trustworthiness” within social networks.30 The title of the National Academies of Science study, Civic Engagement and Social Cohesion, derives from the notion that social capital is generated by both civic engagement and social cohesion, and that the two forces support each other: in communities where social cohesion is stronger, its citizens are more engaged in civic affairs, and are less engaged in places where these informal relationships are weaker or encourage less trust and reciprocity.31
A full accounting of the social networks of individuals would capture both close and weak interpersonal ties. Both are important measures of social connectedness. People with few close ties to others in their social networks – people who have few, if any, close friends who they see often – may be at risk of alienation from their neighborhoods or communities. However, weak ties are also important because they provide opportunities to meet and build relationships with people outside their regular social networks. Although people with weak ties to one another may be in contact only once in a while, they may be able to tell each other about employment opportunities, community needs, and group activities that build social capital.
While an in-depth analysis of a respondent’s social networks32 is not possible given the space limitations of the CPS Civic Engagement Supplement, the survey
includes a group of questions that assess the frequency and nature of contact between individuals and others in their families or neighborhoods, to capture both strong and weak ties. The November 2008 CPS Civic Engagement Supplement contained four measures of social connectedness: eating dinner with others in the household, talking with friends or family via email or the Internet, talking with one’s neighbors, and trading favors (small acts of kindness) with one’s neighbors.33 For many of these activities, the percentage of American adults who did them frequently – a few times a week or more often – declined significantly between the late 2000s and the early 2010s.
Figure 13: Serving on a committee or as an officer of a group, 2008-09-10 vs. 2011 & 2013 – Maryland vs. USA
25%
20%
15%
10%
5%
0%
2008-20102011 & 2013
Maryland
10.8%11.5%
U.S.
9.7%10.1%
Group Leader or Officer:Maryland vs. USA
30 Putnam, Bowling Alone, chapter 8.31 However, a neighborhood or small community with strong social cohesion can be located in a larger area where ties across communities are weak: “Equally, a society in which citizens had a strong sense of place attachment and loyalty to their respective cities could be in conflict with any sense of common national purpose, or macro-cohesion.” Forrest, R., & Kearns, A. (2001). “Social cohesion, social capital and the neighbourhood.” Urban Studies, 38(12), pp. 2128-2129. Quoted in Prewitt et al., Civic engagement and social cohesion, p. 2-3.32 For details about the proper measurement of social networks, see McPherson, M., Smith-Lovin, L., & Brashears, M. E. (2006). “Social isolation in America: Changes in core discussion networks over two decades.” American sociological review, 71(3), 353-375.33 The 2008 survey also contained a question about the respondent’s network of friends: “NOT COUNTING family members, about how many CLOSE FRIENDS do you currently have, if any? These are people you feel at ease with, can talk to about private matters, or call on for help.” This question was removed from the survey after 2008.
People with few close ties to others in their social networks may be at risk of alienation from their neighborhoods or communities.
1
Figure 14: Talking with neighbors a few times a week or more often, 2008-09-10 vs. 2011 & 2013 - Maryland vs. USA
20
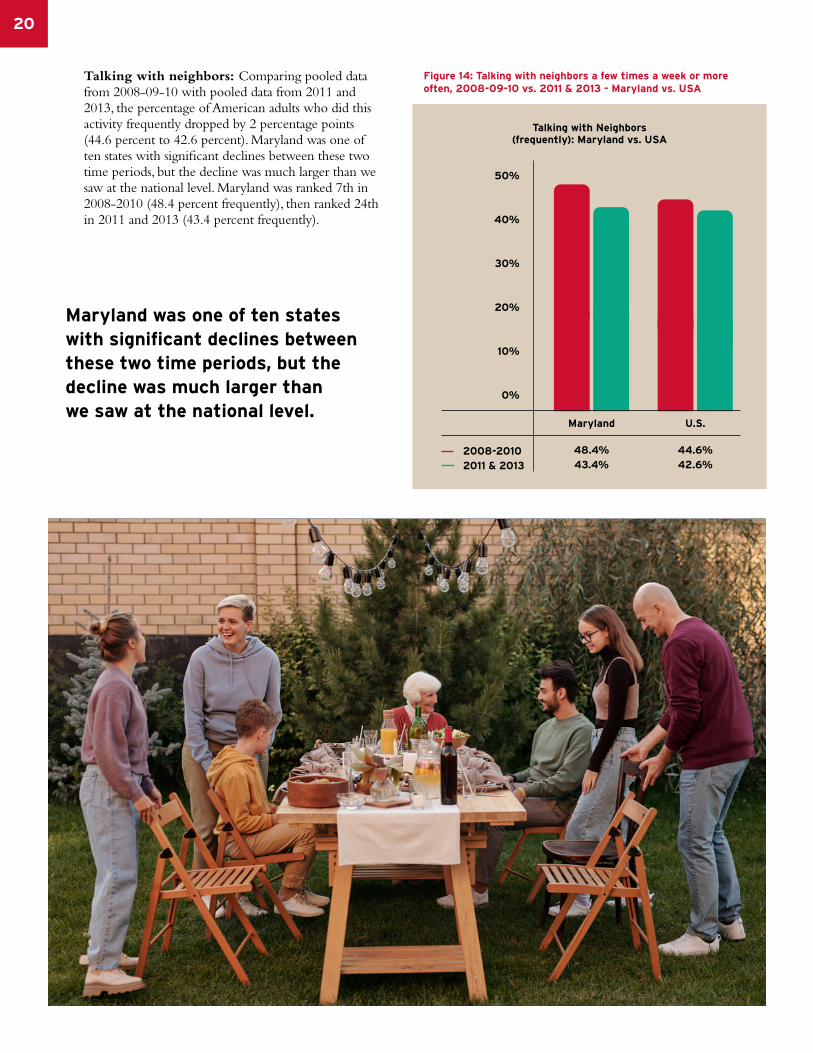
Talking with neighbors: Comparing pooled data from 2008-09-10 with pooled data from 2011 and 2013, the percentage of American adults who did this activity frequently dropped by 2 percentage points (44.6 percent to 42.6 percent). Maryland was one of ten states with significant declines between these two time periods, but the decline was much larger than we saw at the national level. Maryland was ranked 7th in 2008-2010 (48.4 percent frequently), then ranked 24th in 2011 and 2013 (43.4 percent frequently).
50%
40%
30%
20%
10%
0%
2008-20102011 & 2013
Maryland
48.4%43.4%
U.S.
44.6%42.6%
Talking with Neighbors(frequently): Maryland vs. USA
Maryland was one of ten states with significant declines between these two time periods, but the decline was much larger than we saw at the national level.
121
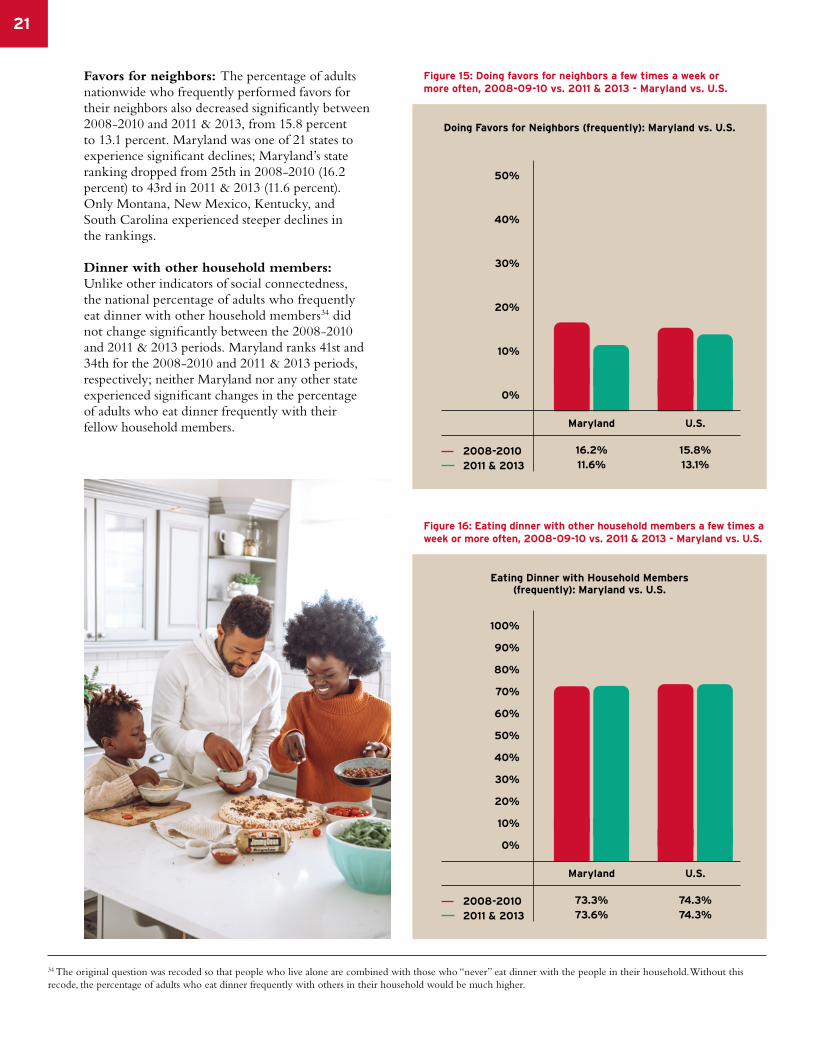
Favors for neighbors: The percentage of adults nationwide who frequently performed favors for their neighbors also decreased significantly between 2008-2010 and 2011 & 2013, from 15.8 percent to 13.1 percent. Maryland was one of 21 states to experience significant declines; Maryland’s state ranking dropped from 25th in 2008-2010 (16.2 percent) to 43rd in 2011 & 2013 (11.6 percent). Only Montana, New Mexico, Kentucky, and South Carolina experienced steeper declines in the rankings.
Dinner with other household members: Unlike other indicators of social connectedness, the national percentage of adults who frequently eat dinner with other household members34 did not change significantly between the 2008-2010 and 2011 & 2013 periods. Maryland ranks 41st and 34th for the 2008-2010 and 2011 & 2013 periods, respectively; neither Maryland nor any other state experienced significant changes in the percentage of adults who eat dinner frequently with their fellow household members.
34 The original question was recoded so that people who live alone are combined with those who “never” eat dinner with the people in their household. Without this recode, the percentage of adults who eat dinner frequently with others in their household would be much higher.
Figure 15: Doing favors for neighbors a few times a week or more often, 2008-09-10 vs. 2011 & 2013 - Maryland vs. U.S.
Figure 16: Eating dinner with other household members a few times a week or more often, 2008-09-10 vs. 2011 & 2013 - Maryland vs. U.S.
50%
40%
30%
20%
10%
0%
100%
90%
80%
70%
60%
50%
40%
30%
20%
10%
0%
2008-20102011 & 2013
2008-20102011 & 2013
Maryland
Maryland
16.2%11.6%
73.3%73.6%
U.S.
U.S.
15.8%13.1%
74.3%74.3%
Doing Favors for Neighbors (frequently): Maryland vs. U.S.
Eating Dinner with Household Members (frequently): Maryland vs. U.S.
122
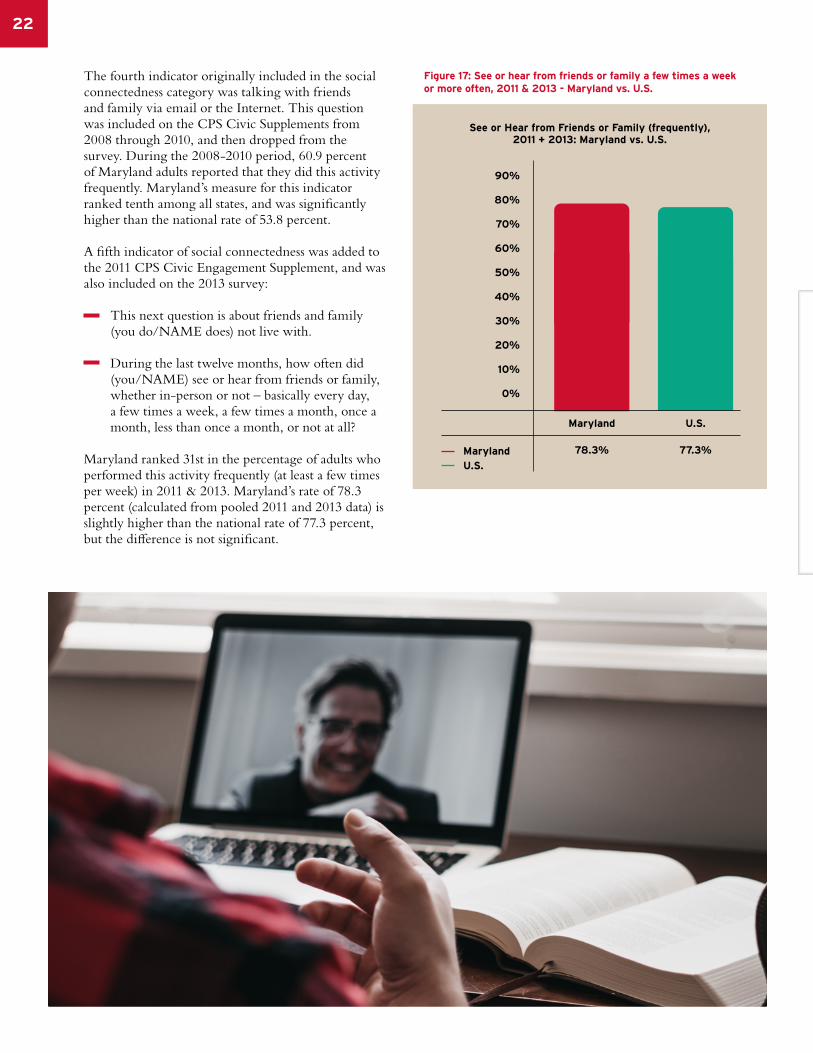
The fourth indicator originally included in the social connectedness category was talking with friends and family via email or the Internet. This question was included on the CPS Civic Supplements from 2008 through 2010, and then dropped from the survey. During the 2008-2010 period, 60.9 percent of Maryland adults reported that they did this activity frequently. Maryland’s measure for this indicator ranked tenth among all states, and was significantly higher than the national rate of 53.8 percent.
A fifth indicator of social connectedness was added to the 2011 CPS Civic Engagement Supplement, and was also included on the 2013 survey:
This next question is about friends and family (you do/NAME does) not live with.
During the last twelve months, how often did (you/NAME) see or hear from friends or family, whether in-person or not – basically every day, a few times a week, a few times a month, once a month, less than once a month, or not at all?
Maryland ranked 31st in the percentage of adults who performed this activity frequently (at least a few times per week) in 2011 & 2013. Maryland’s rate of 78.3 percent (calculated from pooled 2011 and 2013 data) is slightly higher than the national rate of 77.3 percent, but the difference is not significant.
Figure 17: See or hear from friends or family a few times a week or more often, 2011 & 2013 - Maryland vs. U.S.
90%
80%
70%
60%
50%
40%
30%
20%
10%
0%
MarylandU.S.
Maryland
78.3%
U.S.
77.3%
See or Hear from Friends or Family (frequently), 2011 + 2013: Maryland vs. U.S.
123
Staying Informed
Information is a key ingredient in civic life. Societies around the world are recognizing that citizens need access to accurate sources of information about current events to express their opinions about policies that affect their well-being.35 Access to mass media is not sufficient; in Bowling Alone, Robert Putnam argued that passive TV viewing has been one of the main influences on the decline in civic engagement and social capital in modern American society.36 More recently, some scholars have warned that too much online activity can also displace active civic participation, while others have argued that online media, properly used, can actually encourage civic engagement.37
The initial (2008) version of the CPS Civic Engagement Supplement contained several questions about the media that people use to get their news about current events: whether they get their news from reading newspapers or news magazines (print or Internet versions), from television or radio (broadcast of Internet versions), or from blogs, chat rooms or other independent news sources. Several of these questions were also included on CIRCLE’s 2002 survey about the
nation’s civic and political health. Although the news-sources questions were not part of CIRCLE’s 19 core indicators of civic health, they were included in the report in a separate category called Attentiveness.
The questions about how people get current event news from various media were removed from the CPS Civic Engagement Supplement after their inclusion on the 2008 survey. However, another question – about how often the respondent discussed politics with family members or friends – was included on each of the five Civic Supplements. Between 2008-2010 and 2011 & 2013, the percentage of American adults who talked frequently about politics with family or friends declined significantly, from 34.8 percent to 28.1 percent. This percentage also declined in 33 states, including Maryland, where the rate fell from 41.2 percent to 30.5 percent. Because the decline was more pronounced in Maryland than in other states, Maryland’s rank for this indicator fell from 3rd to 18th over this time period.38
35 Grootaert, C., Narayan, D., Jones, V. N., & Woolcock, M. (2004). Measuring social capital: An integrated questionnaire. The World Bank.36 Putnam, Bowling Alone, chapter 13.37 See the literature review in Gil de Zúñiga, H., Jung, N., & Valenzuela, S. (2012). “Social media use for news and individuals’ social capital, civic engagement and political participation.” Journal of Computer-Mediated Communication, 17(3), 319-336.38 Andolina, M., Keeter, S., Zukin, C., & Jenkins, K. (2003). A guide to the index of civic and political engagement. College Park, Maryland: The Center for Information and Research on Civic Learning and Engagement (CIRCLE).
60%
50%
40%
30%
20%
10%
0%
2008
51.3%43.6%
2009
40.1%34.9%
32.2%26.0%
2010
30.4%29.3%
2011 2013
30.7%27.0%
Talking Politics with Friends or Family (frequently) - Maryland vs. U.S.
Figure 18: Discussing politics with family and friends a few times a week or more often – annual rates, Maryland vs. U.S.
MarylandU.S.
24
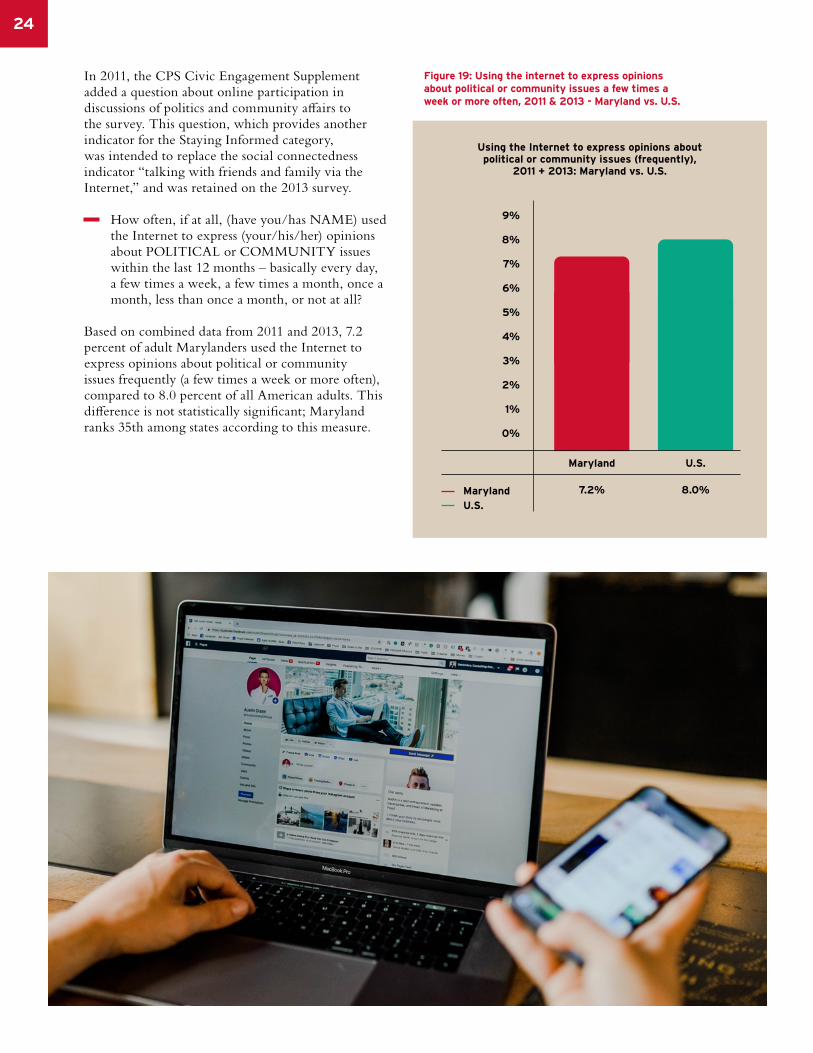
In 2011, the CPS Civic Engagement Supplement added a question about online participation in discussions of politics and community affairs to the survey. This question, which provides another indicator for the Staying Informed category, was intended to replace the social connectedness indicator “talking with friends and family via the Internet,” and was retained on the 2013 survey.
How often, if at all, (have you/has NAME) used the Internet to express (your/his/her) opinions about POLITICAL or COMMUNITY issues within the last 12 months – basically every day, a few times a week, a few times a month, once a month, less than once a month, or not at all?
Based on combined data from 2011 and 2013, 7.2 percent of adult Marylanders used the Internet to express opinions about political or community issues frequently (a few times a week or more often), compared to 8.0 percent of all American adults. This difference is not statistically significant; Maryland ranks 35th among states according to this measure.
Figure 19: Using the internet to express opinions about political or community issues a few times a week or more often, 2011 & 2013 - Maryland vs. U.S.
9%
8%
7%
6%
5%
4%
3%
2%
1%
0%
MarylandU.S.
Maryland
7.2%
U.S.
8.0%
Using the Internet to express opinions about political or community issues (frequently),
2011 + 2013: Maryland vs. U.S.
125
Trust and Confidence in Institutions
Although the concepts of trust in others and confidence in institutions were not part of the original CPS Civic Engagement Supplement (and thus were not included in the 2010 Maryland report), later editions of the supplement contained questions about trust in one’s neighbors and confidence in various social institutions. Civic engagement and trust tend to be mutually reinforcing; when individuals trust others they are more likely to work with them to address community issues, and working with others on community issues tends to generate trust. When individuals develop trust with those outside of their close networks and across cultural, social, and economic divisions, they produce “bridging” or “linking” social capital, and are more likely to collaborate with others of different backgrounds for the common good.39
For this reason, interpersonal or social trust has been used as a primary indicator of social capital in almost all official data collections40 and scholarly studies41 of social capital. The most commonly used survey question about social trust has a distinctive wording: respondents are asked to say whether they believe that “most people can be trusted” or that “you can’t be too careful.” However, the CPS question, which asks about trust in neighbors, has been shown to be highly correlated with measures constructed from the most-used question wording.42
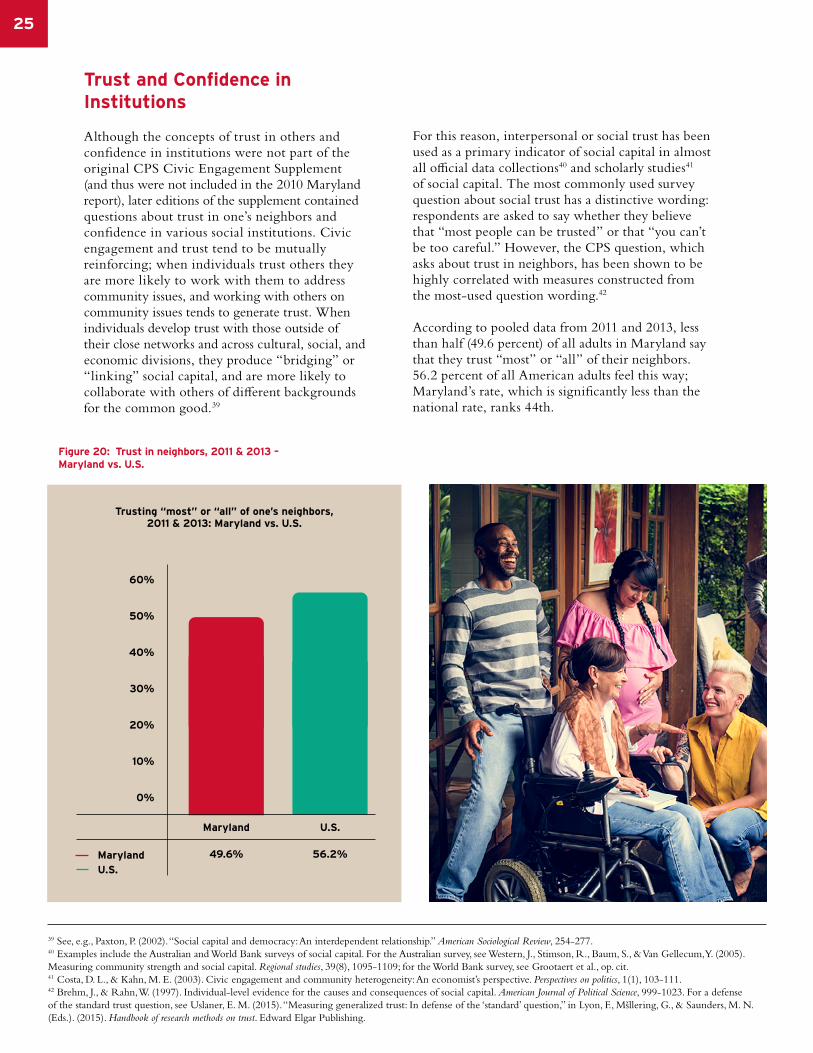
According to pooled data from 2011 and 2013, less than half (49.6 percent) of all adults in Maryland say that they trust “most” or “all” of their neighbors. 56.2 percent of all American adults feel this way; Maryland’s rate, which is significantly less than the national rate, ranks 44th.
39 See, e.g., Paxton, P. (2002). “Social capital and democracy: An interdependent relationship.” American Sociological Review, 254-277.40 Examples include the Australian and World Bank surveys of social capital. For the Australian survey, see Western, J., Stimson, R., Baum, S., & Van Gellecum, Y. (2005). Measuring community strength and social capital. Regional studies, 39(8), 1095-1109; for the World Bank survey, see Grootaert et al., op. cit.41 Costa, D. L., & Kahn, M. E. (2003). Civic engagement and community heterogeneity: An economist’s perspective. Perspectives on politics, 1(1), 103-111. 42 Brehm, J., & Rahn, W. (1997). Individual-level evidence for the causes and consequences of social capital. American Journal of Political Science, 999-1023. For a defense of the standard trust question, see Uslaner, E. M. (2015). “Measuring generalized trust: In defense of the ‘standard’ question,” in Lyon, F., Mšllering, G., & Saunders, M. N. (Eds.). (2015). Handbook of research methods on trust. Edward Elgar Publishing.
Figure 20: Trust in neighbors, 2011 & 2013 – Maryland vs. U.S.
60%
50%
40%
30%
20%
10%
0%
MarylandU.S.
Maryland
49.6%
U.S.
56.2%
Trusting “most” or “all” of one’s neighbors, 2011 & 2013: Maryland vs. U.S.
126
The public’s perception of major political and social institutions can also influence the nature of social interactions between groups or people.43 The Canadian government includes measures of trust and confidence in the nation’s most prominent institutions, both because these statistics serve as measures of the institutions’ performance and satisfaction with the services they deliver, and because “higher levels of confidence and satisfaction in public institutions has been found to foster a sense of belonging to the country and greater social cohesion.”44
In America, confidence in many different types of institutions – both governmental and social – has dropped in recent years.45 The CPS measures, which come from data collected in 2011 and 2013, show that most Americans – and most Marylanders – have at least some confidence in three major types of institutions: corporations, the media, and public schools.
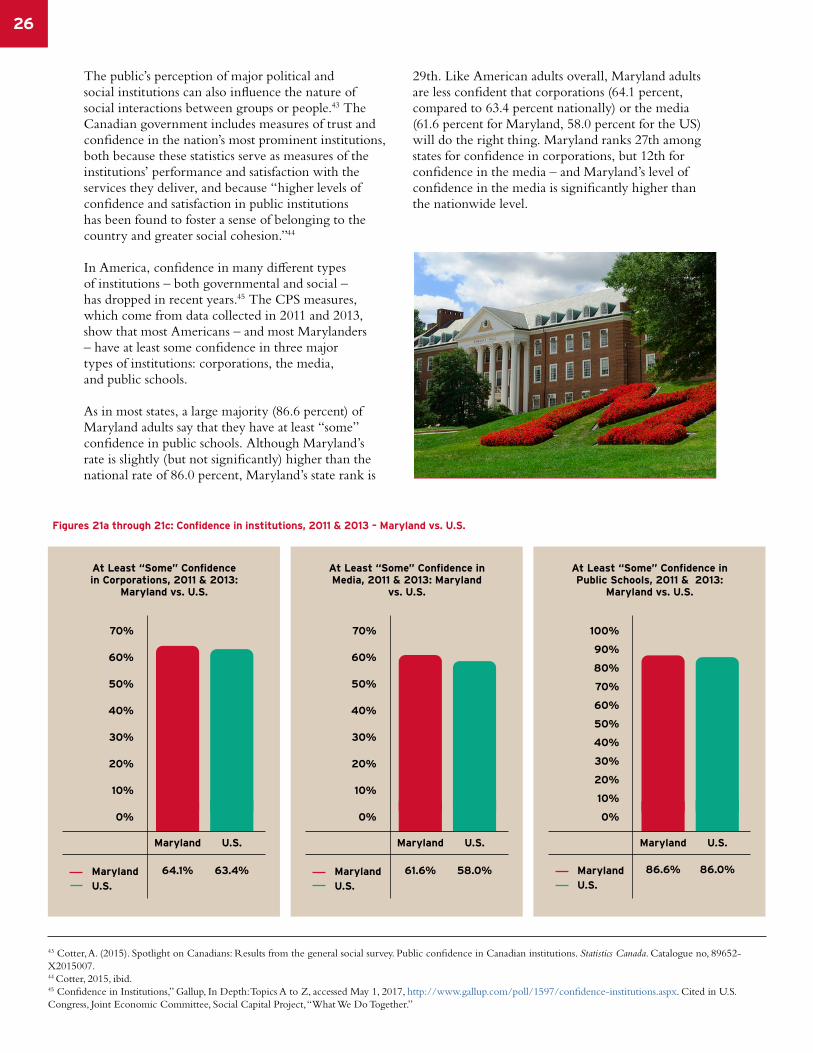
As in most states, a large majority (86.6 percent) of Maryland adults say that they have at least “some” confidence in public schools. Although Maryland’s rate is slightly (but not significantly) higher than the national rate of 86.0 percent, Maryland’s state rank is
29th. Like American adults overall, Maryland adults are less confident that corporations (64.1 percent, compared to 63.4 percent nationally) or the media (61.6 percent for Maryland, 58.0 percent for the US) will do the right thing. Maryland ranks 27th among states for confidence in corporations, but 12th for confidence in the media – and Maryland’s level of confidence in the media is significantly higher than the nationwide level.
43 Cotter, A. (2015). Spotlight on Canadians: Results from the general social survey. Public confidence in Canadian institutions. Statistics Canada. Catalogue no, 89652-X2015007.44 Cotter, 2015, ibid.45 Confidence in Institutions,” Gallup, In Depth: Topics A to Z, accessed May 1, 2017, http://www.gallup.com/poll/1597/confidence-institutions.aspx. Cited in U.S. Congress, Joint Economic Committee, Social Capital Project, “What We Do Together.”
Figures 21a through 21c: Confidence in institutions, 2011 & 2013 – Maryland vs. U.S.
70%
60%
50%
40%
30%
20%
10%
0%
70%
60%
50%
40%
30%
20%
10%
0%
100%
90%
80%
70%
60%
50%
40%
30%
20%
10%
0%
MarylandU.S.
MarylandU.S.
MarylandU.S.
Maryland Maryland Maryland
64.1% 61.6% 86.6%
U.S. U.S. U.S.
63.4% 58.0% 86.0%
At Least “Some” Confidence in Corporations, 2011 & 2013:
Maryland vs. U.S.
At Least “Some” Confidence in Media, 2011 & 2013: Maryland
vs. U.S.
At Least “Some” Confidence in Public Schools, 2011 & 2013:
Maryland vs. U.S.
1
In recent years, interest in the civic health of the United States has risen to their highest levels since at least the publication of Bowling Alone twenty years ago. A recent research project initiated by the Joint Economic Committee of the U.S. Congress, the Social Capital Project, has released several research reports that describe the associational and personal relationships within contemporary American society.46 Like the Social Capital Project, this report builds on previous research to focus on the question of how civic health has changed in America in the twenty years since the concept of “social capital” fell into wide use among academic and popular audiences.
In this report, we use data collected by the U.S. Census Bureau – the Current Population Survey Supplements on Civic Engagement, Volunteering, and Voting & Registration – to learn how civic engagement in Maryland changed from the mid-2000s to the mid-2010s. The results raise questions about why civic life in Maryland is the way it is, and what we can do to improve the current state of affairs. Although the report sheds some light on the nature of Maryland’s civic health, many important questions largely remain unanswered and need further exploration. These questions include:
Why don’t Marylanders vote in local elections? Adults in Maryland seem to register and vote in national elections at rates that are comparable to other states, and seem to be ahead of the curve when it comes to non-electoral participation. However, Marylanders vote less often in local elections than Americans do nationwide, and Maryland’s turnout rate for local elections ranks 44th.
How can we improve associational life in Maryland and capitalize on its strengths? Throughout the period covered by the CPS data, Maryland had above-average giving and volunteer rates. Unlike the national volunteer rate, Maryland’s rate has held steady, statistically speaking, from the mid-2000s to the mid-2010. Moreover, Marylanders are significantly more likely to participate in groups – especially school groups, where Maryland is near the top of the state rankings – than Americans in general are. These statistics suggest that associational life is alive and well in Maryland, relative to other states, but there is nonetheless room for improvement.
Why is the decline in social connectedness so pronounced in Maryland? While Marylanders may be more likely than most Americans to serve their communities through formal groups and organizations, the state is slipping in several key indicators of social
cohesion. For indicators where we can measure change over time, the trends in Maryland are troubling: although the data suggest that social cohesion is declining nationally, the declines are especially pronounced in Maryland. For example:
• The percentage of adults who talked about politics with family and friends frequently (a few times a week or more often) declined significantly in the U.S. and in 33 states, including Maryland. However, Maryland’s state rank fell from 3rd in 2008-2010 to 15th in 2011 & 2013.
• The percentage of adults who talked with neighbors frequently declined significantly in the U.S. and in 10 states, including Maryland. Maryland’s state rank fell from 7th in 2008-2010 to 24th in 2011 & 2013.
• The percentage of adults who reported doing favors for their neighbors frequently declined significantly in the U.S. and in 21states, including Maryland. However,
Maryland’s state rank fell from 25th in 2008-2010 to 43rd in 2011 & 2013.
In addition, only 49.6 percent of Marylanders feel they can trust all or most of their neighbors, compared to 56.2 percent of American adults nationwide. Maryland ranks 44th among all states for this metric; only Nevada and the District of Columbia have rates that are significantly lower during 2011 & 2013.
These results suggest that Maryland residents are adept at forming bonding social capital (close relationships with people who are similar to themselves) but behind the curve when it comes to bridging social capital (strengthening relationships with others from outside our usual social networks). Maryland seems to illustrate a point made by scholars of civic engagement, who have observed that participation in associational life47 does not necessarily build social cohesion or encourage political participation.
While Marylanders are willing to work together voluntarily in groups of their own choosing, they struggle more with forming productive relations with their neighbors that would strengthen social cohesion within diverse communities. The challenge for Marylanders – residents, community leaders, and policymakers alike – will be to use the strengths of the state’s civic life to improve its overall civic health.
Conclusion
46 U.S. Congress, Joint Economic Committee, Social Capital Project, “What We Do Together: The State of Associational Life in America,” report prepared by the Vice Chairman’s staff, 115th Cong., 1st Sess. (May 2017), Available at https://www.lee.senate.gov/public/_cache/files/b5f224ce-98f7-40f6-a814-8602696714d8/what-we-do-together.pdf. 47 Theiss-Morse, E., & Hibbing, J. R. (2005). Citizenship and civic engagement. Annual Review of Political Science, 8, 227-249.
27
1
Most of the figures in this brief are based on annual data from the CPS Volunteer, Voting and Registration and Civic Engagement Supplements. In each case, the statistics are calculated using weights that account for the sample design, population characteristics, and nonresponse to the baseline labor force survey and the Volunteer Supplement. To measure changes over time, we use formulas that accounts for the 50 percent overlap between CPS Volunteer Supplement samples to calculate confidence intervals around the difference statistics. Details about the procedures we use can be found in the Census publication “Source and Accuracy of Estimates for Income and Poverty in the United States: 2016 and Health Insurance Coverage in the United States: 2016.”48
CPS Supplement on Volunteering (annual, September 2002 through 2015)
Between 2002 and 2015, the CPS Volunteer Supplement survey (conducted in September) began by asking respondents two primary questions about their activities in the preceding twelve months:
This month, we are interested in volunteer activities, that is activities for which people are not paid, except perhaps expenses. We only want you to include volunteer activities that (you/NAME) did through or for an organization, even if (you/he/she) only did them once in a while.
Since September 1st of last year, (have you/has NAME) done any volunteer activities through or for an organization?
Sometimes people don’t think of activities they do infrequently or activities they do for children’s schools or youth organizations as volunteer activities. Since September 1st of last year, (have you/has he/has she) done any of these types of volunteer activities?
The respondent was counted as a volunteer if he or she answered “yes” to either of these two questions.
In 2006, in recognition of the limitations of only studying formal volunteering, two long-standing and extensively used civic questions were added:
Now I’d like to ask about some of (your/NAMES) involvement in (your/his/her) community. Since (September 1st of the previous year), (have you/has he/has she) attended any public meetings in which there was discussion of community affairs?
Since (September 1st of the previous year), (have you/has he/has she) worked with other people from (your/his/her) neighborhood to fix a problem or improve a condition in your community or elsewhere?
Finally, in 2008, a question about giving to charity was added:
During the (previous year), did [you or anyone in your family] donate money, assets, or property with a combined value of more than $25 to religious or charitable organizations?
This question is the first of several questions about charitable contributions that have been added to the Panel Study of Income Dynamics (PSID), a nationally representative longitudinal study that has collected data from a national sample of families and households for over forty years. The PSID data are used for the landmark Philanthropy Panel Study (PPS), which has been conducted by Indiana University’s Lilly Family School of Philanthropy since 2002. Given the space considerations on the CPS Volunteer Supplement, none of the PPS follow-up prompts, including questions about the amount contributed or the type of organization receiving the contribution, were added along with this question.
All statistics calculated from the CPS Volunteer Supplement are based on the population of Americans aged 16 and over living in non-institutional civilian households. For the Volunteer Supplement, the 16-and-over population is considered the “adult” population. This follows the convention used by the Bureau of Labor Statistics (BLS) in the annual brief series, Volunteering in the United States. BLS imposes a minimum age of 16 for measures of volunteer work because, in most states, residents must be 16 to work for pay full-time without their parents’ permission.
Appendix
48 This publication is available at https://www2.census.gov/library/publications/2017/demo/p60-259sa.pdf.
28
129
CPS Supplement on Voting and Registration (every other year, November 2002 through 2018)
Our source for voting and registration data is the CPS Voting Supplement, on which the wording of the first two questions has remained unchanged for over thirty years:
In any election, some people are not able to vote because they are sick or busy or have someother reason, and others do not want to vote. Did (you/name) vote in the election held onTuesday, November X, XXXX?
[if respondent did not vote] (Were you/Was name) registered to vote in the November X, 20XX election?
For many years, the CPS Voting Supplement has also asked respondents how long they have been living at the same address:
How long (have you/has name) lived at this address?
(1) Less than 1 month
(2) 1-6 months
(3) 7-11 months
(4) 1-2 years
(5) 3-4 years
(6) 5 years or longer
All statistics calculated from the CPS Voting and Registration Supplement are based on the voting-age population (ages 18 and over).
CPS Supplement on Civic Engagement (November 2008, 2009, 2010, 2011 and 2013)
The original CPS Civic Engagement Supplement, fielded in November 2008, was the data source for many of the indicators used in the 2010 national Civic Health Assessment report and the Maryland Civic Health Index report. Several questions were added to and removed from the Civic Engagement Supplement between 2008 and 2013, but many of the key questions were retained on most or all of the surveys.
Political Action: The 2008 CPS Civic Engagement Supplement asked respondents whether they had engaged in several types of nonelectoral political activities:
I am going to read a list of things some people have done to express their views. Please tell me whether or not you have done any of the following in the last 12 months, that is between November 2007 and now:
a) Contacted or visited a public official - at any level of government - to express your opinion?
b) Attended a meeting where political issues are discussed?
c) Bought or boycotted a certain product or service because of the social or political values of the company that provides it?
d) Taken part in a march, rally, protest or demonstration?
e) Showed support for a particular political candidate or party by distributing campaign materials, fundraising, making a donation or in some other way?
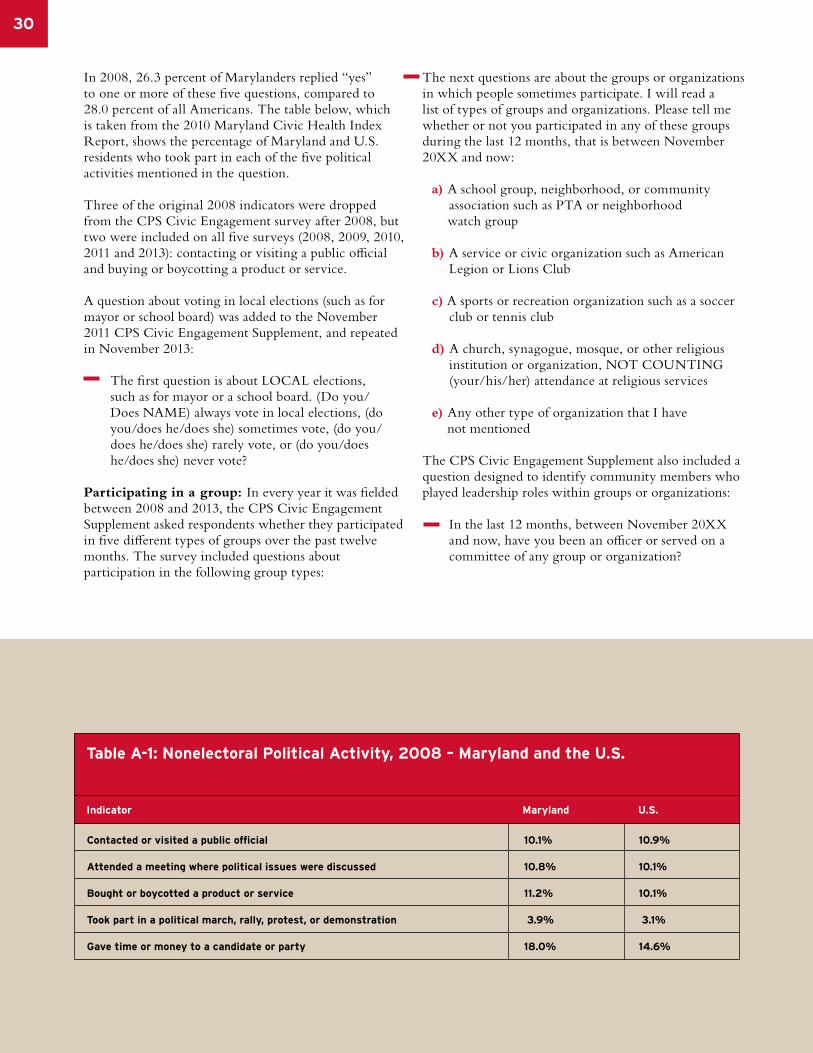
130
Contacted or visited a public official
Attended a meeting where political issues were discussed
Bought or boycotted a product or service
Took part in a political march, rally, protest, or demonstration
Gave time or money to a candidate or party
Table A-1: Nonelectoral Political Activity, 2008 – Maryland and the U.S.
Indicator Value U.S.Maryland
10.1%
10.8%
11.2%
3.9%
18.0%
10.9%
10.1%
10.1%
3.1%
14.6%
In 2008, 26.3 percent of Marylanders replied “yes” to one or more of these five questions, compared to 28.0 percent of all Americans. The table below, which is taken from the 2010 Maryland Civic Health Index Report, shows the percentage of Maryland and U.S. residents who took part in each of the five political activities mentioned in the question.
Three of the original 2008 indicators were dropped from the CPS Civic Engagement survey after 2008, but two were included on all five surveys (2008, 2009, 2010, 2011 and 2013): contacting or visiting a public official and buying or boycotting a product or service.
A question about voting in local elections (such as for mayor or school board) was added to the November 2011 CPS Civic Engagement Supplement, and repeated in November 2013:
The first question is about LOCAL elections, such as for mayor or a school board. (Do you/Does NAME) always vote in local elections, (do you/does he/does she) sometimes vote, (do you/does he/does she) rarely vote, or (do you/does he/does she) never vote?
Participating in a group: In every year it was fielded between 2008 and 2013, the CPS Civic Engagement Supplement asked respondents whether they participated in five different types of groups over the past twelve months. The survey included questions about participation in the following group types:
The next questions are about the groups or organizations in which people sometimes participate. I will read a list of types of groups and organizations. Please tell me whether or not you participated in any of these groups during the last 12 months, that is between November 20XX and now:
a) A school group, neighborhood, or community association such as PTA or neighborhood
watch group
b) A service or civic organization such as American Legion or Lions Club
c) A sports or recreation organization such as a soccer club or tennis club
d) A church, synagogue, mosque, or other religious institution or organization, NOT COUNTING (your/his/her) attendance at religious services
e) Any other type of organization that I have not mentioned
The CPS Civic Engagement Supplement also included a question designed to identify community members who played leadership roles within groups or organizations:
In the last 12 months, between November 20XX and now, have you been an officer or served on a committee of any group or organization?
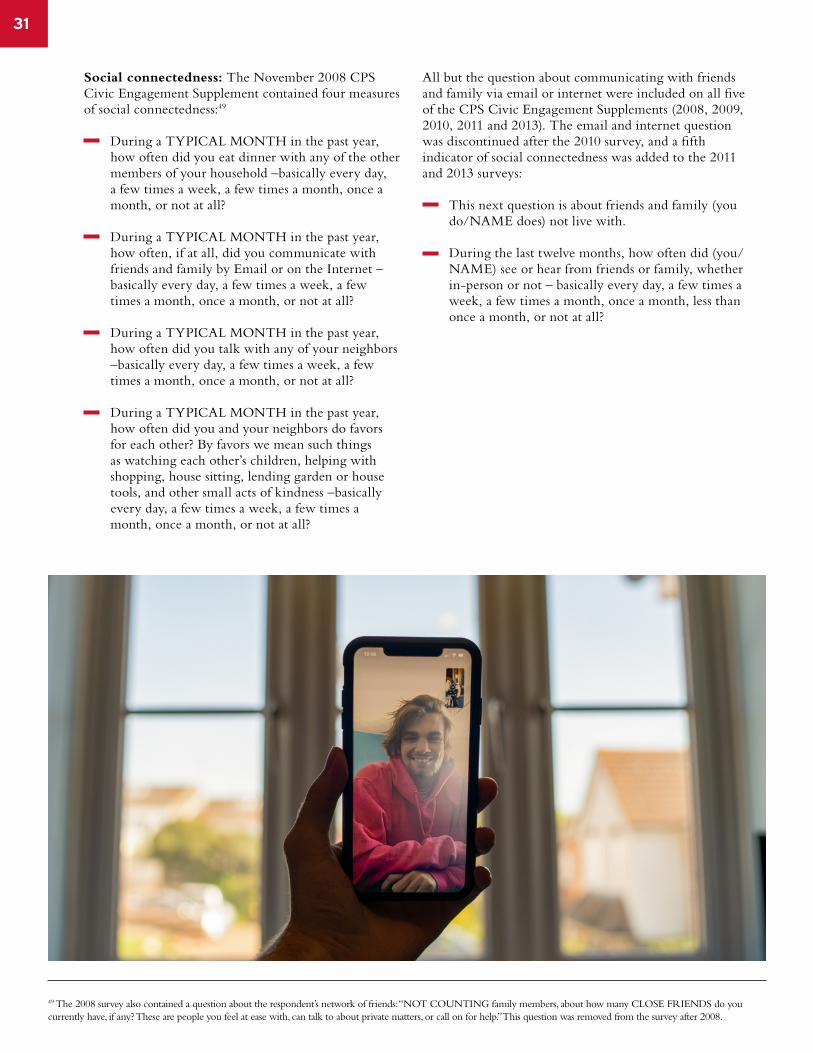
131
Social connectedness: The November 2008 CPS Civic Engagement Supplement contained four measures of social connectedness:49
During a TYPICAL MONTH in the past year, how often did you eat dinner with any of the other members of your household –basically every day, a few times a week, a few times a month, once a month, or not at all?
During a TYPICAL MONTH in the past year, how often, if at all, did you communicate with friends and family by Email or on the Internet –basically every day, a few times a week, a few times a month, once a month, or not at all?
During a TYPICAL MONTH in the past year, how often did you talk with any of your neighbors –basically every day, a few times a week, a few times a month, once a month, or not at all?
During a TYPICAL MONTH in the past year, how often did you and your neighbors do favors for each other? By favors we mean such things as watching each other’s children, helping with shopping, house sitting, lending garden or house tools, and other small acts of kindness –basically every day, a few times a week, a few times a month, once a month, or not at all?
All but the question about communicating with friends and family via email or internet were included on all five of the CPS Civic Engagement Supplements (2008, 2009, 2010, 2011 and 2013). The email and internet question was discontinued after the 2010 survey, and a fifth indicator of social connectedness was added to the 2011 and 2013 surveys:
This next question is about friends and family (you do/NAME does) not live with.
During the last twelve months, how often did (you/NAME) see or hear from friends or family, whether in-person or not – basically every day, a few times a week, a few times a month, once a month, less than once a month, or not at all?
49 The 2008 survey also contained a question about the respondent’s network of friends: “NOT COUNTING family members, about how many CLOSE FRIENDS do you currently have, if any? These are people you feel at ease with, can talk to about private matters, or call on for help.” This question was removed from the survey after 2008.
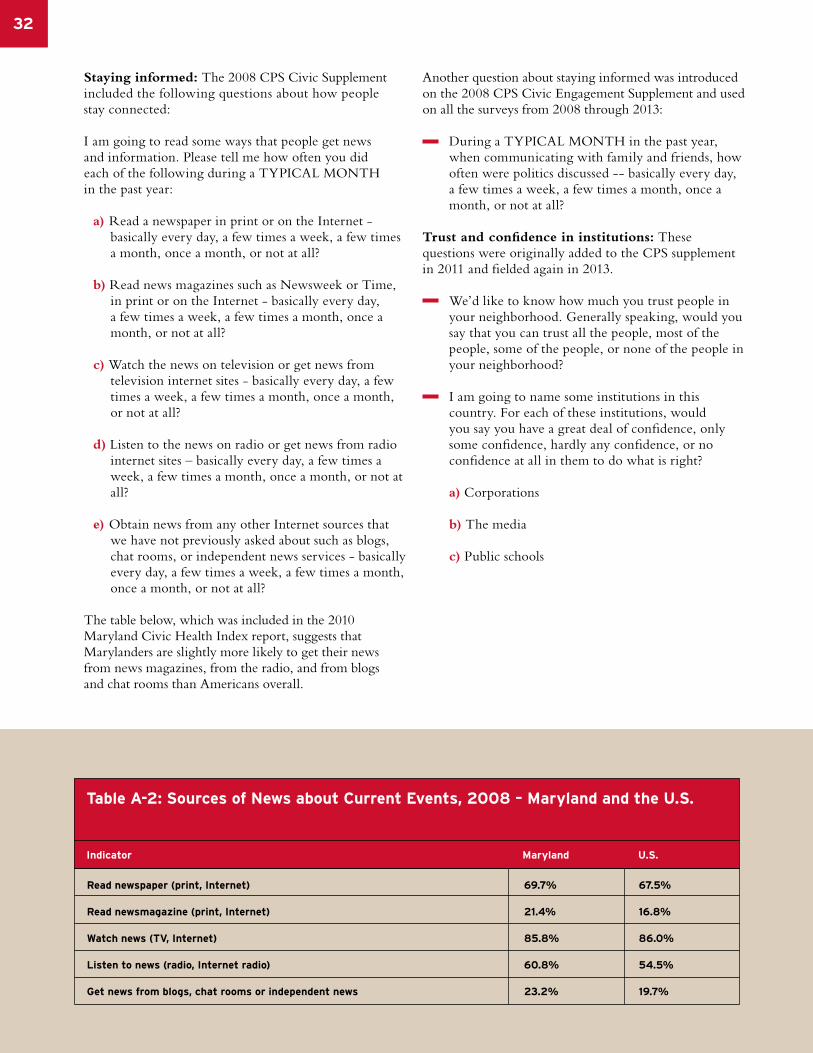
132
Read newspaper (print, Internet)
Read newsmagazine (print, Internet)
Watch news (TV, Internet)
Listen to news (radio, Internet radio)
Get news from blogs, chat rooms or independent news
Table A-2: Sources of News about Current Events, 2008 – Maryland and the U.S.
Indicator Value U.S.Maryland
69.7%
21.4%
85.8%
60.8%
23.2%
67.5%
16.8%
86.0%
54.5%
19.7%
Staying informed: The 2008 CPS Civic Supplement included the following questions about how people stay connected:
I am going to read some ways that people get news and information. Please tell me how often you did each of the following during a TYPICAL MONTH in the past year:
a) Read a newspaper in print or on the Internet - basically every day, a few times a week, a few times a month, once a month, or not at all?
b) Read news magazines such as Newsweek or Time, in print or on the Internet - basically every day, a few times a week, a few times a month, once a month, or not at all?
c) Watch the news on television or get news from television internet sites - basically every day, a few times a week, a few times a month, once a month, or not at all?
d) Listen to the news on radio or get news from radio internet sites – basically every day, a few times a week, a few times a month, once a month, or not at all?
e) Obtain news from any other Internet sources that we have not previously asked about such as blogs, chat rooms, or independent news services - basically every day, a few times a week, a few times a month, once a month, or not at all?
The table below, which was included in the 2010 Maryland Civic Health Index report, suggests that Marylanders are slightly more likely to get their news from news magazines, from the radio, and from blogs and chat rooms than Americans overall.
Another question about staying informed was introduced on the 2008 CPS Civic Engagement Supplement and used on all the surveys from 2008 through 2013:
During a TYPICAL MONTH in the past year, when communicating with family and friends, how often were politics discussed -- basically every day, a few times a week, a few times a month, once a month, or not at all?
Trust and confidence in institutions: These questions were originally added to the CPS supplement in 2011 and fielded again in 2013.
We’d like to know how much you trust people in your neighborhood. Generally speaking, would you say that you can trust all the people, most of the people, some of the people, or none of the people in your neighborhood?
I am going to name some institutions in this country. For each of these institutions, would you say you have a great deal of confidence, only some confidence, hardly any confidence, or no confidence at all in them to do what is right?
a) Corporations
b) The media
c) Public schools
133
CPS Supplement on Volunteering and Civic Engagement (September 2017 and 2019)
In September 2017, the Census Bureau fielded the initial CPS Supplement on Volunteering and Civic Life, which combined questions and topics formerly covered by the 2002-2015 Volunteer Supplement and the 2008-2013 Civic Engagement Supplement. The 2017 supplement was administered again in September 2019, with a few questions deleted from the 2017 questionnaire, but the wording changes retained.
Although the 2017 Supplement questionnaire contained questions on volunteering with an organization and donating to charity, as well as other civic engagement indicators, the 2017 survey changed the wording for almost all questions, which makes it difficult to compare statistics from the 2017 supplement with statistics from earlier supplements. For this reason, data from these later CPS supplements are not included in this report.
In the 2015 CPS Volunteer Supplement (as on the surveys from 2002 through 2015), the preamble to the survey read:
This month, we are interested in volunteer activities, that is, activities for which people are not paid, except perhaps expenses.
We only want you to include volunteer activities that (you/NAME) did through or for an organization, even if (you/he/she) only did them once in a while.
The volunteer prompts were the first two questions on the survey:
(S1) Since September 1st of last year, (have you/has NAME) done any volunteer activities through or for an organization?
(S2) Sometimes people don’t think of activities they do infrequently or activities they do for children’s schools or youth organizations as volunteer activities. Since September 1st of last year, (have you/has he/has she) done any of these types of volunteer activities?
People were only asked S2 if they said no to S1; a person was coded as a volunteer if they said yes to either S1 and S2.
In 2017, the preamble was:
This month, we are interested in Volunteering and Civic activities, that is how people in America interact with and relate to each other, as well as how we work together to make changes in our communities and country.
The volunteering prompts were near the end of the survey:
(S16) [In the past 12 months,] did [you/[NAME]] spend any time volunteering for any organization or association?
(S17) Some people don’t think of activities they do infrequently or for children’s schools or youth organizations as volunteer activities. In the past 12 months (have you/has she/has he) done any of these types of activities?
Volunteers were coded the same way as before, based on their responses to these two questions.
The overall response rate for the September 2017 Volunteering and Civic Life Supplement was much lower than was observed during 2002-2015. The likelihood, based on prior research on the estimation of volunteer rates,50 is that the lower response rate probably resulted in an upward bias on the estimated volunteer rate. In addition to the lower overall response rate – which was caused by the fact that CPS households are just less likely to decide to answer the questions on the supplement than they were in previous years – it is likely that nonresponse bias was also introduced by the placement of the volunteer questions on the 2017 survey. As respondents progressed through the survey, nonresponse became increasingly frequent on the later questions, potentially because the nonrespondents found the questions about family life and social activities too intrusive. If these dropouts were also less likely to be volunteers, then the placement of the volunteer questions on the 2017 supplement contributed to the upward bias on the estimated volunteer rate.
50 Abraham, Katharine G., Sara Helms, and Stanley Presser. “How social processes distort measurement: The impact of survey nonresponse on estimates of volunteer work in the United States.” American Journal of Sociology 114, no. 4 (2009): 1129-1165. Available at https://www.journals.uchicago.edu/doi/pdfplus/10.1086/595945.

136
Do Good Institute2105 Susquehanna HallCollege Park, Maryland 20742
dogood.umd.eduemail: [email protected]
DoGoodatUMD
DoGoodatUMD
company/dogoodinstitute
@DoGoodatUMD
Find Us on Social: