Embed Size (px)
Citation preview
8/3/2019 Maryland; Bay Grasses: It’s What’s for Dinner
http://slidepdf.com/reader/full/maryland-bay-grasses-its-whats-for-dinner 1/8
SAV… It’s What’s For Dinner
Bay Grasses in Classes 81
SAV… It’s What’s for DinnerDeveloped by Martha Shaum, Aquatic Resources Education Program,
Maryland Department of Natural Resources
Overview: Students plot SAV acreage andcanvasback and redhead duck populations to analyze
the link between bay grass and waterfowl.
Objectives:
Students will be able to:
• Correlate the decline of SAV to the decreasingpopulations of canvasback ducks and other
waterfowl.
• Understand that some species of waterfowl havebeen able to change their dietary habits to
compensate for the loss of SAV.
Materials:
• Student worksheet
• Computers with graphing program (Excel) or graphpaper and colored pencils
• USGS article, Diving Duck Distribution,
Abundance, and Food Habits in Chesapeake Bay byPerry, Osenton and Lohnes
Maryland Voluntary State Curriculum:
Middle
School 1.C.1.a Organize and present data in tables and graphs and identify the relationships they
reveal. Grade 6 3.D.1 Explain that in any particular environment, the growth and survival of organisms
and species depend on the physical conditions. 3.F.1.a Explain that populations increase or decrease relative to the availability of resources
and the conditions of the environment. Grade 7 3.E.1 Explain that the transfer and transformation of matter and energy links organisms to
one another and to their physical setting. 6.B.1 Recognize and describe that environmental changes can have local, regional and
global consequences. Grade 8 3.D.1.B Recognize that adaptations may include variations in structures, behaviors, or
physiology.
Grade Level: MiddleSchool
Subject Areas: Lifescience, environmentalscience, mathematics
Duration: 45 minutes
8/3/2019 Maryland; Bay Grasses: It’s What’s for Dinner
http://slidepdf.com/reader/full/maryland-bay-grasses-its-whats-for-dinner 2/8
SAV… It’s What’s For Dinner
Bay Grasses in Classes 82
Teacher Background:
Submerged aquatic vegetation is important to the Bay ecosystem for a number of reasons.
The roots, rhizomes and stolons help reduce erosion and provide shelter for benthicinvertebrates. The leaves provide shelter, support and an increased oxygen supply for
many species of aquatic animals. The plants are also a source of food for a large numberof aquatic invertebrates and fishes, and for other birds and mammals that visit aquatic
habitats. SAV also uses dissolved nutrients for growth, which helps reduce algae bloomsby making the nutrients unavailable for the algae. But one of its most overlooked
functions is its food value for many species of waterfowl, including canvasbacks andredhead ducks. The tubers and seeds are especially nutritious, but leaves, stems and roots
are also eaten.
Canvasback ducks ( Aythya valisineria) traditionally depended on the tubers of wildcelery (Vallisneria americana) for food during migration and over the winter. This
relationship is reflected in their scientific names. The canvasback’s large webbed feet areadapted for diving and their bills are designed for digging the tubers out of the substrate.
In the late 1930s, studies showed that four-fifths of the food eaten by canvasbacks was
plant material.
In the early 1950s there were 225,000 canvasbacks wintering in the Chesapeake; this
represented one-half of the entire North American population. By 1985, there were only50,000 ducks wintering here or one-tenth of the population. Canvasbacks were
extensively hunted around the turn of the century, but federal hunting regulations restricttheir harvest, so hunting was ruled out as a cause for the decline. Scientists have now
concluded that the decline in duck populations was due to the decline in SAV acreage.
An interesting thing has happened, however. While nowhere as common as they oncewere, the population of canvasbacks has stabilized and is even increasing slightly. Studies
have now shown that by the 1970s four fifths of the ducks’ diet was made up of Balticclams, which are very common in the Bay. The ducks have been able to adapt to the
decline in SAV by changing their diet! Unfortunately, redhead ducks, which also feed onSAV tubers, have not been able to adapt, and their population remains low.
8/3/2019 Maryland; Bay Grasses: It’s What’s for Dinner
http://slidepdf.com/reader/full/maryland-bay-grasses-its-whats-for-dinner 3/8
SAV… It’s What’s For Dinner
Bay Grasses in Classes 83
Activity:
1. Engage students in a brainstorming discussion. Record answers on the board orhave students take notes.
o Write the words “canvasback duck” and “wild celery” on the board and ask
the students if they see any connection between these words.o Then write the words “Aythya valisineria” and “Vallisneria americana” on the
board.
• Explain that these are the scientific names for the canvasback duck andwild celery. Is there a connection? They should come to the conclusion
that canvasbacks probably eat wild celery.
• How about “redhead ducks” and “redhead grass”? The connection is the
same. Both species depended on SAV as a main component of their diet.
o The students should know that the amount of SAV has declined significantlyin the Bay. Tell them that they are going to find out what impact the decline in
SAV has had on the populations of canvasback ducks and redhead ducks.
2. Allow students to complete the “SAV: It’s What’s for Dinner” student worksheet.They will graph the data given to them, using a computer spreadsheet or by hand,
using colored pencils and graph paper.
3. Have students read the article Diving Duck Distribution, Abundance, and Food
Habits in Chesapeake Bay by Perry, Osenton and Lohnes in order to determine if
and how canvasbacks and redhead ducks have adapted to the decline of SAV.
Extensions…
Students might want to research other waterfowl to see if theirdiets have changed. For example, Canada geese and tundraswans have learned to feed on corn and other grains left afterharvesting.
8/3/2019 Maryland; Bay Grasses: It’s What’s for Dinner
http://slidepdf.com/reader/full/maryland-bay-grasses-its-whats-for-dinner 4/8
SAV… It’s What’s For Dinner
Bay Grasses in Classes 84
Answers to Student Worksheet:
Sample Graph:
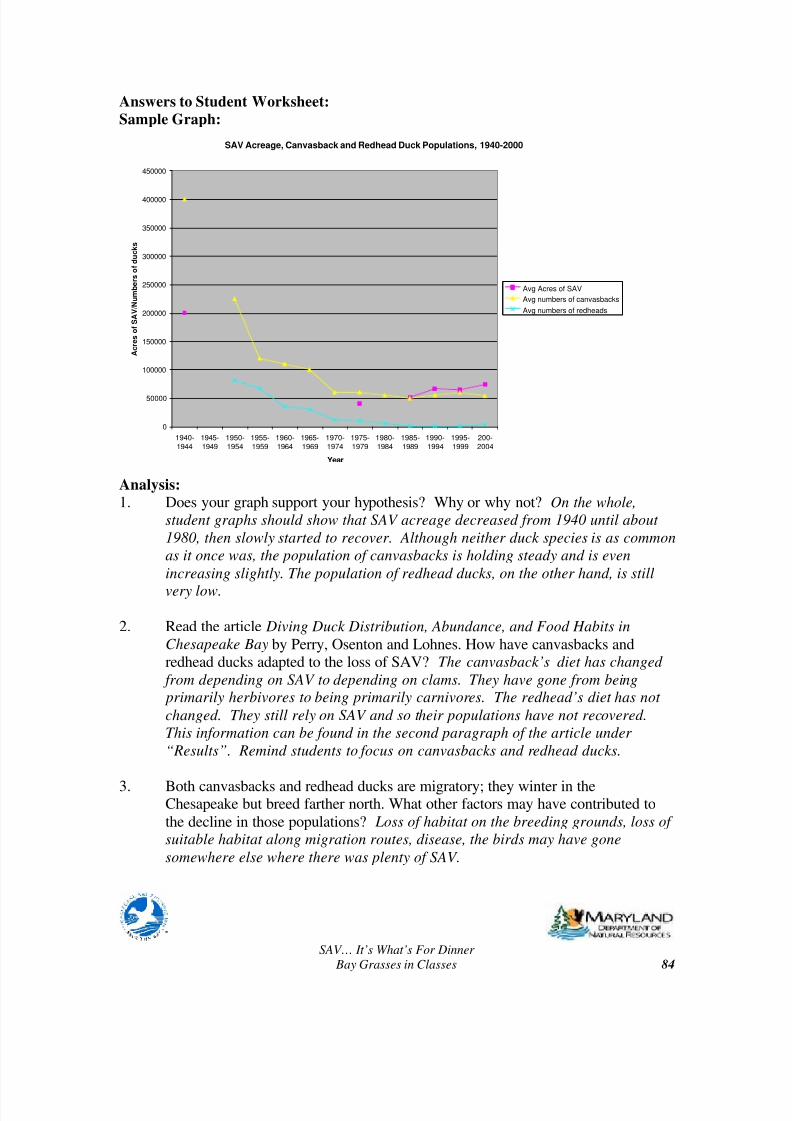
SAV Acreage, Canvasback and Redhead Duck Populations, 1940-2000
0
50000
100000
150000
200000
250000
300000
350000
400000
450000
1940-1944
1945-1949
1950-1954
1955-1959
1960-1964
1965-1969
1970-1974
1975-1979
1980-1984
1985-1989
1990-1994
1995-1999
200-2004
Year
A c r e s o f S A V / N u m b e r s o f d u c k s
Avg Acres of SAV
Avg numbers of canvasbacks
Avg numbers of redheads
Analysis:
1. Does your graph support your hypothesis? Why or why not? On the whole,
student graphs should show that SAV acreage decreased from 1940 until about
1980, then slowly started to recover. Although neither duck species is as common
as it once was, the population of canvasbacks is holding steady and is even
increasing slightly. The population of redhead ducks, on the other hand, is still
very low.
2. Read the article Diving Duck Distribution, Abundance, and Food Habits in
Chesapeake Bay by Perry, Osenton and Lohnes. How have canvasbacks andredhead ducks adapted to the loss of SAV? The canvasback’s diet has changed
from depending on SAV to depending on clams. They have gone from being
primarily herbivores to being primarily carnivores. The redhead’s diet has not
changed. They still rely on SAV and so their populations have not recovered.
This information can be found in the second paragraph of the article under
“Results”. Remind students to focus on canvasbacks and redhead ducks.
3. Both canvasbacks and redhead ducks are migratory; they winter in theChesapeake but breed farther north. What other factors may have contributed to
the decline in those populations? Loss of habitat on the breeding grounds, loss of
suitable habitat along migration routes, disease, the birds may have gone
somewhere else where there was plenty of SAV.
8/3/2019 Maryland; Bay Grasses: It’s What’s for Dinner
http://slidepdf.com/reader/full/maryland-bay-grasses-its-whats-for-dinner 5/8
SAV… It’s What’s For Dinner
Bay Grasses in Classes 85
SAV… It’s What’s for DinnerStudent Worksheet
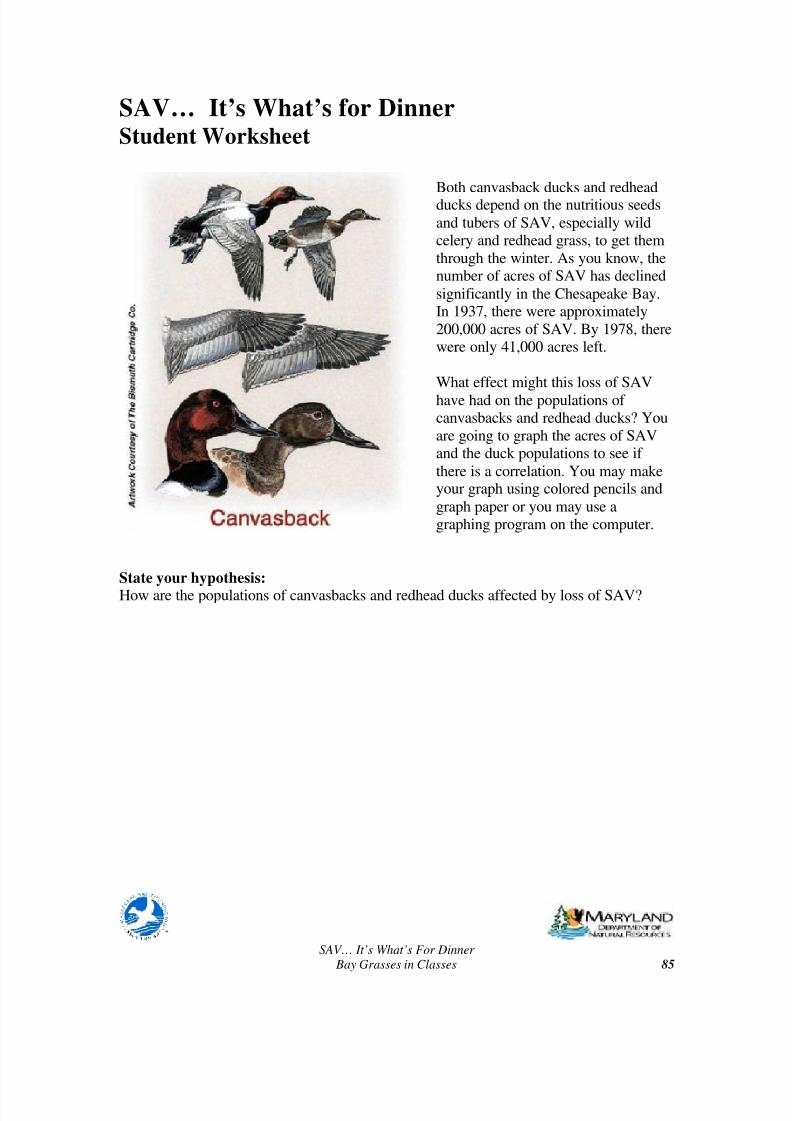
Both canvasback ducks and redheadducks depend on the nutritious seeds
and tubers of SAV, especially wildcelery and redhead grass, to get them
through the winter. As you know, thenumber of acres of SAV has declined
significantly in the Chesapeake Bay.In 1937, there were approximately
200,000 acres of SAV. By 1978, therewere only 41,000 acres left.
What effect might this loss of SAV
have had on the populations of canvasbacks and redhead ducks? You
are going to graph the acres of SAVand the duck populations to see if
there is a correlation. You may makeyour graph using colored pencils and
graph paper or you may use agraphing program on the computer.
State your hypothesis:How are the populations of canvasbacks and redhead ducks affected by loss of SAV?
8/3/2019 Maryland; Bay Grasses: It’s What’s for Dinner
http://slidepdf.com/reader/full/maryland-bay-grasses-its-whats-for-dinner 6/8
SAV… It’s What’s For Dinner
Bay Grasses in Classes 86
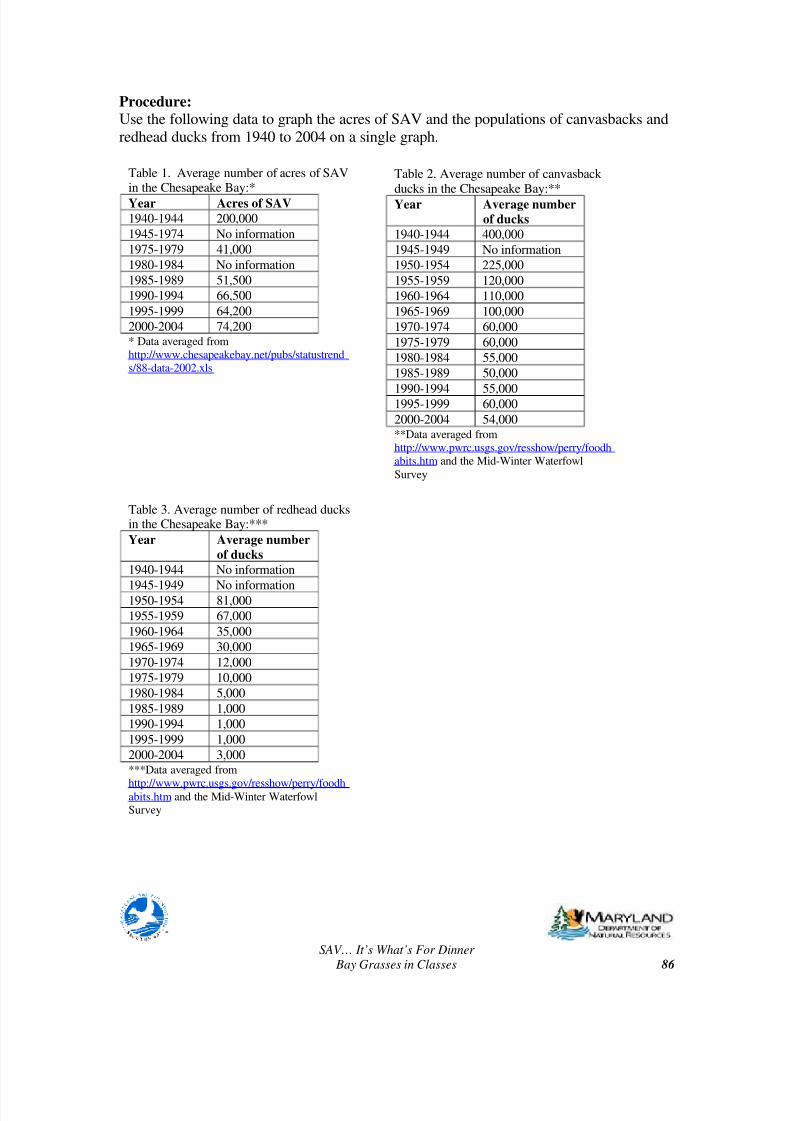
Procedure:Use the following data to graph the acres of SAV and the populations of canvasbacks and
redhead ducks from 1940 to 2004 on a single graph.
Table 1. Average number of acres of SAVin the Chesapeake Bay:*
Year Acres of SAV
1940-1944 200,000
1945-1974 No information
1975-1979 41,000
1980-1984 No information
1985-1989 51,500
1990-1994 66,500
1995-1999 64,200
2000-2004 74,200* Data averaged fromhttp://www.chesapeakebay.net/pubs/statustrends/88-data-2002.xls
Table 2. Average number of canvasback
ducks in the Chesapeake Bay:**
Year Average number
of ducks
1940-1944 400,000
1945-1949 No information
1950-1954 225,000
1955-1959 120,000
1960-1964 110,000
1965-1969 100,000
1970-1974 60,000
1975-1979 60,000
1980-1984 55,000
1985-1989 50,000
1990-1994 55,0001995-1999 60,000
2000-2004 54,000**Data averaged fromhttp://www.pwrc.usgs.gov/resshow/perry/foodhabits.htm and the Mid-Winter Waterfowl
Survey
Table 3. Average number of redhead ducksin the Chesapeake Bay:***
Year Average number
of ducks
1940-1944 No information
1945-1949 No information1950-1954 81,000
1955-1959 67,000
1960-1964 35,000
1965-1969 30,000
1970-1974 12,000
1975-1979 10,000
1980-1984 5,000
1985-1989 1,000
1990-1994 1,000
1995-1999 1,000
2000-2004 3,000***Data averaged from
http://www.pwrc.usgs.gov/resshow/perry/foodhabits.htm and the Mid-Winter WaterfowlSurvey
8/3/2019 Maryland; Bay Grasses: It’s What’s for Dinner
http://slidepdf.com/reader/full/maryland-bay-grasses-its-whats-for-dinner 7/8
SAV… It’s What’s For Dinner
Bay Grasses in Classes 87
Analysis:1. Does your graph support your hypothesis? Why or why not?
2. Read the article Diving Duck Distribution, Abundance, and Food Habits in
Chesapeake Bay by Perry, Osenton and Lohnes. How have canvasbacks andredhead ducks adapted to the loss of SAV?
3. What, in particular, has happened to redhead ducks?
4. Both canvasbacks and redhead ducks are migratory; they winter in the
Chesapeake but breed farther north. What other factors may have contributed tothe decline in those populations?

8/3/2019 Maryland; Bay Grasses: It’s What’s for Dinner
http://slidepdf.com/reader/full/maryland-bay-grasses-its-whats-for-dinner 8/8
SAV… It’s What’s For Dinner
Bay Grasses in Classes 88


![Forage and Grasses[1]](https://img.pdfslide.us/doc/110x75/55352feb55034625198b46e3/forage-and-grasses1.jpg)
