Embed Size (px)
DESCRIPTION
Modeling current-voltage (I/V) characteristics of salt-tolerant charophyte Lamprothamnium in steady state and at the time of turgor regulation. Mary J Beilby and Virginia A. Shepherd School of Physics, Biophysics, The University of NSW, Sydney Australia. Current – voltage analysis. Membrane - PowerPoint PPT Presentation
Citation preview

Modeling current-voltage (I/V) Modeling current-voltage (I/V) characteristics of salt-tolerant characteristics of salt-tolerant
charophyte charophyte LamprothamniumLamprothamnium in in steady state and at the time of steady state and at the time of
turgor regulationturgor regulation
Mary J Beilby and Virginia A. Shepherd
School of Physics, Biophysics, The University of NSW, Sydney Australia

Materials and Methods
amplifier
MembranePD
Voltagecommands
Membranecurrent
Current–voltage analysis
1sec
0 PD200 mV
0 current
4 A

Modeling6 cells in 1/3 seawater: pump state
ibackground = gbackground (V – Vbackground)
7 cells in background state
165):63 JMB 1981, al.et (Hansen model HGSS
22 RT
zFVoioio
RT
zFVooioi
oiiooiio
iooioiiop ekkekk
kk
kkzFNi
ondistributiy probabilit Boltzmann
modelGHK
1
11
)1(
][]([
)(
2,
50
RT
VVFzo
RT
FV
RT
FV
oiKKircoirc
g
e
P
eRT
eKKVFPNPi
RT
VVFzo
RT
FV
RT
FV
oiKKorcoorc
g
e
P
eRT
eKKVFPNPi
)(
2,
50
1
1
)1(
][]([

0.2 SW 77.0 2.0 86.0 140.5
Medium Na+ K+ Cl- osmolarity
mM mM mM mOsmol.kg-1
0.4 SW 154.0 4.1 172.0 281.0
0.5 SW 175.0 8.0 201.0 536.0
full SW 350.0 16.0 400.0 1072.0
Steady state I/V characteristics in range of salinities
For details see:Beilby and Shepherd, 2001, J. Membrane Biol. 181: 77

Hypertonic regulation:from 0.2 SW to 0.4 SW
time:
5 min
21 min
41 min
2 hr 34 min
3 hr 30 min
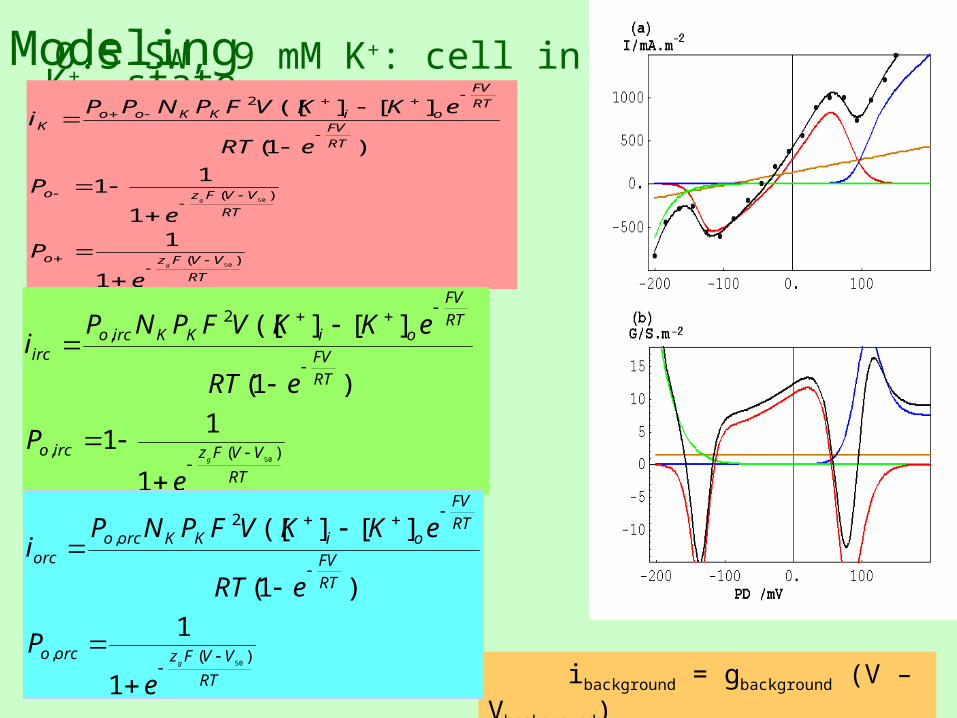
Modeling 0.5 SW, 9 mM K+: cell in K+ state
ibackground = gbackground (V – Vbackground)
1
1
1
11
)1(
][]([
)(
)(
2
50
50
RT
VVFzo
RT
VVFzo
RT
FV
RT
FV
oiKKooK
g
g
e
P
e
P
eRT
eKKVFPNPPi
1
11
)1(
][]([
)(,
2,
50
RT
VVFzirco
RT
FV
RT
FV
oiKKircoirc
g
e
P
eRT
eKKVFPNPi
RT
VVFzorco
RT
FV
RT
FV
oiKKorcoorc
g
e
P
eRT
eKKVFPNPi
)(,
2,
50
1
1
)1(
][]([
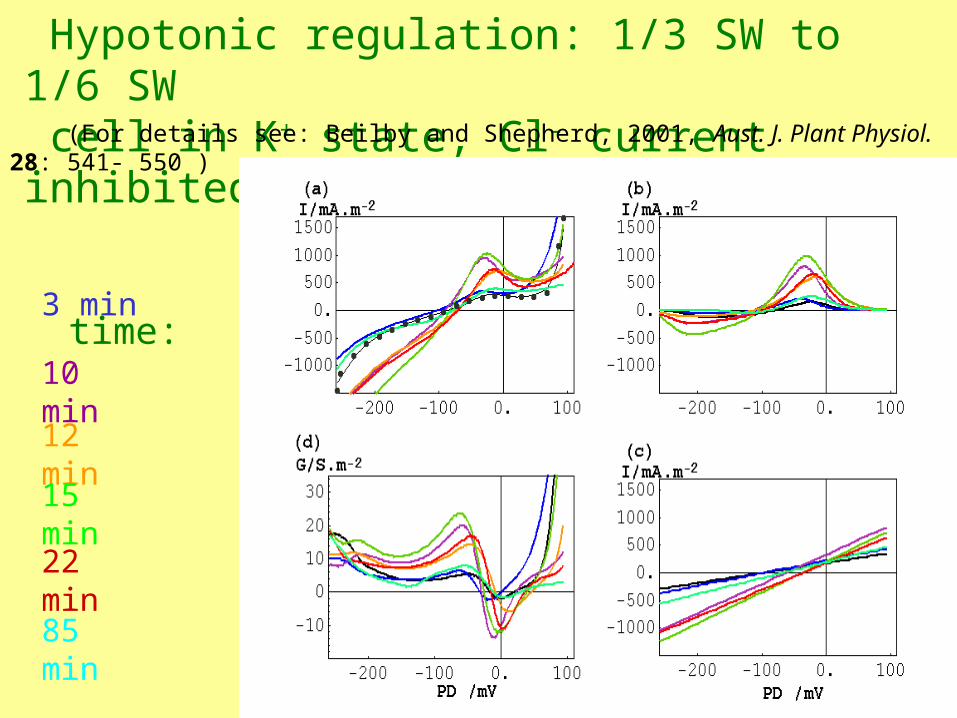
Hypotonic regulation: 1/3 SW to 1/6 SW cell in K+ state, Cl- current inhibited by La3+
time:
3 min
10 min
12 min
15 min
22 min
85 min
(For details see: Beilby and Shepherd, 2001, Aust. J. Plant Physiol. 28: 541- 550 )

ConclusionsConclusions• Steady state conductance rises with salinity mainly due to ibackground, Vbackground is not affected by salinity
• Hypertonic regulation turns on iirc before ipump
iirc is carried by K+.
• Hypotonic regulation turns on iK independently of iCl
• The increase in [K+]cyt precedes rise in NKPK
• Vbackground depolarizes and gbackground increases at the time of hypotonic regulation
• The proton pump works harder to keep the membrane PD negative in more saline media
Future workFuture workTransporter for ibackground? H+ channels? Stretch activated channels?
Is iirc the detector of hypertonic stress?
Electroneutrality ?
Signal for tonoplast K+ channels to open ?
H+ channels involved in hypotonic regulation?
What is the limiting pump conductance?
This presentation can be found on http://www.phys.unsw.edu.au/~mjb/