Embed Size (px)
Citation preview
Martin Brudermüller, Vice Chairman of BASF SE Albert Heuser, President Greater China & Functions Asia Pacific Gops Pillay, President South & East Asia, ASEAN, ANZ
We create chemistry in Asia Pacific
“grow smartly”
Investor Day Asia Pacific Shanghai, June 5, 2013
BASF Investor Day Asia Pacific, June 5-6, 2013 2
Cautionary note regarding forward-looking statements
This presentation may contain forward-looking statements that are subject to risks and uncertainties, including those pertaining to the anticipated benefits to be realized from the proposals described herein. Forward-looking statements may include, in particular, statements about future events, future financial performance, plans, strategies, expectations, prospects, competitive environment, regulation and supply and demand. BASF has based these forward-looking statements on its views and assumptions with respect to future events and financial performance. Actual financial performance could differ materially from that projected in the forward-looking statements due to the inherent uncertainty of estimates, forecasts and projections, and financial performance may be better or worse than anticipated. Given these uncertainties, readers should not put undue reliance on any forward-looking statements. The information contained in this presentation is subject to change without notice and BASF does not undertake any duty to update the forward-looking statements, and the estimates and assumptions associated with them, except to the extent required by applicable laws and regulations.
BASF Investor Day Asia Pacific, June 5-6, 2013 3
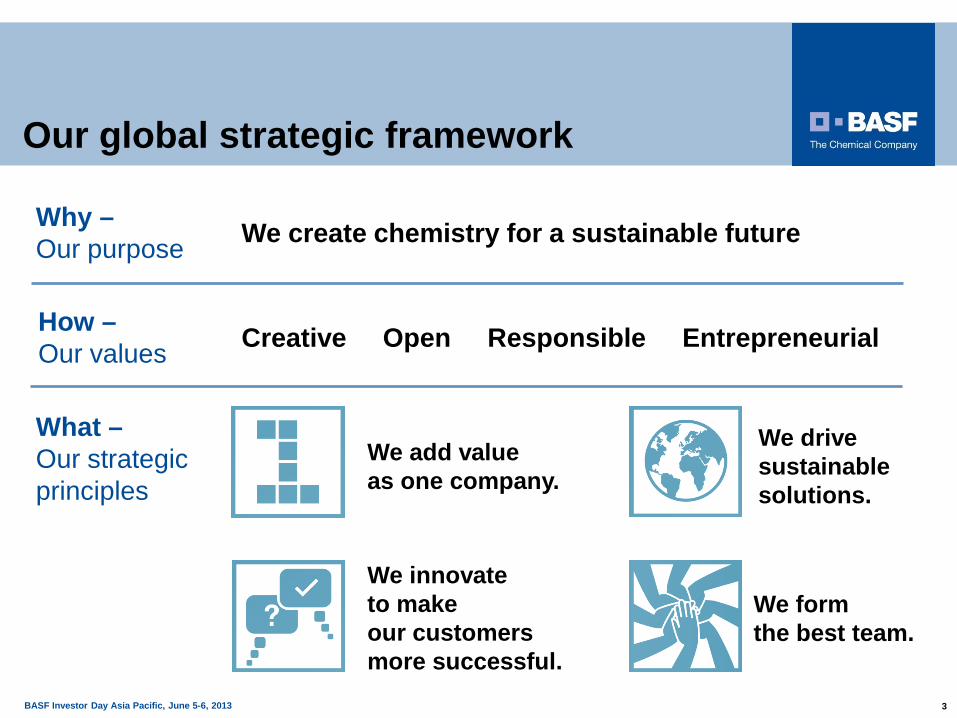
Our global strategic framework
Why – Our purpose
What – Our strategic principles
How – Our values
We create chemistry for a sustainable future
Creative Open Responsible Entrepreneurial
We add value as one company.
We innovate to make our customers more successful.
We drive sustainable solutions.
We form the best team.
BASF Investor Day Asia Pacific, June 5-6, 2013 4
1
2
3
Where we are
Trends in Asia Pacific
“grow smartly” – Asia Pacific Strategy
4 Strategic levers
BASF Investor Day Asia Pacific, June 5-6, 2013 5
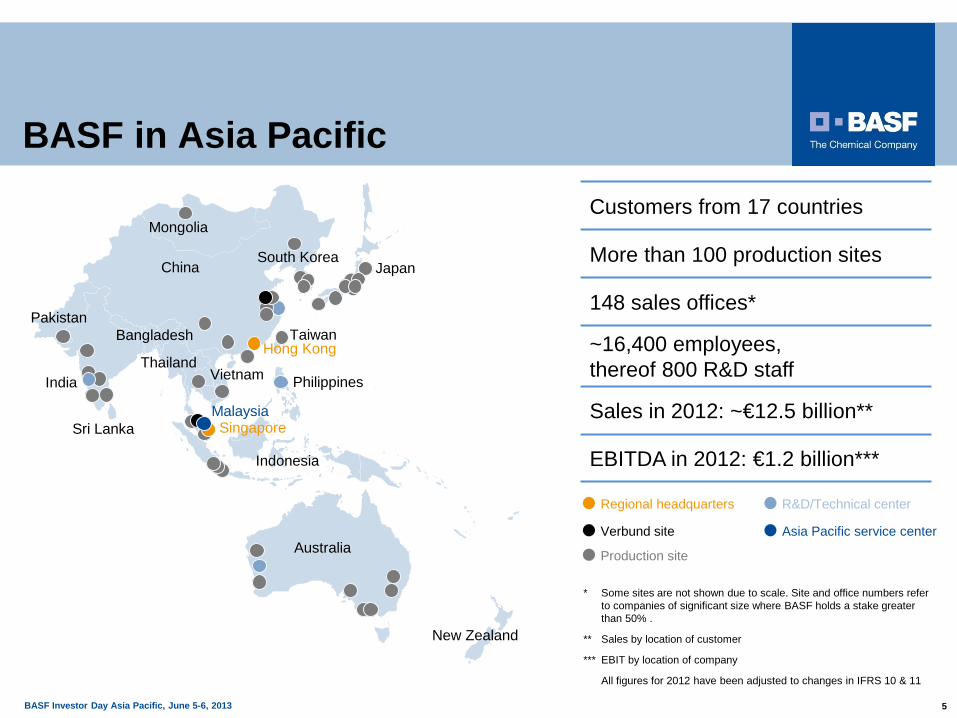
Customers from 17 countries
More than 100 production sites
148 sales offices*
~16,400 employees, thereof 800 R&D staff
Sales in 2012: ~€12.5 billion**
EBITDA in 2012: €1.2 billion***
BASF in Asia Pacific
* Some sites are not shown due to scale. Site and office numbers refer to companies of significant size where BASF holds a stake greater than 50% .
** Sales by location of customer
*** EBIT by location of company
All figures for 2012 have been adjusted to changes in IFRS 10 & 11
Regional headquarters
Verbund site
Production site
R&D/Technical center
Asia Pacific service center
Singapore
Hong Kong
Japan South Korea
Mongolia
China
Pakistan
India
Sri Lanka
Bangladesh
Thailand Vietnam Philippines
Indonesia
Taiwan
Malaysia
Australia
New Zealand
BASF Investor Day Asia Pacific, June 5-6, 2013 6
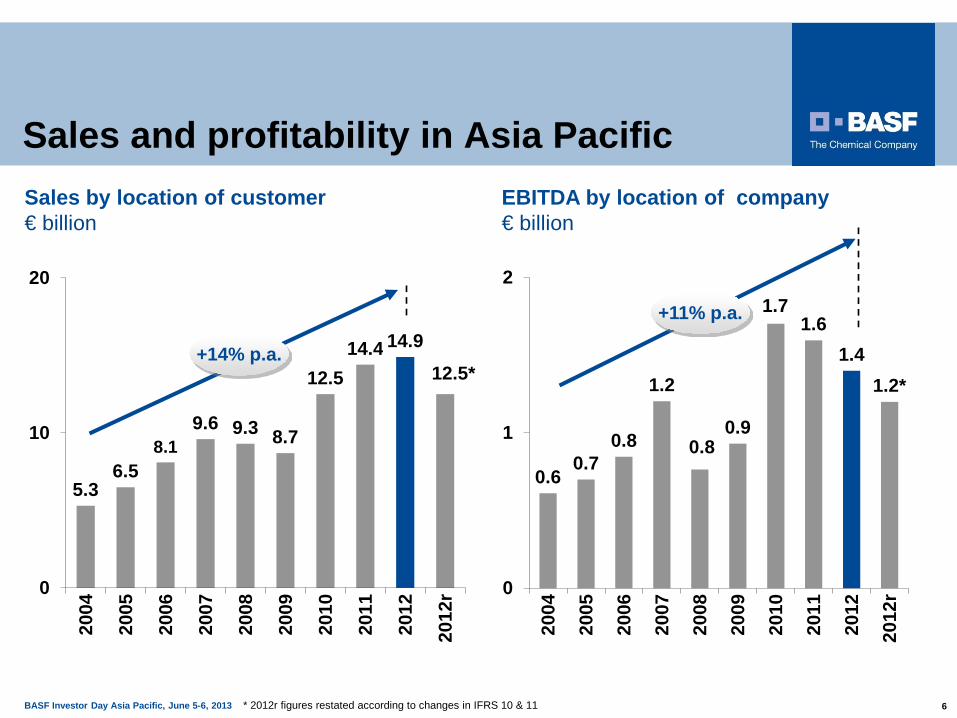
EBITDA by location of company € billion
0.6 0.7
0.8
1.2
0.8 0.9
1.7 1.6
1.4 1.2*
0
1
2
2004
2005
2006
2007
2008
2009
2010
2011
2012
2012
r
5.3 6.5
8.1 9.6 9.3 8.7
12.5 14.4 14.9
12.5*
0
10
20
2004
2005
2006
2007
2008
2009
2010
2011
2012
2012
r
Sales by location of customer € billion
* 2012r figures restated according to changes in IFRS 10 & 11
Sales and profitability in Asia Pacific
+14% p.a.
+11% p.a.

BASF Investor Day Asia Pacific, June 5-6, 2013 7
Functional Materials &
Solutions 30%
Sales by segment
Chemicals 31%
Other 8%
Performance Products 27% Greater
China 42%
Australia, New Zealand (ANZ)
4%
South Asia 11%
Japan 13%
South Korea 8%
ASEAN 22%
€12.5 billion
€12.5 billion
Sales by sub-region
Agricultural Solutions 4%
Figures for 2012 adjusted to changes in IFRS and new segment structure as of January 1, 2013.
Sales Asia Pacific 2012
South Asia: India, Pakistan, Bangladesh, Sri Lanka ASEAN: Singapore, Philippines, Vietnam,
Thailand, Indonesia, Malaysia
Sales to third parties by location of customers
BASF Investor Day Asia Pacific, June 5-6, 2013 8
1
2
3
Where we are
Trends in Asia Pacific
“grow smartly” – Asia Pacific Strategy
4 Strategic levers
BASF Investor Day Asia Pacific, June 5-6, 2013 9
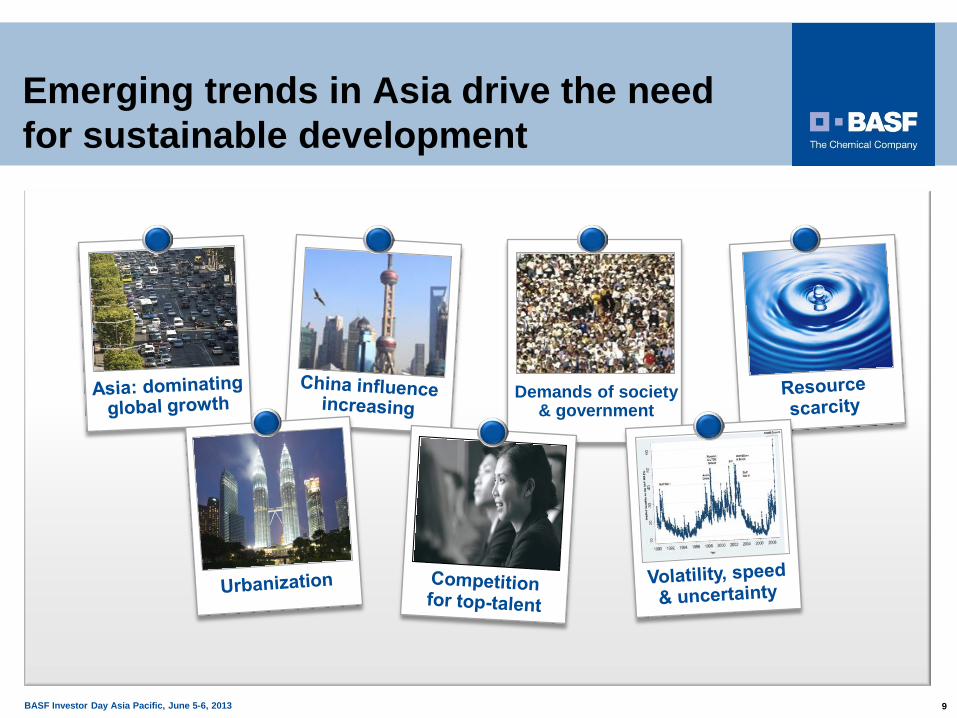
Emerging trends in Asia drive the need for sustainable development
Demands of society
& government
BASF Investor Day Asia Pacific, June 5-6, 2013 10
Macroeconomics Competition Sustainability
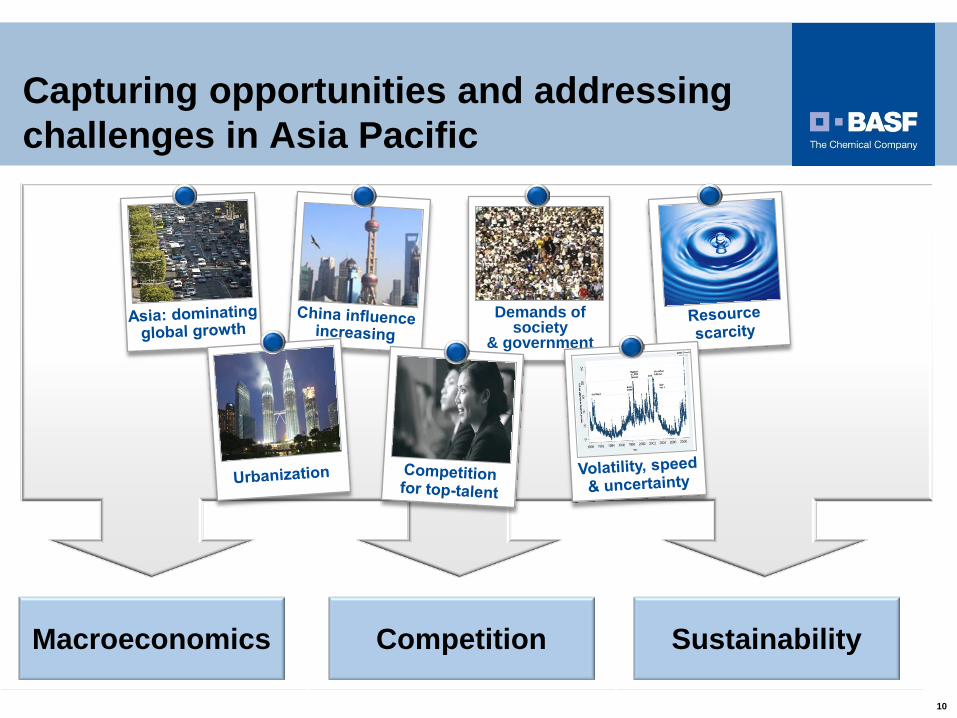
Capturing opportunities and addressing challenges in Asia Pacific
Demands of
society & government
Macroeconomics Competition Sustainability
BASF Investor Day Asia Pacific, June 5-6, 2013 11
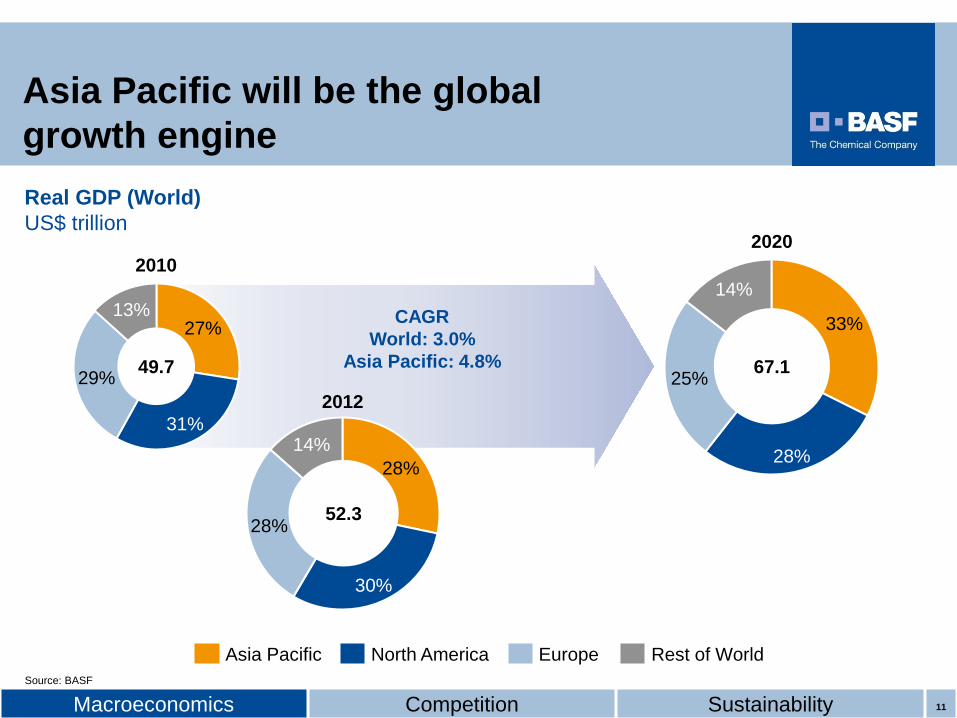
Real GDP (World) US$ trillion
Asia Pacific will be the global growth engine
Macroeconomics Competition Sustainability
13%
29%
31%
27%
14%
25%
28%
33%
49.7 67.1
2020
CAGR World: 3.0%
Asia Pacific: 4.8%
14%
28%
30%
28%
52.3
2012
2010
11
Source: BASF
Asia Pacific Rest of World Europe North America
BASF Investor Day Asia Pacific, June 5-6, 2013 12
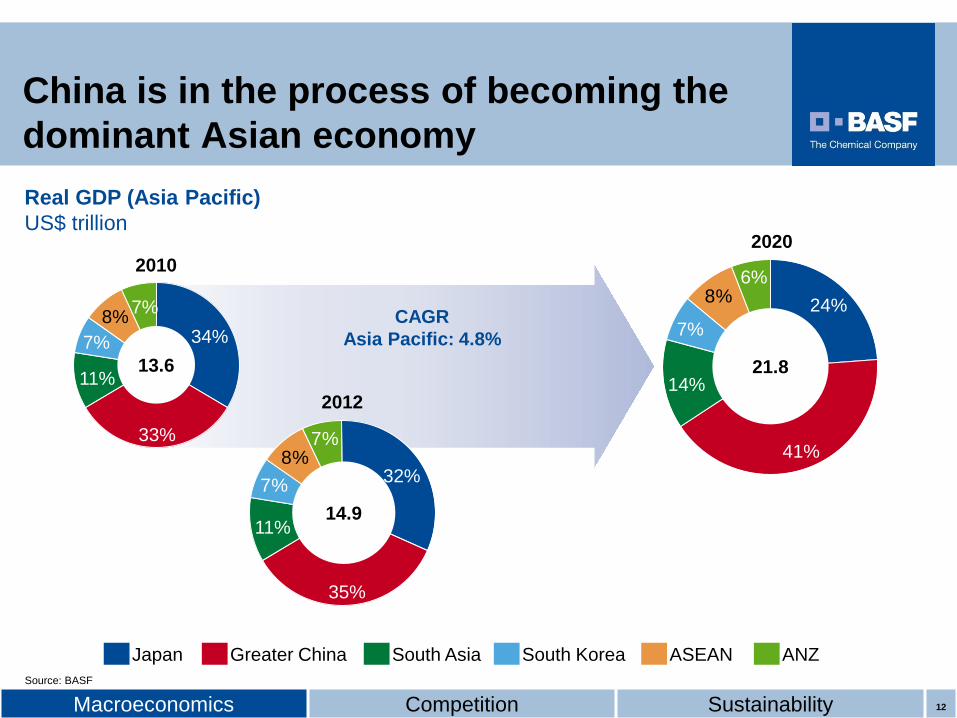
China is in the process of becoming the dominant Asian economy
Greater China Japan South Asia South Korea ASEAN ANZ
Real GDP (Asia Pacific) US$ trillion
Macroeconomics Competition Sustainability
2010
7% 8% 7%
11%
33%
34%
8%6%
7%
14%
41%
24%
13.6 21.8
7%
7%8%
11%
35%
32%
14.9
2012
CAGR Asia Pacific: 4.8%
2020
12
Source: BASF
BASF Investor Day Asia Pacific, June 5-6, 2013 13
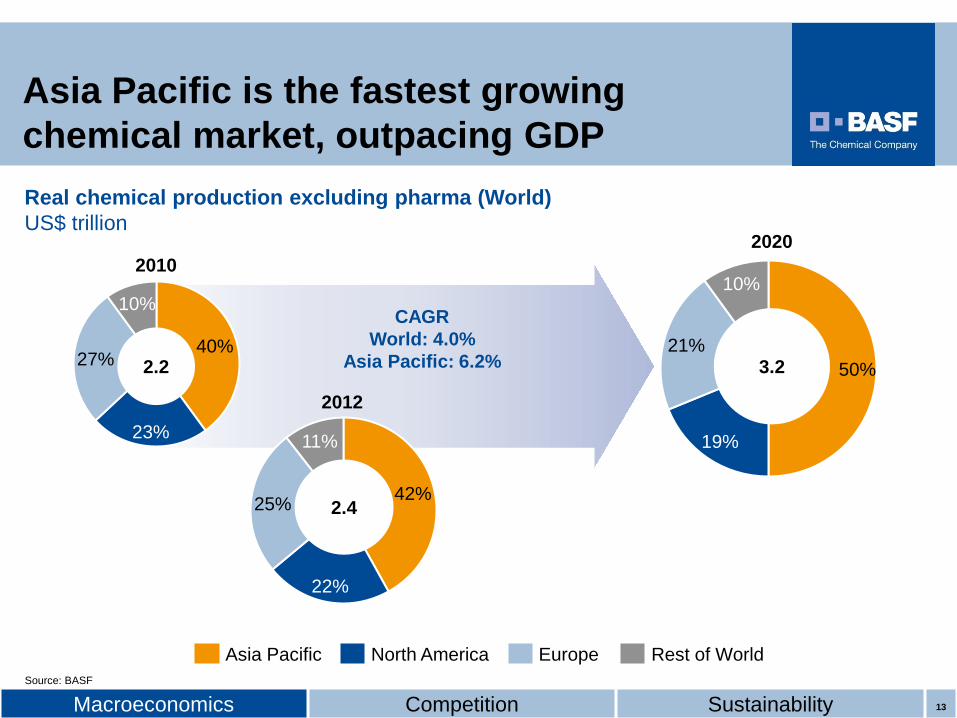
Asia Pacific is the fastest growing chemical market, outpacing GDP
11%
25%
22%
42% 2.4
Real chemical production excluding pharma (World) US$ trillion
Macroeconomics Competition Sustainability
Asia Pacific Rest of World Europe North America
40%
10%
23%
27%
10%
21%
19%
50% 2.2
3.2
2020
CAGR World: 4.0%
Asia Pacific: 6.2%
2012
2010
13
Source: BASF
BASF Investor Day Asia Pacific, June 5-6, 2013 14
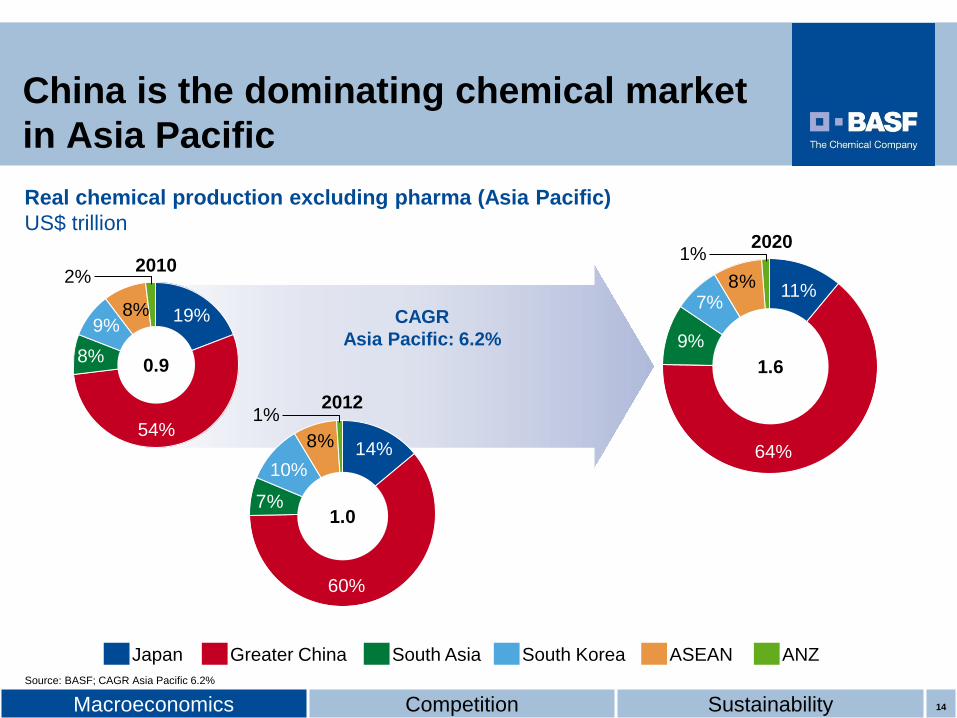
China is the dominating chemical market in Asia Pacific
7%
8%
60%
14% 10%
1.0
Real chemical production excluding pharma (Asia Pacific) US$ trillion
Macroeconomics Competition Sustainability
Greater China Japan South Asia South Korea ASEAN ANZ
8% 9%
8%
54%
19%
8%
64%
11% 7%
9% 0.9
1.6
CAGR Asia Pacific: 6.2%
2012
2010 2020
Source: BASF; CAGR Asia Pacific 6.2%
14
2%
1%
1%
BASF Investor Day Asia Pacific, June 5-6, 2013 15
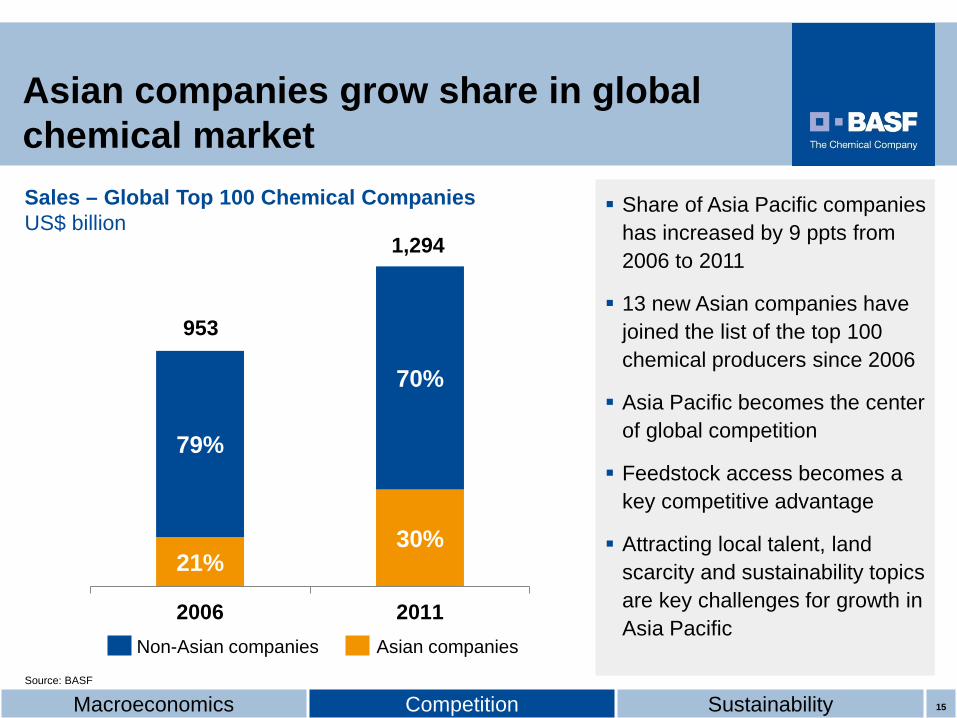
Asian companies grow share in global chemical market
21% 30%
79%
70%
2006 2011
953
1,294
Sales – Global Top 100 Chemical Companies US$ billion
Source: BASF
Macroeconomics Competition Sustainability 15
Asian companies Non-Asian companies
Share of Asia Pacific companies has increased by 9 ppts from 2006 to 2011
13 new Asian companies have joined the list of the top 100 chemical producers since 2006
Asia Pacific becomes the center of global competition
Feedstock access becomes a key competitive advantage
Attracting local talent, land scarcity and sustainability topics are key challenges for growth in Asia Pacific
BASF Investor Day Asia Pacific, June 5-6, 2013 16
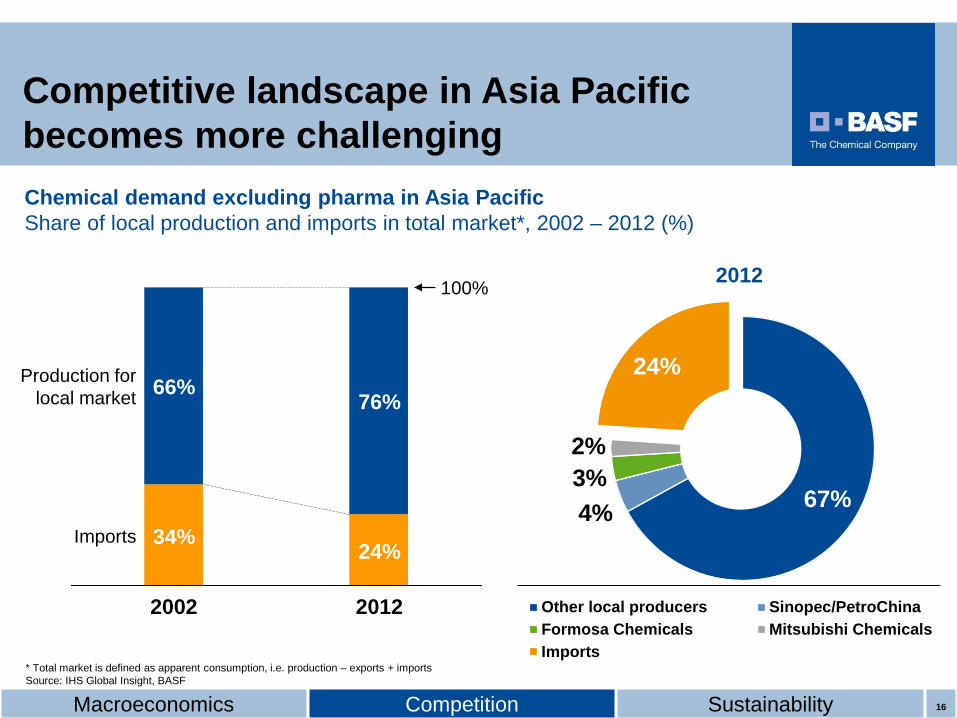
67% 4% 3% 2%
24%
Other local producers Sinopec/PetroChinaFormosa Chemicals Mitsubishi ChemicalsImports
Competitive landscape in Asia Pacific becomes more challenging
100%
Imports
Production for local market
2012
24%
76%
2002
34%
66%
Chemical demand excluding pharma in Asia Pacific Share of local production and imports in total market*, 2002 – 2012 (%)
* Total market is defined as apparent consumption, i.e. production – exports + imports Source: IHS Global Insight, BASF
2012
Macroeconomics Competition Sustainability 16
BASF Investor Day Asia Pacific, June 5-6, 2013 17
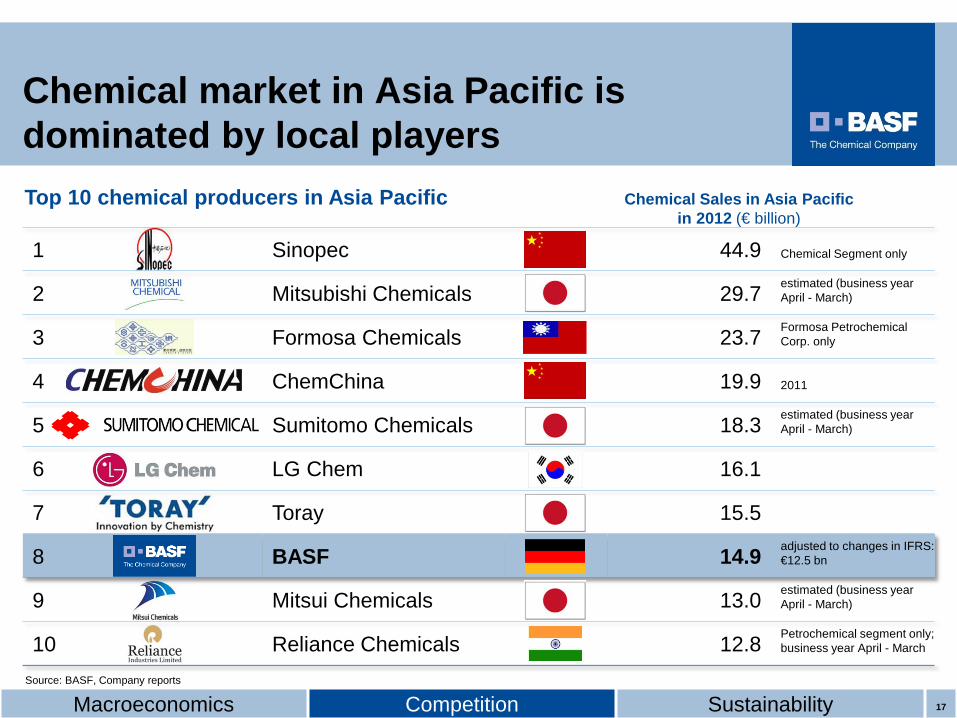
Chemical market in Asia Pacific is dominated by local players
1 Sinopec 44.9 Chemical Segment only
2 Mitsubishi Chemicals 29.7 estimated (business year April - March)
3 Formosa Chemicals 23.7 Formosa Petrochemical Corp. only
4 ChemChina 19.9 2011
5 Sumitomo Chemicals 18.3 estimated (business year April - March)
6 LG Chem 16.1
7 Toray 15.5
8 BASF 14.9 adjusted to changes in IFRS: €12.5 bn
9 Mitsui Chemicals 13.0 estimated (business year April - March)
10 Reliance Chemicals 12.8 Petrochemical segment only; business year April - March
Chemical Sales in Asia Pacific in 2012 (€ billion)
Top 10 chemical producers in Asia Pacific
Macroeconomics Competition Sustainability 17
Source: BASF, Company reports
BASF Investor Day Asia Pacific, June 5-6, 2013 18
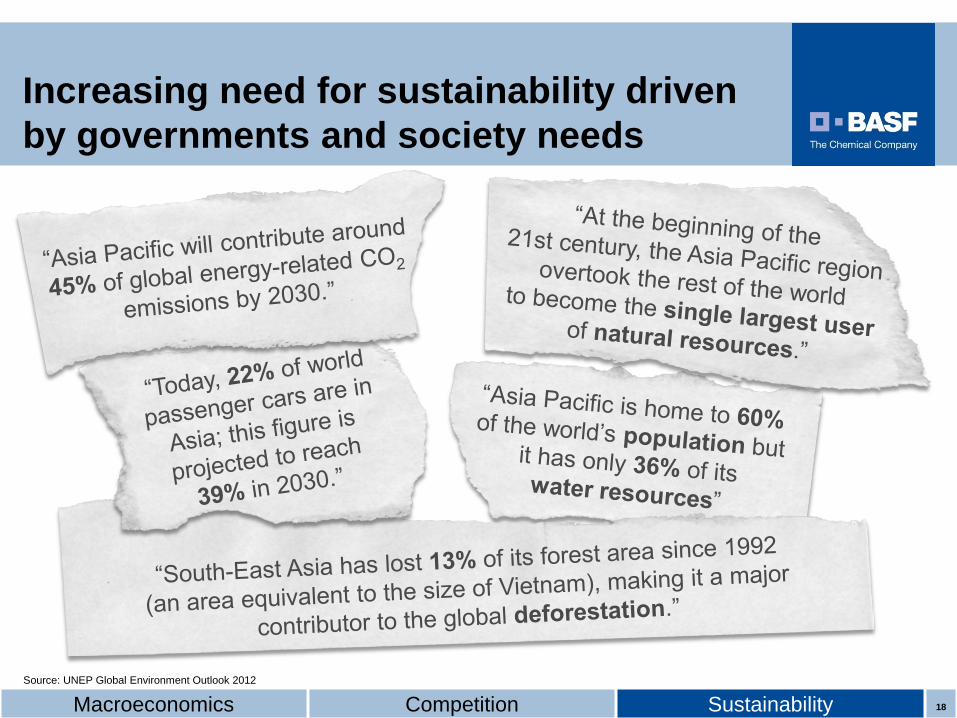
Source: UNEP Global Environment Outlook 2012
Macroeconomics Competition Sustainability
Increasing need for sustainability driven by governments and society needs
18
BASF Investor Day Asia Pacific, June 5-6, 2013 19
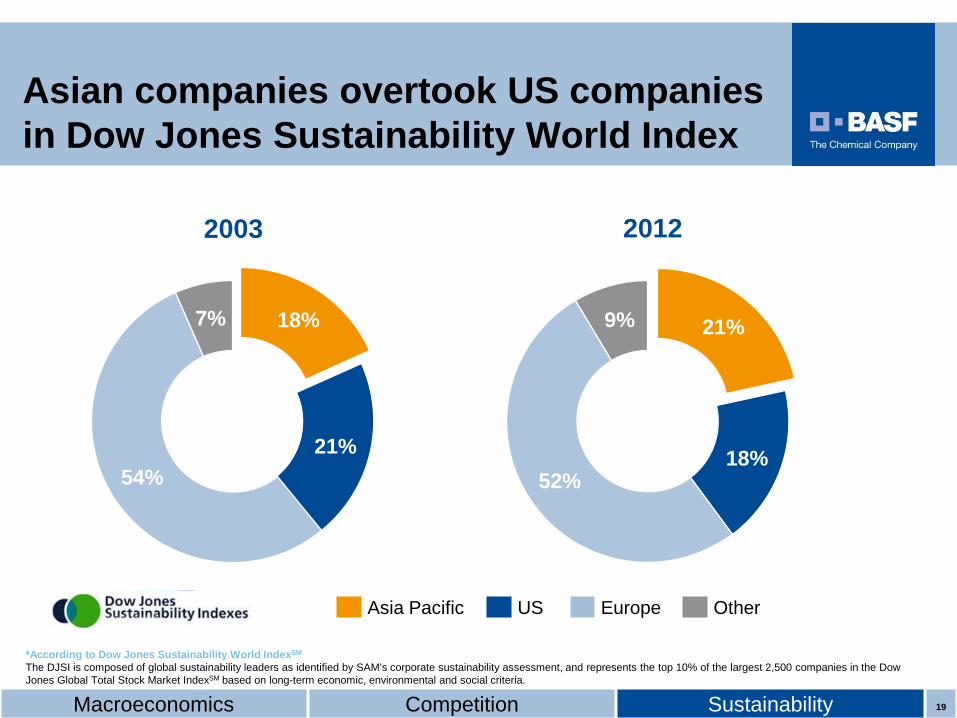
*According to Dow Jones Sustainability World IndexSM
The DJSI is composed of global sustainability leaders as identified by SAM’s corporate sustainability assessment, and represents the top 10% of the largest 2,500 companies in the Dow Jones Global Total Stock Market IndexSM based on long-term economic, environmental and social criteria.
Asian companies overtook US companies in Dow Jones Sustainability World Index
Macroeconomics Competition Sustainability
21%
18% 52%
9%
2012
18%
21% 54%
7%
2003
19
Asia Pacific Other Europe US
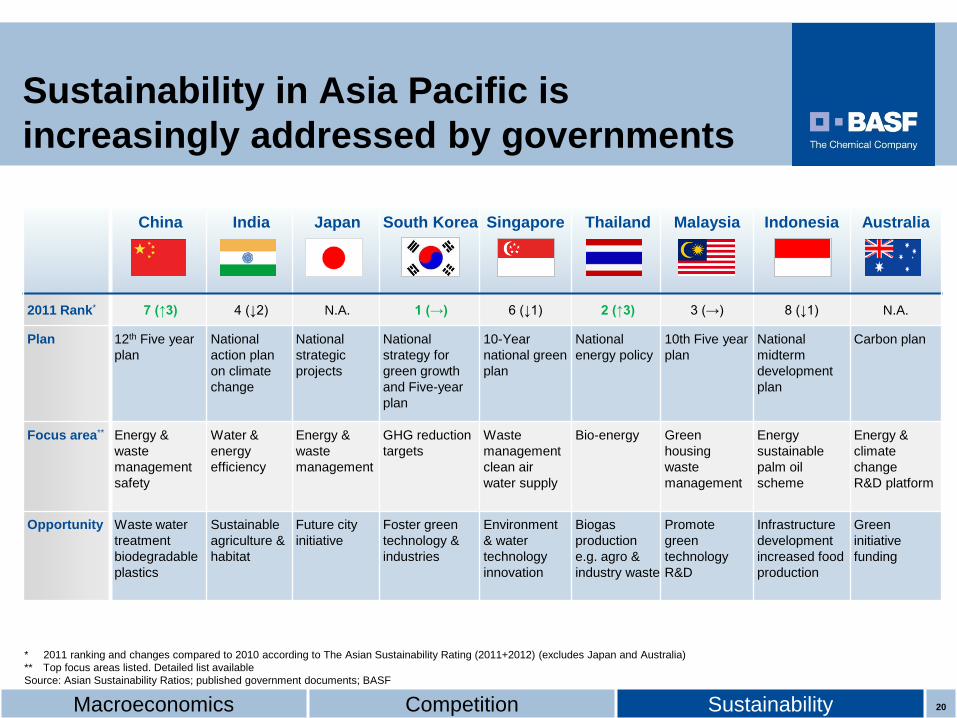
BASF Investor Day Asia Pacific, June 5-6, 2013 20
China
India Japan South Korea Singapore Thailand Malaysia Indonesia Australia
2011 Rank* 7 (↑3) 4 (↓2) N.A. 1 (→) 6 (↓1) 2 (↑3) 3 (→) 8 (↓1) N.A.
Plan 12th Five year plan
National action plan on climate change
National strategic projects
National strategy for green growth and Five-year plan
10-Year national green plan
National energy policy
10th Five year plan
National midterm development plan
Carbon plan
Focus area** Energy & waste management safety
Water & energy efficiency
Energy & waste management
GHG reduction targets
Waste management clean air water supply
Bio-energy Green housing waste management
Energy sustainable palm oil scheme
Energy & climate change R&D platform
Opportunity Waste water treatment biodegradable plastics
Sustainable agriculture & habitat
Future city initiative
Foster green technology & industries
Environment & water technology innovation
Biogas production e.g. agro & industry waste
Promote green technology R&D
Infrastructure development increased food production
Green initiative funding
* 2011 ranking and changes compared to 2010 according to The Asian Sustainability Rating (2011+2012) (excludes Japan and Australia) ** Top focus areas listed. Detailed list available Source: Asian Sustainability Ratios; published government documents; BASF
Sustainability in Asia Pacific is increasingly addressed by governments
Macroeconomics Competition Sustainability 20
BASF Investor Day Asia Pacific — June 5-6, 2013
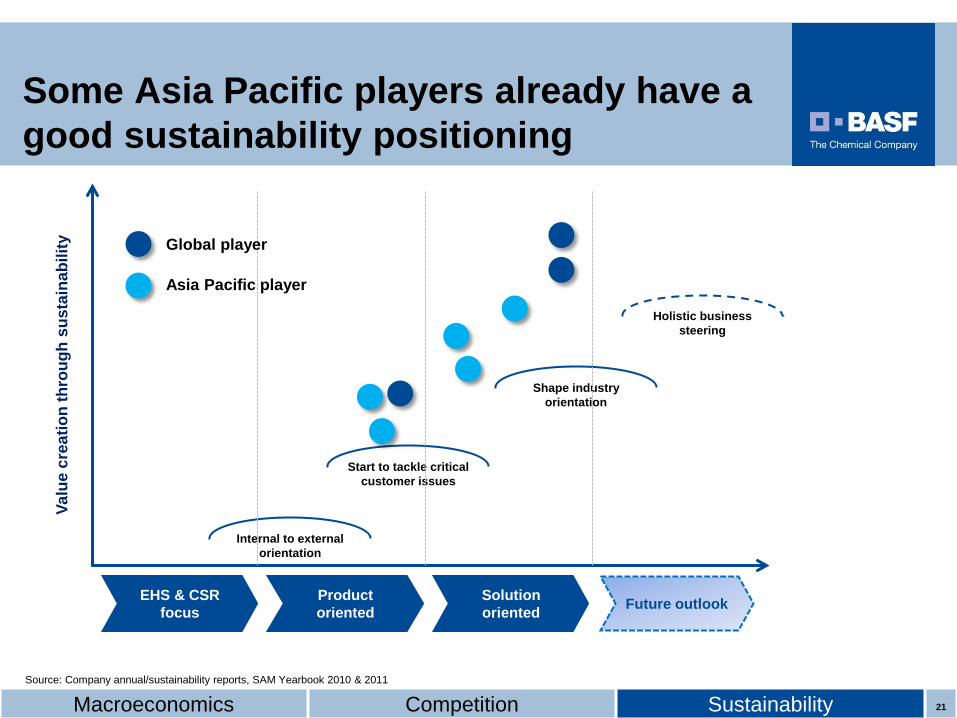
Some Asia Pacific players already have a good sustainability positioning
EHS & CSR focus
Product oriented
Solution oriented
Valu
e cr
eatio
n th
roug
h su
stai
nabi
lity
Shape industry orientation
Start to tackle critical customer issues
Future outlook
Internal to external orientation
Holistic business steering
Source: Company annual/sustainability reports, SAM Yearbook 2010 & 2011
Macroeconomics Competition Sustainability 21
Global player
Asia Pacific player
BASF Investor Day Asia Pacific, June 5-6, 2013 22
1
2
3
Where we are
Trends in Asia Pacific
“grow smartly” – Asia Pacific Strategy
4 Strategic levers
BASF Investor Day Asia Pacific, June 5-6, 2013 23
We create chemistry for a sustainable future.
BASF grows smartly in Asia Pacific
BASF Investor Day Asia Pacific, June 5-6, 2013 24
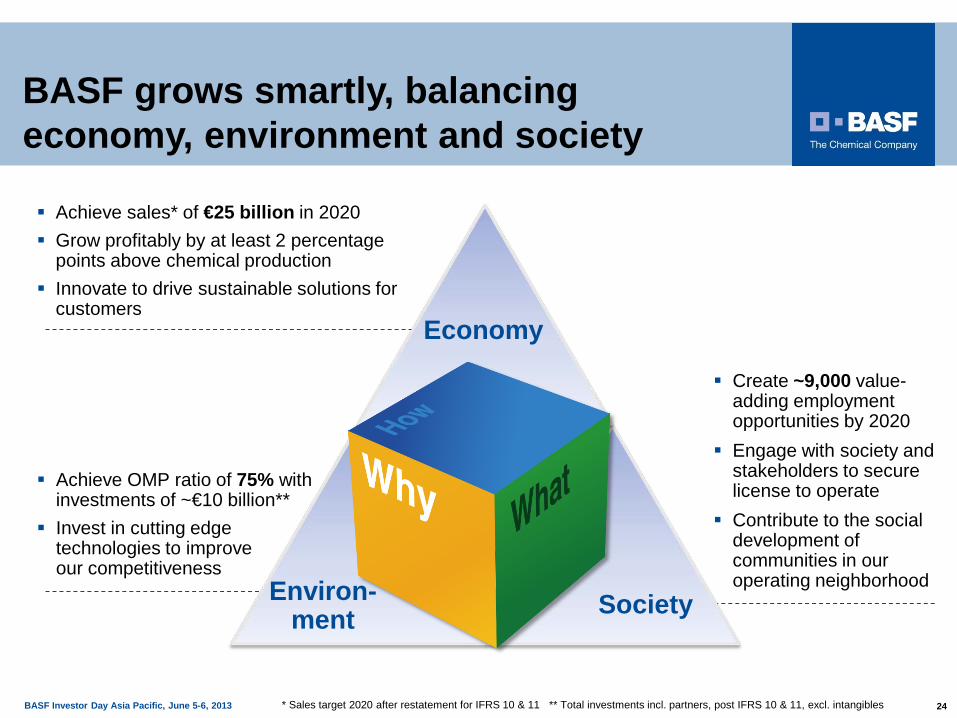
BASF grows smartly, balancing economy, environment and society
* Sales target 2020 after restatement for IFRS 10 & 11
Achieve sales* of €25 billion in 2020 Grow profitably by at least 2 percentage
points above chemical production Innovate to drive sustainable solutions for
customers
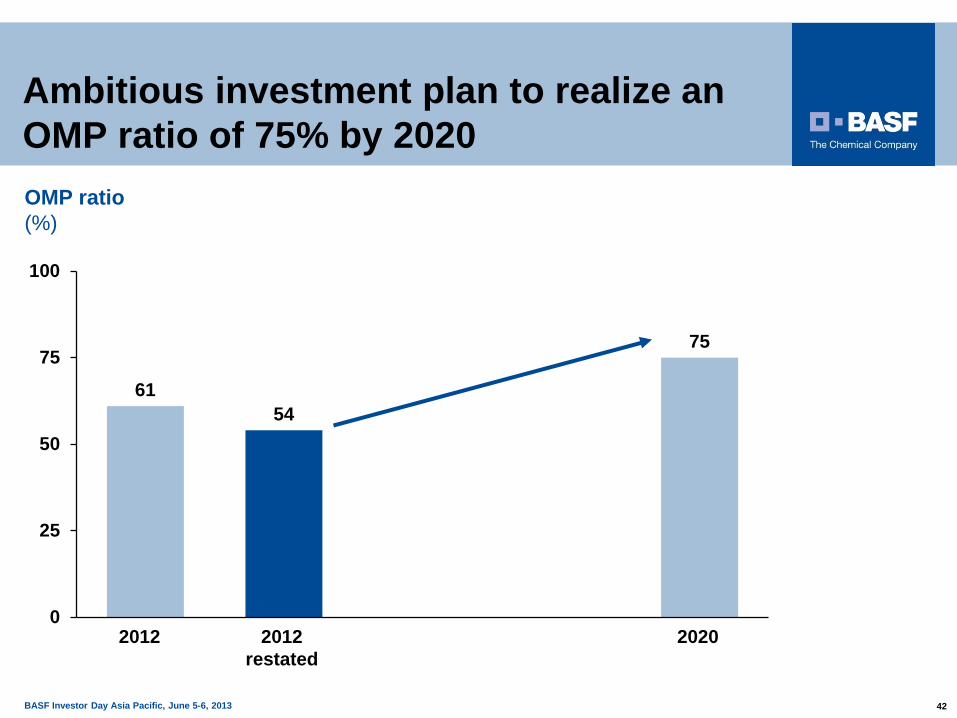
Achieve OMP ratio of 75% with investments of ~€10 billion**
Invest in cutting edge technologies to improve our competitiveness
Create ~9,000 value-adding employment opportunities by 2020
Engage with society and stakeholders to secure license to operate
Contribute to the social development of communities in our operating neighborhood
Balance
Society Environ-ment
Economy
** Total investments incl. partners, post IFRS 10 & 11, excl. intangibles
BASF Investor Day Asia Pacific, June 5-6, 2013 25
1
2
3
Where we are
Trends in Asia Pacific
“grow smartly” – Asia Pacific Strategy
4 Strategic levers
BASF Investor Day Asia Pacific, June 5-6, 2013 26
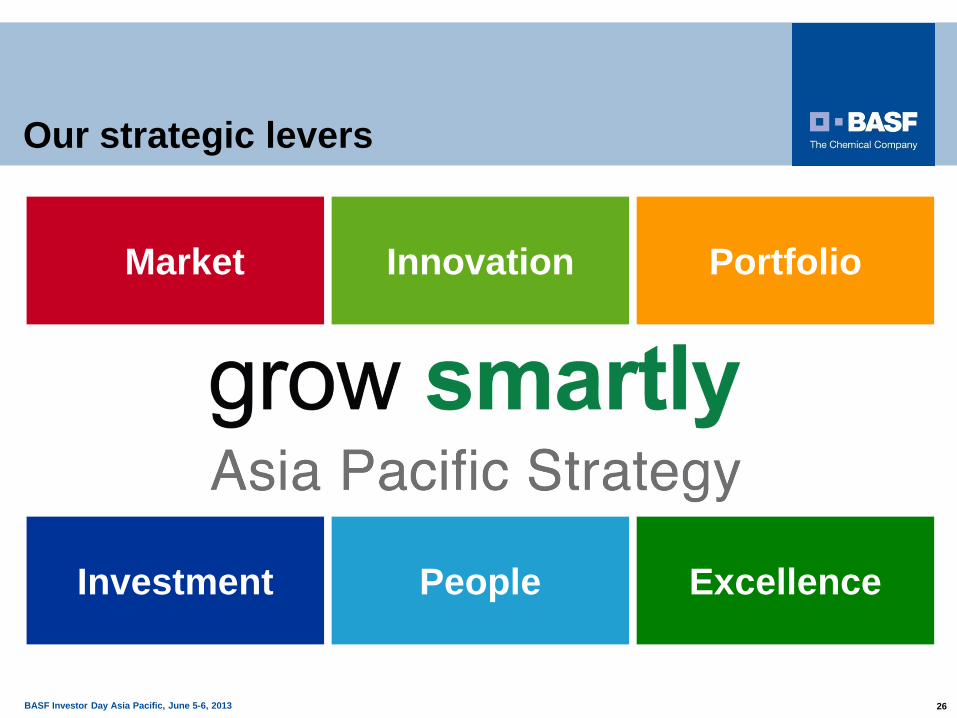
Our strategic levers
Innovation Market Portfolio
People Investment Excellence
BASF Investor Day Asia Pacific, June 5-6, 2013 27
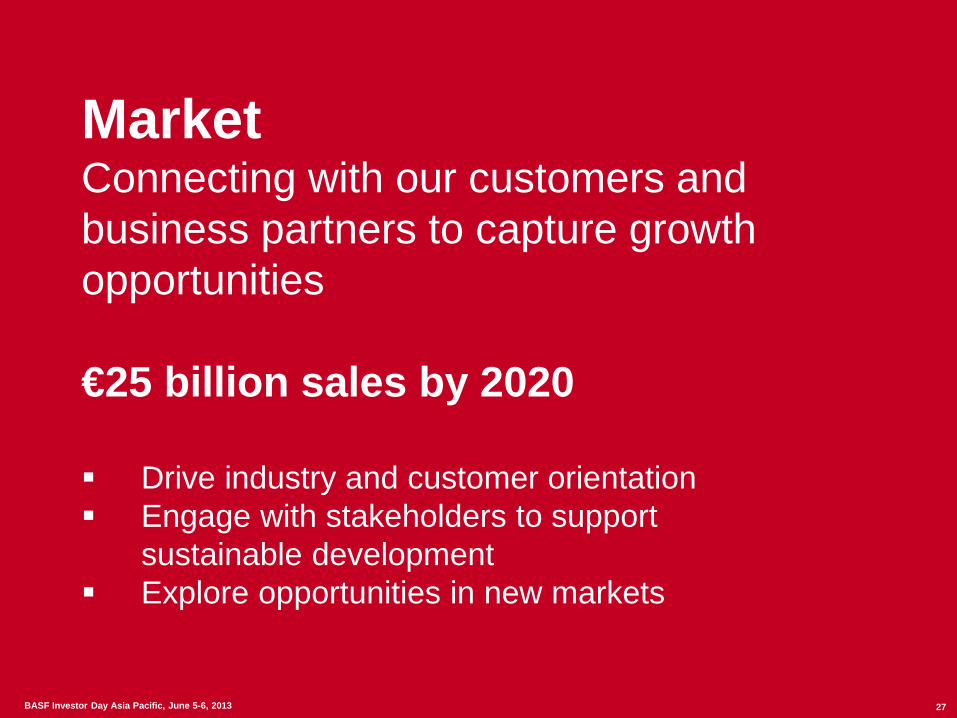
Market Connecting with our customers and business partners to capture growth opportunities €25 billion sales by 2020 Drive industry and customer orientation Engage with stakeholders to support
sustainable development Explore opportunities in new markets
27 BASF Investor Day Asia Pacific, June 5-6, 2013
BASF Investor Day Asia Pacific, June 5-6, 2013 28
2020 2012 restated
New Business & Acquisitions
Organic Growth
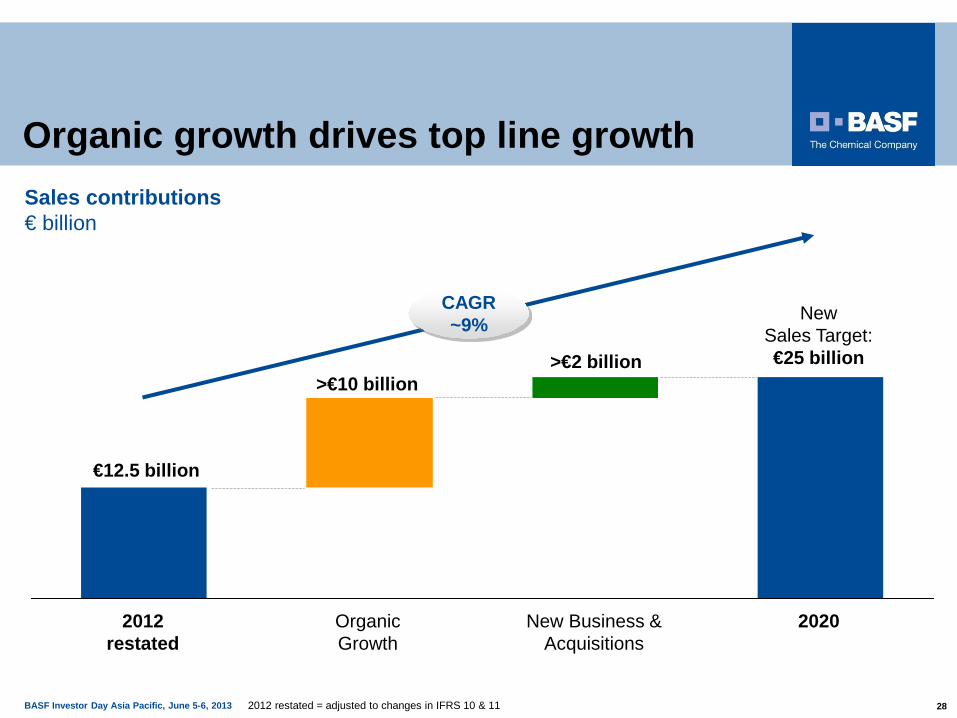
Sales contributions € billion
Organic growth drives top line growth
2012 restated = adjusted to changes in IFRS 10 & 11
New Sales Target: €25 billion
€12.5 billion
CAGR ~9%
>€2 billion >€10 billion
BASF Investor Day Asia Pacific, June 5-6, 2013 29
0
8
16
0 8 16
BAS
F’s
ann
ual s
ales
gro
wth
201
0-20
20 (%
)
SRM growth 2010-2020 (%)
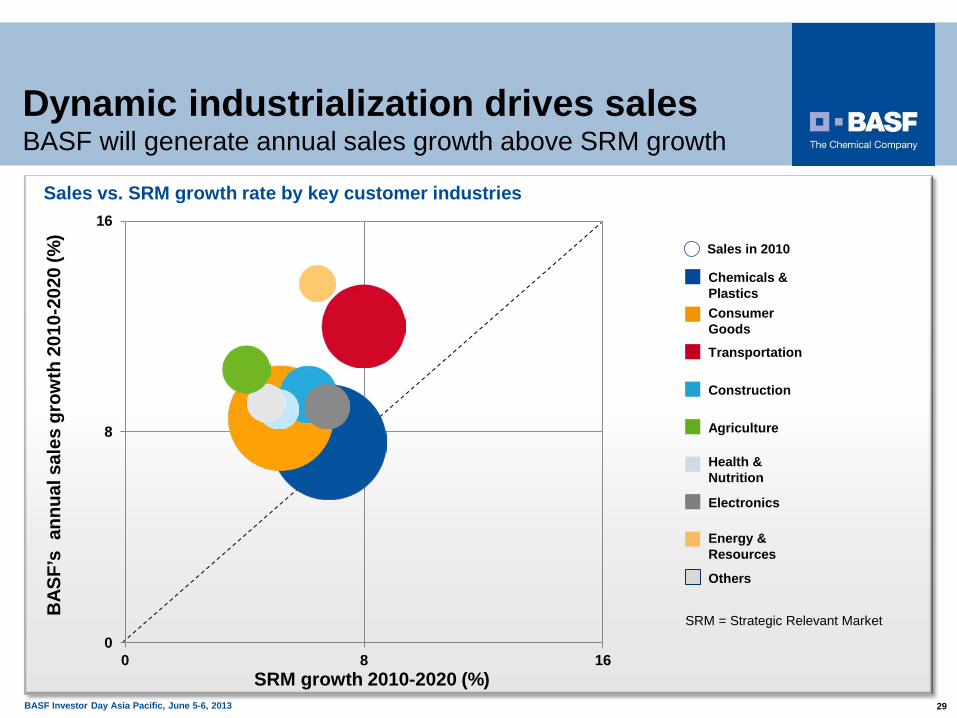
Consumer Goods
Chemicals & Plastics
Construction
Agriculture
Transportation
Health & Nutrition
Electronics
Others
Energy & Resources
Sales in 2010
SRM = Strategic Relevant Market
Sales vs. SRM growth rate by key customer industries
Dynamic industrialization drives sales BASF will generate annual sales growth above SRM growth
BASF Investor Day Asia Pacific, June 5-6, 2013 30
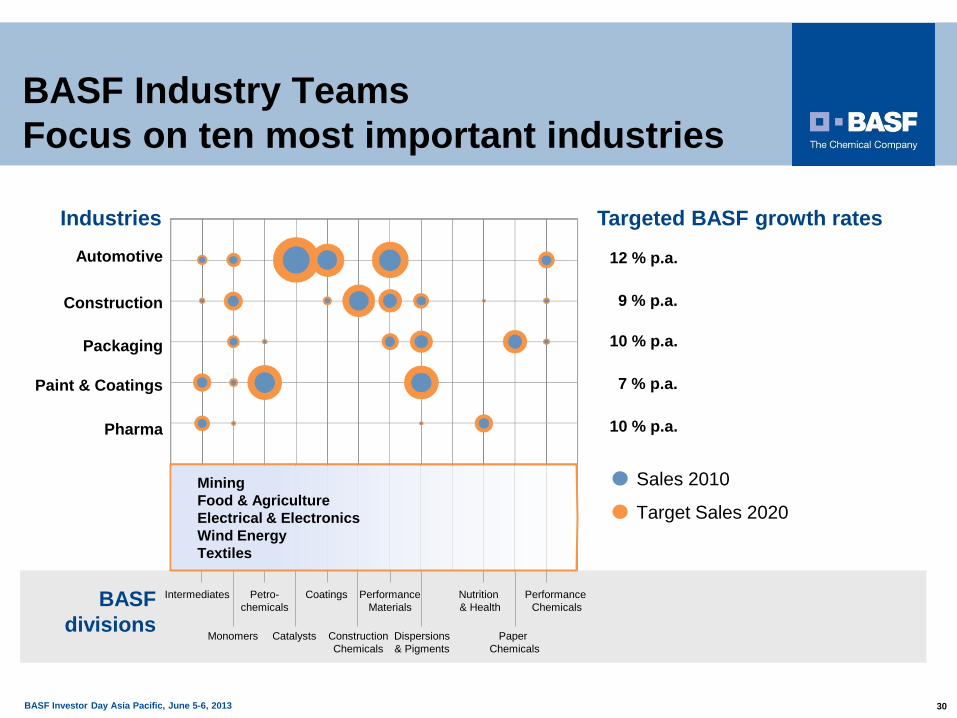
BASF Industry Teams Focus on ten most important industries
Automotive
Construction
Packaging
Paint & Coatings
Pharma
Industries Targeted BASF growth rates
12 % p.a.
9 % p.a.
10 % p.a.
7 % p.a.
10 % p.a.
Sales 2010
Target Sales 2020
Petro- chemicals
Catalysts
Coatings
Construction Chemicals
Performance Materials
Dispersions & Pigments
Nutrition & Health
Paper Chemicals
Intermediates
Monomers
BASF divisions
Performance Chemicals
Mining Food & Agriculture Electrical & Electronics Wind Energy Textiles
BASF Investor Day Asia Pacific, June 5-6, 2013 31
0
8
16
0 8 16SRM growth 2010-2020 (%)
BAS
F’s
annu
al s
ales
gro
wth
201
0-20
20 (%
)
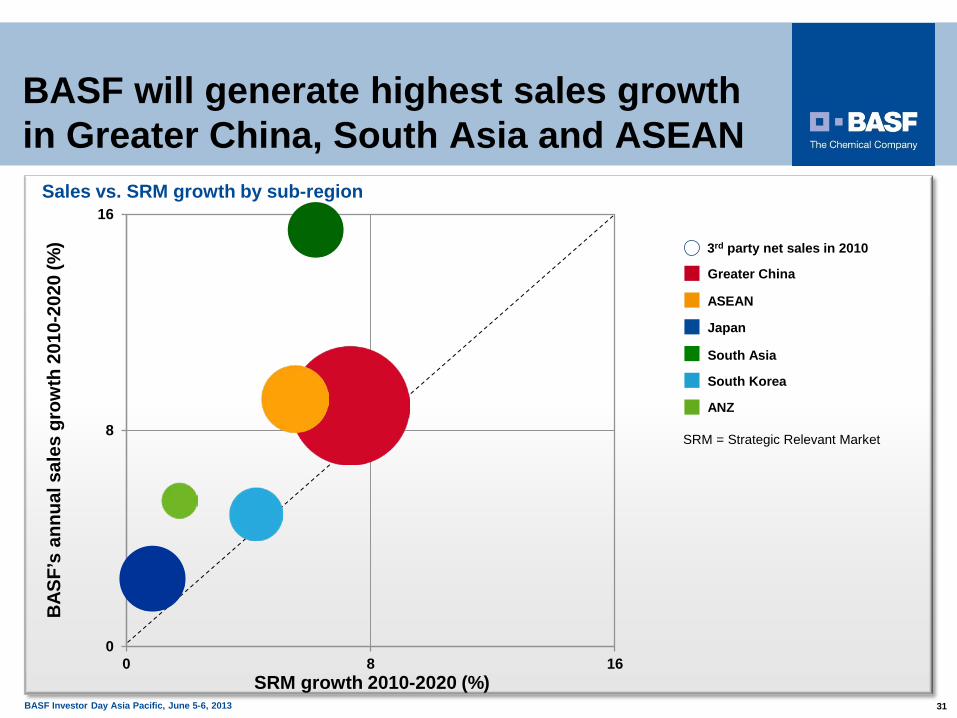
South Asia
ASEAN
South Korea
Greater China
ANZ
Japan
3rd party net sales in 2010
SRM = Strategic Relevant Market
BASF will generate highest sales growth in Greater China, South Asia and ASEAN
Sales vs. SRM growth by sub-region
BASF Investor Day Asia Pacific, June 5-6, 2013 32
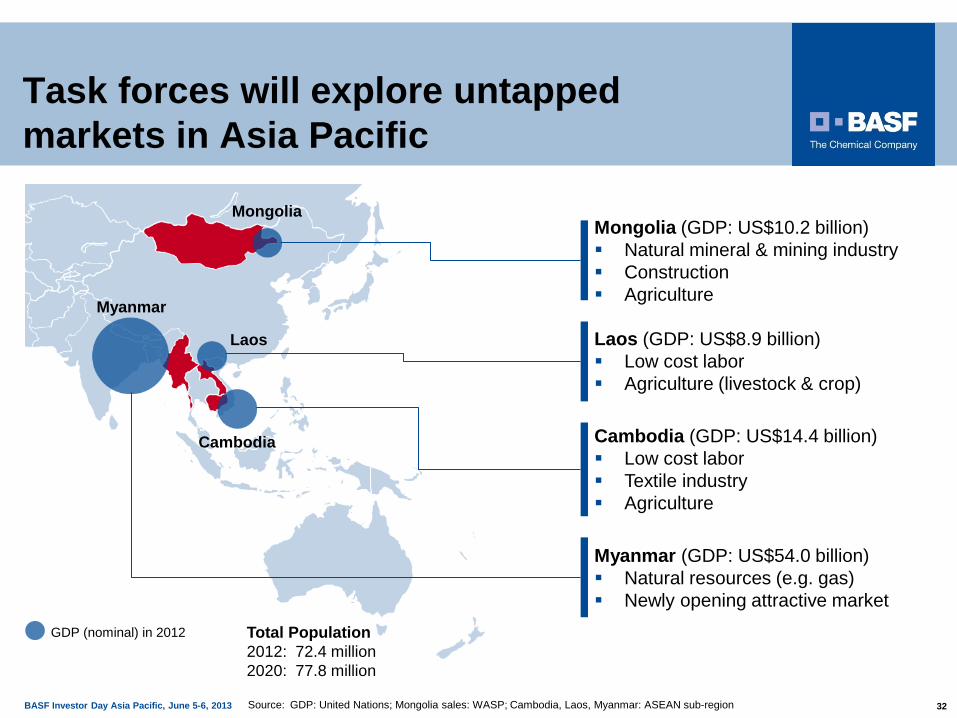
Task forces will explore untapped markets in Asia Pacific
Mongolia
Myanmar
Laos
Cambodia
GDP (nominal) in 2012
Source: GDP: United Nations; Mongolia sales: WASP; Cambodia, Laos, Myanmar: ASEAN sub-region
Total Population 2012: 72.4 million 2020: 77.8 million
Mongolia (GDP: US$10.2 billion) Natural mineral & mining industry Construction Agriculture
Laos (GDP: US$8.9 billion) Low cost labor Agriculture (livestock & crop)
Myanmar (GDP: US$54.0 billion) Natural resources (e.g. gas) Newly opening attractive market
Cambodia (GDP: US$14.4 billion) Low cost labor Textile industry Agriculture

BASF Investor Day Asia Pacific, June 5-6, 2013 33
Tap into the potential of the “Base of Pyramid”
Focus areas Housing: Affordable mass housing,
slum rehabilitation Food: Food fortification, packaging
and storage Energy: Solar energy and wind
energy Healthcare: Water purification,
personal care products
Approach Explore untapped market
opportunities New collaborative business models
for penetrating new markets along with customers, NGOs and government agencies
Initial focus on South Asia, starting in India; potential to be extended to ASEAN / Indonesia Middle Class
Emerging Middle Class
Affluent
Parts of Bottom of Pyramid
BASF Investor Day Asia Pacific, June 5-6, 2013 34
Innovation Driving innovation in Asia for Asia and the world ~3,500 R&D staff by 2020 Expand the Asia Pacific presence within BASF’s
global R&D network Collaborate with customers to capture new
business areas
34 BASF Investor Day Asia Pacific, June 5-6, 2013
BASF Investor Day Asia Pacific, June 5-6, 2013 35
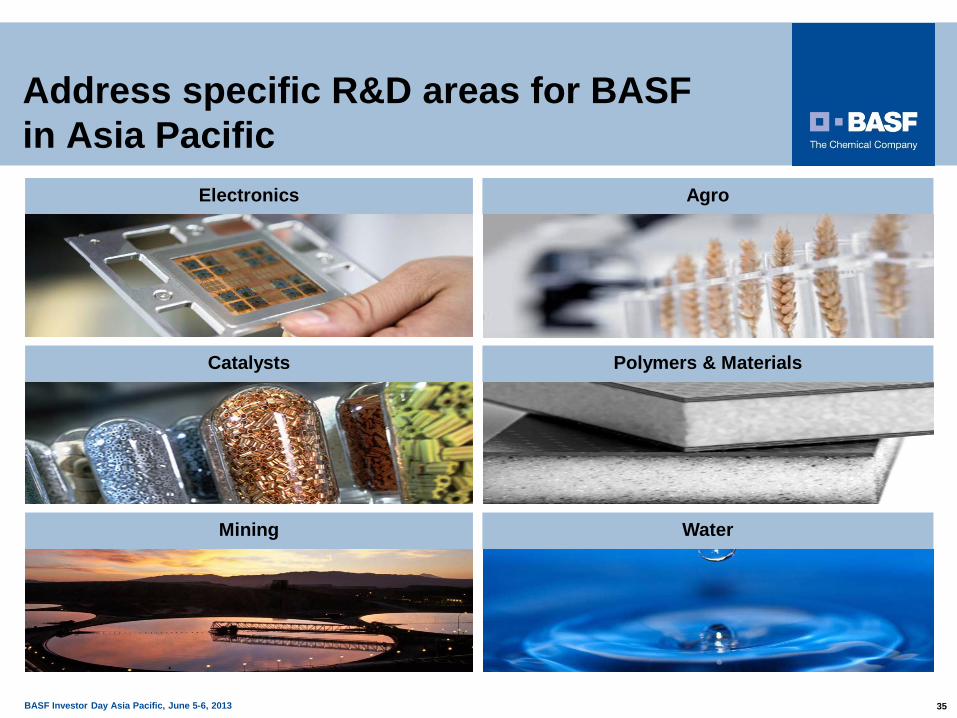
Address specific R&D areas for BASF in Asia Pacific
Electronics Agro
Catalysts Polymers & Materials
Mining Water
BASF Investor Day Asia Pacific, June 5-6, 2013 36
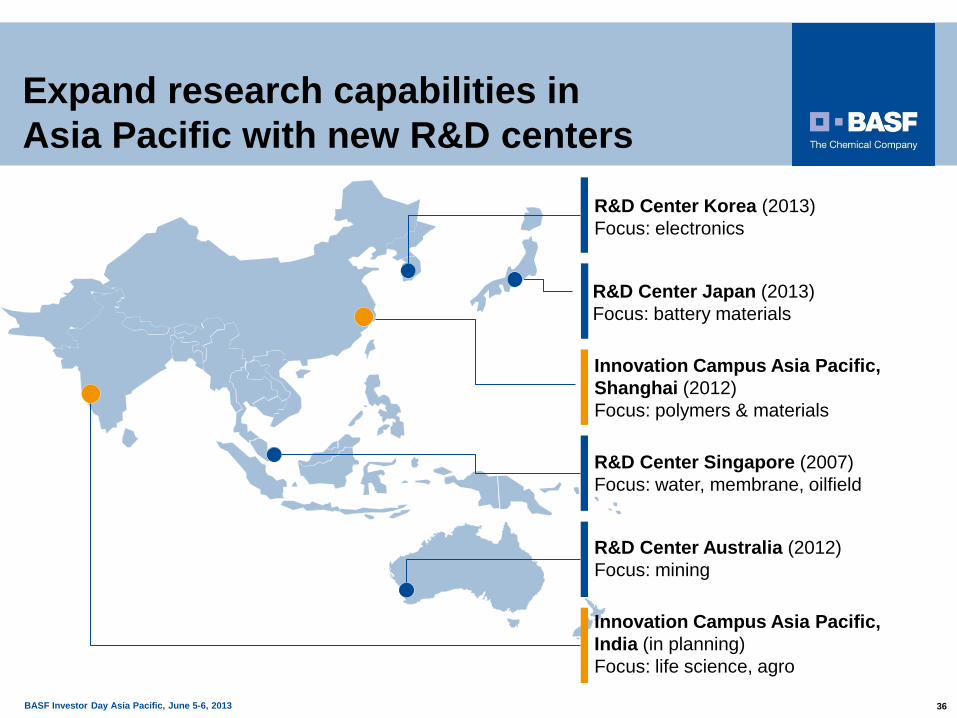
Expand research capabilities in Asia Pacific with new R&D centers
R&D Center Korea (2013) Focus: electronics
R&D Center Singapore (2007) Focus: water, membrane, oilfield
R&D Center Australia (2012) Focus: mining
Innovation Campus Asia Pacific, Shanghai (2012) Focus: polymers & materials
Innovation Campus Asia Pacific, India (in planning) Focus: life science, agro
R&D Center Japan (2013) Focus: battery materials

BASF Investor Day Asia Pacific, June 5-6, 2013 37
Portfolio Enhancing our portfolio >€2 billion sales from new business and acquisitions by 2020 Develop new businesses and growth fields Identify attractive acquisition opportunities
37 BASF Investor Day Asia Pacific, June 5-6, 2013
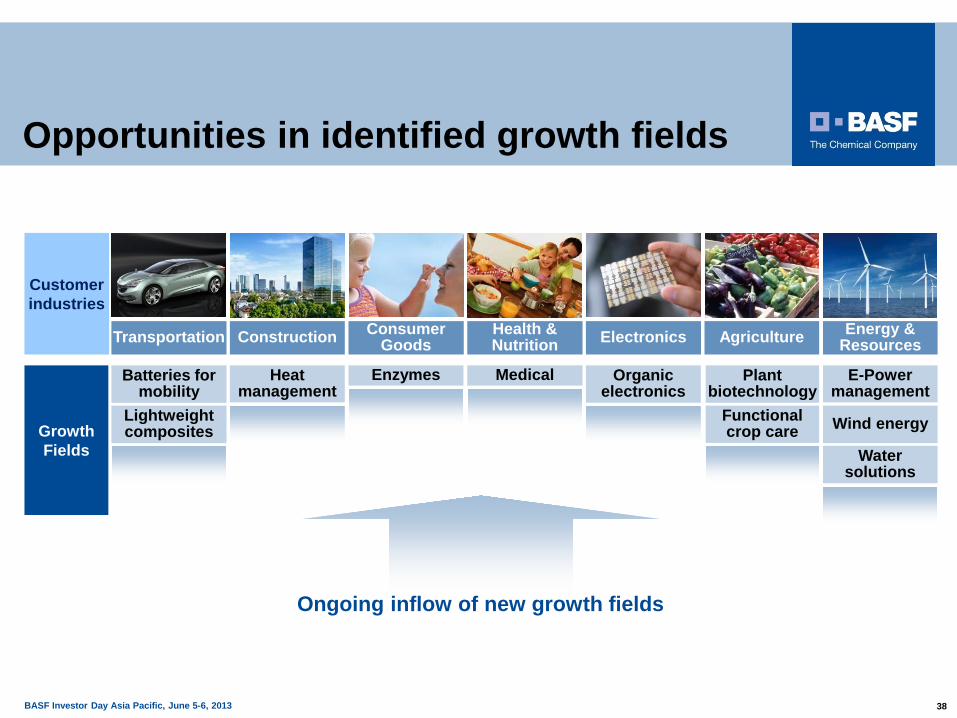
BASF Investor Day Asia Pacific, June 5-6, 2013 38
Ongoing inflow of new growth fields
Opportunities in identified growth fields
Health & Nutrition
Consumer Goods Construction Transportation Electronics Energy &
Resources Agriculture
Customer industries
Water solutions
Heat management
Enzymes Plant biotechnology
Batteries for mobility
Lightweight composites
Functional crop care
Medical Organic electronics
Growth Fields
E-Power management
Wind energy
BASF Investor Day Asia Pacific, June 5-6, 2013 39
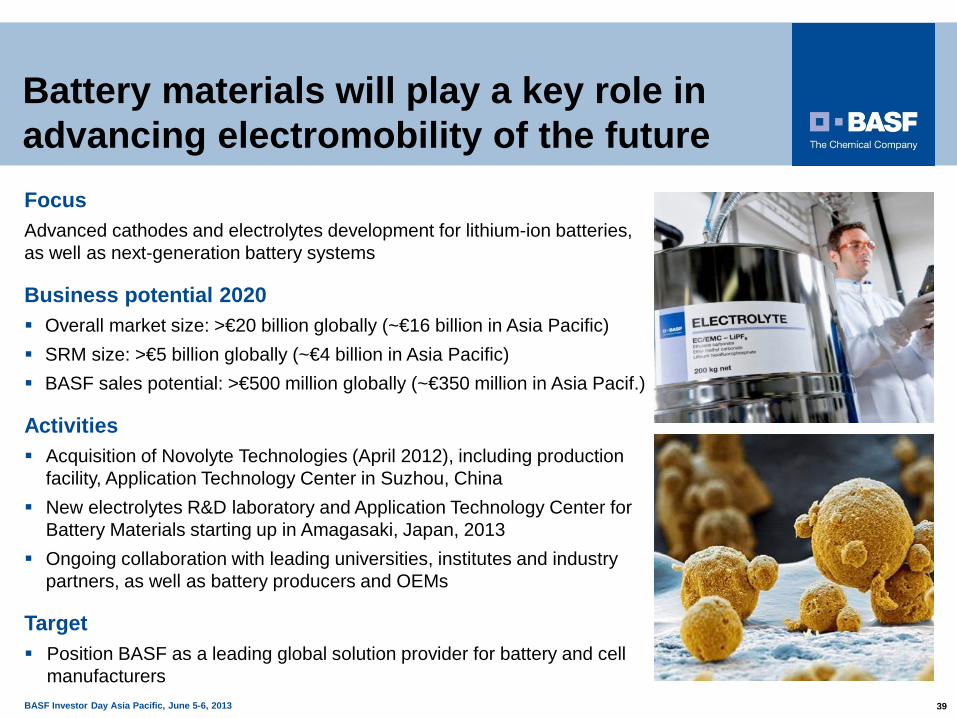
Battery materials will play a key role in advancing electromobility of the future Focus Advanced cathodes and electrolytes development for lithium-ion batteries, as well as next-generation battery systems
Business potential 2020 Overall market size: >€20 billion globally (~€16 billion in Asia Pacific) SRM size: >€5 billion globally (~€4 billion in Asia Pacific) BASF sales potential: >€500 million globally (~€350 million in Asia Pacif.)
Activities Acquisition of Novolyte Technologies (April 2012), including production
facility, Application Technology Center in Suzhou, China New electrolytes R&D laboratory and Application Technology Center for
Battery Materials starting up in Amagasaki, Japan, 2013 Ongoing collaboration with leading universities, institutes and industry
partners, as well as battery producers and OEMs
Target Position BASF as a leading global solution provider for battery and cell
manufacturers
BASF Investor Day Asia Pacific, June 5-6, 2013 40
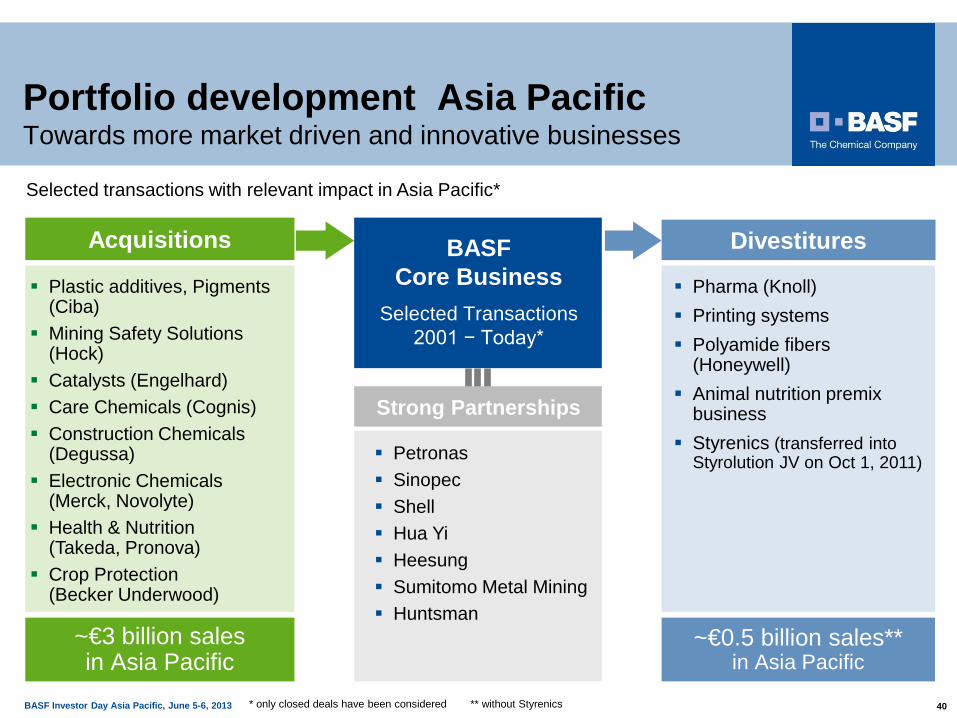
Portfolio development Asia Pacific Towards more market driven and innovative businesses
* only closed deals have been considered
~€3 billion sales in Asia Pacific
Acquisitions
Plastic additives, Pigments (Ciba)
Mining Safety Solutions (Hock)
Catalysts (Engelhard) Care Chemicals (Cognis) Construction Chemicals
(Degussa) Electronic Chemicals
(Merck, Novolyte) Health & Nutrition
(Takeda, Pronova) Crop Protection
(Becker Underwood)
BASF Core Business
Strong Partnerships
Petronas Sinopec Shell Hua Yi Heesung Sumitomo Metal Mining Huntsman
Selected Transactions 2001 − Today*
Divestitures
~€0.5 billion sales** in Asia Pacific
Pharma (Knoll) Printing systems Polyamide fibers
(Honeywell) Animal nutrition premix
business Styrenics (transferred into
Styrolution JV on Oct 1, 2011)
Selected transactions with relevant impact in Asia Pacific*
** without Styrenics
BASF Investor Day Asia Pacific, June 5-6, 2013 41
Investment Expanding our local production network 75% own manufactured products (OMP ratio) by 2020 Implement ambitious investment plan efficiently Form production clusters to address target
industry needs
41 BASF Investor Day Asia Pacific, June 5-6, 2013
BASF Investor Day Asia Pacific, June 5-6, 2013 42
Ambitious investment plan to realize an OMP ratio of 75% by 2020
61 54
75
0
25
50
75
100
OMP ratio (%)
2012 restated
2020 2012
BASF Investor Day Asia Pacific, June 5-6, 2013 43
0
5
10
Investments in Asia Pacific (€ billion)
actual* plan**
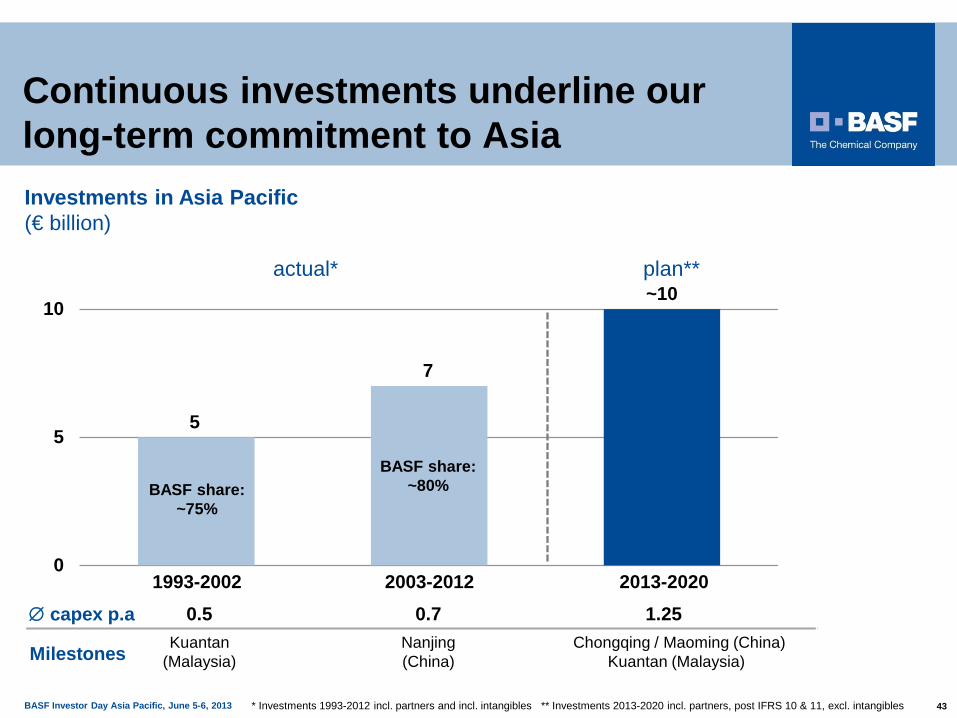
Continuous investments underline our long-term commitment to Asia
1993-2002 2003-2012 2013-2020
5
7
~10
* Investments 1993-2012 incl. partners and incl. intangibles ** Investments 2013-2020 incl. partners, post IFRS 10 & 11, excl. intangibles
BASF share: ~75%
BASF share: ~80%
∅ capex p.a 0.5 0.7 1.25
Milestones Kuantan Nanjing Chongqing / Maoming (China) (Malaysia) (China) Kuantan (Malaysia)

BASF Investor Day Asia Pacific, June 5-6, 2013 44
Investment focus on China, ASEAN, and India
ASEAN
Greater China
South Asia
Japan South Korea
ANZ
Investment of €10 billion until 2020*
* Investments incl. partners, post IFRS 10 & 11, excl. intangibles
BASF Investor Day Asia Pacific, June 5-6, 2013 45
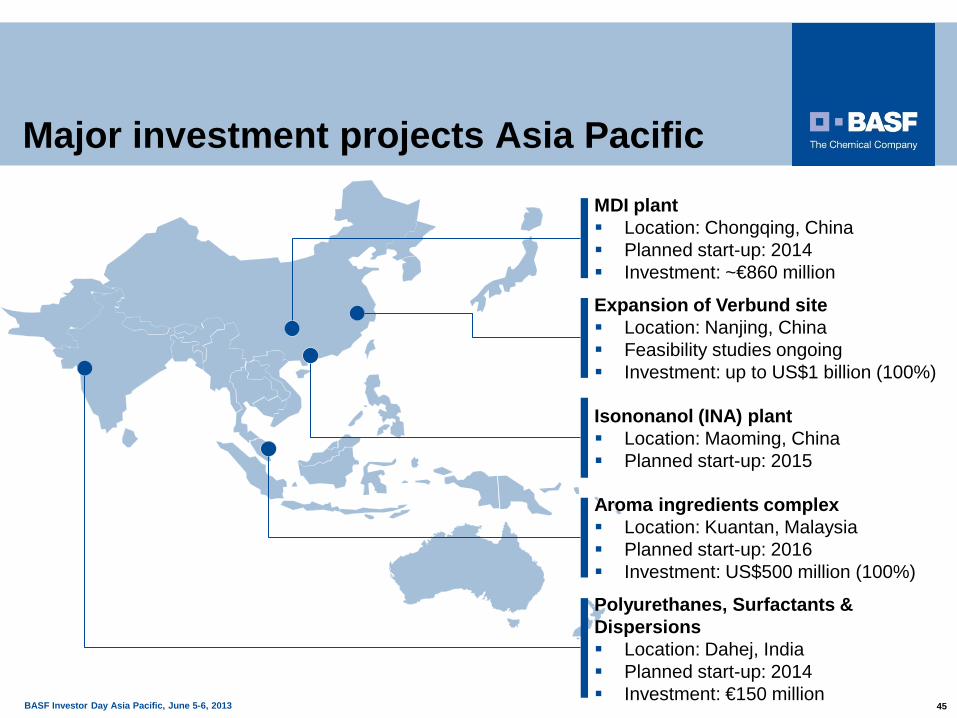
Major investment projects Asia Pacific MDI plant Location: Chongqing, China Planned start-up: 2014 Investment: ~€860 million
Isononanol (INA) plant Location: Maoming, China Planned start-up: 2015
Aroma ingredients complex Location: Kuantan, Malaysia Planned start-up: 2016 Investment: US$500 million (100%)
Expansion of Verbund site Location: Nanjing, China Feasibility studies ongoing Investment: up to US$1 billion (100%)
Polyurethanes, Surfactants & Dispersions Location: Dahej, India Planned start-up: 2014 Investment: €150 million
BASF Investor Day Asia Pacific, June 5-6, 2013 46
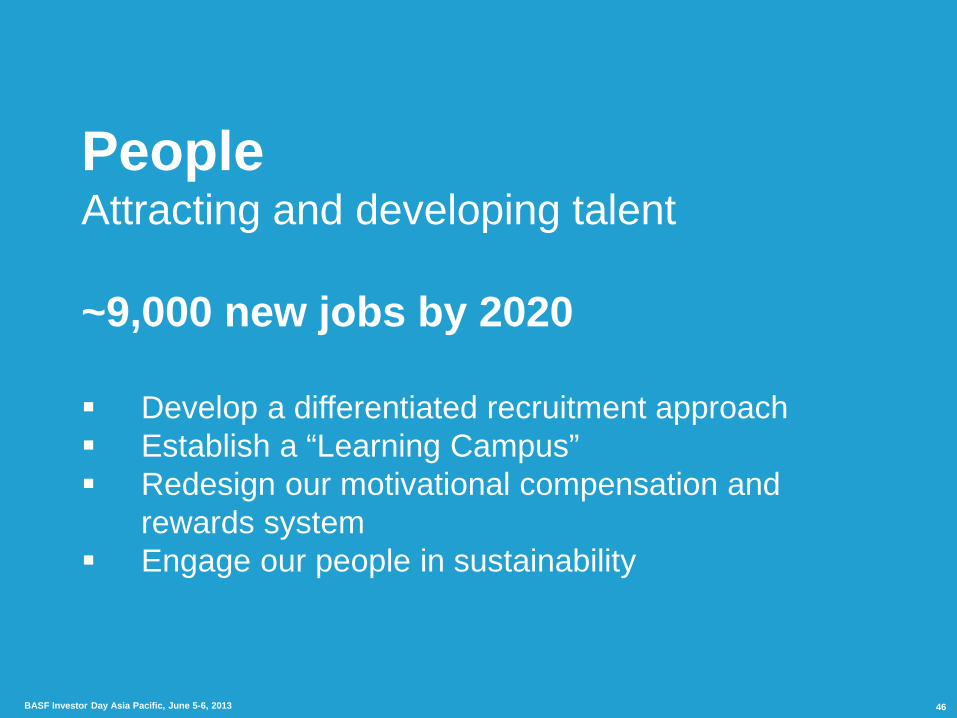
People Attracting and developing talent ~9,000 new jobs by 2020 Develop a differentiated recruitment approach Establish a “Learning Campus” Redesign our motivational compensation and
rewards system Engage our people in sustainability
46 BASF Investor Day Asia Pacific, June 5-6, 2013
BASF Investor Day Asia Pacific, June 5-6, 2013 47
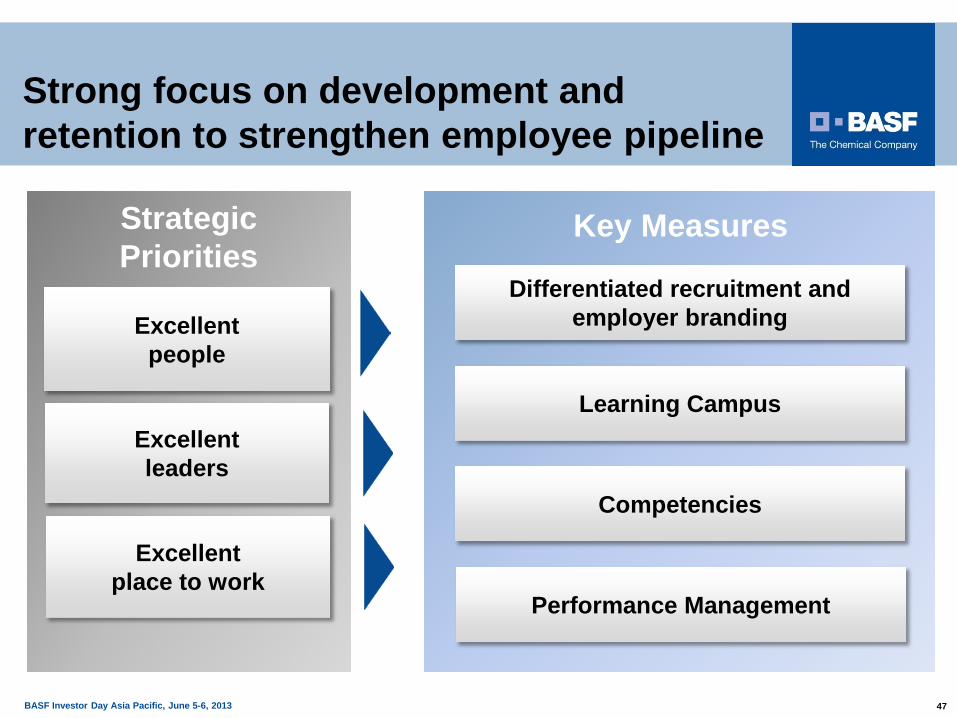
Key Measures Strategic Priorities
Excellent people
Excellent place to work
Excellent leaders
Differentiated recruitment and employer branding
Competencies
Performance Management
Learning Campus
Strong focus on development and retention to strengthen employee pipeline
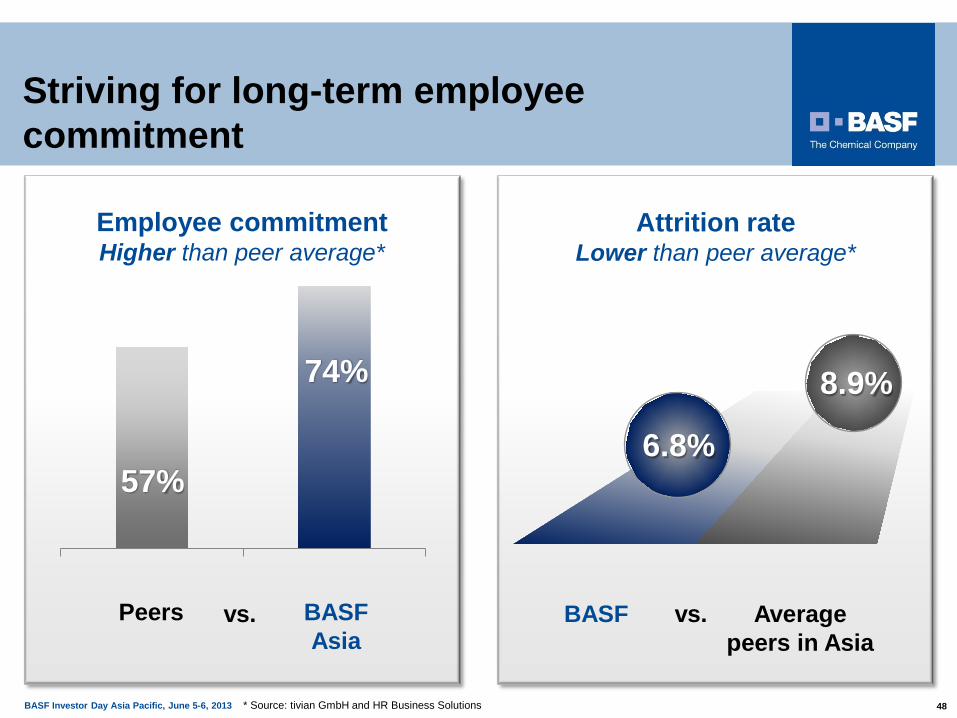
BASF Investor Day Asia Pacific, June 5-6, 2013 48
* Source: tivian GmbH and HR Business Solutions
Attrition rate Lower than peer average*
BASF Average peers in Asia
6.8%
vs.
8.9%
Striving for long-term employee commitment
Employee commitment Higher than peer average*
BASF Asia
Peers vs.
74%
57%
BASF Investor Day Asia Pacific, June 5-6, 2013 49
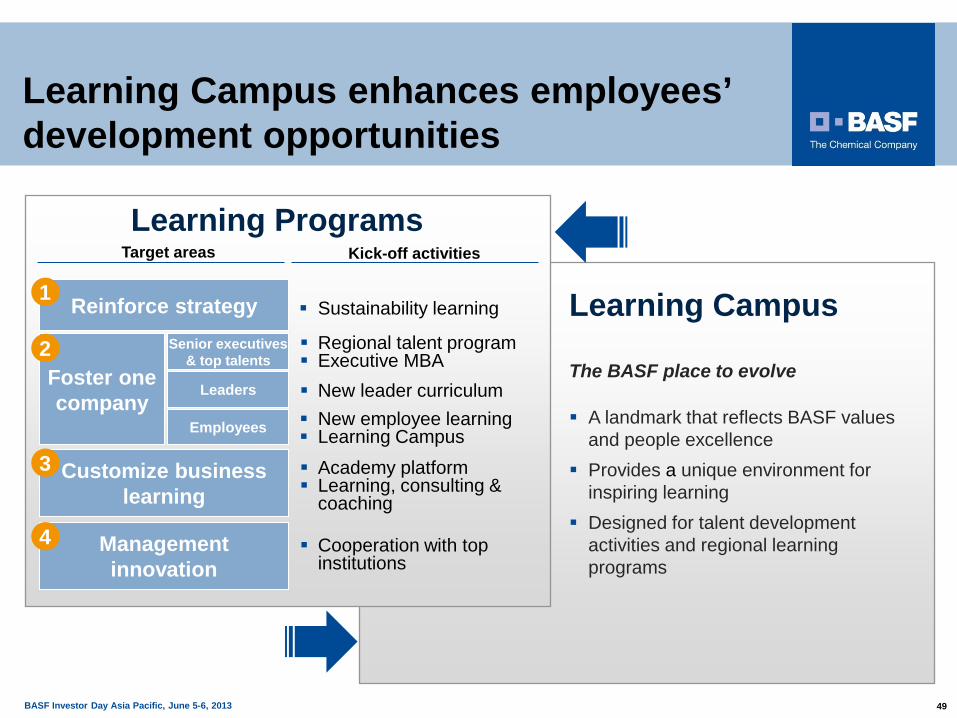
c
Reinforce strategy
Customize business learning
Management innovation
Foster one company
Regional talent program Executive MBA
Leaders New leader curriculum New employee learning Learning Campus
Sustainability learning
Cooperation with top institutions
Senior executives & top talents
Employees
Academy platform Learning, consulting &
coaching
Learning Programs
Learning Campus
Kick-off activities Target areas
1
2
3
4
The BASF place to evolve
A landmark that reflects BASF values and people excellence
Provides a unique environment for inspiring learning
Designed for talent development activities and regional learning programs
Learning Campus enhances employees’ development opportunities
BASF Investor Day Asia Pacific, June 5-6, 2013 50
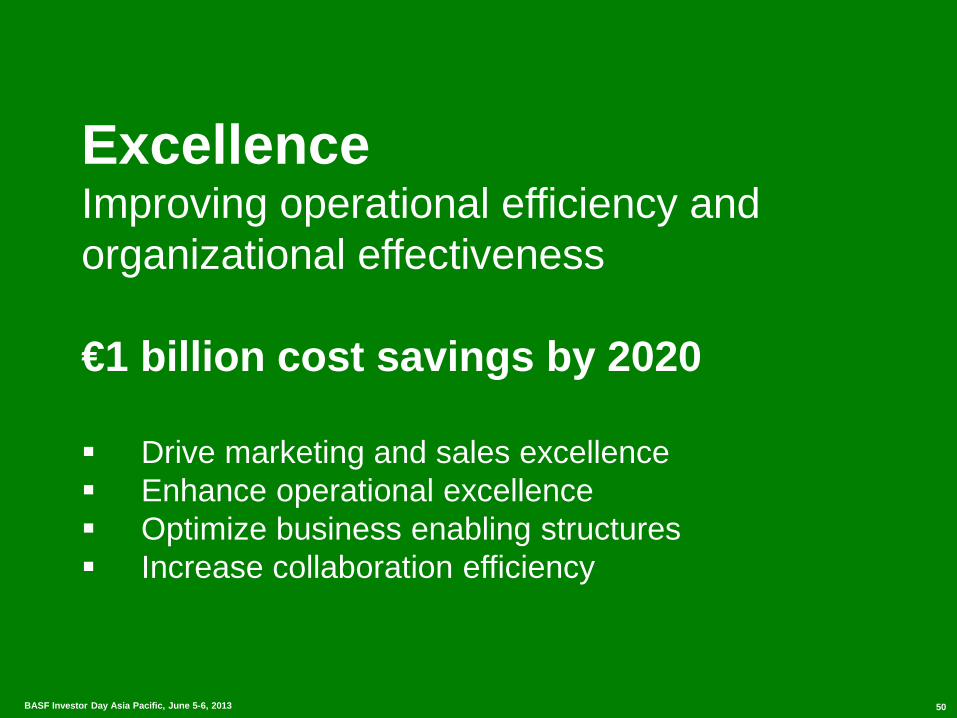
Excellence Improving operational efficiency and organizational effectiveness €1 billion cost savings by 2020 Drive marketing and sales excellence Enhance operational excellence Optimize business enabling structures Increase collaboration efficiency
50 BASF Investor Day Asia Pacific, June 5-6, 2013
BASF Investor Day Asia Pacific, June 5-6, 2013 51
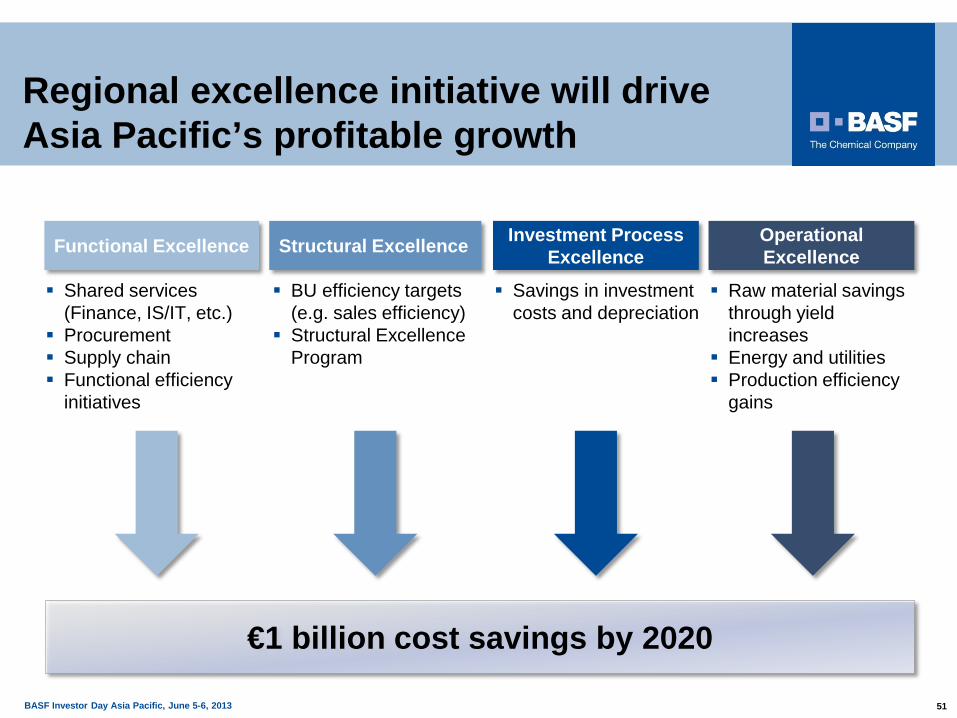
€1 billion cost savings by 2020
Shared services (Finance, IS/IT, etc.)
Procurement Supply chain Functional efficiency
initiatives
Functional Excellence
Savings in investment costs and depreciation
Investment Process Excellence
Raw material savings through yield increases
Energy and utilities Production efficiency
gains
Operational Excellence Structural Excellence
BU efficiency targets (e.g. sales efficiency)
Structural Excellence Program
Regional excellence initiative will drive Asia Pacific’s profitable growth
BASF Investor Day Asia Pacific, June 5-6, 2013 52
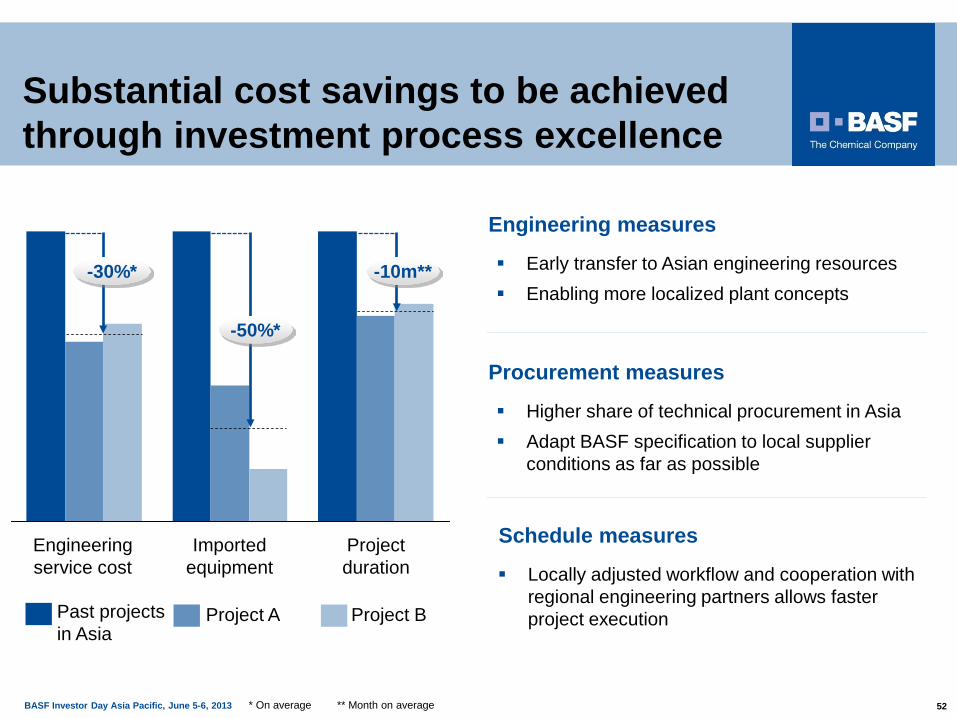
Substantial cost savings to be achieved through investment process excellence
Locally adjusted workflow and cooperation with regional engineering partners allows faster project execution
Project duration
Imported equipment
Engineering service cost
Project A Past projects in Asia
Project B
-10m**
Engineering measures
Early transfer to Asian engineering resources Enabling more localized plant concepts
Procurement measures
Higher share of technical procurement in Asia Adapt BASF specification to local supplier
conditions as far as possible
Schedule measures
* On average
-50%*
-30%*
** Month on average
BASF Investor Day Asia Pacific, June 5-6, 2013 53
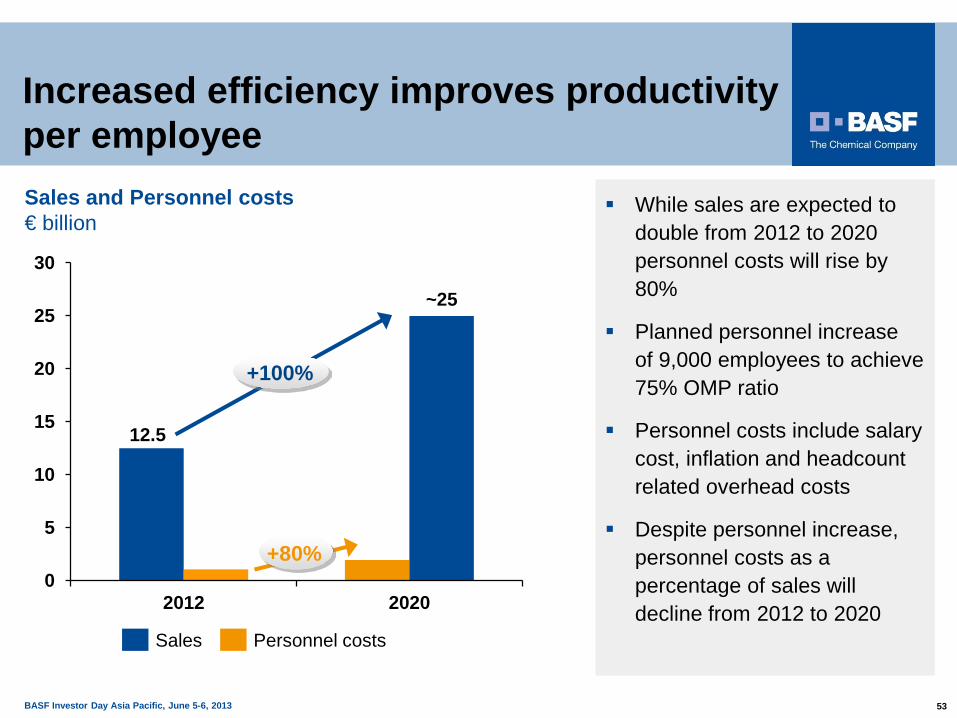
Sales and Personnel costs € billion
Increased efficiency improves productivity per employee
0
5
10
15
20
25
30
2012 2020
12.5
~25
Personnel costs Sales
+100%
+80%
While sales are expected to double from 2012 to 2020 personnel costs will rise by 80%
Planned personnel increase of 9,000 employees to achieve 75% OMP ratio
Personnel costs include salary cost, inflation and headcount related overhead costs
Despite personnel increase, personnel costs as a percentage of sales will decline from 2012 to 2020
BASF Investor Day Asia Pacific, June 5-6, 2013 54
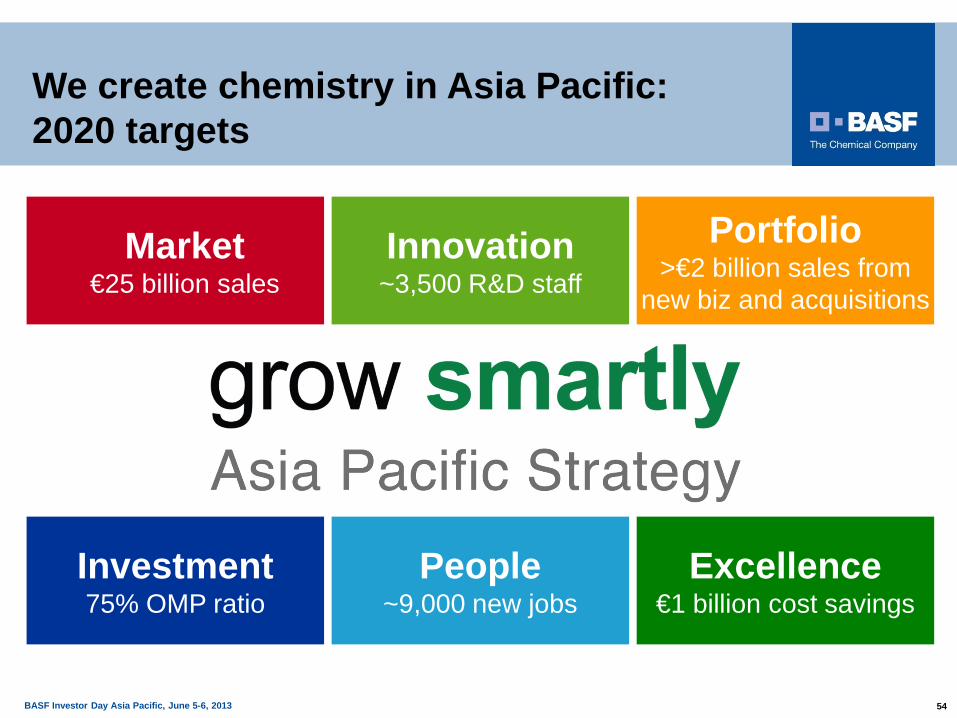
Innovation ~3,500 R&D staff
Market €25 billion sales
Portfolio >€2 billion sales from
new biz and acquisitions
People ~9,000 new jobs
Investment 75% OMP ratio
Excellence €1 billion cost savings
We create chemistry in Asia Pacific: 2020 targets
BASF Investor Day Asia Pacific, June 5-6, 2013 55