Embed Size (px)
Citation preview

8
C h a p t e r 2
MARTIAN SURFACE WINDS: INSENSITIVITY TO ORBITAL CHANGES AND IMPLICATIONS FOR AEOLIAN PROCESSES
Lori K. Fenton and Mark I. Richardson
Division of Geological and Planetary Sciences, California Institute of Technology, Pasadena, California
Abstract. Aeolian features observed on the surface of Mars provide insight into
current, and potentially past, surface wind systems. In some cases the features are
clearly transient and related to the lifting and settling of atmospheric dust. Other
features, like dunefields, yardangs, and ventifacts, are more persistent and likely
require significant time to form. In this study we analyze the observed directions
of selected aeolian features with the aid of the Geophysical Fluid Dynamics
Laboratory Mars general circulation model (GCM). Initially, we examine bright
and dark streaks which have been observed to form in association with global
dust storms. The ability to match these features with Mars GCM wind directions
provides an important validation of the model. More important, we are able to
define best fit seasons and local times for both types of features which provide
the basis for extension and modification of the Veverka et al. [1981] model of
bright and dark dust streak formation. In addition these best fit times correspond
well with the dark streak “wind storm” model of Magalhães and Young [1995]. The
primary focus of this paper is to provide constraints on the range of mechanisms
proposed to explain inconsistencies between current wind direction patterns and
long-term wind indicators (for example, the misalignment of rock tail and
ventifact orientations at the Mars Pathfinder landing site). Specifically, we assess

9
whether changes in planetary obliquity, precession, or global dust opacity could
significantly alter patterns of surface wind directions. In all cases we find the
seasonal and annual average wind direction patterns to be highly invariable. While
changes in the dust loading (hence the partitioning of solar absorption between
the surface and atmosphere) and in the surface latitude of maximum solstitial
insolation cause the vigor of the large-scale circulation to increase (especially the
Hadley cell), the spatial patterns of the surface wind orientations remain
essentially unchanged. In the case of perihelion during northern summer
(opposite of the current perihelion position), the northern summer Hadley cell
remains weaker than the southern summer cell despite the strengthened heating
in the northern hemisphere. Taken together, these results cast significant doubt
on orbital explanations for surface wind changes. It is thus suggested that
significant changes in topography (e.g., Tharsis uplift, true polar wander) or
climate (e.g., the existence of a significantly thicker atmosphere or an ocean at
some point in the past) are more likely explanations for long-term wind indicators
such as the ventifact orientations at the Mars Pathfinder landing site.
1. Introduction
Wind is currently the dominant geological agent acting on Mars. This is evidenced
by images of the Martian surface which show ubiquitous aeolian landforms [e.g.,
Greeley et al., 1992]. These landforms include sand dunes, wind streaks, yardangs,
deflation pits, which have been observed in images returned by Mars Global
Surveyor and the Viking Orbiters [Ward et al., 1985], and ventifacts, which have
been observed by the Viking and Mars Pathfinder landers [Greeley et al., 1999].
The ongoing activity of aeolian processes is evidenced by the observation of dust
suspended in the atmosphere, variations over time in the shapes and locations of
albedo features on the surface, and temporal variations in the occurrence of wind
streaks.

10
A large body of work on Martian aeolian features has accumulated since the
Mariner 9 mission in 1970-1971. Examination of both lander and orbiter images
has revealed a number of aeolian landforms on the basis of their strong similarity
to known, wind-formed features on the Earth, the best-studied of which are the
following:
1. Yardangs are large, free-standing, streamlined blocks that are observed to form
in terrestrial deserts. In a number of locations on the Martian surface, cut and
streamlined blocks exist which are nearly identical to aerial images of terrestrial
yardangs, suggesting a very similar origin [Ward, 1979].
2. Close-up examination of rocks at the Viking and Mars Pathfinder landing sites
has revealed aligned pits, grooves, flutes, and rills [Bridges et al., 1999]. Similar
preferential alignment of such features on terrestrial desert rocks is ascribed to
the action of persistent wind as an erosive agent. These rocks have thus been
interpreted as ventifacts.
3. Sand dunes provide very direct evidence for aeolian activity which not only
generates sand-sized particles through erosion but subsequently transports and
sculpts the sand deposits into dunes and dunefields. Because of their crispness,
lack of superimposed features, and evidence for slipface avalanching [Edgett and
Malin, 2000], some dunes are thought to be recently or currently active. In
contrast to terrestrial dunes, almost all Martian dunes at large scales are
transverse, indicating formation by predominantly unidirectional winds, based on
terrestrial experience.
4. Windblown streaks of material are observed on a variety of scales across the
Martian surface. These streaks are analogous to tails of material observed to form
in the lee of topographic features in windy, desert locations on the Earth [e.g.,
Edgett and Malin, 2000]. A number of different bright and dark streaks occur in

11
spacecraft images of Mars, and it is believed that some streaks are composed of
dust and some of sand. Further, in some cases, streaks may represent regions of
material depletion and in others they may represent regions of accumulation.
With the potential exception of wind streaks, all four types of features require a
significant time to form. For example, on Earth, ventifacts form in tens of years
to thousands of years [Sharp, 1964, 1980] (i.e., orders of magnitude less than the
periods of orbital oscillations). If, in addition, these features exhibit distinct
directionality, it is likely that the dominant, persistent wind direction at the time
of formation is recorded by the features. Martian aeolian landforms do, in fact,
provide strong evidence for unidirectionality of the dominant winds. The nearly
exclusive transverse nature of large Martian dunes provides evidence for
unidirectionality of winds in the recent past (i.e., that portion of geological time
over which sand deposit morphologies have been determined). Additional
evidence for near unidirectionality comes from the preferential orientation of
ventifact pits and sand streaks at various scales. Some care must be taken in
interpreting the aeolian bedform record. Streamline directionality in yardangs may
be structurally controlled by the rock out of which they are carved, and the
directionality of small dunes in channels and craters will be created by winds
strongly controlled by the local topography [Ward, 1979; Greeley et al., 1993].
However, the fact that aeolian bedforms may provide a record of wind
directionality provides one very important motivation for studying these features.
The nature and significance of the aeolian bedform record of wind directionality
provide the primary subject matter for this paper. This wind record is important
because of the degree to which surface winds are coupled to the processes driving
atmospheric circulation and climate. Thus the record provides a unique constraint
on models of the climate. However, this relationship is reciprocal, as models of
the climate and circulation can then be used to interpret the bedforms. The
12
problem is relieved of circularity by the multiplicity of distinct aeolian features.
Examination of this range of features has already generated some apparent
contradictions and puzzles. At the Mars Pathfinder landing site, sand tails and
small duneforms were found to align well with the strongest wind directions
predicted by the NASA Ames general circulation model (GCM) [Greeley et al.,
1999]. However, at the same site, grooves and flutes in ventifacts were found to
be oriented roughly orthogonal to the prevailing winds. This disagreement has
been interpreted as demonstrating that the ventifacts were cut when the
circulation was significantly different [Bridges et al., 1999]. Another example is
provided by the observed formation of bright and dark wind streaks during and
after the second great dust storm of 1977. Wind streaks form in association with
crater rims and other topographic features and likely represent material
deposition or erosion due to airflow modification by topography. Within a belt
near 30º S, both bright and dark streaks were observed to form, but with rather
different directionalities, even when originating from the same topographic
feature [Veverka et al., 1981].
Analytic models of the surface winds generated by tropical Hadley cell
circulations have been used to demonstrate, in a longitudinally averaged sense,
that observed bright streaks are consistent with expected, current wind patterns
[Magalhães, 1987]. This work has been expanded to consider the effects of
longitudinal variations due to topography by Greeley et al. [1993] using a Mars
GCM in which diurnally averaged winds corresponded well with bright streaks
and some dune directions, but not dark streaks or yardangs. Further application
of the GCM to dune forms supports the idea of strongly unidirectional Martian
winds [Lee and Thomas, 1995]. These results suggest that bright streaks and dunes
provide a representative record of current winds, while yardangs, dark streaks,
and ventifacts do not. There must be two distinct reasons for the nonagreement
of dark erosional streaks with diurnal-average modeled current winds and the

13
disagreement between yardangs and ventifacts with these same modeled winds.
This distinction is necessitated by the nature of the features. Yardangs and
ventifacts are features which require significant time to form either by the
deflative action of the wind or by the abrasive action of saltating sand. Thus this
disparity in alignment between yardangs and ventifacts with current winds has led
to the proposal that the observed yardangs and ventifacts are no longer being
formed and hence record ancient wind regimes. The question then arises of what
could cause significant variations in the global wind regime. Do these indicators
record winds generated at times when the orbital eccentricity and planetary tilt
were very different, or are they related to a thicker, early atmosphere or variations
in topography? Unfortunately, there are no yardangs near the Pathfinder landing
site that could provide a comparison between the winds that formed them. Dark
streaks are entirely different. They are observed to form over timescales of days
by orbiter imaging and under distinct meteorological conditions. Specifically, they
are observed to form in the late stages of dust storm decay [Veverka et al., 1981].
Thus dark streaks do not require persistent winds over extended periods and,
further, occur when the surface dust distribution has been perturbed by settling
of dust from a global dust storm. Despite the good observational record of dark
streaks, the mechanism of their origin remains uncertain, and their directions
remain unexplained.
In this paper we employ the Mars GCM developed at the Geophysical Fluid
Dynamics Laboratory (GFDL) as a tool with which to examine the various
aeolian bedforms on Mars. Specifically, we address two questions. First, we ask
how well wind direction predictions generated by the Mars GCM can explain
both the bright and dark wind streaks. Since it is certain that these features are
contemporary, failure to agree with these features casts significant doubt on the
ability of such models to tell us anything about ancient wind regimes. Having
established that the wind streak directions can be fully explained with the Mars

14
GCM (and providing strong evidence for a nighttime lee wave/windstorm
mechanism for their formation, as argued by Magalhães and Young [1995]), we
move on to examine the variation of surface wind directional regimes as the
planetary orbital and spin properties change (precession of the equinoxes and
cycles of obliquity vary on timescales of 104-105 years [Ward, 1992]). These
numerical experiments are designed to ask how well such changes can explain the
occurrence of aeolian bedform directions, as represented by ventifacts and
yardangs, which do not agree well with dunes or Mars GCM predictions. Put
simply, we examine the hypothesis that ventifacts and yardangs record wind
direction patterns associated with secular orbital variations.
In most of the cases that we discuss, the surface winds have been diurnally
averaged and then averaged over a season or longer. It is reasonable to question
how accurately such winds could predict the orientation of long-standing aeolian
features. For example, it is possible that dunes in a sand sea could shift
orientation during a short-lived local dust storm that becomes washed out in the
seasonally averaged winds, thus leading to dune orientations that do not coincide
with average wind directions. However, we regard this situation as unlikely. It has
long been known that the vast majority of the large Martian dunes as seen in the
Viking Orbiter and Mariner 9 images are transverse in form [Breed et al., 1979],
indicating that the winds strong enough to initiate saltation and form dunes are
almost without exception unidirectional [Wasson and Hyde, 1983]. This is
supported by the GCM calculations of wind modality made by Lee and Thomas
[1995]. In addition, both ventifacts and yardangs require strong, unidirectionally
consistent winds to form. Thus averaged winds are likely to reflect the winds that
form these long-standing persistent features.
We begin in the next section by describing the GFDL Mars GCM, which
provides the numerical model used in analyzing the aeolian bedform data. In

15
Section 3 we briefly describe the global surface wind patterns resulting from the
Mars GCM when it has been tuned to provide the best simulation of a non-dust
storm Martian year. Section 4 provides a discussion of how surface winds vary if
the dust optical depth is increased from this control value, as happens during dust
storms. These descriptions are provided for comparison with later simulations in
which orbital parameters are varied and allow some sense of the (small) error in
surface wind directions associated with not knowing how dust opacity will vary
with changes in orbital forcing. In Section 5 we test the ability of the GFDL Mars
GCM to explain the observed contemporary streak data. Correlation of model
predictions with observations is undertaken as a function of season and local time
for a simulation which produces a good match to surface pressure and air
temperature observations of the second great dust storm of 1977. The GCM
explains the streak data well, and on the basis of this analysis we propose a model
for the formation of bright and dark streaks which builds on, but significantly
modifies, the model of Veverka et al. [1981] and in its explanation of dark streaks
is very closely aligned with that of Magalhães and Young [1995]. Having tested the
Mars GCM against current data, we proceed to use the model as a guide as to
whether orbital variations might explain noncontemporary wind indicators.
Equally well, the question could be restated as asking how strict a constraint on
the age of dunes and well-aligned features is provided by the fact that they
correspond well with current wind directions. In Section 6, we investigate the
impact of obliquity changes alone. In Section 7, we vary both obliquity and
phasing of the equinoxes. These simulations demonstrate a remarkable
persistence of the primary surface wind direction patterns, which are dominated
in the tropics on an annual-average basis by the southern summer Hadley flow.
We take the particular example of the Mars Pathfinder landing site (Section 8)
and show that for no combination of obliquity or precession considered can the
ventifact directions be explained.

16
We conclude that nonaligned features are unlikely to be explained by secular
orbital changes and hence are unlikely to be explained by circulations occurring
during the recent periods of Martian geological history in which the topography,
climate, geologic activity, and polar orientation have remained consistent with
current conditions. This conclusion also suggests that the alignment of dunes and
other features with contemporary winds does not necessarily imply that those
features themselves are contemporary
2. Model Description
In this paper we use the Mars general circulation model (GCM) developed at the
Geophysical Fluid Dynamics Laboratory (GFDL). The Mars GCM is based on
the GFDL Skyhi terrestrial model, with the physical parameterizations modified
to reflect Martian conditions. Versions of the model are described by Wilson and
Hamilton [1996], Wilson [1997], Richardson [1999], and Wilson and Richardson [2000].
Briefly, the model includes a CO2 cycle resulting in time-varying seasonal ice caps
and global average surface pressure, atmospheric radiative heating due to CO2
and dust in the visible and infrared, specified injection and global transport of
dust, a water cycle involving atmospheric vapor and ice transport, and
condensation/sublimation of surface water ice.
As used in this study, the model has been modified in one important sense. The
prescription of solar insolation, which results from an orbital calculation, has
been generalized to allow for arbitrary selection of planetary eccentricity,
obliquity, and timing of perihelion passage. Thus issues of climatic response to
changes in planetary orbit and spin orientation can now be addressed with the
GFDL Mars GCM. We use this capability in Sections 6 and 7 to examine
variations in surface wind patterns applicable to the recent past (last few million
years).

17
In all simulations the surface maps have been smoothed to the model resolution
of 5º of latitude by 6º of longitude (discretization in the vertical uses mixed
sigma-P coordinates, with 20 levels between the surface and roughly 85 km [see
Wilson and Hamilton, 1996]). The lowest model level is roughly 200 m above the
surface. The surface boundary conditions for the simulations described in this
paper are defined by Mars Orbiter Laser Altimeter (MOLA) topography [Smith
et al., 1999], Viking Infrared Thermal Mapper (IRTM) albedo [Pleskot and Miner,
1981], and thermal inertia [Palluconi and Kieffer, 1981], all of which have been
smoothed to the 5º x 6º grid of the model. The latter two have been modified
following Haberle and Jakosky [1991] assuming a dust opacity of 0.3. The boundary
layer is described with two schemes. To represent the surface layer, a Monin-
Obukov drag formulation is used, where the drag coefficients depend on the
Richardson number, the lowest-layer thickness, and the surface roughness. Above
the surface layer a Richardson-number-dependent vertical diffusion scheme is
used to mix heat, momentum, and tracers [see Wilson and Hamilton, 1996, and
references therein]. In previous simulations with the GFDL Mars GCM, a surface
roughness of 16.8 cm has been used, which is likely too high. To test the
importance of this parameter, we have undertaken duplicate simulations with
1 cm surface roughness for a few of the simulations to be discussed within this
paper. While the surface wind speeds (and consequent stresses) could differ by as
much as many tens of percent, the simulated surface wind directions were
affected very little. The 16.8 cm and 1 cm roughness length simulations possessed
global wind field directions that correlated to better than 0.97. The simulated
wind direction patterns are far less sensitive to surface roughness variations than
to the other parameters varied in this study. Given that it is wind direction that
we concentrate on in this paper, we consider surface roughness errors to be
unimportant.

18
In addition to orbital parameters, the dust amount is varied as part of the study
reported here. The dust amounts at each location are converted into equivalent
opacities which are used as input to the radiative heating calculations. The dust
amount is not prescribed in the GFDL Mars GCM but evolves under the
influence of model winds and mixing. Only the rate of dust injection into the
lowest model level from the surface is prescribed. In most of the calculations
described here, the injection is constant with longitude and local time but
decreases sinusoidally from the equator to both poles. The rate of dust injection
at the surface is tuned to produce an annual cycle of opacity that results in a good
fit to observed, midlevel air temperatures. For a given injection rate the model
will not continue to accumulate dust, but rather, a seasonally varying cycle of dust
develops which is repeatable from model year to model year. The constant,
single-valued dust injection rate works therefore as a control on the “dustiness”
of the mean model climate. In some simulations this global dust injection is
augmented by stronger, localized sources which aim to represent lifting associated
with dust storms. Again, the injection rate is not determined a priori but is gauged
from its impact on air temperatures and on the strength of the thermal tides [see
Wilson and Hamilton, 1996].
3. Present-Day Winds as Predicted by the GCM
We begin by describing the current seasonal average surface wind patterns. A
more detailed description of surface winds generated in a GCM is given by Joshi
et al. [1997]. Figure 2.1 shows plots of global winds averaged over each season.
The seasonal average winds are nearly identical to wind maps produced for
periods of < 10 days centered on the respective equinoxes and solstices, so few if
any extreme winds have been obliterated by this seasonal averaging. The seasonal
surface winds from this simulation are shown as a control for model experiments

19
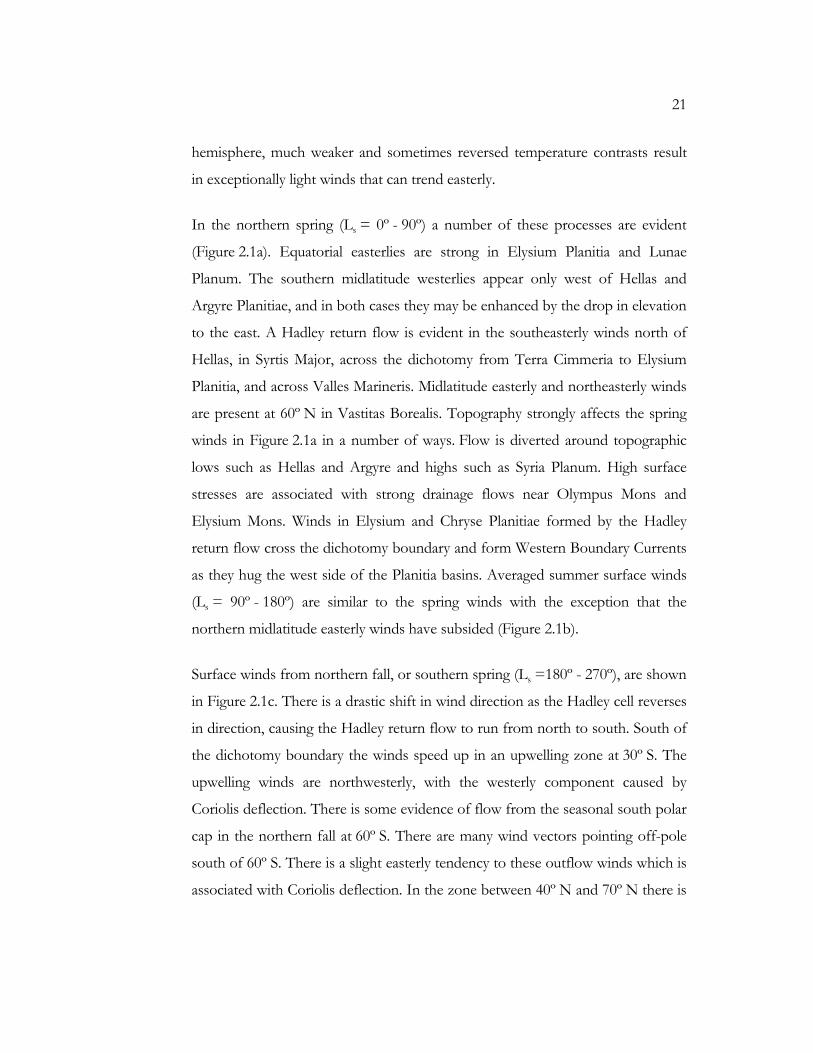
Fig. 2.1. Present-day seasonal average surface winds superimposed on a grayscale MOLA topographic map. Wind velocity is represented by vector length.

20
to be described in later sections in which the dust opacity and orbital parameters
are varied.
The primary influences on daily averaged global surface winds can be grouped
(somewhat arbitrarily) into four main factors: Hadley circulation, planetary
rotation, topographic obstruction, and thermal contrast. Because of Fourier
filtering performed by the GCM, the calculated winds poleward of 75º N and
75º S are not reliable and thus are not described in this work. Daily averaged
winds in the tropics are dominated by the Hadley circulation. Flow at surface
levels proceeds from the downwelling branch in the winter hemisphere toward
the upwelling branch in the summer hemisphere (the Hadley return flow).
Rotation modifies this flow such that a given parcel of air crosses the equator well
to the west of its upwelling and downwelling longitude. All else being equal, this
large-scale circulation would result in a longitudinally uniform belt of parabolically
shaped winds. However, peak daytime heating of the air in the summer
hemisphere is far from zonally uniform. Nonuniformity results from variations in
topography as well as albedo and thermal inertia. Consequently, upwelling is not
longitudinally uniform, resulting in the concentration of surface winds into
distinct currents [Greeley et al., 1993]. In turn, these currents can be modified
where significant topography occurs west of a strong upwelling region. As it is
easier for air to flow around rather than over an obstacle, topography can redirect
and concentrate surface currents. Such concentrations have been identified as
Western Boundary Currents and simulated by Joshi et al. [1995].
Away from the tropics the large-scale circulation is primarily determined by
thermal contrasts and planetary rotation, with secondary modification by
topography. In the winter hemisphere at the midlatitudes, pressure gradients
associated with the temperature contrast between the cold polar air mass and the
warmer extratropical air mass result in geostrophic westerly winds. In the summer
21
hemisphere, much weaker and sometimes reversed temperature contrasts result
in exceptionally light winds that can trend easterly.
In the northern spring (Ls = 0º - 90º) a number of these processes are evident
(Figure 2.1a). Equatorial easterlies are strong in Elysium Planitia and Lunae
Planum. The southern midlatitude westerlies appear only west of Hellas and
Argyre Planitiae, and in both cases they may be enhanced by the drop in elevation
to the east. A Hadley return flow is evident in the southeasterly winds north of
Hellas, in Syrtis Major, across the dichotomy from Terra Cimmeria to Elysium
Planitia, and across Valles Marineris. Midlatitude easterly and northeasterly winds
are present at 60º N in Vastitas Borealis. Topography strongly affects the spring
winds in Figure 2.1a in a number of ways. Flow is diverted around topographic
lows such as Hellas and Argyre and highs such as Syria Planum. High surface
stresses are associated with strong drainage flows near Olympus Mons and
Elysium Mons. Winds in Elysium and Chryse Planitiae formed by the Hadley
return flow cross the dichotomy boundary and form Western Boundary Currents
as they hug the west side of the Planitia basins. Averaged summer surface winds
(Ls = 90º - 180º) are similar to the spring winds with the exception that the
northern midlatitude easterly winds have subsided (Figure 2.1b).
Surface winds from northern fall, or southern spring (Ls =180º - 270º), are shown
in Figure 2.1c. There is a drastic shift in wind direction as the Hadley cell reverses
in direction, causing the Hadley return flow to run from north to south. South of
the dichotomy boundary the winds speed up in an upwelling zone at 30º S. The
upwelling winds are northwesterly, with the westerly component caused by
Coriolis deflection. There is some evidence of flow from the seasonal south polar
cap in the northern fall at 60º S. There are many wind vectors pointing off-pole
south of 60º S. There is a slight easterly tendency to these outflow winds which is
associated with Coriolis deflection. In the zone between 40º N and 70º N there is

22
a strong temperature-driven (geostrophic) westerly wind. Near Tharsis the
topography deflects the flow northward. The increased wind velocity north of
Tharsis is a reflection of the need to conserve mass when the flow becomes
constrained (i.e., the Bernoulli effect).
During northern winter, or southern summer, the surface winds are very similar
to northern fall winds. The only difference is that at high southern latitudes the
winds are almost nonexistent (Figure 2.1d). The loss of the seasonal CO2 ice cap
removes the northward outflow responsible for the off-cap easterly winds
observed during northern fall.
4. Effects of Dust Loading on Surface Winds
4.1. Global Winds
Suspended dust affects atmospheric heating more strongly than any other time-
varying component of the Martian atmosphere. During a dust storm, elevated
dust heats the atmosphere at high altitudes while shading and cooling the near-
surface atmosphere. Because of the increased heating during large dust storms,
the dust amplifies both the diurnal tide and Hadley circulation [Zurek et al.,
1992; Haberle et al., 1982; Wilson, 1997]. Although this change in heating is known
to affect high-altitude winds, the global-scale effects of a dust storm on surface
wind velocities and specifically orientations have not been well studied.
We simulated two dust storms in the model by prescribing a pulse in dust
injection that decayed with an e-folding timescale of 7 sols (Martian days). The
dust injection rate was defined to be four times stronger in the band from 40º S
to 60º S than in the region from 40º S to 40º N. The lower, nominal injection rate
(i.e., that which results in observed air temperatures) was used elsewhere. The
injection pulse was prescribed to begin at Ls = 251º. In the milder case the zonal-
average optical depths during the storm peak at roughly 1.6, with general global

23
values near 0.8. The larger zonal storm has a peak optical depth of 5, with general
global values of 1.5 (see Figure 2.2b).
Figure 2.2 shows three cases of surface winds averaged over Ls = 251º - 291º.
The maps show results for the case without a dust storm (Figure 2.2a, also
described in the previous section, here called the control), with the moderate dust
storm (Figure 2.2c, τ < 1.6), and with the more severe dust storm (Figure 2.2e,
τ < 5.0). The wind maps show that while there can be significant changes in wind
speeds (and hence stresses), there is very little change in global surface wind
directions as the dust amount increases (Figures 2.2d and 2.2f). This lack of
change in wind direction is emphasized by calculation of correlation coefficients
between the wind directions in the control simulation and each of the dust storm
cases. Between the control and the smaller storm, global surface wind directions
are correlated with a coefficient of 0.72; between the control and the larger storm
the coefficient is 0.81. As dust optical depth increases, surface winds can decrease
in speed as well as increase, depending on location. In general surface winds
increase in strength within the Hadley cell region by < 3 m/s (representing
changes of about 10% or so) between our non-dust storm and largest dust storm
cases. One notable exception to this is the Hadley upwelling belt, where surface
winds can increase by over 10 m/s (100% and greater). This increase represents
less of an expansion of the surface expression of the Hadley cell than it does an
increase in the latitudinal extent of the region wherein air is strongly drawn into
the upwelling branch of the Hadley cell (i.e., it represents intensification rather
than expansion). There is, however, a slight poleward growth by a few degrees in
the cell that can be seen in Figure 2.2f. There is little obvious evidence for
poleward expansion of the downwelling branch of the Hadley cell. Small changes
in wind can be seen in the northern tropics, but there is no consistent

24
Fig. 2.2 a.) Global surface winds averaged from Ls = 251º to Ls = 291º in a year with no dust storm. b.) Average global dust optical depth as a function of time for the three storm cases shown in this figure. c.) Global surface winds over the same time period in a year with moderate dust lifting between 20º and 40º S (maximum dust opacity ~1.6). d.) Changes in wind strength and direction of the moderate storm case relative to the non-dusty case. e.) Global surface winds over the same time period in a year with strong dust lifting between 20º and 40º S (maximum dust opacity ~5). f.) Changes in wind strength and direction of the strong storm case relative to the non-dusty case.
pattern to the change that would suggest significant poleward expansion, unlike
the case in the southern hemisphere (but see Section 4.2 describing the Viking
Lander 2 site). The change in stress pattern closely resembles that of wind
velocities, where on a zonal average basis the percentage changes in wind speed

25
and stress are nearly identical. In short, while there is significant evidence for
wind speed and hence wind stress increases with opacity, especially within the
Hadley upwelling region and by factors of 2 or more, the wind directions change
very little and the Hadley cell expansion at surface level is extremely limited, in
stark contrast to its extravagant expansion at upper levels [Wilson, 1997].
4.2 At the Viking Lander 2 Site
The Viking Lander 2 (VL2) pressure and wind data from the period of the
second global dust storm of 1977 have long been taken as strong evidence for a
significant poleward expansion of the Hadley cell at the surface level. The
measured wind data (see Figures 2.3a and 2.3b) clearly show a transition from a
light, prestorm westerly flow (U > 0, V ~ 0), characteristic of the midlatitudes, to
a stronger northeasterly flow (U < 0, V < 0), characteristic of the “trade winds”
or the return flow of the Hadley cell, during the peak of the storm. These data
have been considered as strong evidence for the entrainment of the VL2 site
within the Hadley cell domain, and the fact that the VL2 site is at 48º N suggests
that a zonally uniform Hadley cell would need to expand many (probably tens of)
degrees to accomplish this [Haberle et al., 1982]. This seems to strongly contradict
the results described in Section 4.1.
To test the validity of Mars GCM-predicted surface winds and their change with
varied forcing, we have used output from a Mars GCM simulation of the 1977b
dust storm in which the dust injection has been tuned to match surface pressure
and global air temperature observations. This simulation is more fully described
and compared with surface wind streak observations in Section 5. We have used
daily averaged winds from the model for the nearest GCM grid point to location
of the VL2 site (47.5º N, 228º W versus the actual landing location of 47.97º N,
225.74º W). These winds are shown in Figures 2.3a and 2.3b and demonstrate
that the model does a very good job in capturing both the nature of the wind

26
Fig. 2.3. A comparison of a.) zonal (westerly) and b.) meridional (southerly) winds measured by Viking Lander 2 and predicted by the general circulation model (GCM) over the lander site. Wind speed, direction, and divergence are shown c.) before the 1977b dust storm at Ls = 271º and d.) during the dust storm at Ls = 287º. Convergence (upwelling) is shown as light shades; divergence (downwelling) is shown as darker shades. The line labeled 0 delineates the change from convergence to divergence.

27
shift and the magnitude of the winds. It is important to note that this simulation
was not specially tuned to match the surface winds at the Viking Lander sites,
that it is the same simulation used in matching the wind streak data, and that the
wind patterns produced by this tuned simulation correlate strongly with those
produced by the simpler simulations discussed in Section 4.1. In short, the
“expansion” of the Hadley cell as evidenced by the VL2 is somehow completely
consistent with the nearly negligible change in global surface wind patterns
predicted by the Mars GCM.
The apparent contradiction between the GCM results and the VL2 observations
results from the oversimplified reasoning in the introduction to this section: it is
well known that the “Hadley cell” is not zonally uniform. As discussed in
Section 3 and by Joshi et al. [1995], the cell is more likely composed of zonally
concentrated currents, which in turn are strongly modified by topography.
Examination of the global wind fields just before and just after the start of the
model 1977b storm (Figures 2.3c and 2.3d) does suggest a very slight expansion
of the Hadley cell, manifested as an increase in northerly winds in some locations,
decreases in southerly winds in others, and some wind vector rotation. However,
at most latitudes and longitudes in the northern descent belt (roughly 25º N to
55º N), winds do not rotate to northeasterly, as they do at VL2, and are only
slightly deflected in most cases. Exceptions occur over the northwestern portions
of Arabia Terra and near Phlegran Montes, where winds do become more
consistent with entrainment in an expanded Hadley cell. One still has to be
careful, as it is easy to find examples, such as over southern Acidalia, in which
winds rotate away from the “trade wind” northeasterly to “extratropical”
southwesterly with the onset of the storm and presumed expansion of the cell.
Winds at the VL2 site can be thought of in two related ways. First, the circulation
in the vicinity of the VL2 site (the Isidis - Utopia Planitia region) can be described
using a stationary (high-pressure and hence anticyclonic) eddy model. During the

28
dust storm this circulation becomes elongated, and the northeasterly component
of the circuit becomes extended and “reaches” up along the northwest edge of
Elysium Mons and the northeast trending Phlegran Montes. This northeasterly
extension sweeps through a very small (few degrees) region which encompasses
the VL2 landing site. The existence of this stationary cyclonic system is directly
related to the Hadley flow as the high-pressure results from a descending plume
(part of the Hadley downwelling). As the storm begins, this downwelling
increases and expands, spreading the downwelling plume into the area around the
VL2 site (i.e., Figures 2.3c and 2.3d show divergent, or downwelling, winds as
darker shades near the VL2 site). In this plume, winds begin as westerlies before
the global dust storm begins (Ls = 271º, Figure 2.3c) and rotate to the northerlies
expected for Hadley return flow during the dust storm (Ls = 287º, Figure 2.3d).
East of this downwelling plume is an arc of upwelling and thus convergence (i.e.,
light shaded region in Figures 2.3c and 2.3d) where winds do not rotate in
accordance with the classical Hadley return flow. Thus, a short distance away
from the VL2 site, circulation is not dominated by the expected Hadley
downwelling plume. Examination of Figures 2.3c and 2.3d, in fact, shows that the
very “clean” signal of the Hadley cell expansion seen by VL2 during the storm
appears to be something of a fluke. In addition to the longitudinal variation, there
is also a latitudinal change in Hadley downwelling strength. For example, the clear
signs of Hadley expression measured by VL2 at a latitude of 48º N imply that the
classical downwelling should intensify to the south. Inspection of Figures 2.3c
and 2.3d shows that the most strongly divergent, downwelling winds (i.e., darker
shades) are located west of the VL2 landing site and that there is no southward
intensification of this divergence. In short, while some modification of surface
winds occurs and the Hadley cell does expand, the expansion is very much
weaker and more complex than suggested by simple (axisymmetric) interpretation
of the VL2 data. Aside from suggesting that the Mars GCM does a very good job

29
in matching surface winds for a variety of dust-forcing conditions, these results
point to obvious dangers in relying on very small numbers of surface probes to
determine global circulation patterns.
5. Formation of Wind Streaks
Several types of wind streaks have been documented and studied using Viking
and Mariner 9 images [Arvidson, 1974; Thomas et al., 1981, 1984; Veverka et al.,
1981]. The most widespread and prevalent are bright streaks (see Fig. 2.4a),
thought to be dust deposited in the lee of craters and other obstacles (called type
I(b) by Thomas et al. [1981]). Greeley et al. [1993] and Magalhães [1987] showed that
these bright streaks correlate well with the strong surface winds predicted during
northern fall and winter.
A less populated set of streaks is the dark erosional streaks, called I(d) by Thomas
et al. [1981]. These dark erosional streaks are to be distinguished from dark
depositional streaks that are associated with sediment deposits, called type II,
which are not discussed in this work. The dark erosional streaks are thought to be
formed when turbulent flow behind obstacles activates sand saltation, which in
turn kicks dust into suspension. These streaks (shown in Fig. 2.4b) are
concentrated in a band at 30º S and point in almost the opposite direction as the
bright streaks. Surprisingly, many craters in this region have both bright and dark
streaks emanating from them, implying that the processes that produce bright
and dark features overlap spatially [e.g., see Fenton and Richardson, 2001a, Figure 1].
Thomas and Veverka [1979] determined that dark erosional streaks form while
major seasonal dust storms subside and subsequently remain fairly stable until the
onset of the next seasonal storm. However, GCM-produced diurnally averaged
surface winds during the northern fall and winter do not reproduce the easterly
winds that must form these dark streaks [Greeley et al., 1993]. How two sets of
surface streaks with differing orientations and albedos could form during the

30
Fig. 2.4. a.) Bright depositional streaks and b.) dark erosional streaks binned to the 5º by 6º resolution of the GCM (courtesy of P. Thomas). c.) GCM surface winds that correlate best with bright streaks between 20º S and 40º S, shown at Ls = 288º and the same time of day, 1 H, at all longitudes. d.) GCM surface winds that correlate best with dark streaks between 20º S and 40º S, shown at Ls = 207º and the same time of day, 20 H, at all longitudes.
same season, and in some cases in the same location, has remained a mystery.
Although Greeley et al. [1993] showed that a Mars GCM can match bright steak
orientations to a moderate degree of accuracy (with a maximum global correlation
coefficient of ~0.5), the predicted surface winds used in this study were averaged
over a full diurnal cycle. However, dust travels in suspension, and so the
differential ability of dust to settle through a turbulent, daytime boundary layer
versus a stagnant, nighttime boundary layer may provide some diurnal bias
[Veverka et al., 1981]. Thus bright depositional streaks may form at a specific time
of day when winds allow dust to settle out of the atmosphere, and dark erosional

31
Fig. 2.4 (cont.) e.) Correlation of bright streaks with global GCM surface winds and f.) correlation of dark streaks with global GCM surface winds as a function of Ls and time of day. g.) Correlation of bright streaks with surface winds between 20º S and 40º S. h.) Correlation of dark streaks with surface winds between 20º S and 40º S. The location of the map in Fig. 2.4c is outlined in the plots of Figs. 2.4e and 2.4g, and the location of the map in Fig. 2.4d is outlined in the plots of Figs. 2.4f and 2.4h.
streaks may form at a specific time of day when winds are strong enough to cause
saltation to kick up dust into suspension. Because of their transient nature, wind
streaks are likely affected by wind variation such that even diurnally averaged
winds cannot describe them, whereas other more persistent aeolian features (such
as yardangs and sand seas) can be described by seasonally or annually averaged
winds.
To examine whether bright and dark streaks could both be accommodated by
winds predicted with the GFDL Mars GCM, we examined model surface winds
as a function of both local time and season. In order to produce the best possible

32
match, we examined output from a simulation in which the dust injection rate
had been tuned to provide a good fit to the 1977a and 1977b global dust storms.
The quality of the fit was checked by comparison with Viking Orbiter air
temperature and Viking Lander surface pressure measurements [Wilson and
Richardson, 1999]. Figs. 2.4c and 2.4d show GCM output surface winds at 1 H,
Ls = 288º and at 20 H, Ls = 207º, respectively. The winds in Fig. 2.4c resemble
the pattern of bright streaks, and the winds in Fig. 2.4d resemble the pattern of
dark streaks. Fig. 2.4e and 2.4f show correlation coefficients of the fit between
model winds and observed streak orientations for each hour of the day and for
30 Ls periods ranging from Ls = 207º to Ls = 17º. Global winds correlate well
with bright streaks at all times of day during solstice at the peak of the dust storm
(Fig. 2.4e), with a maximum correlation coefficient of 0.64. For dark streaks,
good fits were found only in the evening before and after the dust storm (before
and after the solstice) (Fig. 2.4f), with a maximum value of 0.43.
Although these fit values are reasonable, they still suggest significant error in
fitting the full, global streak orientations. However, two things are to be noted:
the bright steaks are “fit,” on a global scale, almost equally well at all local times
and visual comparison of the dark streak data (Fig. 2.4b) with the 20 H, Ls = 207º
GCM output (Fig. 2.4d) suggests that almost all the global error is being
introduced by the dark streaks located on or around the Tharsis Plateau. The
relatively high correlation of the GCM with the bright streaks at all local times
around solstice is interesting, implying that wind directions are consistent at all
hours of the day in this seasonal window. While not shown owing to limitations
of space, comparison of the bright streak data from different regions with the
hourly GCM output suggests that the dominant, bright streak-forming winds
occur at different times in different locations. This can be demonstrated by
considering only the region between 20º S and 40º S (Fig. 2.4g). Here the
maximum correlation coefficient of the fit is 0.8. The global insensitivity of the

33
GCM wind streak fit to local time provides a useful explanation for the relatively
good fit of diurnally averaged GCM surface winds to bright streaks found by
Greeley et al. [1993]. In fact, upon inspection of the GCM output, we found that
bright streaks seem to be located in areas where winds rotate the least during the
global dust storm (80º or less). Locations with the more typical 360º daily wind
rotation do not contain these streaks, probably because any accumulation of
bright dust in the lee of these features is immediately destroyed as winds shift
direction.
The very definite preference of dark streaks for nighttime winds provides an
equally good explanation for the Greeley et al. [1993] failure to fit the dark streaks,
in that these winds are “washed out” in diurnal averaging. However, the global
dark streak fit found in this study is less than spectacular. To demonstrate the
impact of the modeled winds in and around Tharsis, we again consider only data
and output from 20º S to 40º S (Fig. 2.4h). This results in a maximum fit
coefficient (for the same time of day as Fig. 2.4f) of 0.78. In this case we believe
that the model is not adequately resolving the details of the near-surface
circulation in the topographically complex Tharsis region.
Figures 2.4c and 2.4d show that in many locations, surface wind directions rotate
significantly between 20 H and 1 H. In the southern tropical belt the winds can
shift by up to 180º in direction. These large-scale, diurnal changes in the winds
are a component of the global tides. The tides result from the movement of the
region of peak solar heating in longitude as the planet rotates. At a crude level this
sets up a low-pressure system that lags the longitude of peak heating, with a
compensating high-pressure system on the opposite side of the planet. The tidal
flow response to this pressure gradient is a global nighttime-to-daytime flow,
which creates easterlies in the 20º S to 40º S belt after midnight and westerlies
during the afternoon.

34
We have mentioned that the dark streaks and the bright streaks are best fit with
the GCM winds at different times during the southern summer season. The best
fits to the dark streaks occur before Ls = 225º and after Ls = 325º, while the
bright streaks are best fit between Ls = 250º and Ls = 300º. A central question
when pondering the mechanisms by which wind streaks form is whether the
dominant factor determining the change in large-scale circulation patterns is
seasonal (the bright streak best fits are at solstice, while the dark streak fits stradle
solstice) or due to the global dust storm which began at Ls = 270º (the bright
streaks are best fit during the storm, while the dark streaks are best fit before and
after). The fact that the bright streaks are well fit for some significant time before
the dust storm was initiated in the model suggests that seasonal factors are more
important. To test this, we reproduced the correlation calculations undertaken for
the “dust storm” simulation with the uniform dust injection “control” simulation
(without a global dust storm) described in Section 3. This produced coefficient fit
matrices very similar to those shown in Figs. 2.4e and 2.4f. The shift in winds is
then primarily a seasonal effect, as would be expected from Section 4.1, in which
the general insensitivity of global wind patterns to dust loading was
demonstrated.
The only previous published attempt to explain the occurrence of bright and dark
streaks in similar locations was put forward by Veverka et al. [1981]. They argued
that bright streaks would form at times of high static stability, relatively low wind
speed, and high dust opacity. The high dust opacity provides a dust source, while
the wind and stability provide conditions conducive to the development of flow
blocking (development of stagnant air) in the lee of craters and other obstacles.
For dark streaks they argue that high winds and low static stability produce the
turbulence necessary to erode dust in the lee of obstacles. In this case the wind
possesses enough momentum to flow over the obstacles, as opposed to the
previous case, where wind is forced to flow around obstacles. On the basis of

35
these arguments they predicted that bright streaks would form during dust storms
when the atmosphere is most subadiabatic and that dark streaks would form after
the end of the global dust storm during the afternoon when surface heating
would produce the most turbulence.
Our results suggest that two factors are important in determining whether air
flows over or around obstacles: wind speed and atmospheric instability. A stable
atmosphere grows warmer with height (dT/dz > 0), and an unstable atmosphere
grows cooler with height (dT/dz < 0); an isothermal atmosphere defines the
boundary between these states (dT/dz = 0). The combination of wind velocity
and atmospheric stability creates four possible conditions (see Figure 2.5): (1) In a
thermally unstable atmosphere, low winds flowing over an obstacle produce a
convergent plume (upward flow), and never reach the opposite side. (2) Higher
winds in an unstable atmosphere would be able to climb over an obstacle,
creating a lee wave that would not strongly affect the surface flow. (3) In a
thermally stable atmosphere, low winds diverge around obstacles, leaving a quiet
zone in the wake, possibly allowing for deposition behind the obstacle. (4) Higher
winds in a stable atmosphere can climb over obstacles but immediately flow back
down the lee side, possibly leading to erosion in the wake.
Bright streaks appear to be formed under condition 3 during large dust storms,
when winds are low and the atmosphere is stable but near isothermal, leading to a
shadow zone in which dust may quietly fall out. Although strong winds also
occur during dust storms, the more isothermal nature of the atmosphere may
cause weak lee waves to form (in between conditions 2 and 4), thus keeping the
deposits from being eroded. This is consistent with the theory of Veverka et al.
[1981].
Dark streaks are likely caused by condition 4 during the evening hours as large

36
Fig. 2.5. The four possible situations produced by horizontal flow over an obstacle.
dust storms disperse. The strongest winds of the day do occur during the evening
at this time of year, and in addition, the increasingly clear atmosphere is very
stable at night.
One has to be careful in considering the effect of turbulence on “near-surface”
winds. The lowest level of the GCM is at roughly 200 m. For the very lowest
layers, within a few to a few tens of meters of the surface, which are permanently
within the boundary layer, winds will in fact peak during the day when turbulence
mixes momentum from higher levels downward. In terms of interactions with
topography on vertical scales of hundreds of meters, the winds at somewhat
higher levels are more significant. Here the atmosphere is within the boundary
layer during the day, and hence is slowed by momentum loss to the surface, and
in the “free atmosphere” at night when winds can become much stronger,
decoupled from the surface. It also means that winds deflected by the obstacles
are less likely to generate a lee flow but rather a convergent plume (upward flow).
Higher static stability promotes the development of lee flows provided that the
wind is sufficiently strong to surmount the obstacle. The strongest winds (at

37
roughly 200 m) develop during the night, when stability is high, suggesting that
maximum erosion occurs as a result of lee-wave development and turbulent
modification of that lee flow through interaction with the surface. Our finding of
good correlations at night and inference of a lee-wave mechanism strongly
support the mechanism proposed by Magalhães and Young [1995]. Thus, in contrast
to the Veverka et al. [1981] dark streak model, we support the Magalhães and Young
[1995] model in which strong wind flow in a stable, nighttime atmosphere results
in the development of downslope wind storms as the flow becomes supercritical
[see also Holton, 1992]. The wind storms produce strong acceleration of winds in
the downslope and lee of obstacles that can generate saltation and dust clearing
from the surface.
In conclusion, we find that in most cases, winds will neither concentrate nor
erode dust deposits and that streaks form under two end-member conditions.
Bright streaks require high stability, low winds, and ample atmospheric dust; dark
streaks require high stability and high winds (that are further accelerated in the lee
of obstacles) and likely require easily erodible surface materials.
6. Effects of Obliquity Extrema on Surface Winds
Large variations in planetary obliquity will result in significant modification of
surface and atmospheric heating patterns. Thus it has been suggested that
obliquity and other orbital variations may result in very different surface wind
patterns that can explain the fact that such features as ventifacts and yardangs do
not align with current surface winds [Bridges et al., 1999; Greeley et al., 2000]. In
order to investigate how wind patterns vary, we ran the GCM over a Martian year
for obliquities of 15º and 35º, which provide bounds for the majority of the past
10 Myr [Ward, 1992]. For these simulations the argument of perihelion has been
set to Ls = 251º, which is within a few tenths of a degree of the present argument

38
of perihelion. The resulting seasonal winds show the shifting dominance of
midlatitude westerlies versus Hadley circulation.
At high obliquity the difference in heating between hemispheres is at a maximum,
feeding the global Hadley cell. Figures 2.6a and 2.6b show the northern spring
and fall seasonal average surface winds at an obliquity of 35º. In the northern
spring the northward Hadley return flow is stronger in Arabia Patera, Amazonis
Planitia, and Valles Marineris. In the northern fall the northern midlatitude
westerlies have decreased in strength, but the upwelling zone of the Hadley cell at
30º S has intensified. These changes reflect an intensification of the Hadley cell
circulation without significant poleward expansion of its surface expression. The
correlation coefficient for northern spring between surface winds at high and
current obliquity is 0.62; for northern fall the value is 0.78. This high correlation
for northern fall is similar to what was found in Section 4.1, in which dust loading
was varied. The lower correlation for northern spring suggests more significant
variation in wind direction during that season. However, an important point is
that the northern spring winds are significantly weaker than those in northern fall.
This is a point which is returned to and expanded upon in Section 8.
Figures 2.6e and 2.6f show the northern spring and fall seasonal average surface
winds at an obliquity of 15º. The current obliquity seasonal winds are shown in
Figures 2.6c and 2.6d for reference. As obliquity is decreased, the northern fall
Hadley cell winds decrease markedly in strength, and the northern midlatitude
westerlies intensify. However, the basic pattern of surface winds remains nearly
constant. The correlation coefficient value between low and current obliquity for
northern fall is 0.90. In the northern spring the return Hadley flow has all but
disappeared in Elysium and Amazonis Planitia, and it is greatly weakened over
Valles Marineris. Here the correlation coefficient between low and current
obliquity is 0.82. As the obliquity decreases from 35º to 15º, winds in Chryse

39
Fig. 2.6. Global surface winds at high obliquity (35º) averaged over a.) northern spring and b.) northern fall. Global surface winds at the current obliquity (25º) averaged over c.) northern spring and d.) northern fall. Global surface winds at low obliquity (15º) averaged over e.) northern spring and f.) northern fall.
Planitia, and at the Pathfinder landing site, rotate from a weak westerly flow to a
stronger northeasterly flow. To the east of Chryse the winds become
predominantly easterly. These changes may reflect the influence of northern
Arabia Terra where it slopes toward the dichotomy boundary. Alternatively, these

40
easterly and northeasterly winds may indicate that as obliquity decreases no single
Hadley cell becomes dominant during northern spring and summer.
The primary effect of changing obliquity is to vary the relative influence of the
Hadley cell. This influence is expressed more as an increase in surface wind
speeds, for increasing obliquity, than in a poleward expansion of the trade wind
zone (Hadley cell return flow). In a few localities near the equator the surface
winds may be more easterly at low obliquity and more northerly or southerly at
high obliquity, but these cases are fairly rare. The generally high correlation
coefficients found for all seasons and obliquities suggest that while obliquity
impacts wind speeds, it does not significantly affect wind orientations.
7. Obliquity Extrema At Opposite Perihelion Passage
Another astronomical variation that has the potential to affect surface winds is
the argument of perihelion. In the current epoch, Mars reaches perihelion near
the northern winter solstice at Ls = 251º. Thus the southern hemisphere's
summer is short and intense, providing a strong driving force for the Hadley
circulation. It would be reasonable to suspect that if perihelion passage were
moved out of phase by 180º, then the northern spring and summer Hadley cell
might be stronger than that of southern spring and summer. However, there is a
strong zonal-average topographic gradient from the north to south pole, and it is
possible that this influences the relative intensities of the Hadley cell in northern
and southern summer.
In order to test the impact of precession we performed simulations for the same
obliquities as used in Section 6 but with the perihelion passage occurring at
Ls = 70º (just before northern summer solstice). The annual average global
surface wind maps for each obliquity extrema and each perihelion state are shown
in Figure 2.7. We concentrate on annual average maps to determine the relative

41
importance of the northern versus southern summer large-scale circulations. In
Sections 4 and 6 we showed that for a given season wind patterns change very
little, and this also holds true when the argument of perihelion is changed (not
shown). Here we show only annually averaged wind patterns because any change
in the relative strength of the northern summer circulation relative to the
southern summer circulation would most easily be recognized as a change in the
annual average wind directions.
Figure 2.7 shows the annual average wind patterns for extrema of obliquity and at
both precessional states. These wind patterns exhibit the best correlation between
any simulations presented in this paper. The coefficient of correlation between
wind directions in the simulations with passage of perihelion at 250º and 70º at
high obliquity is 0.89; at low obliquity it is 0.92. For comparison, the fits between
high and low obliquity at the two perihelion states are roughly 0.76 in both cases.
Clearly, perihelion passage timing has little if any effect on surface wind direction.
For completeness, we also examined cases in which the eccentricity was set to
0.0, finding very similar results. As changing the argument of perihelion should, if
anything, make northern summer circulation stronger than that of the south, the
only remaining explanation for this seasonal asymmetry in circulation strength is
the zonal-average elevation change. This implies that the hemispheric asymmetry
in topography is the dominant factor in determining asymmetry in large-scale
circulation.
8. Winds at the Pathfinder Landing Site
The surface wind patterns modeled by a GCM can be compared to known winds
in a specific location as a form of “ground truth.” This provides both a test of the
sensitivity of the GCM and some insight into when observed small-scale aeolian
features may have been formed. The abundance of aeolian features at the Mars

42
Fig. 2.7. Global annual surface winds at a.) high obliquity (35º) at the current perihelion passage (Ls = 251º), b.) low obliquity (15º) at the current perihelion passage (Ls = 251º), c.) high obliquity (35º) at the opposing perihelion passage (Ls = 70º), and d.) low obliquity (15º) at the opposing perihelion passage (Ls = 70º).

43
Pathfinder landing site makes this location ideal for comparison with modeled
winds. In addition, the availability of meteorological data for a limited portion of
the year collected by the lander allows a thorough comparison of GCM
predictions with directly observed winds. For the late northern summer period
observed, the GCM does a very good job of simulating the diurnal cycle of wind
directions (e.g., Toigo and Richardson [2001]). Examining the aeolian features at the
landing site, Greeley et al. [2000] found that most of the features, such as rock wind
tails, small barchanoid duneforms, wind streaks, and bright ridges seen in Viking
images are aligned with the northeast winds predicted by a GCM during northern
winter. Our results support this argument (see Figs. 2.8c and 2.8d). In addition,
Greeley et al. [2000] observed that other aeolian features did not align well with any
predicted surface wind pattern. These features include the ventifacts studied by
Bridges et al. [1999] and the degraded rims of nearby craters. The ventifacts and
eroded crater rims correspond to winds from either the ESE or WNW, with a
slight preference for the ESE.
Figure 2.8 shows seasonally averaged surface winds for the current climate and
for each combination of low and high obliquity with current passage of perihelion
(Ls = 251º) and the opposing passage of perihelion (Ls = 70º). Regardless of
orbital state, the strongest surface winds always come from the northeast, and
they always occur in the northern fall and winter. Wind orientations vary
tremendously during the northern spring and summer (hence the relatively low,
0.62, global correlation coefficients found for current and high obliquity found in
Section 6), but their velocities never exceed those of fall and winter surface winds.
In particular, no ESE or WNW winds are predicted. It is possible that ESE or
WNW winds occur during the northern spring or summer during an intermediate
stage of orbital states. However, such spring or summer winds are not likely to be
strong enough to produce ventifacts or erode crater rims, and in any case these
results show that any such spring or summer winds will be weaker than the

44
Fig. 2.8. Winds at the Mars Pathfinder landing site for differing obliquity and perihelion states. Note how the strongest surface winds always come from the northeast in the northern fall and winter regardless of astronomical oscillations.

45
corresponding northeasterly fall and winter winds.
We conclude that orbital variations alone do not affect surface wind orientations
enough to account for the observed features at the Mars Pathfinder landing site.
It is possible that climatic shifts unrelated to Mars' orbital state are responsible for
forming the ventifacts and degraded crater rims. It is also possible that
topographical changes, such as late Tharsis uplift, could significantly modify local
surface winds to produce these ESE or WNW winds. Regardless of the
mechanism that changed them, the winds that formed ventifacts and eroded
crater rims are of sufficient age that they cannot be produced in models without
significant modification of boundary conditions or climatic state.
9. Conclusion
In this work we have addressed a number of broad topics regarding changes in
surface wind patterns. Here we summarize each in turn and discuss their
implications.
Wind streaks are by far the youngest of the wind features observed from orbit.
Because they can be so transient, it is logical to study surface wind patterns over a
short period of time, within both the season and the time of day in which they
form. Thus we have determined that the bright depositional streaks can form at
any time of day at southern summer solstice, when the atmosphere is stable as a
result of heating of atmospheric dust and when the winds are low. In this case,
obstacles such as craters block flow, creating a “dead zone” in their lee in which
dust may settle. Bright streaks in the zone between 20º S and 40º S follow the
northwesterly winds of the Hadley cell, which is greatly intensified by the global
dust storms and the diurnal tide. Dark streaks form in the early evening hours
before and after southern summer solstice, when the atmosphere is stable
(because the Sun has set) and when the winds are strong. In this case the winds

46
are strong enough to climb over obstacles, rebounding down on the far side,
creating a wave of turbulence. These conditions favor the development of
downslope “wind storms” [e.g., Holton, 1992], as discussed by Magalhães and Young
[1995], likely providing the wind acceleration necessary to remove dust. Dark
streaks in the 20º S - 40º S zone are created by easterly winds associated with the
diurnal tide that dominate the zone at night, when the Hadley cell upwelling is at
its weakest. This explanation of the origin of both bright and dark streaks requires
that the light material deposited in bright streaks and eroded from dark streaks is
dust rather than sand, which is at variance with the interpretation of sandy bright
streaks by Edgett and Malin [2000].
Importantly, the bright and dark streaks provide a record of surface wind
directions which are not significantly modified by a global dust storm itself. The
presence of a dust storm only provides the material with which to record these
wind directions; it does not by itself influence the large-scale circulation pattern.
In this sense we predict that dust storms significantly earlier in the dust storm
season that produce streaks will result in streak orientations rather different than
those produced by the 1977b storm.
We studied how changes in dust loading, obliquity, passage of perihelion, and
eccentricity affect surface wind patterns. Our results are greatly strengthened by
testing the changes in wind orientation at the Viking Lander 2 site. The Mars
GCM-predicted winds agree well with the lander observations in both strength
and direction and indicate a wind reversal with the onset of the 1977b dust storm.
The change in wind direction has long been thought to be an indication of
significant northward expansion of the Hadley cell, induced by the global dust
storm [e.g., Haberle et al., 1982]. However, the model suggests that a “clean”
signature of expansion is exhibited in very few locations, of which one is the
Viking Lander 2 site. In most other locations the direction changes are greatly

47
subdued, nonexistent, or even reversed with respect to what one would expect
for Hadley cell expansion. These spatial variations in wind behavior are a
consequence of the fact that the downwelling branch of the Hadley cell takes the
form of individual currents rather than a continuous and longitudinally uniform
belt and the fact that longitudinal circulation patterns exist which respond
modestly to variations in forcing which can locally mask, mimic, or intensify
changes in the meridional overturning cell. In fact, despite the transition from
“midlatitude” westerlies to “tropical” northeasterlies at the onset of the storm,
the modeled Hadley cell at the surface expanded very little. This
nonrepresentativeness of VL2 wind observations points to obvious dangers in
relying on very small numbers of surface probes to determine global circulation
patterns.
In general, surface wind directions remain constant when orbital parameters and
dust loading are varied. The few places where winds change are constrained to
the upwelling zones of the Hadley cell. In the northern hemisphere summer the
Hadley return flow is weak, even when the argument of perihelion is shifted so
that perihelion occurs at the northern summer solstice. Thus, under certain
conditions the northern summer Hadley return flow may strengthen, showing
little sign of change, or weaken, allowing other relatively stronger processes to
dominate over the wind pattern. An example of this occurs at the Pathfinder
landing site, in which northern spring and summer winds shift direction with
change in obliquity and perihelion passage, most likely as a result of Hadley return
flow being replaced with equatorial easterlies as the Hadley cell weakens. In the
southern hemisphere summer the Hadley return flow is present and dominant no
matter how the orbital parameters and dust loading are varied. The edges of the
upwelling belt do shrink or expand slightly, which could affect long-term wind
markers at the edge of the zone. The strength of the southern hemisphere relative
to the northern hemisphere upwelling Hadley cell indicates that the parameters

48
we varied are not responsible for this asymmetry. We conclude that the elevation
difference between the northern and southern hemisphere causes either enough
of a heating differential at midlevels (in analogy to models of terrestrial monsoons
[e.g., Molnar and Emanuel, 1999]) or a sufficiently strong slope-wind bias to keep
the southern hemisphere Hadley cell dominant, regardless of the orbital state.
We examined the Pathfinder landing site in detail to better understand the
disparity between wind-tail and ventifact orientations. During the northern fall
and winter, no matter what the orbital state, the surface winds are strong and
northeasterly, aligning well with the rock wind-tails and crater streaks in the
region. During northern spring and summer the winds vary, but they are always
weaker than the fall and winter winds. We conclude that the ventifacts, which
were formed by ESE or WNW winds, cannot have been produced by any
potential spring and summer winds in which the orbital states combine to
produce this wind orientation. This seems logical because ventifacts require
strong, sustained winds to form, and spring and summer winds tend to be weak
and easily variable with orbital states. Because orbital states alone do not account
for the ventifact orientations, some other factor, such as a climate variation
independent of orbital conditions or a change in topography, must have caused
the winds that produced the ventifacts. As pointed out by Bridges et al. [1999], the
ventifacts may have been carved shortly after the outflow channel formed, when
a fresh supply of abrading particles would have been recently deposited and
available. It is possible that during such a period the climate would have changed
drastically enough to create the winds that eroded the ventifacts.
The most direct conclusion drawn from this work is that global surface wind
directions are little affected by orbital parameter or dust-loading variations within
ranges that appear applicable to the recent geological past (last few million years,
at least). It is important to note that wind speeds are affected by changes in these

49
parameters. A major implication of this finding is that the observed alignment of
dunes or other aeolian features with contemporary global wind fields does not
necessarily imply that the dunes are contemporary or currently active. The fact
that wind speeds can vary significantly with orbital parameters further suggests
that the intensity of aeolian activity may be a strong function of orbital
parameters (primarily obliquity). For example, if the threshold for significant
aeolian activity lies above that provided by currently active wind systems, it is
possible that dunes and other aeolian features may only be sporadically active
during specific phases of the orbital parameter cycles (such as at the highest of
obliquities).
The global surface wind results presented in this paper apply to scales comparable
to those of the Mars GCM model from which they arise. This scale is roughly 5º
(or 300 km); hence they are directly applicable only to large features such as dune
fields, large wind streaks, and extensive yardang complexes. Our ability to apply
model results to the Mars Pathfinder landing site largely reflects our good fortune
that average surface winds at this site are not strongly modified by local (tens to
hundreds of kilometers) topography (i.e., they are well modeled by the Mars
GCM) and that we have both contemporary and noncontemporary features to
study. As more images become available from the Mars Global Surveyor, it is
becoming increasingly apparent that dunes and other aeolian features exist in
profusion at almost all locations. In many cases these features show complex and
sometimes apparently contradictory orientations. In order to understand the
relationship between winds and the orientation and nature of these features,
mapping and analysis with the aid of subglobal (meso)scale models [e.g., Toigo and
Richardson, 2000] will become necessary.

50
10. Acknowledgments
We wish to thank R. John Wilson and Arden Albee for useful discussions and
support throughout this project. Ashwin Vasavada provided a useful review of an
early draft. One of us (M.I.R.) also wishes to thank Ashwin Vasavada for
providing the initial spark of enthusiasm for studies of aeolian processes and this
project in particular. This paper benefited greatly from insightful and very
thorough reviews by Bob Haberle and an anonymous reviewer. This research was
supported in part by NSF cooperative agreement ACI-9619020 through
computing resources provided by the National Partnership for Advanced
Computational Infrastructure at the San Diego Supercomputer Center.