Embed Size (px)
Citation preview

MARSH UK & IRELAND TRANSPORTATION SEMINAR28 JANUARY 2015
Tower Place, London

MARSH
MARK WEILCEO, MARSH UK & IRELAND

MARSH 204 February 2015
Today’s Agenda
TOPIC
10:30 Introduction to Marsh and the Transportation Practice.
10:45 Public investment, strategy, and considerations on the future of the transportation sector.
11:30 An analyst's perspective on the outlook for the sector with specific insight to rail and bus.
12:00 How “big data” and analytics can optimise risk financing within the transportation sector.
12:30 Closing remarks.
12:35 Lunch.

MARSH
Marsh – Our Expertise
3
26,000EMPLOYEES
SERVING CLIENTS IN MORE THAN
130 COUNTRIES
US$49 billionGLOBAL ANNUAL
PREMIUM VOLUME
1,100DEDICATED
MULTINATIONALSPECIALISTS
GBP12 billionCLAIMS PAIDANNUALLY
WHAT DOES THIS MEAN FOR OUR CLIENTSSERVICE EXCELLENCE SUPERIOR PLACEMENT
GLOBAL EXPERTISE PARTNERSHIP

MARSH
Source: Transport Statistics Great Britain 2014, Department for Transport
4
Transportation Sector in the UK – 2014
Rail passenger journeys have more than doubled since
privatisation 1994/95.
222 billion tonnes of domestic freight
moved.
1.4 million people employed in the UK’s transportation and
storage sectorrepresenting 5% UK
employment.
Transportation Sector – Importance of the Sector
19.3 million domestic air
flights.
London accounted for over half of bus
passenger journeys in England.
UK government publicly funded pipeline of specific projects – GBP70 billion investment in transport. This includes GBP15 billion investment to increase the capacity and condition of roads in the UK.

MORWENNA HOWELL MANAGING DIRECTOR, MARSH’S TRANSPORTATION PRACTICE LEADER UK & IRELAND
MARSH
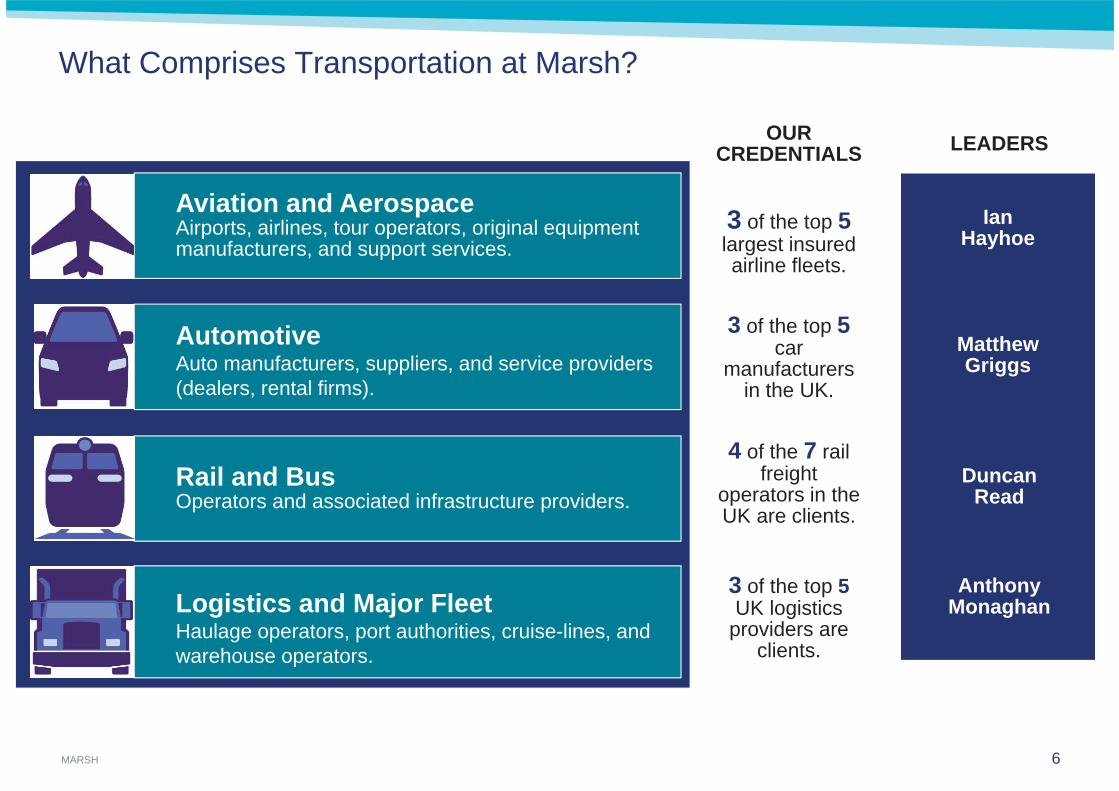
What Comprises Transportation at Marsh?
6
Aviation and AerospaceAirports, airlines, tour operators, original equipment manufacturers, and support services.
AutomotiveAuto manufacturers, suppliers, and service providers (dealers, rental firms).
Rail and BusOperators and associated infrastructure providers.
Logistics and Major FleetHaulage operators, port authorities, cruise-lines, and warehouse operators.
3 of the top 5largest insured airline fleets.
OUR CREDENTIALS
4 of the 7 rail freight
operators in the UK are clients.
3 of the top 5UK logistics
providers are clients.
3 of the top 5car
manufacturers in the UK.
LEADERS
Ian Hayhoe
MatthewGriggs
Duncan Read
Anthony Monaghan

MARSH
Our Transportation Credentials
7Source: Marsh Analysis according to internal data systems, September 2014
15,000TRANSPORTATION CLIENTS
GLOBALLY
US$4 billionPLACED GLOBALLY ON
BEHALF OF TRANSPORTATION CLIENTS
US$1 billionPLACED ON BEHALF OF
TRANSPORTATION CLIENTS IN UK & IRELAND
600+TRANSPORTATION
COLLEAGUES ACROSS MARSH UK

MARSH
Marsh Transportation: Client Benefits
8
Sector Knowledge• Sharing best practice.• Legislative changes.• Roundtables and client events.
Specialist Products • Dedicated insurer wordings and specialist industry extensions.• Combined liability placement for aviation/airports. • European pan-auto product.
Thought Leadership• Insight into future industry issues
– new technology (driverless cars, drones), cyber, claims trends.

STEPHEN HAMMOND MP FORMER PARLIAMENTARY UNDER SECRETARY OF STATE FOR TRANSPORT (SEPTEMBER 2012 TO JULY 2014)

JOHN DAVIES MANAGING DIRECTOR, MARSH’S RISK FINANCE TEAM

MARSH 11
Agenda
1 What is big data and what can it do for you?
2 How companies are using data and analytics.
3 Financial resilience in a crisis.
4 Questions.

MARSH
What is “big data” and what can it do for you?

MARSH 13
Big Data Defined
Definition All data too large and/or complex to be handled by traditional databases, but for which there are emerging software tools that can actually tame these information store beasts and extract value.
Marsh Big Data 15 million claims.
US$50 billion in placed premiums per year.
10 billion simulated loss events.

MARSH 14
Sample: Ports and Terminals Cause of Loss
Source: Marsh Analytics Data, 2014
MARSH 15
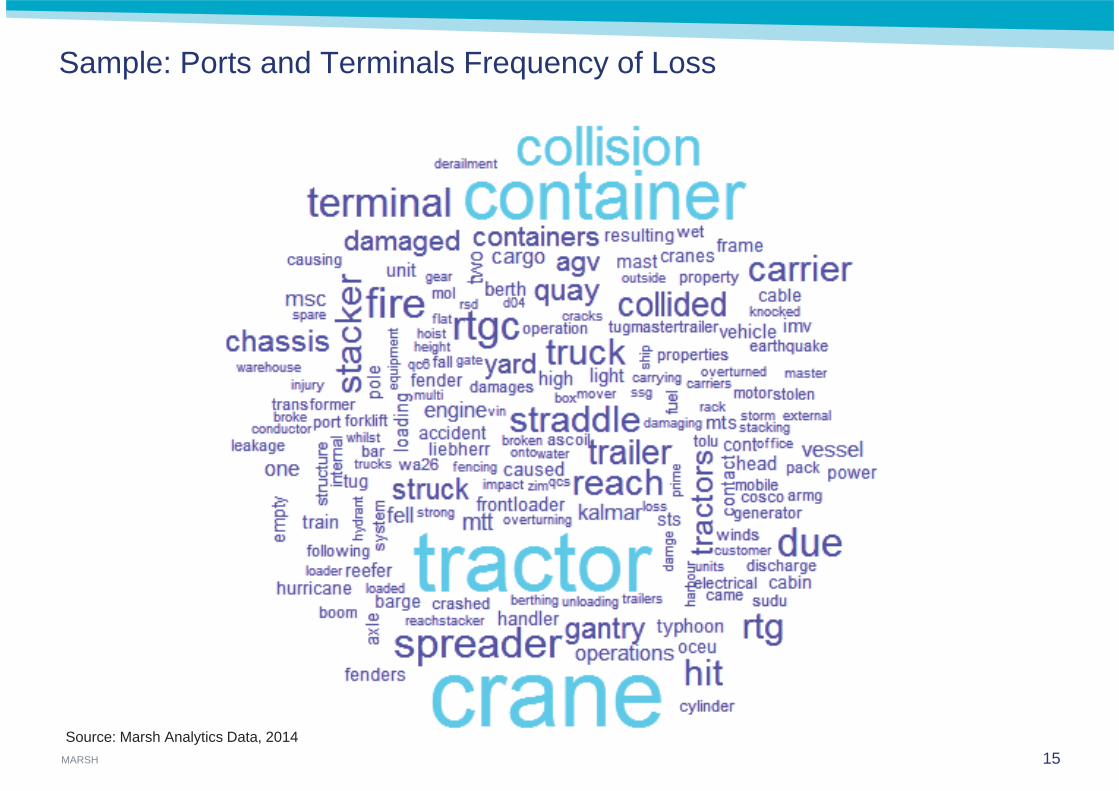
Sample: Ports and Terminals Frequency of Loss
Source: Marsh Analytics Data, 2014

MARSH
Sample: Ports and Terminals Severity of Loss
16
Source: Marsh Analytics Data, 2014

MARSH
We Have Built Industry Loss Distributions From This Data
17
Freq
uenc
y
Severity (in millions)

MARSH
Transportation Sample: Ports and Terminals – Mild Distribution
18
Amount
0 5M 10M 15M 20M 25M 30M 35M 40M 45M 50M
Rel
a tiv
eP
rob
ab
ility
Severity (in millions)
Freq
uenc
y
Key: Red – mild

MARSH
Transportation Sample: Ports and Terminals – Medium Distribution
19
Amount
0 5M 10M 15M 20M 25M 30M 35M 40M 45M 50M
Rel
a tiv
eP
rob
ab
ility
Severity (in millions)
Freq
uenc
y
Key: Red – mild Blue – medium

MARSH
Transportation Sample: Ports and Terminals – Severe Distribution
20
Amount
0 5M 10M 15M 20M 25M 30M 35M 40M 45M 50M
Rel
ativ
eP
rob
ab
ility
Severity (in millions)
Freq
uenc
y
Key: Red – mild Blue – medium Green - severe

MARSH
How Companies are Using Data and Analytics

MARSH
11%
64%
How Companies are Using Data and Analytics
Organisations using qualitative and quantitative techniques
12%
88% 13%
No assessment Organisationsundertaking
risk assessment
Risk models and advanced quantitative techniques.
Qualitative and basic quantitative techniques.
Qualitative techniques.
Source: PwC Risk Management Survey – 2013

MARSH
The Difference Between Risk Tolerance and Risk Appetite
23
Risk Tolerance Risk Appetite
ABILITY to take risk. WILLINGNESS to take risk.
What can the balance sheet withstand before the corporation is mortally wounded?
What sort of risks are we in business to take?
How much of each risk type are we prepared to take?

MARSH
An Understanding of Risk Volatility Puts Risk Appetite in Context
24
VISIBLE IMPACT ON KPIs

MARSH
What Financial Resources are Available to Deal With Risk?
25

MARSH
Exploring Loss Potential
26
RETAINED LOSS
RETAINED LOSS
INSURED LOSS
INSURED LOSS
UNINSURED LOSS
UNINSURED LOSS
Inclusion of your individual loss data1Use of Marsh’s Proprietary Loss Data Library
(LDL)2Additional scenario engineering for hard-to-measure loss events3
KEY INPUTS
SEVERITY
How does this amount of risk compare to your risk tolerance and risk appetite?

MARSH
From Total Cost of Risk to Economic Cost of Risk
27
RETAINEDLOSS
RETAINEDLOSS
INSUREDLOSS
INSUREDLOSS
UNINSUREDLOSS
UNINSUREDLOSS
TOTAL COST OF RISK(TCOR)
ECONOMIC COST OF RISK(ECOR)

MARSH
How to Calculate Implied Risk Charge
*WACC: Weighted Average Cost of Capital 28

MARSH 29

MARSH
ECOR Puts Various Risk Treatment Options on a Level Playing Field
TCOR ECOR
3004 February 2015
OptimisedProgramme
AlternateProgramme(s)
CurrentProgramme
No Insurance
Expected loss PremiumUS$
Insurance is a cost
OptimisedProgramme
AlternateProgramme(s)
CurrentProgramme
No Insurance
Expected loss Premium IRC
Value creation
US$

MARSH
Use ECOR to Quantify Hedging of Largest Insurance and Hazard Risks
Cost of CapitalExpenses and Profit Margin
Expected Losses
31

MARSH
Financial Resilience in a Crisis

MARSH
Solutions for the Tail Risk
33
VISIBLE IMPACT ON KPIs
INSURANCELAYER

MARSH
Tail Risk Case Study
34February 4, 2015
• Travel sector client.
• Volatile cash flow.
• Bank-like characteristics.
• Time critical.
• New lens to risk and resilience.
• New approach to insurance.
500
0
500
1000
1500
2000
base case cash postion
new cash position Turkeysc.2
new cash postion Turkey,ash could and hot summer
new cash postion Turkeyand Spain sc.2
new cash postionTurkey,Spain, ash couldand hot summer
Client liquidity position (GBP million) under stress scenarios
Cash-flow stress-testing

MARSH
Questions and Answers

MARSH
CLOSING REMARKS

LUNCH

This PowerPoint™ presentation is based on sources we believe reliable and should be understood to be general risk management and insurance information only.
The information contained herein is based on sources we believe reliable and should be understood to be general risk management and insurance information only. The information is not intended to be taken as advice with respect to any individual situation and cannot be relied upon as such.
Statements concerning legal, tax or accounting matters should be understood to be general observations based solely on our experience as insurance brokers and risk consultants and should not be relied upon as legal, tax or accounting advice, which we are not authorised to provide.
Registered in England and Wales Number: 1507274, Registered Office: 1 Tower Place West, Tower Place, London EC3R 5BU.
Marsh Ltd is authorised and regulated by the Financial Conduct Authority.
Copyright © 2015 Marsh Ltd All rights reserved