Embed Size (px)
Citation preview

Mars Wind Streaks

Introduction � Question:
� How can crater diameter to wind streak length ratios be used to determine differences in defined elevations around Alba Patera?
� Importance and interest: � After observing the wind streaks around Alba Patera, the wind that
creates them travels around the volcano Alba Mons and shifts the directions of the wind streaks. The interest in this is that each elevation around Alba Mons affects the wind streaks.
� Hypothesis: � Wind streak ratios will increase with elevation.
� Alternate hypothesis: � Elevation will not have an affect on the wind streak ratios.

Wind Streak Research: Scot C.R. Rafkin � Atmospheric stability is the leading factor as to whether wind
streaks are depositional or erosional. A stable atmosphere blocks wind flow against crater walls, creating brighter wind streaks (depositional wind streaks). When the atmosphere is more transparent, the air flow over obstacles is increased, creating erosional wind streaks that are dark.
� About 25% of all craters larger than 1 km in diameter have wind streaks.
� Bright streaks most often form around smaller obstacles-dark streaks form mostly around larger obstacles.
• Rafkin, Scot C.R. "MODELING MARS WIND STREAK FORMATION." Lunar and Planetary Science XXXIX. T. I. Michaels1, 1Southwest Research Institute, Dept of Space Studies, 2008. Web. 30 Mar. 2012. <http://www.lpi.usra.edu/meetings/lpsc2008/pdf/2362.pdf>.

Control Image
B16_016068_2182_XN_38N125W
A basic light colored wind streak.
The crater that creates the wind streak.
The area that we are looking for
wind streaks is in Alba Patera.
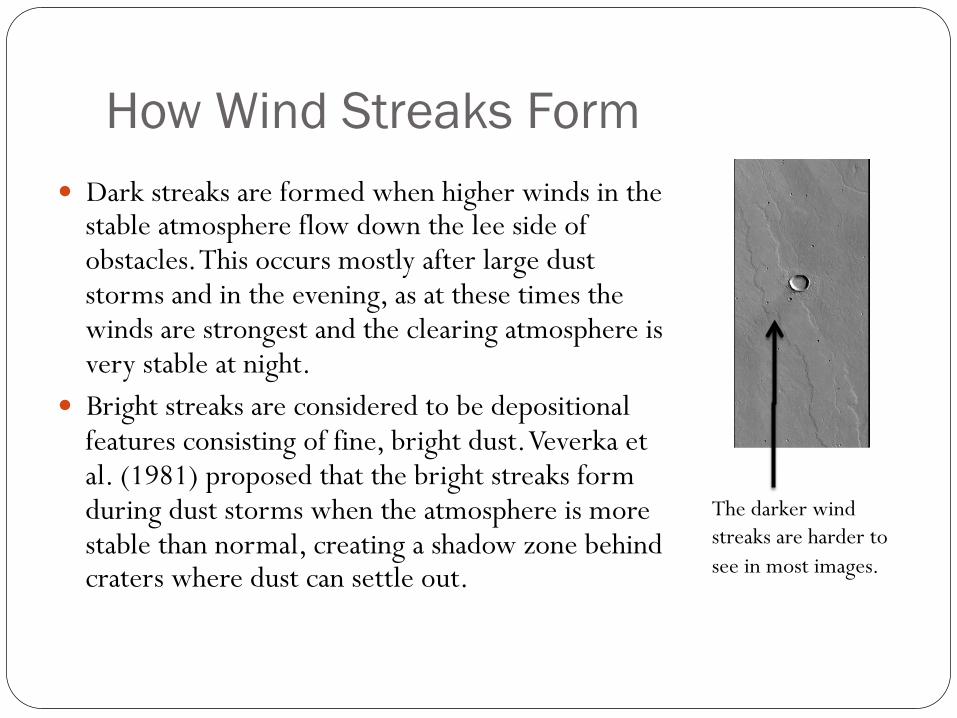
How Wind Streaks Form � Dark streaks are formed when higher winds in the
stable atmosphere flow down the lee side of obstacles. This occurs mostly after large dust storms and in the evening, as at these times the winds are strongest and the clearing atmosphere is very stable at night.
� Bright streaks are considered to be depositional features consisting of fine, bright dust. Veverka et al. (1981) proposed that the bright streaks form during dust storms when the atmosphere is more stable than normal, creating a shadow zone behind craters where dust can settle out.
The darker wind streaks are harder to see in most images.

Wind Streaks on Mars and Earth
Wind streak on Mars near Alba Patera
Most wind streaks on Earth and Mars are formed streaks in response to turbulence around the obstacles. Wind streaks on Earth are visible in radar images typically when roughness differences (such as those between bedrock and sediment) result in contrasts in the backscatter cross sections
A wind streak on earth in Patagonia, southern Argentina.
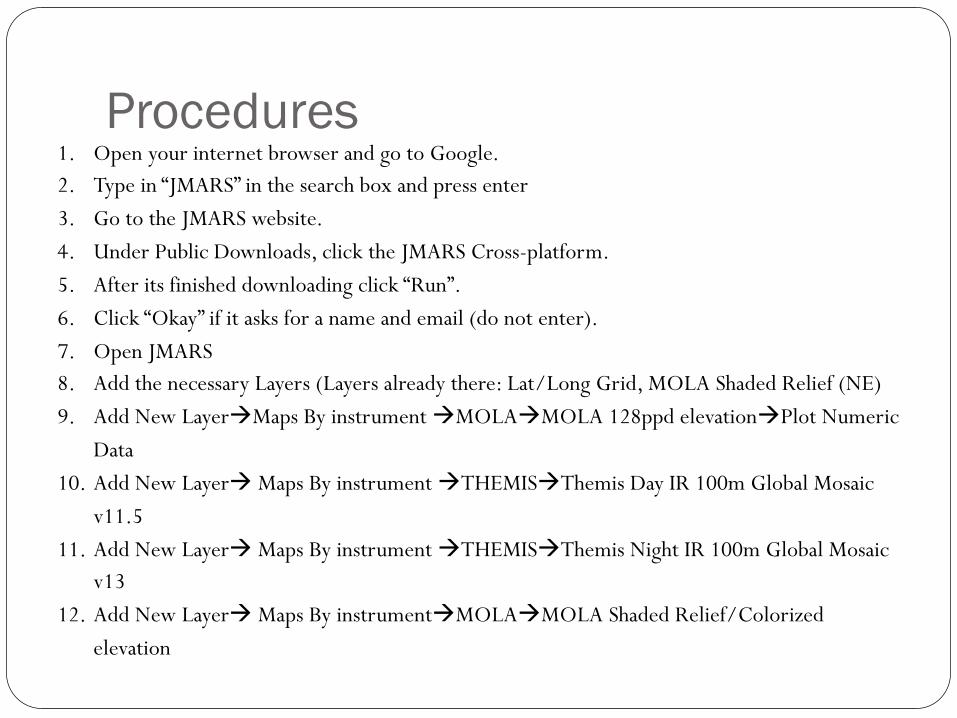
1. Open your internet browser and go to Google. 2. Type in “JMARS” in the search box and press enter 3. Go to the JMARS website. 4. Under Public Downloads, click the JMARS Cross-platform. 5. After its finished downloading click “Run”. 6. Click “Okay” if it asks for a name and email (do not enter). 7. Open JMARS 8. Add the necessary Layers (Layers already there: Lat/Long Grid, MOLA Shaded Relief (NE) 9. Add New LayeràMaps By instrument àMOLAàMOLA 128ppd elevationàPlot Numeric
Data 10. Add New Layerà Maps By instrument àTHEMISàThemis Day IR 100m Global Mosaic
v11.5 11. Add New Layerà Maps By instrument àTHEMISàThemis Night IR 100m Global Mosaic
v13 12. Add New Layerà Maps By instrumentàMOLAàMOLA Shaded Relief/Colorized
elevation
Procedures

Procedures Continued 13. Add New Layerà Nomenclature 14. Add New Layer àMaps By Instrument àMola àMola 128 ppd Elevation àPlot and View Numeric. Locate and click on the tab above the others. 15. Under Source, click on the plus button. The Select Stage box will pop up-click on the down arrow and select Threshold. Repeat this step. 16. Under the first Threshold, insert 0 for the value and greater than for the symbol. Under the second Threshold, insert 1500 for the value and less than for the symbol. 17. Click the plus arrow beside the Greyscale box. Select the Color Stretcher. 18. Right-click on the Color Stretcher and select the insert tab option. Pick the color of your choice. 19. Use the middle bar to make your color lighter or darker. When finished, click on the Main Tab above the others to go back to the layers. 20. Repeat Steps 27-32 three more times; insert 1501-3000 for the second, 3001-4500 for the third, and 4501-6000 for the fourth. You should have four bands of different colors around Alba Patera.

Procedures Continued 21. Add New Layerà Stamps à Themis Stamps 22. In Image location Parameters Change the image type to VIS and enter the latitude of 220 – 260 and longitude of 30 -50 23. In Observation Parameters change the summing to “1 and 1” 24. In Quality Parameters change the image rating to “4 to 7” 25. Under Stamps àProjected CTX Stamps 26. In Image location Parameters enter the latitude of 220 – 260 and longitude of 30 -50 27. Drag THEMIS STAMPS Layer to the top of the list. 28. Find your Lat and Long area you inputted for them and find a blue highlighted image with a wind streak in it. Hover over the image and its VIS number will pop up. 29. Right click on the image and go to View Themis imagesàStamp (Insert your images number here)à Render Themis Image 30. Zoom in the image and find your wind streak
31. Move the layer MOLA 128ppd Elevation on the top of your layer list and left click once right on the edge dividing the crater and the wind streak itself-then double click at the very end of the wind streak (or where it fades away)
32. Click on the tab above your layers called PLOT: Mola 128ppd Elevation 33. Once clicked it should show you all the information about your measurement. The X-axis of the graph gives you Length of your wind streak

JMARS Layers 1.Lat/Lon Grid Use: To pin-point a specific locations Limitations: It only goes ten degrees per square 2.Nomenclature Use: To find different locations and areas on Mars Limitations: Lists Features not regions 3.Themis Day IR 100m v11.5 Use: To view Mars during the daytime hours Limitations: Cannot see wind streaks 4.Themis Night IR 100m v.13 Use: To view Mars during the nighttime hours Limitations: Cant see shadows 5.Plot : MOLA 128 ppd Elevation Use: To find elevations on specific parts of Mars Limitations: Doesn’t show Depth
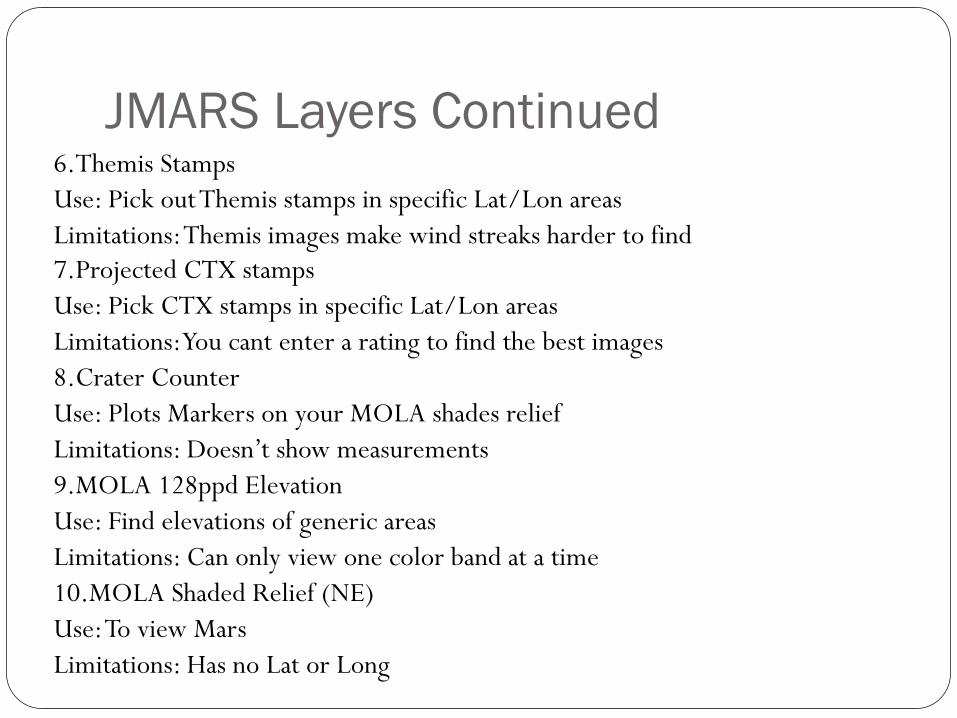
JMARS Layers Continued 6.Themis Stamps Use: Pick out Themis stamps in specific Lat/Lon areas Limitations: Themis images make wind streaks harder to find 7.Projected CTX stamps Use: Pick CTX stamps in specific Lat/Lon areas Limitations: You cant enter a rating to find the best images 8.Crater Counter Use: Plots Markers on your MOLA shades relief Limitations: Doesn’t show measurements 9.MOLA 128ppd Elevation Use: Find elevations of generic areas Limitations: Can only view one color band at a time 10.MOLA Shaded Relief (NE) Use: To view Mars Limitations: Has no Lat or Long
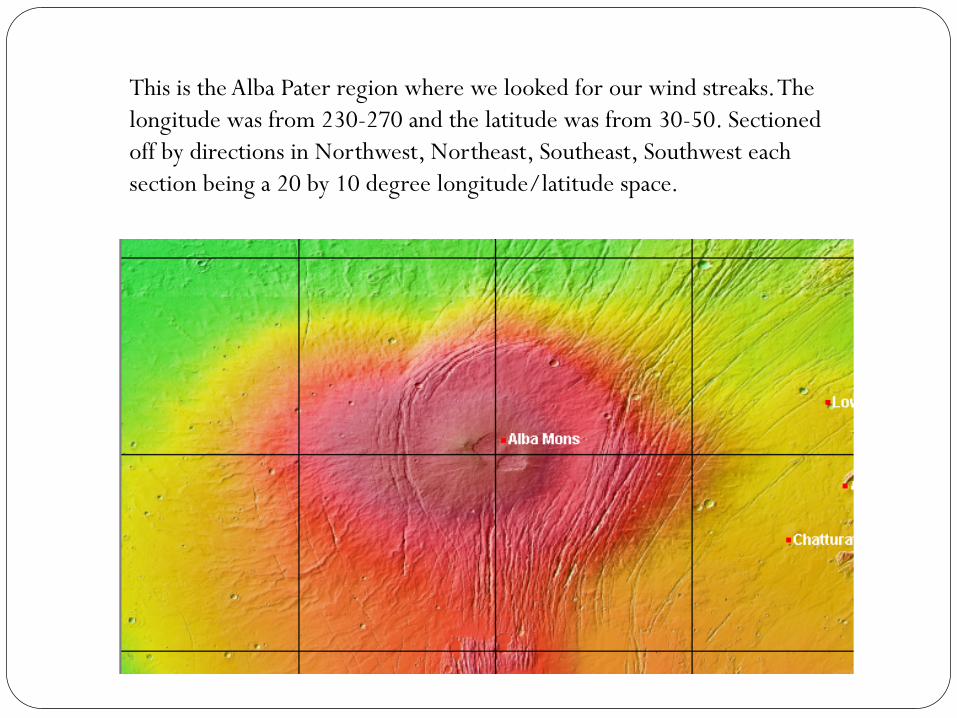
This is the Alba Pater region where we looked for our wind streaks. The longitude was from 230-270 and the latitude was from 30-50. Sectioned off by directions in Northwest, Northeast, Southeast, Southwest each section being a 20 by 10 degree longitude/latitude space.

Using THEMIS Night IR
Using the THEMIS Night IR layer on JMARS you can see how the wind streaks curve around the volcano in a direction starting southwest and curving towards north and ending in the east.

This is the Alba Patera region with the different elevations colored. The blue is our first elevation from 0-1500km, the green is our second elevation from 1501-3000km, red is the third elevation from 3001-4500km, yellow is the fourth elevation from 4501-6000km. The black dots all over are there to show where the CTX and THEMIS images we used are located.

Image ID Long/Lat (E/N)
Elevation Color
Wind Streak Length (km)
Crater Diameter (km)
Section
V30019012 262/42 BLUE 17.5 4.27 NE
V36220023 257/46 BLUE 17.35 4.87 NE
V26730015 254/46 BLUE 19.58 4.93 NE
V29882014 255/44 GREEN 8.92 1.88 NE
V29495007 259/40 GREEN 11.54 2.21 NE
V26912026 259/40 GREEN 11.20 1.70 NE
V12074010 253/42 RED 24.2 6.3 NE
V27062029 252/43 RED 19.2 2.37 NE
V12386005 252/43 RED 18.2 3.6 NE
V19487018 251/40 YELLOW 9.80 2.49 NE
V19150010 252/40 YELLOW 9.04 1.90 NE
V28235015 251/42 YELLOW 18.29 2.89 NE
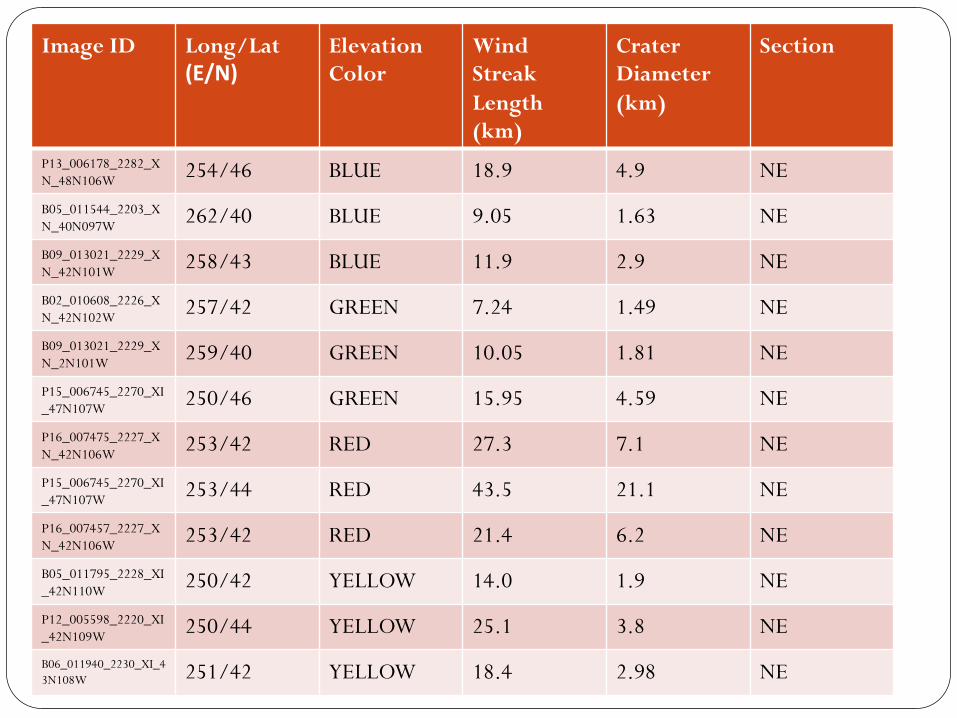
Image ID Long/Lat (E/N)
Elevation Color
Wind Streak Length (km)
Crater Diameter (km)
Section
P13_006178_2282_XN_48N106W 254/46 BLUE 18.9 4.9 NE B05_011544_2203_XN_40N097W 262/40 BLUE 9.05 1.63 NE B09_013021_2229_XN_42N101W 258/43 BLUE 11.9 2.9 NE B02_010608_2226_XN_42N102W 257/42 GREEN 7.24 1.49 NE B09_013021_2229_XN_2N101W 259/40 GREEN 10.05 1.81 NE P15_006745_2270_XI_47N107W 250/46 GREEN 15.95 4.59 NE P16_007475_2227_XN_42N106W 253/42 RED 27.3 7.1 NE P15_006745_2270_XI_47N107W 253/44 RED 43.5 21.1 NE P16_007457_2227_XN_42N106W 253/42 RED 21.4 6.2 NE B05_011795_2228_XI_42N110W 250/42 YELLOW 14.0 1.9 NE P12_005598_2220_XI_42N109W 250/44 YELLOW 25.1 3.8 NE B06_011940_2230_XI_43N108W 251/42 YELLOW 18.4 2.98 NE

Image ID Long/Lat (E/N)
Elevation Color
Wind Streak Length (km)
Crater Diameter (km)
Section
V39801004 267/32.6 BLUE 2.16 .6 SE
V28222022 265.3/34.5 BLUE 5.52 1.84 SE
V29133005 262.2/31.3 BLUE 29.1 8.1 SE
V26413019 253.8/31.8 GREEN 8.45 1.93 SE
V29832013 256.3/35 GREEN 8.43 1.95 SE
V20897005 256.7/34.9 GREEN 7.65 1.39 SE
V28497003 251.9/37.2 RED 5.13 1.24 SE
V20585006 257/37.1 RED 22.12 7.98 SE
V27898018 252.4/34.2 RED 6.62 2.03 SE
V19150010 252/40.32 YELLOW 8.8 2.41 SE
V12074011 252.3/38.7 YELLOW 7.4 1.5 SE
V27087031 250.2/38.2 YELLOW 10.4 3.1 SE

Image ID Long/Lat (E/N)
Elevation Color
Wind Streak Length (km)
Crater Diameter (km)
Section
P13_005980_2126_XN_32N097W 262.3/34 BLUE 9.5 1.9 SE G06_020471_2143_XN_34N093W 265.1/35.4 BLUE 5.02 1.09 SE P15_006771_2161_XN_36N095W 266.7/34.7 BLUE 5.94 .82 SE P21_09118_2155_XN_35N1028 255.1/35.7 GREEN 5.68 1.73 SE B10_013720_2164_XN_36N103W 256.3/35 GREEN 15.26 4.40 SE G03_019456_2160_XN_36N103W 256.9/35.9 GREEN 3.69 1.10 SE P17_007734_2159_XI_35N110W 250.1/33.3 RED 5.6 1.33 SE B18_016621_2188_XN_39N110W 257/36 RED 25 6.5 SE B16_015988_2194_XN_39N101W 258/39 RED 7.5 2.5 SE P17_007734_2159_XI_35N110W 249.7/37.7 YELLOW 18.6 6.3 SE P18_008024_2200_XN_40N109W 250/39 YELLOW 7.7 1.2 SE B18_016753_2183_XN_38N106W 253.0/40.5 YELLOW 12.1 2.5 SE
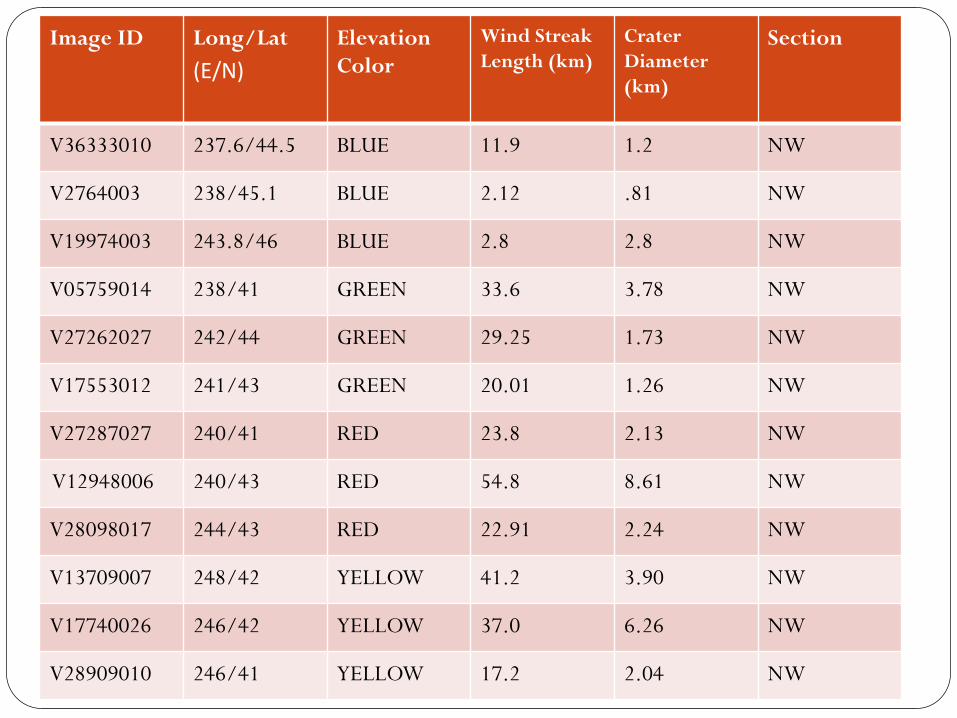
Image ID Long/Lat (E/N)
Elevation Color
Wind Streak Length (km)
Crater Diameter (km)
Section
V36333010 237.6/44.5 BLUE 11.9 1.2 NW
V2764003 238/45.1 BLUE 2.12 .81 NW
V19974003 243.8/46 BLUE 2.8 2.8 NW
V05759014 238/41 GREEN 33.6 3.78 NW
V27262027 242/44 GREEN 29.25 1.73 NW
V17553012 241/43 GREEN 20.01 1.26 NW
V27287027 240/41 RED 23.8 2.13 NW
V12948006 240/43 RED 54.8 8.61 NW
V28098017 244/43 RED 22.91 2.24 NW
V13709007 248/42 YELLOW 41.2 3.90 NW
V17740026 246/42 YELLOW 37.0 6.26 NW
V28909010 246/41 YELLOW 17.2 2.04 NW

Image ID Long/Lat (E/N)
Elevation Color
Wind Streak Length (km)
Crater Diameter (km)
Section
B16_015936_2225_XN_42N122W 237.3/42.6 BLUE 6.9 1.5 NW
B19_016846_2204_XN_40N124W 235.9/40 BLUE 5.2 1.4 NW
B17_016147_2250_XN_45N123W 236/44 BLUE 25 32 NW
P13_005928_2230_XN_43N119W 240.9/42.6 GREEN 9 1.7 NW
G11_022595_2208_XN_40N122W 237.3/40.4 GREEN 3.5 .8 NW
P22_009659_2238_XN_43N114W 245.9/43.3 GREEN 14.6 2 NW
P20_008723_2227_XN_42N117W 242.2/44 RED 73.4 6.5 NW
P14_006640_2237_XN_43N119W 240.4/43.2 RED 26.4 1.1 NW P16_007220_2234_XN_43N115W 244/43 RED 21.3 2.23 NW
B04_011281_2229_XI_42N116W 243/4.5 YELLOW 8.6 0.9 NW
P22_009659_2238_XN_43N114W 245.9/43.3 YELLOW 14.6 2 NW
B03_010727_2223_XN_42N111W 248.4/42 YELLOW 6.5 1.1 NW

Image ID Long/Lat (E/N)
Elevation Color
Wind Streak Length (km)
Crater Diameter (km)
Section
V18252018 235.8/36.7 BLUE 11 1.8 SW
V29084008 236.6/35.2 BLUE 6.5 2.1 SW
V38467009 233/34.3 BLUE 12.8 2.3 SW
V27599020 238.6/33.7 GREEN 4.6 1.2 SW
V20985007 238/33.7 GREEN 3.8 3 SW
V38891012 240/31.2 GREEN 8.9 1.4 SW
V28073045 244.1/34.8 RED 8.4 2.1 SW
V39889017 248.9/35.9 RED 7.78 2.03 SW
V29820015 242.8/36.5 RED 5.69 1.16 SW
V38479005 247.3/38.2 YELLOW 1.46 .87 SW
V26513014 250/38 YELLOW 8 1.8 SW
V11263007 247.1/37.3 YELLOW 4.8 .9 SW

Image ID Long/Lat (E/N)
Elevation Color
Wind Streak Length (km)
Crater Diameter (km)
Section
B18_016635_2190_XN_39N124W 235.6/38.6 BLUE 6.4 1.1 SW P15_006838_2140_XN_34N124W 235.8/33.8 BLUE 7.9 2.1 SW P15_006759_2134_XN_33N127W 233/32.8 BLUE 7.3 1.5 SW B17_016160_2125_XN_32N116W 243.5/32 GREEN 4.1 .9 SW B11_014103_2110_XI_31N119W 241/30.6 GREEN 11.4 2.6 SW B09_013180_2188_XN_38N123W 238.8/38.2 GREEN 4.4 0.7 SW P17_007734_2159_XI_35N110W 250/35 RED 7.5 1.6 SW B11_013760_2183_XN_38N116W 243.1/38 RED 30.1 2.3 SW B10_013470_2174_XI_37N119W 240.5/37.2 RED 5.1 1.5 SW B07_012217_2178_XI_37N110W 249/37 YELLOW 15 6.3 SW B08_012705_2188_XI_38N113N 246.7/38 YELLOW 14.3 2.3 SW B07_012283_2185_XN_38N111W 248.3/38.3 YELLOW 4.1 2.5 SW

Number of Images Used � 48 THEMIS � 48 CTX � Northwest- 24 images, 12 CTX and 12 THEMIS � Northeast-24 images, 12 CTX and 12 THEMIS � Southwest- 24 images, 12 CTX and 12 THEMIS � Southeast- 24 images, 12 CTX and 12 THEMIS
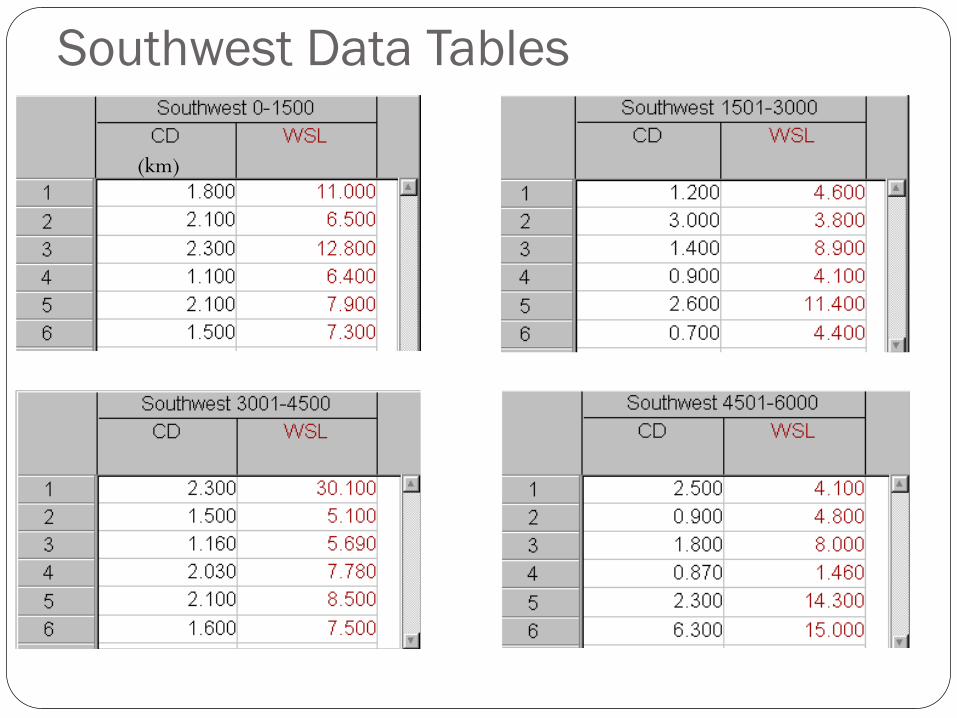
Southwest Data Tables
(km)

Southeast Data Tables

Northwest Data Tables

Northeast Data Tables
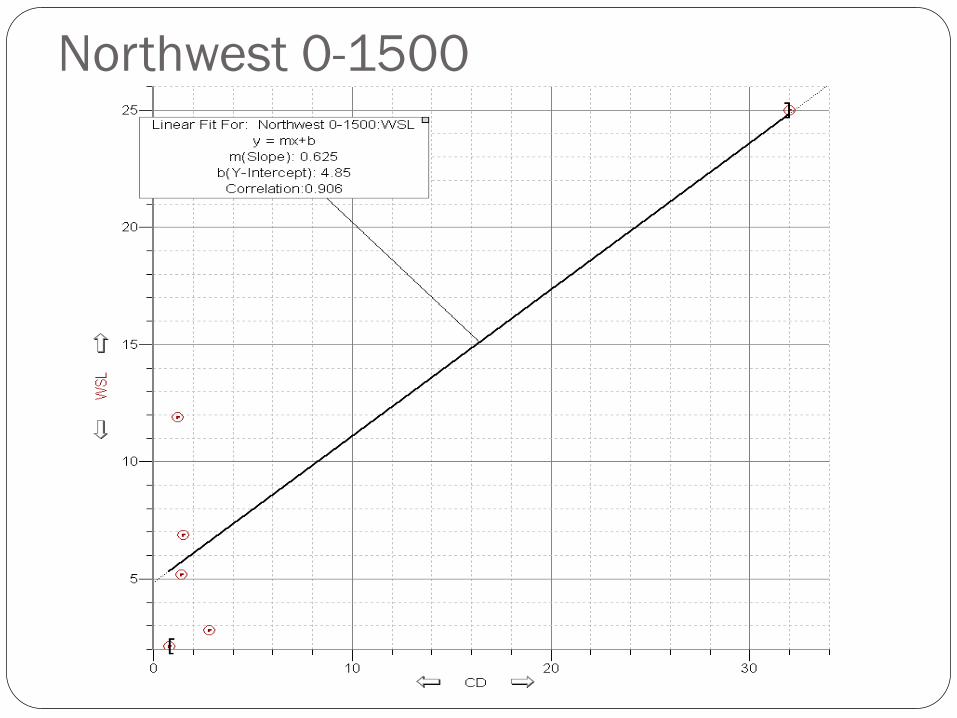
Northwest 0-1500
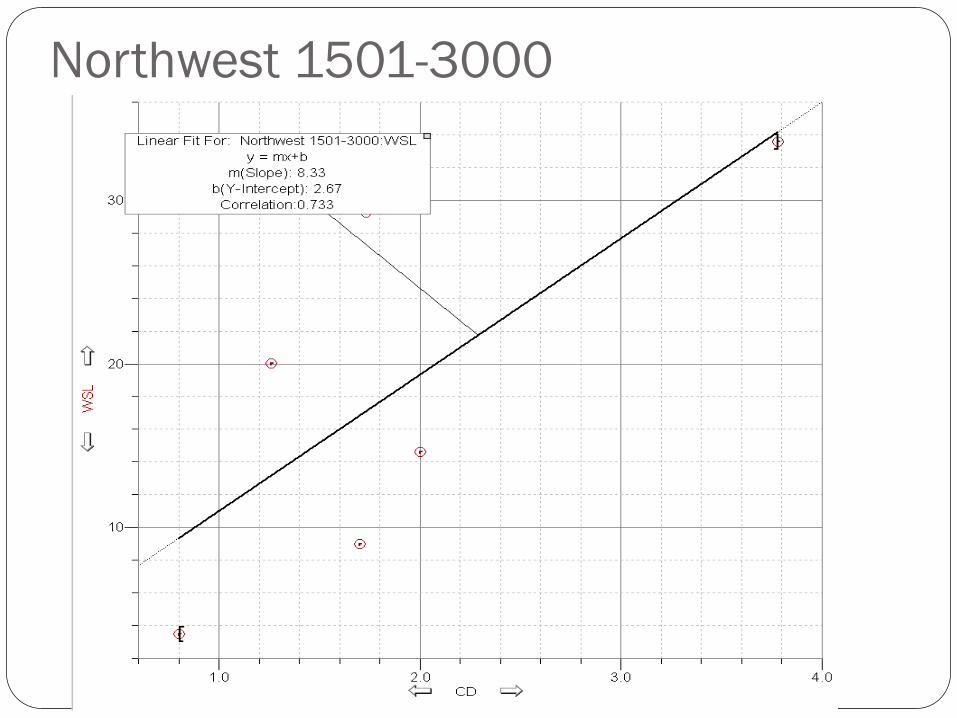
Northwest 1501-3000
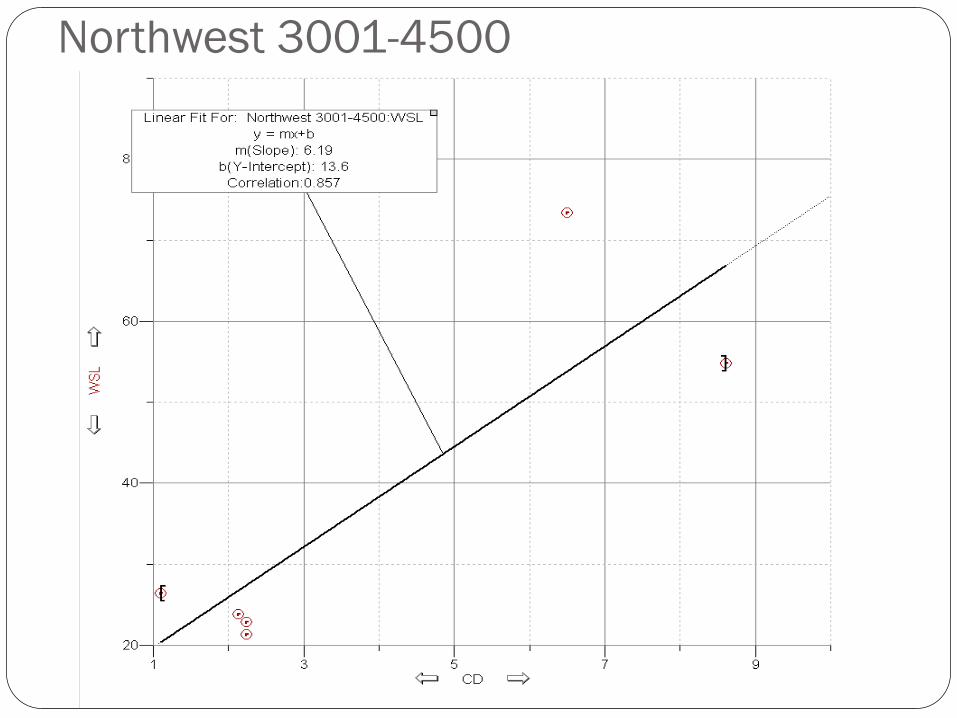
Northwest 3001-4500
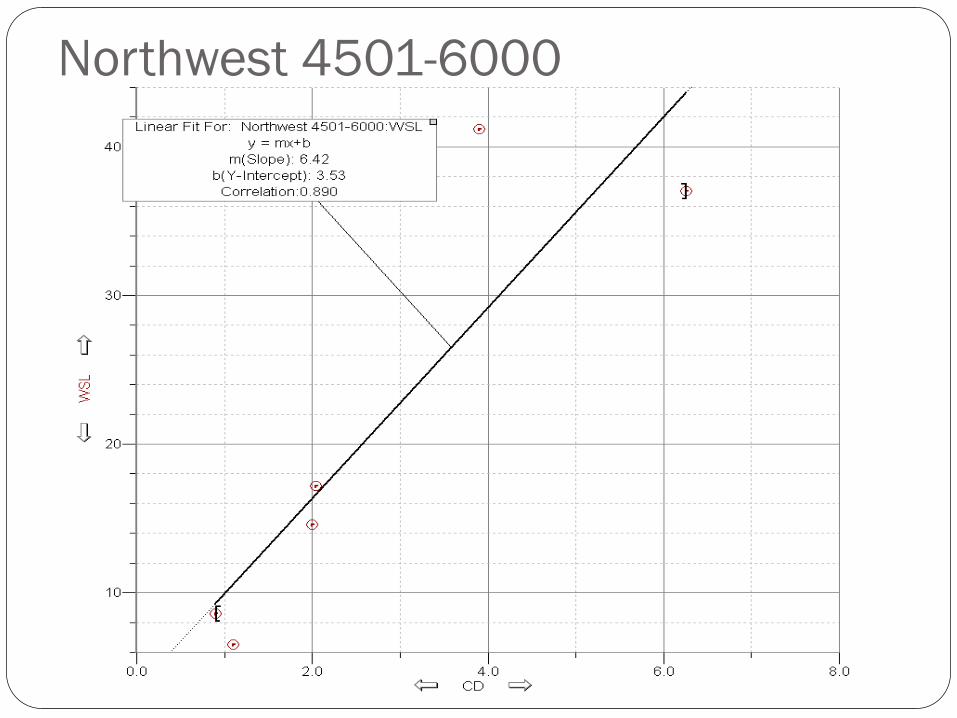
Northwest 4501-6000
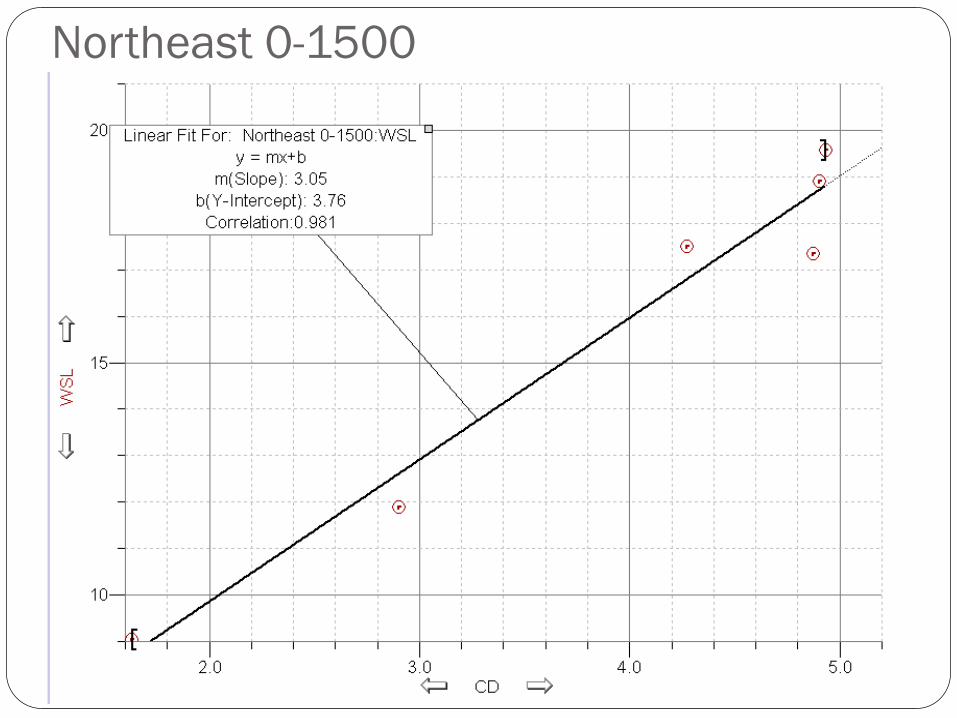
Northeast 0-1500

Northeast 1501-3000

Northeast 3001-4500
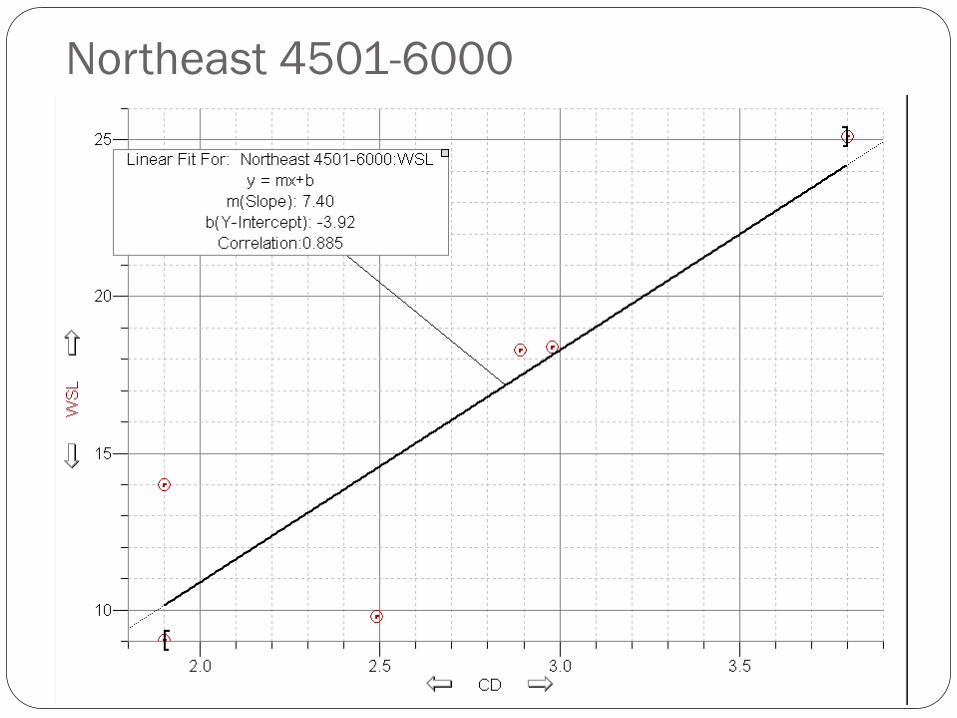
Northeast 4501-6000

Southwest 0-1500
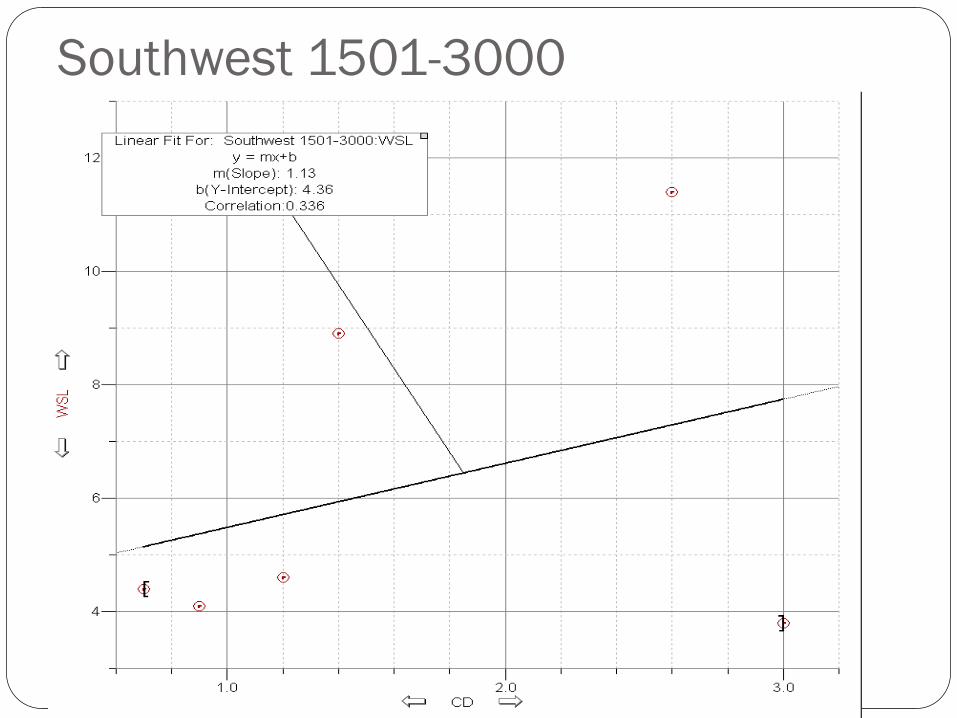
Southwest 1501-3000

Southwest 3001-4500
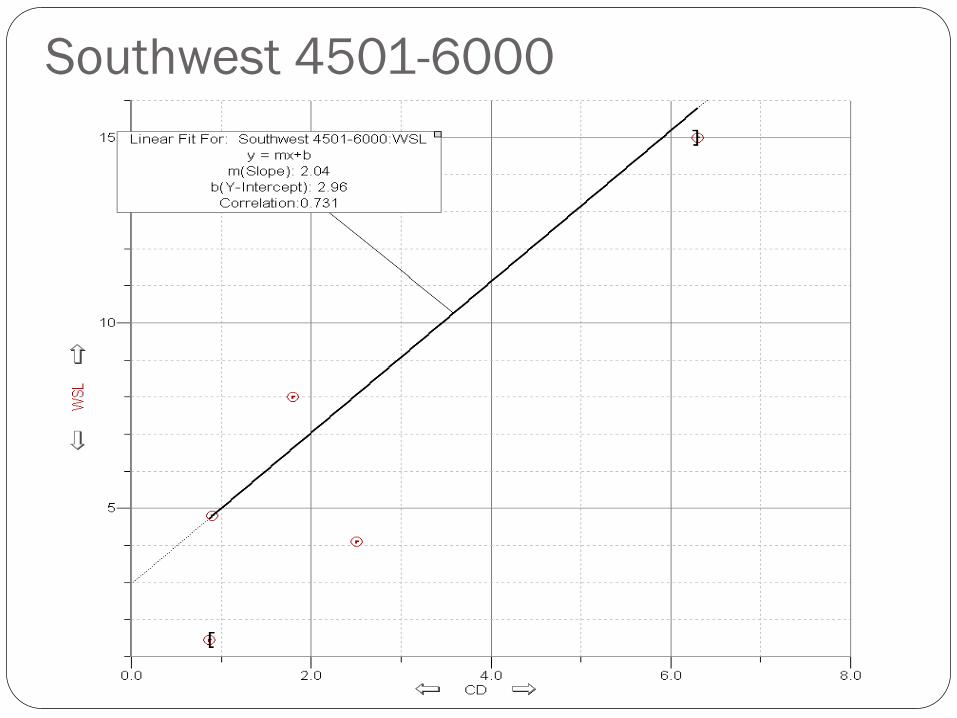
Southwest 4501-6000
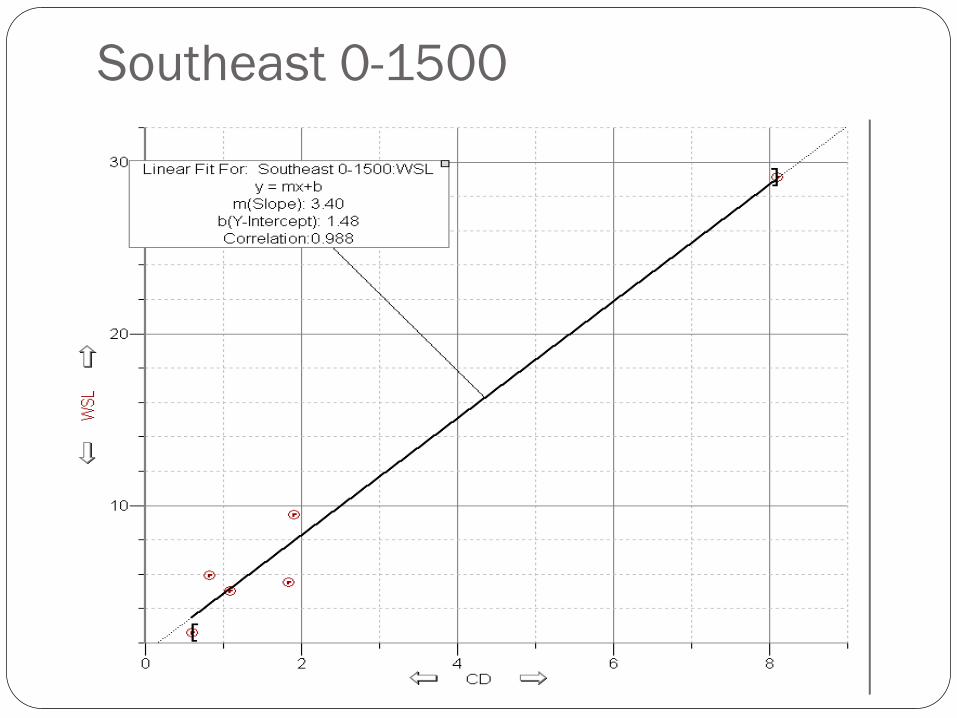
Southeast 0-1500
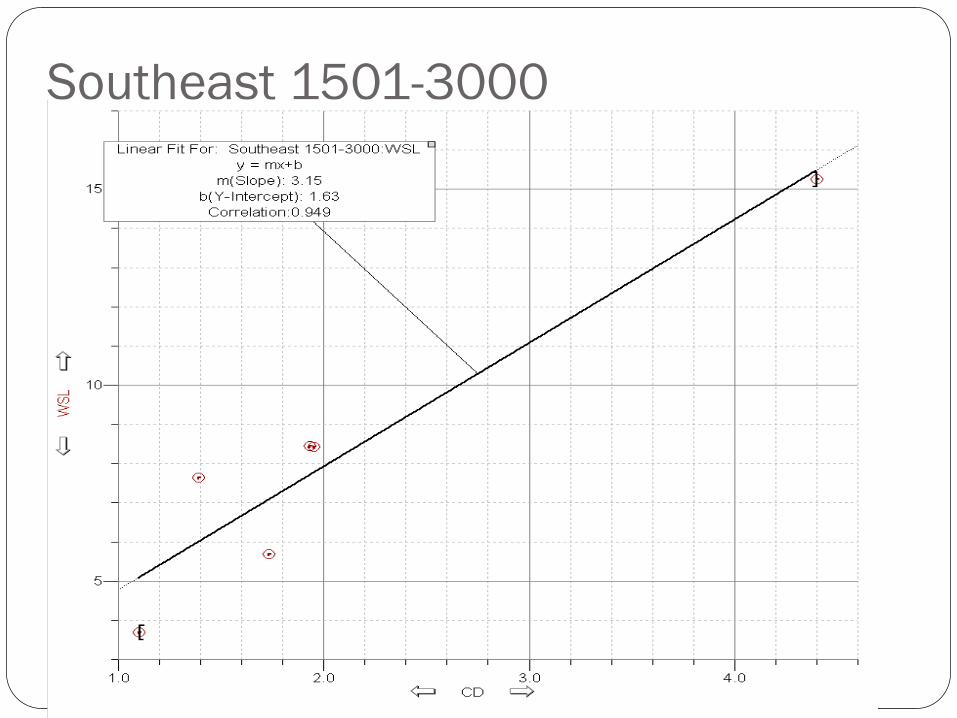
Southeast 1501-3000
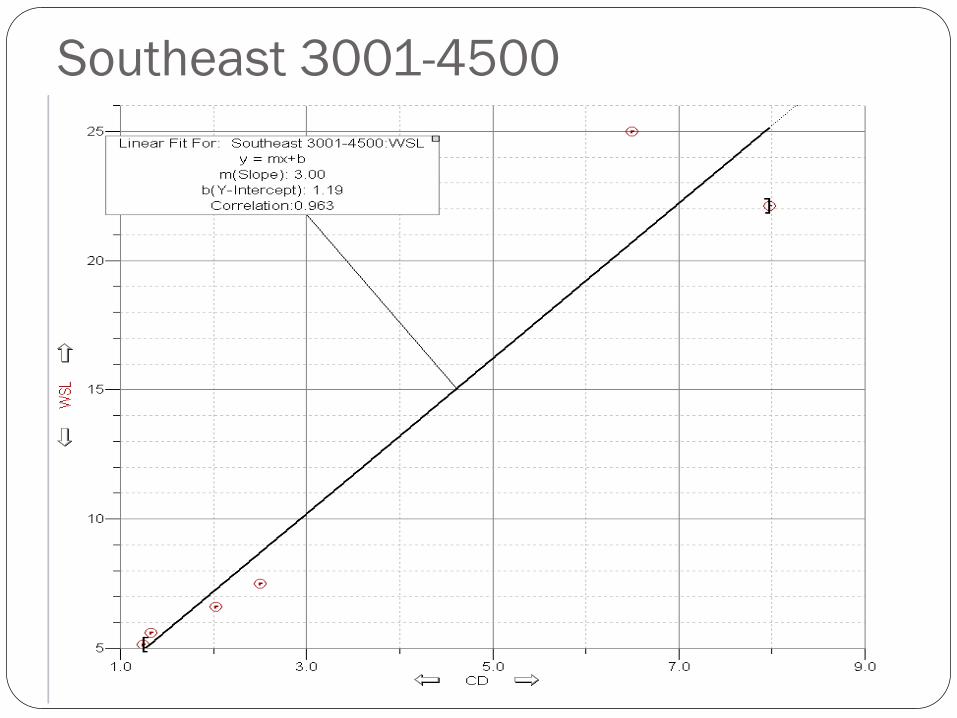
Southeast 3001-4500
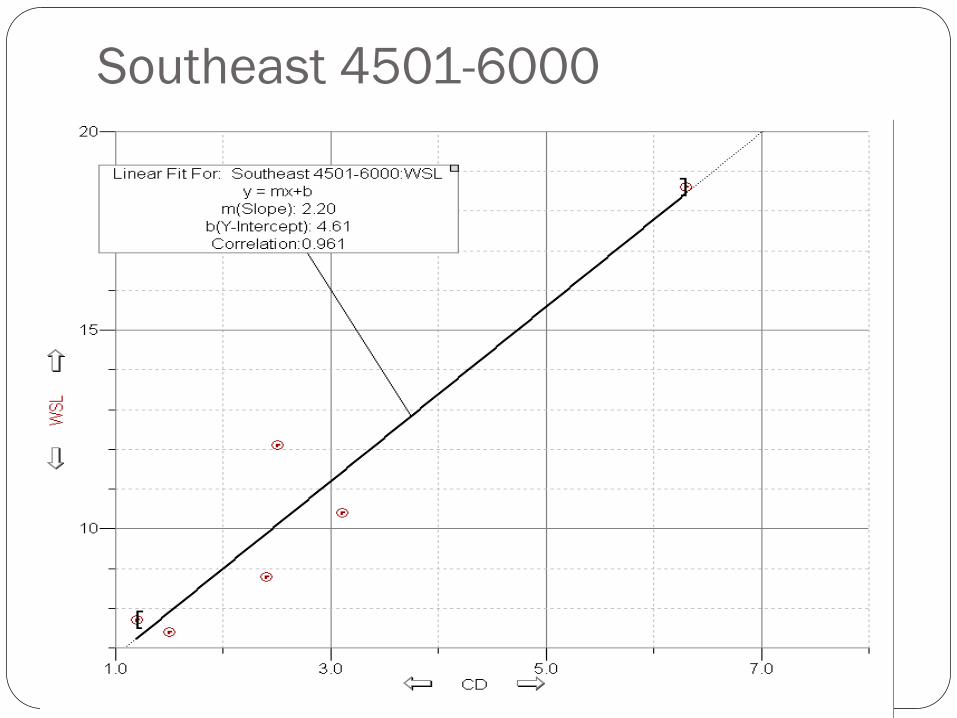
Southeast 4501-6000

Data and Graphs Southwest: � 1-1500: correlation-.538 Slope-3.16 � 1501-3000: Correlation-.336 Slope-1.13 � 3001-4500- Correlation-.675 Slope-14.9 � 4501-6000: Correlation-.731 Slope- 2.04
Southeast � 0-1500: Correlation-.988 Slope-3.40 � 1501-300- Correlation-.949
Slope-3.15 � 3001-4500: Correlation-.963 Slope-3.00 � 4501-6000 Correlation-.961 Slope-2.20
Northeast � 0-1500: Correlation-.981 Slope-3.05 � 1501-3000: Correlation-.906 Slope-2.23 � 3001-4500: Correlation-.982 Slope-1.36 � 4501-6000 Correlation-.885 Slope-7.40
Northwest � 0-1500: Correlation-.906 Slope-.625 � 1501-3000: Correlation-.733 Slope-8.33 � 3001-4500: Correlation-.857 Slope-6.19 � 4501-6000 Correlation-.890 Slope-6.42

What Our Data Shows � Southwest: there is no correlation between wind streaks and
crater diameter. This is because in the southwest section, the volcano has a slower rise in elevation and it is not so steep.
� Southeast: As the elevation increases, the correlation between wind streaks and crater diameter decreases. This is because on the eastern side of the volcano it is much steeper and the elevation change is closer together.
� Northeast: As elevation increases, the correlation between wind streaks and crater diameter stays steady and then it drops between 4501-6000km. This happens because the surface is so even and then at the summit it is higher and there is a change in the evenness of the terrain.
� Northwest: As elevation increases, the correlation drops and then it starts to increase starting with 3001-4500km.

Alba Patera
This is the profile of the volcano.
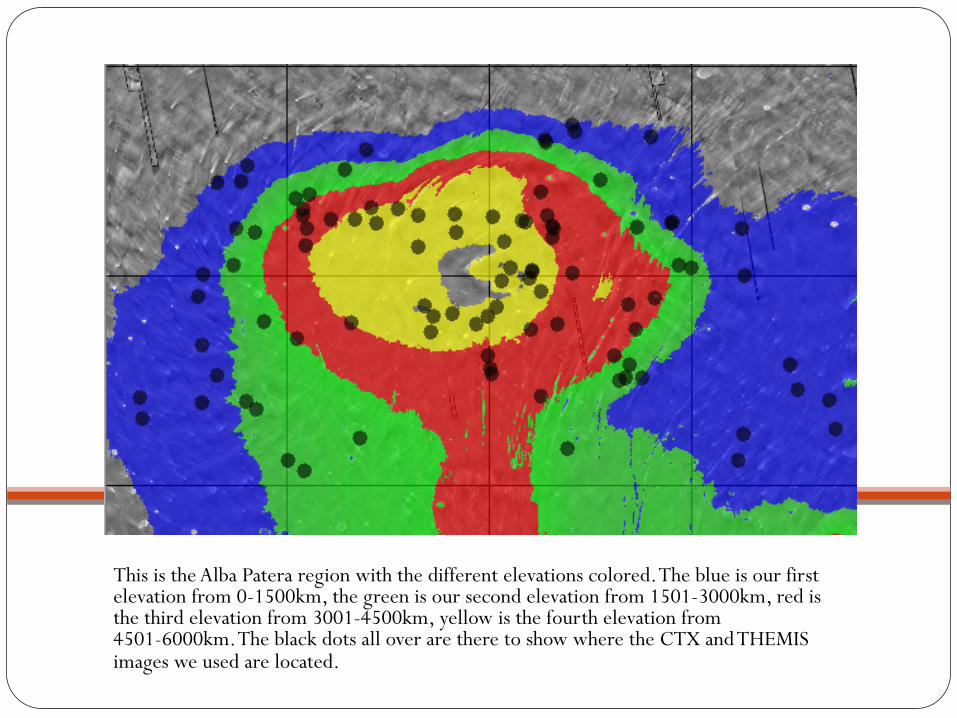
This is the Alba Patera region with the different elevations colored. The blue is our first elevation from 0-1500km, the green is our second elevation from 1501-3000km, red is the third elevation from 3001-4500km, yellow is the fourth elevation from 4501-6000km. The black dots all over are there to show where the CTX and THEMIS images we used are located.

Conclusion � Restated Question: How can crater diameter to wind streak
length ratios be used to determine differences in defined elevations around Alba Patera?
� Restated Hypothesis: Wind streak ratios will increase with elevation.
� Importance: The interest in this is that each elevation around Alba Mons affects the wind streaks.

Conclusion Continued � Not supported � Although 13 of our graphs supported our data, in the Southwest
section 3 of the graphs were not supported. They had correlation numbers of .675, .538, and .336. This supported that there was no relationship in the ratios between the wind streak length and their diameter in those elevations for that section.

References � http://dictionary.reference.com � http://jwocky.gsfc.nasa.gov/teacher/latlonarchive.html � JMARS- Christensen, P.R.; Engle, E.; Anwar, S.; Dickenshied, S.; Noss, D.; Gorelick, N.;
Weiss-Malik, M.; JMARS – A Planetary GIS � THEMIS Images- Christensen, P.R., N.S. Gorelick, G.L. Mehall, and K.C. Murray, THEMIS
Public Data Releases, Planetary Data System node, Arizona State University, <http://themis-data.asu.edu>.
� THEMIS Instrument- Christensen, P.R., B.M. Jakosky, H.H. Kieffer, M.C. Malin, H.Y. McSween, Jr., K. Nealson, G.L. Mehall, S.H. Silverman, S. Ferry, M. Caplinger, and M. Ravine, The Thermal Emission Imaging System (THEMIS) for the Mars 2001 Odyssey Mission, Space Science Reviews, 110, 85-130, 2004.
� CTX Images- Mars Reconnaissance Orbiter (2006–Present) � Global Mosaics- Mars Odyssey (2002–Present) � @article{Lee_1984, title={Mars - Wind streak production as related to obstacle type and
size}, author={Lee, S W}, year={1984}} http://www.mendeley.com/research/mars-wind-streak-production-as-related-to-obstacle-type-and-size/
� Rafkin, Scot C.R. "MODELING MARS WIND STREAK FORMATION." Lunar and Planetary Science XXXIX. T. I. Michaels1, 1Southwest Research Institute, Dept of Space Studies, 2008. Web. 30 Mar. 2012. <http://www.lpi.usra.edu/meetings/lpsc2008/pdf/2362.pdf>.

References Continued � Schutter, Paul D. "ON THE SURFACE." Wind Streaks on Mars. OUGS
Mainland Europe, Feb. 2004. Web. 01 Apr. 2012. <http://ougseurope.org/rockon/surface/windstreaks.asp>.
� Weitz, Catherine M. "Guide to Magellan Image Interpretation." History Home. Web. 01 Apr. 2012. <http://history.nasa.gov/JPL-93-24/ch6.htm>.
� Palmero Rodriguez, J. Alexis. "2009 Annual Research Report." Planetary Science Institute Home. Planetary Science Institute, 2009. Web. 01 Apr. 2012. <http://www.psi.edu/research/reports/2009/rodriguez09.html%20>.