Embed Size (px)
Citation preview

5th UTIAS International Workshop on Aviation and Climate Change
MARS: Manipulation of Reynolds Stress for Drag Reduction and Separation
Control
An Europe FP7-China programme
JP BonnetInstitut Pprime CNRS-Université de Poitiers-ISAE/ENSMA, France
N QinTechnical Coordinator, MARS Project
Department of Mechanical EngineeringThe University of Sheffield, Sheffield S1 3JD, UK
5th UTIAS International Workshop on Aviation and Climate Change Toronto 1 May 18th 2016
Grant Agreement nº266326Jointly funded by EC FP7 and MIIT
5th UTIAS International Workshop on Aviation and Climate Change
�General presentation of MARS, a Europe P7 programme and China joint venture
�Improved Physical Understandings�Innovative Flow Control Devices�Innovative Optimisation Strategies�Limitations and Future Work
Outline

5th UTIAS International Workshop on Aviation and Climate Change
What are the new challenges ?
Vision 2020
-50% CO2
-80% NOx
-50% noise
FlightPath 2050
-75% CO2
-90% NOx
-65% noise
Environmental targets
Reduce environmental impact
Flow Control is one major issue…

5th UTIAS International Workshop on Aviation and Climate Change

5th UTIAS International Workshop on Aviation and Climate Change
AVIC-ARI(CH, Tech Coordinator)
NUAA (CH), THU (CH), NWPU (CH), ZJU (CH), BUAA (CH), PKU
(CH), AVIC-ACTRI (CH), AVIC-FAI (CH)
University of Sheffield(UK, Tech Coordinator),
CIMNE (ES), CAE (CH), CNRS PPRIME (FR), DLR (GE), FOI (SE), Univ.
Manchester (UK),
AIRBUS (EU), AGI (UK), NUMECA (BE), Dassault Aviation (FR), ALENIA (IT),
INRIA (F),
The consortium
5th UTIAS International Workshop on Aviation and Climate Change
5th UTIAS International Workshop on Aviation and Climate Change
5th UTIAS International Workshop on Aviation and Climate Change
5th UTIAS International Workshop on Aviation and Climate Change

5th UTIAS International Workshop on Aviation and Climate Change
5th UTIAS International Workshop on Aviation and Climate Change
Collaborationexperiment, simulation and optimisation
• Most control device cases were carried out with collaboration of experimental and computational partners to investigate the flow physics of the control devices
• Joint effects were crucial for the computational partners to build up their confidence for complicated flow simulations
• Simulations provided some turbulence flow structures for some further understanding of the flow control devices
• Some design optimisations based on computation were carried out but limited due the huge computation for resolved flow control fields
5th UTIAS International Workshop on Aviation and Climate Change
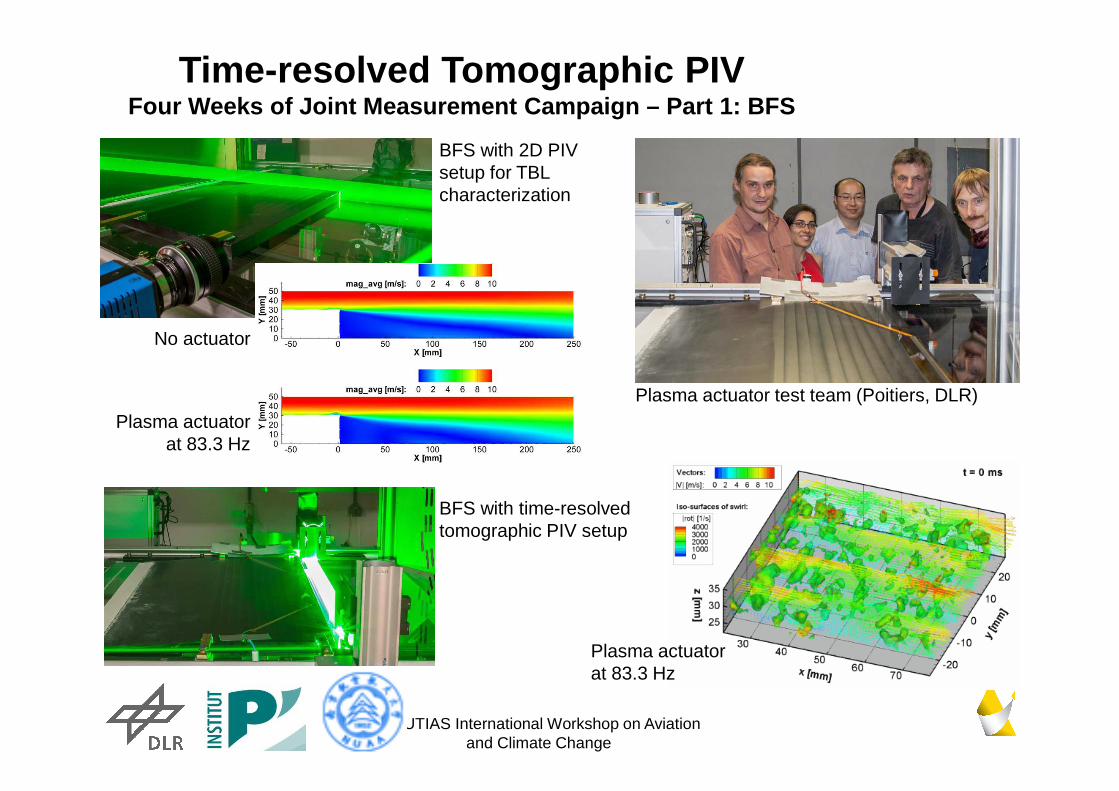
Time-resolved Tomographic PIVFour Weeks of Joint Measurement Campaign – Part 1: B FS
Plasma actuator test team (Poitiers, DLR)
BFS with time-resolved tomographic PIV setup
No actuator
Plasma actuator at 83.3 Hz
BFS with 2D PIV setup for TBL characterization
Plasma actuator at 83.3 Hz

5th UTIAS International Workshop on Aviation and Climate Change
Time-resolved Tomographic PIVFour Weeks of Joint Measurement Campaign – Part 2: W ing
NACA 0015 with setup for time-resolvedlong-distance microscopic stereo PIV
Stereo PIV sample results:
Time-resolved velocity vector fields with colour code of w-component without (left) and with (right) synthetic jet
Synthetic jet test team (AVIC/ARI, NUAA, DLR)
12

5th UTIAS International Workshop on Aviation and Climate Change
13
Dynamics of flow attachment/separation over the airfoil surface of a NACA 0015 in response to impulsive deployment/removal of fluidic vortex generators (FVG).
Jet deployment
Jet removal

5th UTIAS International Workshop on Aviation and Climate Change
Transient wake of NACA0015 airfoil forced by pulsed jets (WL Siaw, JP Bonnet)
� Chord 350 mm
� Span 2.4 m (AR = 7)
� Freestream velocity of 40 m/s
� Re = 1 M
� Fixed incidence 11°
� 44 FVG Positioned at x/c=0.3
� Pitch angle=30° and skew
angle=60°
� 1 mm orifice diameter
� Jets spaced 15 mm apart
Experimental setup
Metrology� PIV (phase-average procedure)
5th UTIAS International Workshop on Aviation and Climate Change
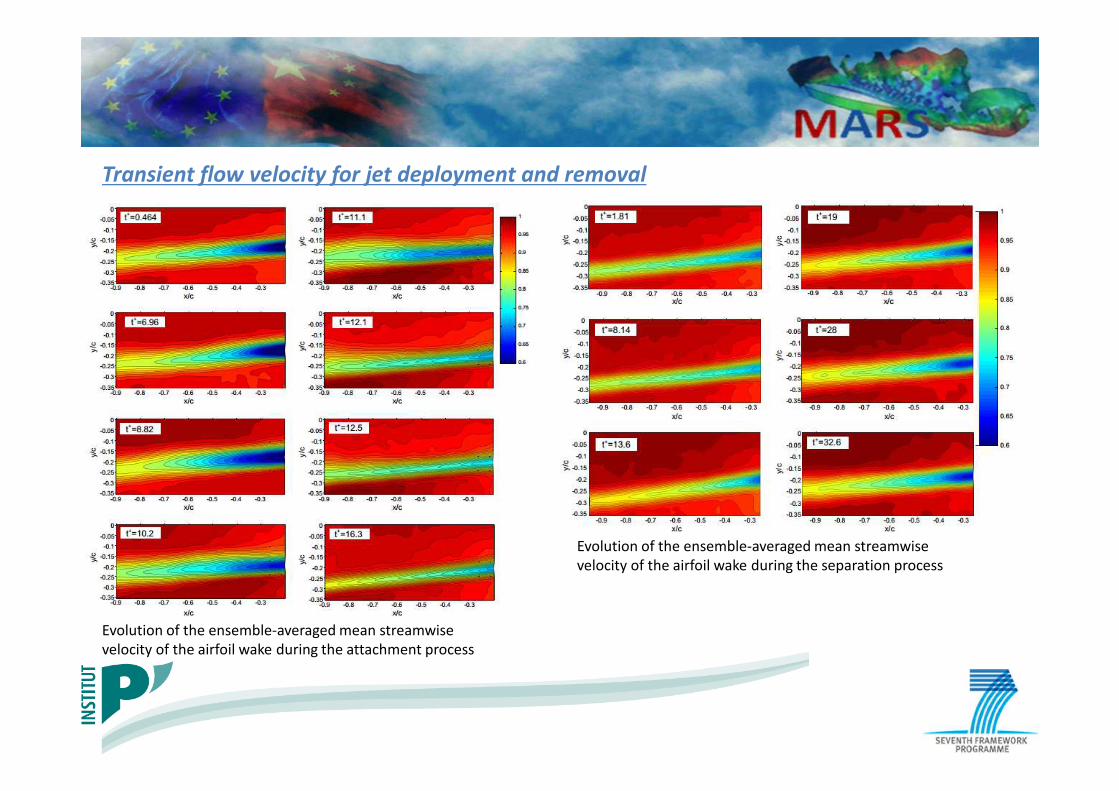
Transient flow velocity for jet deployment and removal
Evolution of the ensemble-averaged mean streamwise
velocity of the airfoil wake during the attachment process
Evolution of the ensemble-averaged mean streamwise
velocity of the airfoil wake during the separation process

5th UTIAS International Workshop on Aviation and Climate Change
16
Transient Process in the Wake During FVG Deployment
•Evolution of the contour of <u’u’>/U
∞
2
consisting of 40 time delays
•Note the convection of a region of high turbulent fluctuation
1
2
3
4
5
6
x 10-3
-0.9 -0.8 -0.7 -0.6 -0.5 -0.4 -0.3-0.35
-0.3
-0.25
-0.2
-0.15
-0.1
-0.05
0
x/c
y/c
T+=12.5
-0.9 -0.8 -0.7 -0.6 -0.5 -0.4 -0.3-0.35
-0.3
-0.25
-0.2
-0.15
-0.1
-0.05
0
x/c
y/c
T+=13.5
-0.9 -0.8 -0.7 -0.6 -0.5 -0.4 -0.3-0.35
-0.3
-0.25
-0.2
-0.15
-0.1
-0.05
0
x/c
y/c
T+=13.9
-0.9 -0.8 -0.7 -0.6 -0.5 -0.4 -0.3-0.35
-0.3
-0.25
-0.2
-0.15
-0.1
-0.05
0
x/c
y/c
T+=14.4
-0.9 -0.8 -0.7 -0.6 -0.5 -0.4 -0.3-0.35
-0.3
-0.25
-0.2
-0.15
-0.1
-0.05
0
x/c
y/c
T+=16.3
-0.9 -0.8 -0.7 -0.6 -0.5 -0.4 -0.3-0.35
-0.3
-0.25
-0.2
-0.15
-0.1
-0.05
0
x/c
y/c
T+=10.2
-0.9 -0.8 -0.7 -0.6 -0.5 -0.4 -0.3-0.35
-0.3
-0.25
-0.2
-0.15
-0.1
-0.05
0
x/c
y/c
T+=10.7
-0.9 -0.8 -0.7 -0.6 -0.5 -0.4 -0.3-0.35
-0.3
-0.25
-0.2
-0.15
-0.1
-0.05
0
x/c
y/c
T+=11.1
-0.9 -0.8 -0.7 -0.6 -0.5 -0.4 -0.3-0.35
-0.3
-0.25
-0.2
-0.15
-0.1
-0.05
0
x/c
y/c
T+=11.6
-0.9 -0.8 -0.7 -0.6 -0.5 -0.4 -0.3-0.35
-0.3
-0.25
-0.2
-0.15
-0.1
-0.05
0
x/c
y/c
T+=12.1
-0.9 -0.8 -0.7 -0.6 -0.5 -0.4 -0.3-0.35
-0.3
-0.25
-0.2
-0.15
-0.1
-0.05
0
x/c
y/c
T+=0.464
-0.9 -0.8 -0.7 -0.6 -0.5 -0.4 -0.3-0.35
-0.3
-0.25
-0.2
-0.15
-0.1
-0.05
0
x/cy/
c
T+=5.11
-0.9 -0.8 -0.7 -0.6 -0.5 -0.4 -0.3-0.35
-0.3
-0.25
-0.2
-0.15
-0.1
-0.05
0
x/c
y/c
T+=6.96
-0.9 -0.8 -0.7 -0.6 -0.5 -0.4 -0.3-0.35
-0.3
-0.25
-0.2
-0.15
-0.1
-0.05
0
x/c
y/c
T+=7.89
-0.9 -0.8 -0.7 -0.6 -0.5 -0.4 -0.3-0.35
-0.3
-0.25
-0.2
-0.15
-0.1
-0.05
0
x/c
y/c
T+=8.82

5th UTIAS International Workshop on Aviation and Climate Change
Transient Process in the Wake During FVG Removal
•Evolution of the contour of <u’u’>/U
∞
2
consisting of 40 time delays
1
2
3
4
5
6
x 10-3
-0.9 -0.8 -0.7 -0.6 -0.5 -0.4 -0.3-0.35
-0.3
-0.25
-0.2
-0.15
-0.1
-0.05
0
T+=28
x/c
y/c
-0.9 -0.8 -0.7 -0.6 -0.5 -0.4 -0.3-0.35
-0.3
-0.25
-0.2
-0.15
-0.1
-0.05
0
T+=30.8
x/c
y/c
-0.9 -0.8 -0.7 -0.6 -0.5 -0.4 -0.3-0.35
-0.3
-0.25
-0.2
-0.15
-0.1
-0.05
0
T+=32.6
x/c
y/c
-0.9 -0.8 -0.7 -0.6 -0.5 -0.4 -0.3-0.35
-0.3
-0.25
-0.2
-0.15
-0.1
-0.05
0
T+=36.2
x/c
y/c
-0.9 -0.8 -0.7 -0.6 -0.5 -0.4 -0.3-0.35
-0.3
-0.25
-0.2
-0.15
-0.1
-0.05
0
T+=19
x/c
y/c
-0.9 -0.8 -0.7 -0.6 -0.5 -0.4 -0.3-0.35
-0.3
-0.25
-0.2
-0.15
-0.1
-0.05
0
T+=23.5
x/c
y/c
-0.9 -0.8 -0.7 -0.6 -0.5 -0.4 -0.3-0.35
-0.3
-0.25
-0.2
-0.15
-0.1
-0.05
0
T+=13.6
x/c
y/c
-0.9 -0.8 -0.7 -0.6 -0.5 -0.4 -0.3-0.35
-0.3
-0.25
-0.2
-0.15
-0.1
-0.05
0
T+=15.4
x/c
y/c
-0.9 -0.8 -0.7 -0.6 -0.5 -0.4 -0.3-0.35
-0.3
-0.25
-0.2
-0.15
-0.1
-0.05
0
T+=1.81
x/cy/
c
-0.9 -0.8 -0.7 -0.6 -0.5 -0.4 -0.3-0.35
-0.3
-0.25
-0.2
-0.15
-0.1
-0.05
0
T+=4.52
x/c
y/c
-0.9 -0.8 -0.7 -0.6 -0.5 -0.4 -0.3-0.35
-0.3
-0.25
-0.2
-0.15
-0.1
-0.05
0
T+=8.14
x/c
y/c
-0.9 -0.8 -0.7 -0.6 -0.5 -0.4 -0.3-0.35
-0.3
-0.25
-0.2
-0.15
-0.1
-0.05
0
T+=11.8
x/c
y/c

5th UTIAS International Workshop on Aviation and Climate Change
NACA0015 wake flow control by pulsed jets with focus on transient regimes
NACA0015 Model characteristics:
• Chord 350 mm
• Span 2.4 m (AR = 7)
• External velocity 40 m/s (Re = 1 M)
• Fixed incidence 11°
• PIV measurements by phase-average (40 instants)
Transient TKE during jet deploymentTransient SS during jet deployment
0.01
0.015
0.02
0.025
0.03
0.035
0.04
0 5 10 15 20
T+
Cd
0.01
0.015
0.02
0.025
0.03
0.035
0.04
0 5 10 15 20 25 30 35 40
T+
Cd
Estimated temporal drag
Jet deployment
Jet removal
NACA0015 – Pulsed Jets
5th UTIAS International Workshop on Aviation and Climate Change
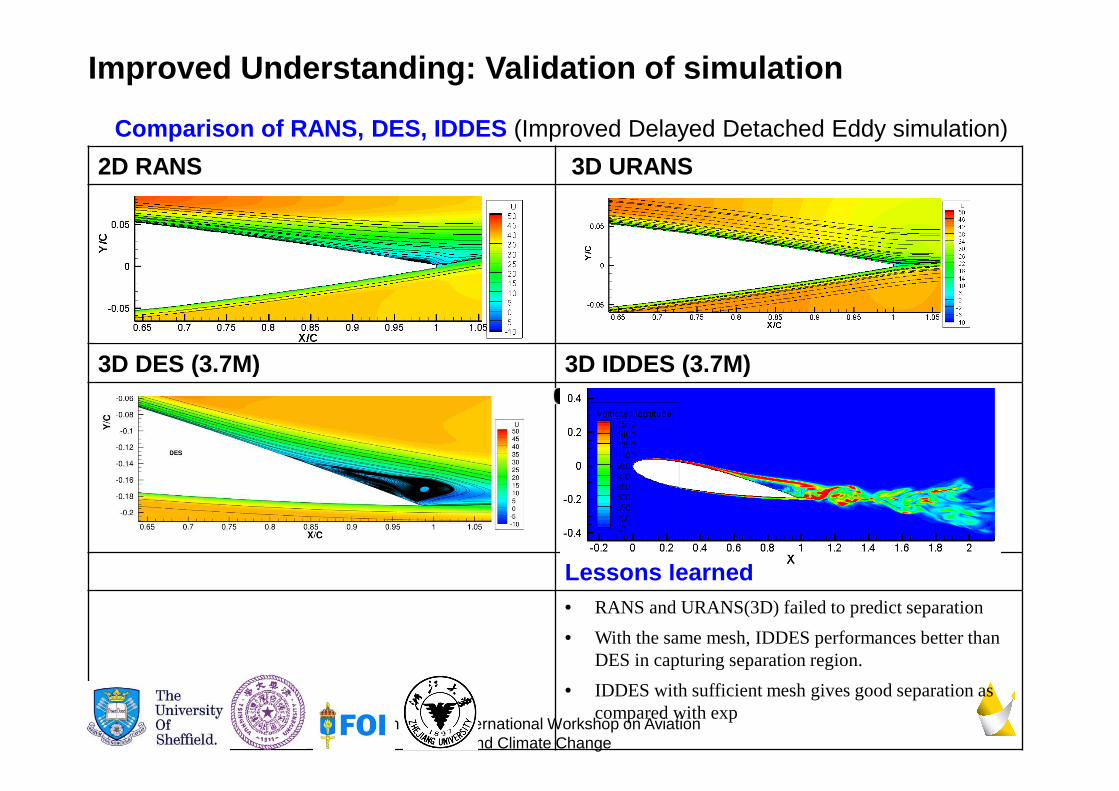
Improved Understanding: Validation of simulation
Comparison of RANS, DES, IDDES (Improved Delayed Detached Eddy simulation)
2D RANS 3D URANS
3D DES (3.7M) 3D IDDES (3.7M)
Lessons learned• RANS and URANS(3D) failed to predict separation
• With the same mesh, IDDES performances better than DES in capturing separation region.
• IDDES with sufficient mesh gives good separation as compared with exp
5th UTIAS International Workshop on Aviation and Climate Change
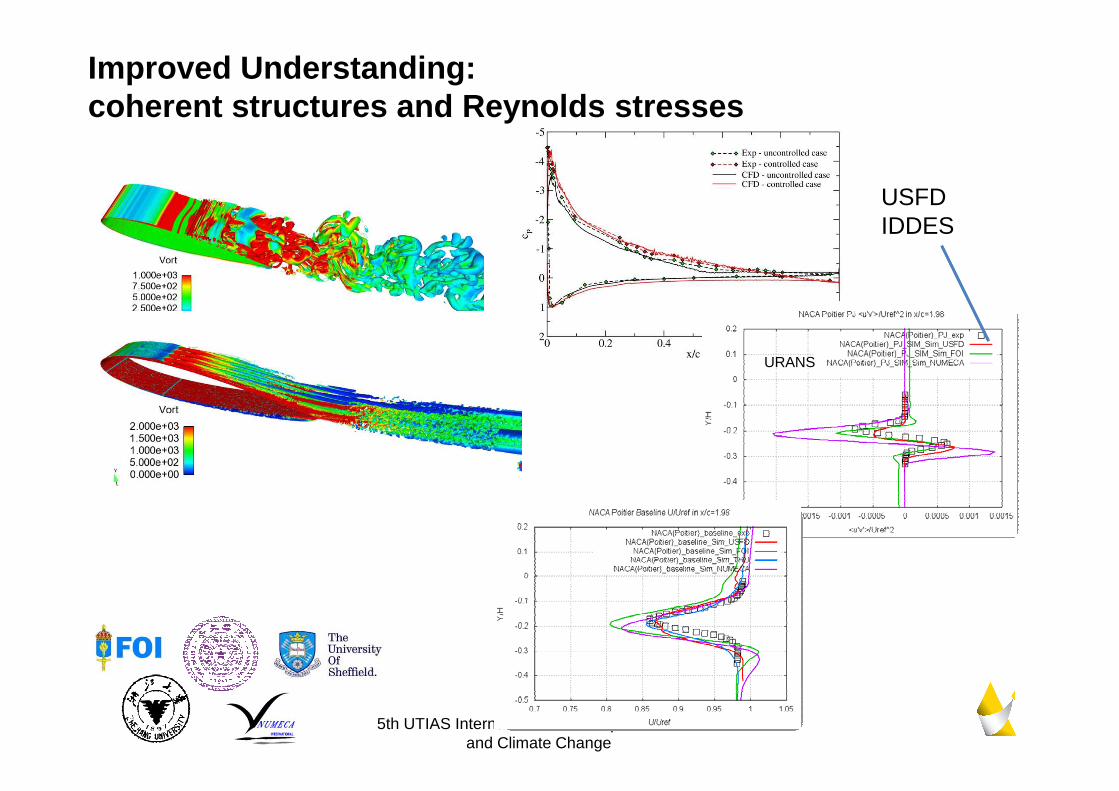
Improved Understanding: coherent structures and Reynolds stresses
USFD IDDES
URANS
5th UTIAS International Workshop on Aviation and Climate Change
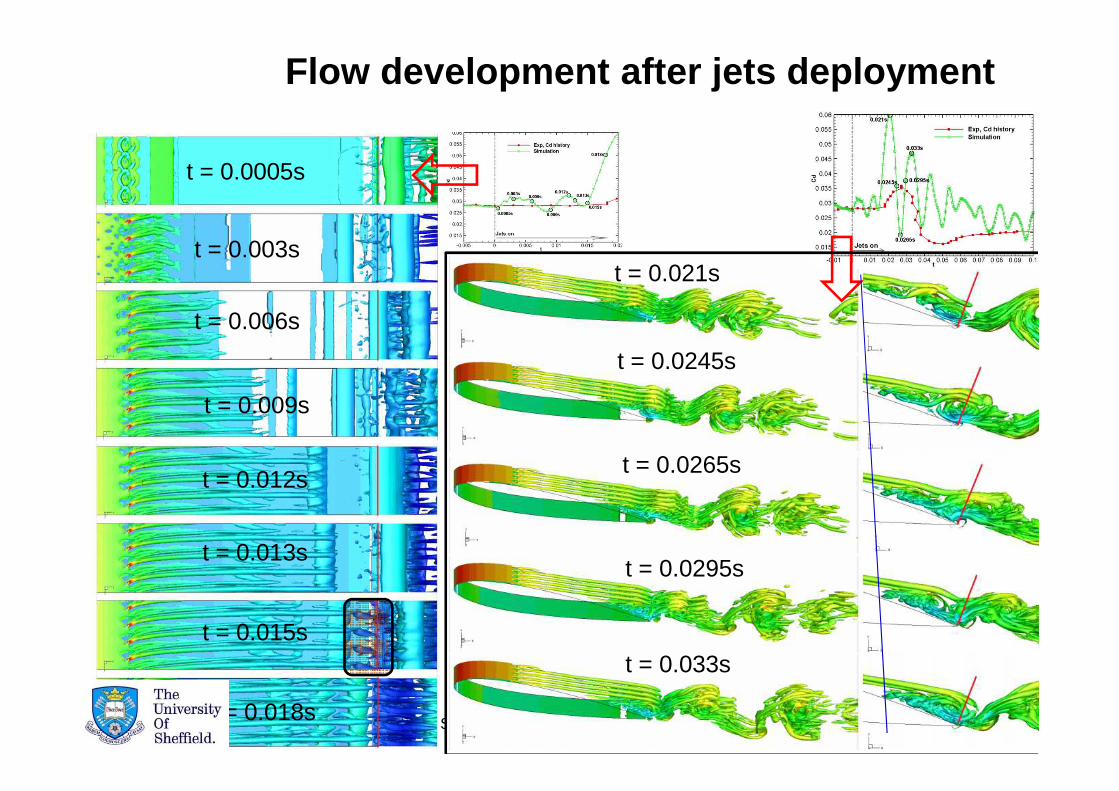
Flow development after jets deployment
t = 0.0005s
t = 0.003s
t = 0.006s
t = 0.009s
t = 0.012s
t = 0.013s
t = 0.015s
t = 0.018s
t = 0.021s
t = 0.0245s
t = 0.0265s
t = 0.0295s
t = 0.033s
5th UTIAS International Workshop on Aviation and Climate Change
2
2
TSFP9
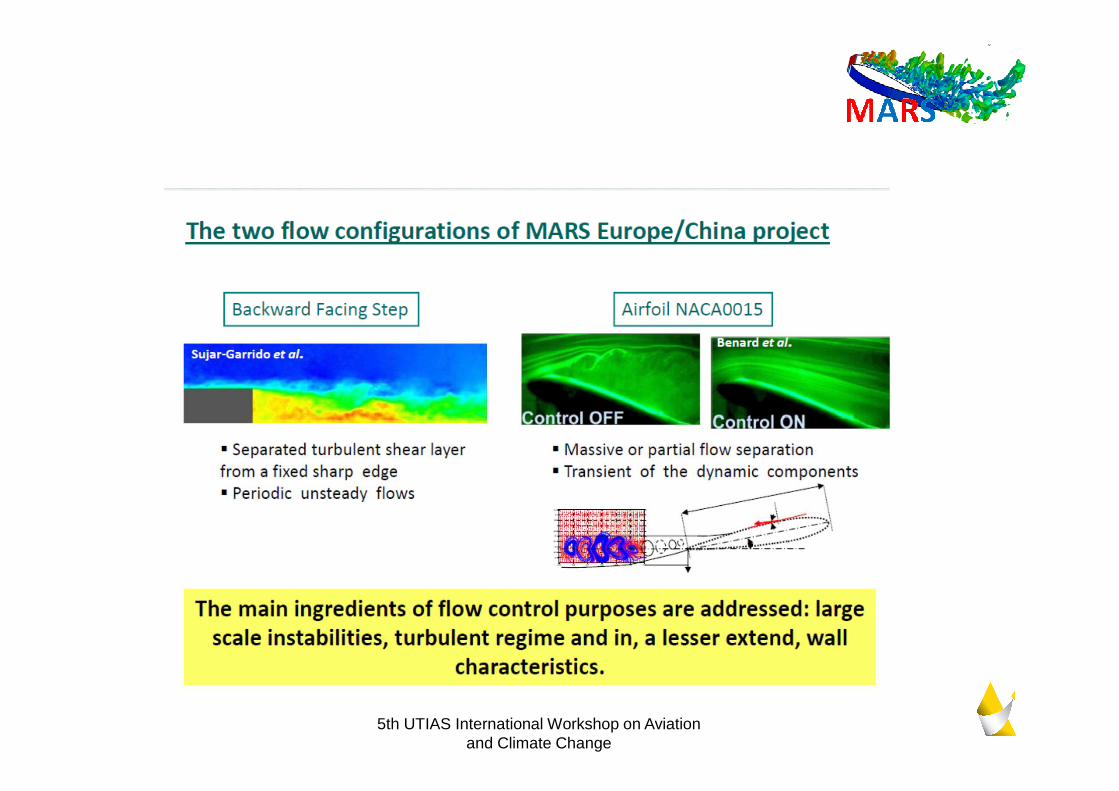
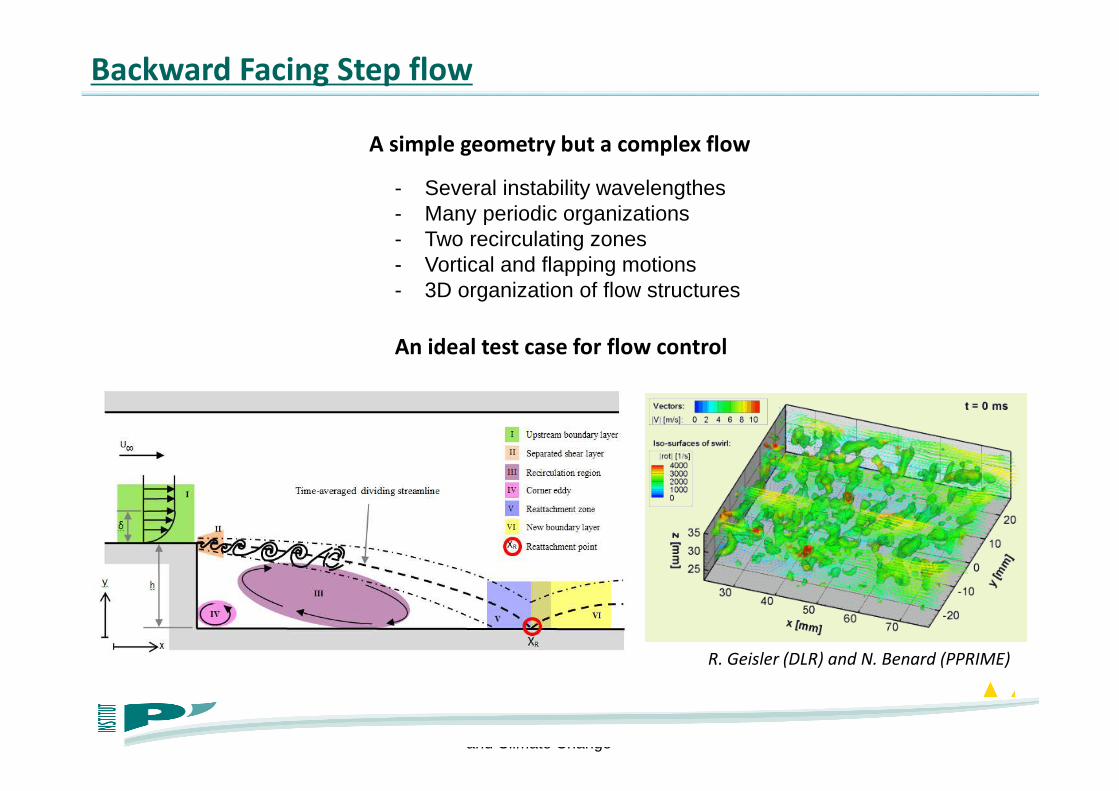
Backward Facing Step flow
A simple geometry but a complex flow
- Several instability wavelengthes- Many periodic organizations- Two recirculating zones- Vortical and flapping motions- 3D organization of flow structures
An ideal test case for flow control
R. Geisler (DLR) and N. Benard (PPRIME)

5th UTIAS International Workshop on Aviation and Climate Change
2
3
TSFP9
DBD Actuators
Non-thermal plasma actuator driven by ac frequency
Electrode arrangement on the BFS model
� Electrode arrangement for electric wind production in positive x direction
� 3-mm thick dielectric (PMMA)� Voltage amplitude of 20 kV� Driven ac frequency of 1-2 kHz� Variable pulsed frequency fBM� Variable duty-cycle
Electrical signal applied to the actuator
5th UTIAS International Workshop on Aviation and Climate Change
24TSFP9
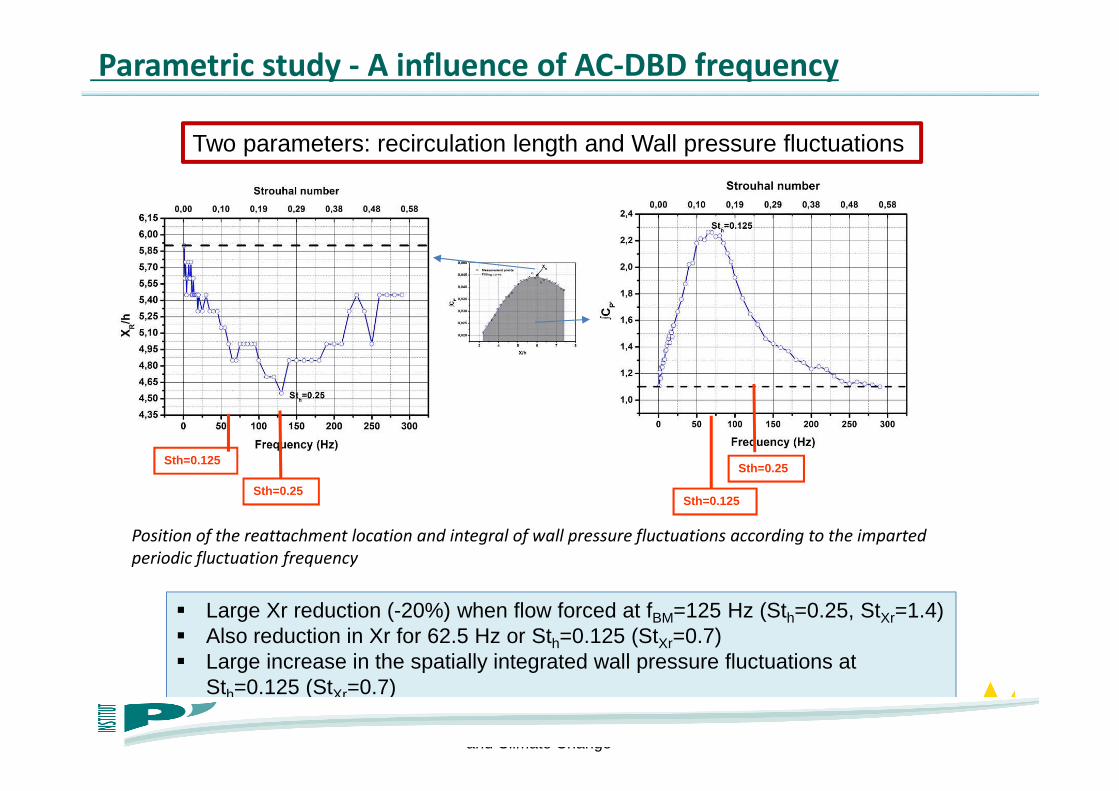
Parametric study - A influence of AC-DBD frequency
Position of the reattachment location and integral of wall pressure fluctuations according to the imparted
periodic fluctuation frequency
� Large Xr reduction (-20%) when flow forced at fBM=125 Hz (Sth=0.25, StXr=1.4)� Also reduction in Xr for 62.5 Hz or Sth=0.125 (StXr=0.7)� Large increase in the spatially integrated wall pressure fluctuations at
Sth=0.125 (StXr=0.7)
Sth=0.125Sth=0.25
Sth=0.125
Two parameters: recirculation length and Wall pressure fluctuations
Sth=0.25

5th UTIAS International Workshop on Aviation and Climate Change
BFS – Piezo Oscillating Surface
P4 P3 P2 P1
� Time and space averaged streamlines
LR=6.7
LR=6.0(10% reduction)
OS1
Baseline

5th UTIAS International Workshop on Aviation and Climate Change
Baseline
Spanwise Vortex Generator – a Novel Flow Control Devi ce
3D simulation setup
� The width of the SVG is 5mm� The neutral position 3mm above the step wall.� Amplitude is 2mm.
Flow structures
SVG
SVG breaks up the rolling vortex shedding from the step and reduces 30%. (From baseline 6.5H to 4.5H.
H=
470
h=
30
W=
300
Prestontube

5th UTIAS International Workshop on Aviation and Climate Change
5th UTIAS International Workshop on Aviation and Climate Change
Optimization studies

5th UTIAS International Workshop on Aviation and Climate Change
Kriging-based optimization of flow control devices
Simulation of controlled flow (RANS models) with actuation coupled with automatic optimization (Kriging-based algorithm)
Quantify impact of :-Numerical errors-Modeling (turbulence, actuator)
Vorticity field for BFS case with synthetic jet (RANS)
Kriging model of recirculation length w.r.t. actuation parameters

5th UTIAS International Workshop on Aviation and Climate Change
Surrogate-based model optimization for NUAA Test
Case based on Wind Tunnel Test with SJ
Initial angles: 90°°°°, 120°°°°, 150°°°°
New angle: 135°°°°
New angle: 105°°°° New angle:
112.5°°°°
Final angle: 127.5°°°°
f = 35Hz=127.5θ
Excellent flow control effect The Optimization Strategy Based
on the In-Looped Update Surrogate Model with Wind Tunnel Test
The new experimentalscheme design

5th UTIAS International Workshop on Aviation and Climate Change
5th UTIAS International Workshop on Aviation and Climate Change
As a conclusion: • Innovative flow control devices proposed and investigated
experimentally and computationally in the project:� Spanwise pressure wave driven synthetic jets (NUAA/USFD/NPU)� Piezo driven oscillating surfaces (UniMan/USFD/ZJU)� Spanwise oscillating strip vortex generator (NUAA/USFD) � Satisfactry IDDES computation
• Optimisation strategies on the BFS test case (not presented here)� Innovative methodology by directly coupling optimisation algorithm to
drive the experimental design parameters (CIMNE/Poitiers)� Optimisation directly based on experimental output (NUAA/NPU)

5th UTIAS International Workshop on Aviation and Climate Change
GA Optimization Based on Experiment with Plasma
HPRMOP
Individual Generation by:- GA Strategies- Hybrid Games
Individual Evaluation:
- Wind Tunnel
Optimal Configuration of the Wind Tunnel:
- maximize P’- minimize Reatt. lenghth
LabVIEW: WT-GA
interface
LabVIEW: GA-WT interface
Improves the control of the flow
The innovative approach with LabVIEW forexperimental optimization is built up.

5th UTIAS International Workshop on Aviation and Climate Change
5th UTIAS International Workshop on Aviation and Climate Change
CollaborationChinese and EU partners
• Close collaboration has been demonstrated throughout the project between EU and Chinese partners
• This is particularly demonstrated in the DLR experimental effort for plasma and synthetic jets to obtained detailed flowfield Re stresses in the DLR tunnel (DLR, ARI, NUAA, Poitiers)
• Substantial collaboration on the numerical investigation regarding proper turbulence modelling, meshing and boundary conditions through cross-comparison

5th UTIAS International Workshop on Aviation and Climate Change
5th UTIAS International Workshop on Aviation and Climate Change
Limitations and future work• Conflicting requirement in design optimization between
the required flow resolution for flow control and the huge computation cost (>many weeks) when compared to experiments
• Larger volume detailed flow-field tomographic measurement to reveal the turbulent flow structures to understand and validate
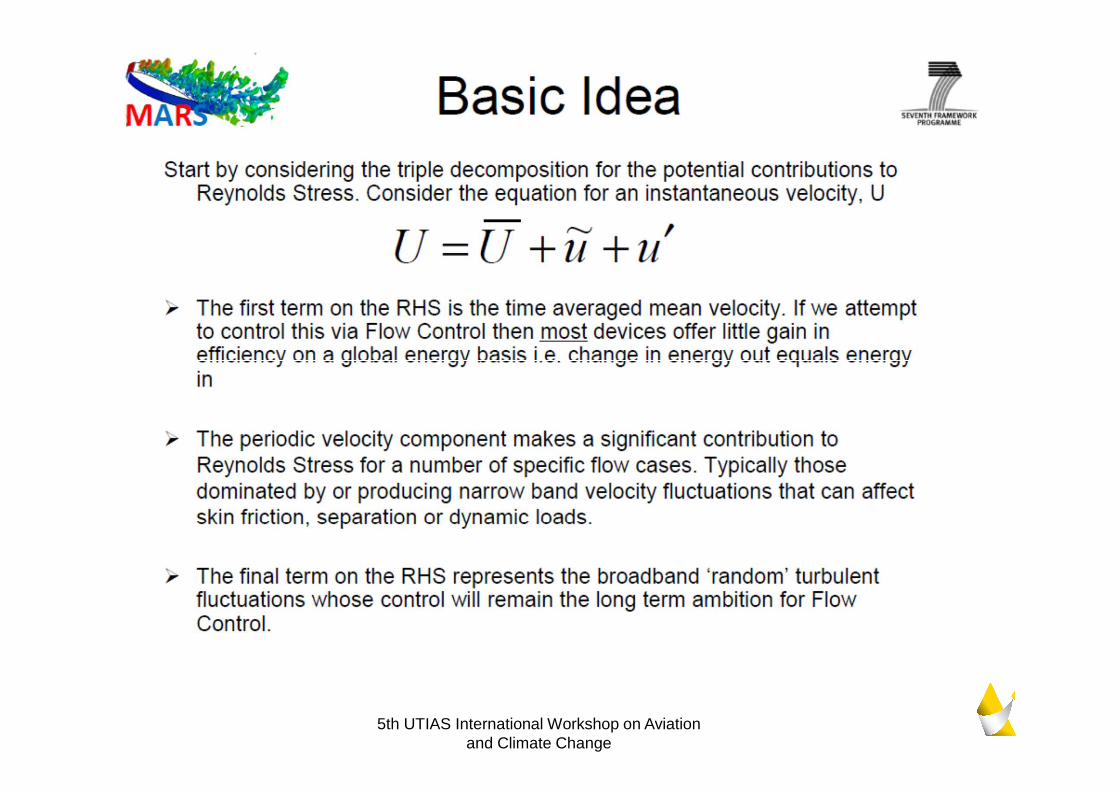
• Differentiation of u tilda and u prime in the triple decomposition and phase averaging the data processing
• Lack of information on the effects of flow control devices on skin friction drag reduction, although their effects on flow separation are better demonstrated
� MARS is followed by the DRAGY programme devoted to skin friction drag reduction

5th UTIAS International Workshop on Aviation and Climate Change
Thank you
for your attention !