Embed Size (px)
Citation preview

WS
^DL4^1
Mars Global Reference Atmospheric Model (Mars-GRAM 2005) Applications forMars Science Laboratory Mission Site Selection Processes
H. L. Justh' and C. G. Justus2I NASA, Marshall Space Flight Center, Mail Code EV13, Marshall Space Flight Center, AL 35812, [email protected]
2 Stanley Associates, Marshall Space Flight Center, Mail Code EV13, Marshall Space Flight Center, AL 35812, Carl.G.Justus®nasa.gov
Mars Global Reference New Features of Mars-GRAM Applications for Mars Science
Atmospheric Model Laboratory Mission Site(Mars-GRAM) 200.5 Selection
y^,m` moson<rK ^w. ^..nn
..
.-:ice :ab .•i bu.-<. ..-.n.,...,"......,^-.^ ^^,^ .
,„.,^ .. ^,.^,.r^D ^.. --•- .._...^-... ._..^
Other Sources of MarsAtmospheric DataMars-GRAM Auxiliary Profiles Characteristics of TES Nadir
Database
Characteristics of TES LimbDatabase
Mean Density Comparisons Zonal Wind Comparison Wind Perturbation Comparisons Density Standard DeviationComparison
ZU
Density Comparison ofMesoscale Models and TES Limb Conclusions Acknowledgments References
data^,7Es ^ me nein«s gaieruiry a<xr«-ieeae. ., co.;r l l :^e F,nm.e.^r.a:°soox.<wu .^ _:..,..- •,r °- - wm+m.° «,m,momi sr.m c. a.l ^I r.mswrmeae
^v^ n^.e'.°: °avrlavwmwm ve..I°°o.l bw rs>, i.a.,es....m° uwws-H«loewon eels unx.mi>I n.rkn s. c. ei. ^xoo^)rw s2se.
m^u4aGs^ _—...__ beq uMU. M •ig4mD.e.r I.a.(%) WOe¢nopmuersrv+.n x r.^.uu..u.rM— uuu _ .°sr FUV ranp
M.n C^^i.xr ru^ W ea=' nq• 4Werver.ma c+Mr . fi-v
rn^ti^^i^mu.m..im[ov.re••wnu da'.wu6"t^. v 9
verwrna WrM .nqa. •^Yn Va fit. Yau.^51 G.c9nyanl Fleaa .n
https://ntrs.nasa.gov/search.jsp?R=20090028811 2019-08-03T04:31:47+00:00Z
ars
Mars Global Reference AtmosphericModel (Mars-GRAM 2005) Applicationsfor Mars Science Laboratory Mission
Site Selection Processes
H. L. Justh I and C. G. Justus'
'NASA, Marshall Space Flight Cemer, Mail Code EV13, MarshallSpace Flight Center, AL 35812, Hilary.LJusth wnasa.gov
'Stanley Associates, Marshall State Flight Center, Mail Code EV13,Marshall Space Flight Center, AL 35812, Carl. G.Justus®nasa.gov
Atmospheric Model(Mars-GRAM)
Engineenr"vel atmospheric model wid" used for diverse mssionapplicationsMars-GRAM 's perturbation modelin capability is commonty used, in aMonte-Carlo ml to perform high lideliry engineering end-to-endsimulations for entry. descent, and landing (EDL)'.Traditional Mars-GRAM options for representing the mean atmospherealong entry corridors include.
driven by ogLY
TIES dust corral e¢pth M pan coming from MGCM rtg0el result
- TES Mapp q Y¢ar 0, yrt user controlled bust optical :TM and Mars-GRAM datam erpda@dr from MGCM model result amen by selecLLd values of globally-umfonn dustoptical With.
From the surface to 80 km attitude, Mars-GRAM is based on NASA AmesMars General Circulation Model (MGCM). Mars-GRAM and MGCM usesurface topograp)fry from Mars Global surveyor Mars Orbiter LaserAltimeter (M L ,with altitudes referenced to the MOLA areci d, orconstant potential surface.Mars-GRAM 2005 has been validated a against Radio Science data, andboth nadir and limb data from the Thermal Emssion Spectrometer (TES)a.
New Features of Mars-GRAM 2005
Option to use input data sets from MGCM model runs that weredesigned to closely simulate conditions observed during the first twoyears of TES observations at Mars- TES Year1 = April 1999 through January 2001- TES Year 2 = February 2001 through December 2002
Option to read and use any auxiliary profile of temperature anddensity versus altitude. In exercising the auxiliary profile Mars-GRAM option, the values from the auxiliary profile replace data fromthe original MGCM databases- Examples of amiliary profiles:
• Data from TES (nadir or limb) obseryatlons• Mars mesoscale model oulpul at a pancular location and time
Two Mars-GRAM parameters allow standard deviations of Mars-GRAM perturbations to be adjusted- rpscale can be used to scale density perturbations up or down
mscale can be used to scale wind perturbations
Applications for Mars Science LaboratoryMission Site Selection:
In order to assess Mars Science Laboratory (MSL)landing capabilities, three of the candidate sites thatrepresent a wide range of atmospheric conditions wereselected for initial study:- Terby Crater- Melas Chasma- Gale Crater.
Two mesoscale models were run for the expected MSLlanding season and time of day.- Mars Regional Atmospheric Modeling System (MRAMS) of
Southwest Research Institute'- Mars Mesoscale Model number 5 (MMM5) of Oregon State
University5.
Mars-GRAM Auxiliary Profiles
ff
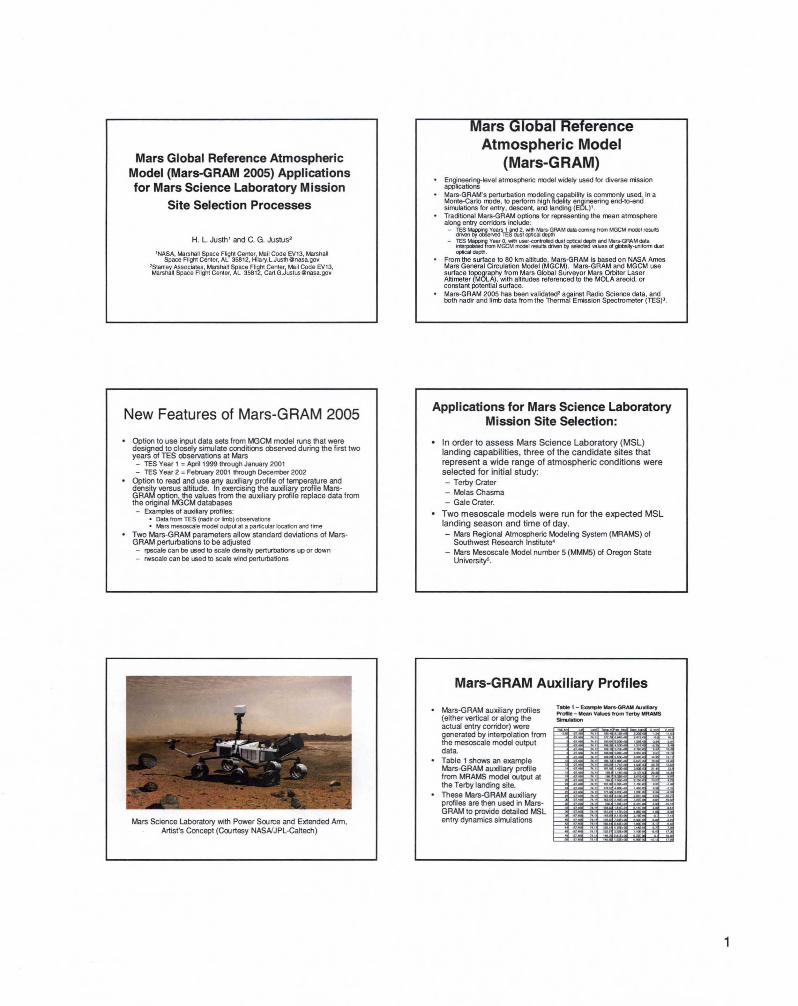
Mars Science Laboratory with Power Source and Extended Arm,Artist's Concept (Courtesy NASA/JPL-Caltech)
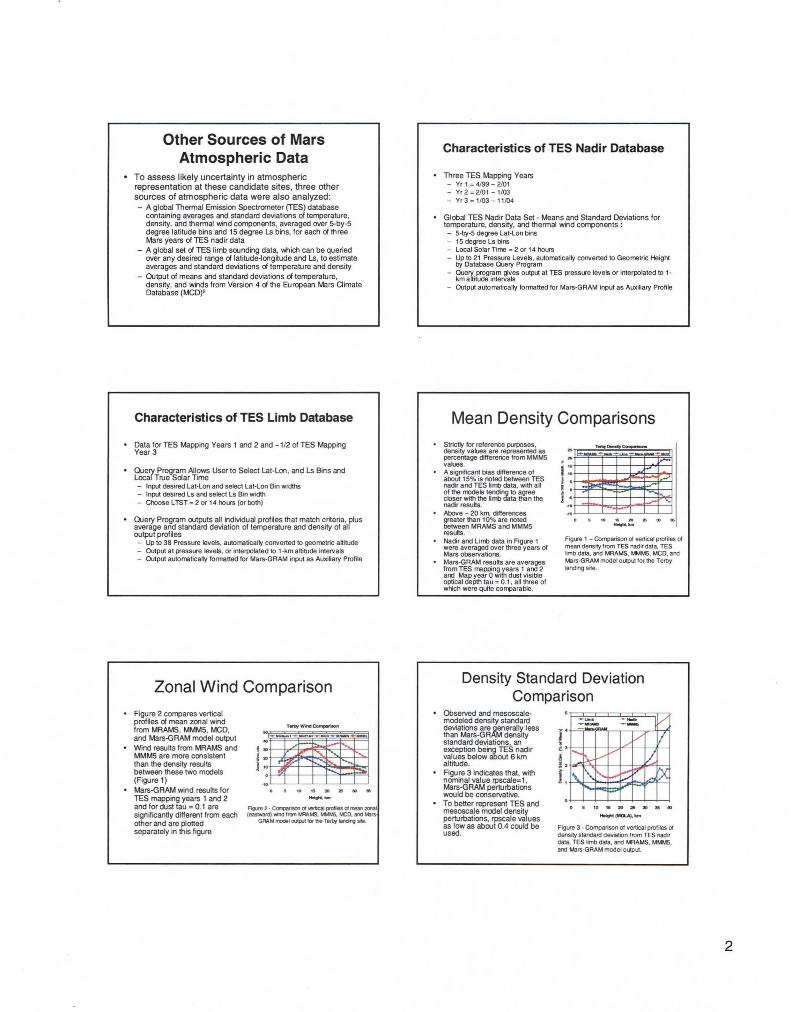
Mars-GRAM auxiliary profiles(either vertical or along theactual entry corridor) weregenerated by interpolation fromthe mesoscale model outputdata.Table 1 shows an exampleMars-GRAM auxiliary profilefrom MRAMS model output atthe Terby landing site.These Mars-GRAM auxiliaryprofiles are then used in Mars-GRAM to provide detailed MSLentry dynamics simulations
T-e I - Example Mars-GRAM A,—yProf to - Mean Values hom Terby MRAMSs—laBon
Other Sources of MarsAtmospheric Data
To assess likely uncertainty in atmosphericrepresentation at these candidate sites, three othersources of atmospheric data were also analyzed:- A global Thermal Emission Spectrometer (TES) database
containing averages and standard deviations of temperature,density, and thermal wind components, averaged over 5-by-5degree latitude bins and 15 degree Ls bins, for each of threeMars years of TES nadir data
- A global set of TES limb sounding data, which can be queriedover any desired range of latitude-longitude and Ls, to estimateaverages and standard deviations of temperature and density
- Output of means and standard deviations of temperature,density, and winds from Version 4 of the European Mars ClimateDatabase (MCD)c
Characteristics of TES Nadir Database
• Three TES Mapping Years- Yr1 = 4199 - 2/01- Yr 2 - 2/01 - 1/03– Yr3 = 1/03 – 11104
• Global TES Nadir Data Set - Means and Standard Deviations fortemperature, density, and thermal wind components- 5-by-5 degree Lat-Lon bins- 15 degree Ls bins- Local Solar Time = 2 or 14 hours- Up to 21 Pressure Levels, automatically converted to Geometric Height
by Database Query Program- Queryry program gives output at TES pressure levels or interpolated to 1-km a7
intervals- Output automaticalt formatted for Mars-GRAM input as Auxiliary Profile
Characteristics of TES Limb Database Mean Density Comparisons
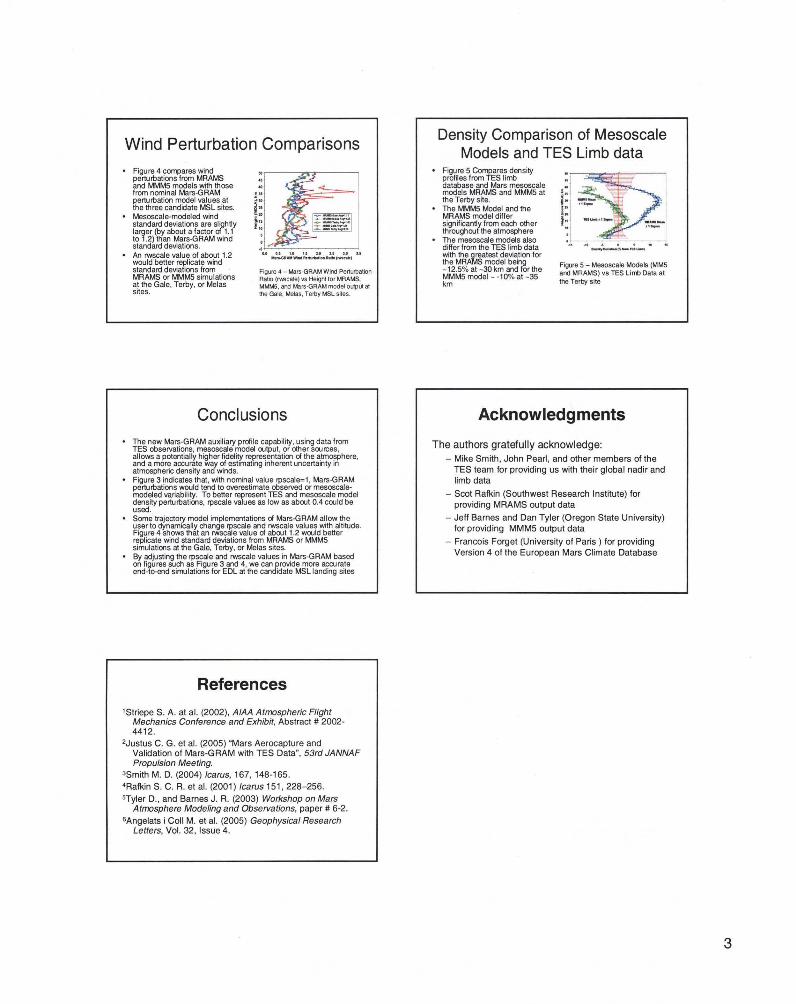
Strictly for reference purposes,density values are represented aspercentage difference from MMM5values.A significant bas difference ofabout 15% is noted between TESnadir and TES limb data, with allof the models tending to agreecloser with the limb data than thenadir results.Above - 20 km, differencesgreater than 10% are notedbetween MRAMS and MMM5results
Nadir and Limb data in Figure 1were averaged over three years ofMars observations.Mars-GRAM results are averagesfrom TES napping years 1 and 2and Map year 0 with dust visibleoptical depth tau = 0.1. all three ofwhich were quite comparable.
!!
r.v.Ir.....
i+
s
b .
. s +o ^ ^ a: a
Figure 1 – Comparison of vertical profiles ofmean densM from TES nadir data, TESlimb data, and MRAMS, MMM5. MCD, andMars-GRAM model output for the Terbylanding site
• Data for TES Mapping Years 1 and 2 and -1/2 of TES MappingYear 3
• Query Program Allows User to Select Lat-Lon, and Ls Bins andLocal True Sitar Time- Input desired Lat-Lon and select Lat-Lon Bin widths- Input desired Ls and select Ls Bin width- Choose LTST = 2 or 14 hours (or both)
• Query Program outputs all individual profiles that match criteria, plusaverage and standard deviation of temperature and density of alloutput profiles- Up to 38 Pressure levels, automatically converted to geometric altitude
Output at pressure levels, or interpolated to 1-km attitude intervals- Output automatically formatted for Mars-GRAM input as Auxiliary Profile
Zonal Wind Comparison Density Standard DeviationComparison
♦.p wmma ^ms.rt^m
f ss
^m
o a 1. a a s
Fit— 2 - Cmnyansm of +ertical oofrle5 d mean ro(eaetwaren wiW from MRAMS. MMM5. MCD. orb Ma
GRAM model MM for the Terbf I ng —
Figure 2 compares verticalprofiles of mean zonal windfrom MRAMS, MMM5, MCD,and Mars-GRAM model outputWind results from MRAMS andMMM5 are more consistentthan the density resultsbetween these two models(Figure 1)Mars-GRAM wind results forTES mapping years 1 and 2and for dust tau = 0.1 aresignificantly different from eachother and are plottedseparately in this figure
Observed and mesoscale-
modeled density standarddeviations are generally lessthan Mars-GRAM densitystandard deviations, anexception being TES nadirvalues below about 6 kmaltitude.Figure 3 indicates that, withnominal value rpscale=l,Mars-GRAM perturbationswould be conservative.To better represent TES andmesoscale model densityperturbations, rpscale valuesas low as about 0.4 could beused.
Cs
b
0a s+ a a a c
.4-M-4—
Figure 3 - Comparison of vertical profnes ofdensity standard elevator, from TES had,data, TES limb data, and MRAMS. MMM5.and Mars-GRAM model output.
2
Wind Perturbation Comparisons Density Comparison of MesoscaleModels and TES Limb data
Figure 4 compares windperturbations from MRAMSand MMM5 models with thosefrom nominal Mars-GRAMperturbation model values atthe three candidate MSL sites.Mesoscale-modeled windstandard deviations are slightlylarger (by about a factor of 1.1to 1.2) than Mars-GRAM windstandard deviations.An mscale value of about 1.2would better replicate windstandard deviations fromMRAMS or MMM5 simulationsat the Gale, Terby, or Melassites.
P>e
Mrrw.rrwY.n,we.w^a.n. ^°.t
Figure 4 — Mars-GRAM Wind PerturbationRatio (rmcale) vs Height for MRAMS,MMM5, and Mars-GRAM model output atthe Gale, Males, Terby MSL sites.
Figure 5 Compares densityprofiles from TES limbdatabase and Mars mesoscalemodels MRAMS and MMM5 atthe Terby site.The MMM5 Model and theMRAMS model differsignificantly from each otherthroughout the atmosphereThe mesoscale models alsodiffer from the TES limb datawith the greatest deviation forthe MRAMS model being-12.5 % at -30 km and forth aMMM5 model - -10% at -35km
Figure 5 - Mesoscale Models (MM5and MRAMS) vs TES Limb Data atthe Terby site
ConclusionsThe new Mars-GRAM auxiliary profile capability, using data fromTES observations, mesoscale model output, or other sources,allows a potentially higher fidelity representation of the atmosphere,and a more accurate way of estimating inherent uncertainty inatmospheric density and winds.Figure 3indicates that, with nominal value rpscale=l, Mars-GRAMperturbations would tend to overestimate observed or mesoscale-modeled variability. To better represent TES and mesoscale modeldensity perturbations, rpscale values as low as about 0.4 could beused.Some trajectory model implementations of Mars-GRAM allow theuser to dynamically change rpscale and rwscale values with altitude.Figure 4 shows that an mscale value of about 1.2 would betterreplicate wind standard deviations from MRAMS or MMM5simulations at the Gale, Terby, or Melas sites.By adjusting the rpscale and rwscale values in Mars-GRAM basedon figures such as Figure 3 and 4, we can provide more accurateend-to-end simulations for EDL at the candidate MSL landing sites
References
'Striepe S. A. at al. (2002), AIAA Atmospheric FlightMechanics Conference and Exhibit, Abstract # 2002-4412.
'Justus C. G. et al. (2005) "Mars Aerocapture andValidation of Mars-GRAM with TES Data", 53rd JANNAFPropulsion Meeting.
3 Smith M. D. (2004) Icarus, 167, 148-165.4 Rafkin S. C. R. et al. (2001) Icarus 151, 228-256.5Tyler D., and Barnes J. R. (2003) Workshop on Mars
Atmosphere Modeling and Observations, paper # 6-2.6Angelats i Coll M. et al. (2005) Geophysical Research
Letters, Vol. 32, Issue 4.
AcknowledgmentsThe authors gratefully acknowledge:
- Mike Smith, John Pearl, and other members of theTES team for providing us with their global nadir andlimb data
- Scot Rafkin (Southwest Research Institute) forproviding MRAMS output data
- Jeff Barnes and Dan Tyler (Oregon State University)for providing MMM5 output data
- Francois Forget (University of Paris ) for providingVersion 4 of the European Mars Climate Database