Embed Size (px)
Citation preview

INVESTOR PRESENTATIONJULY 2021
MARRIOTT VACATIONS WORLDWIDE I
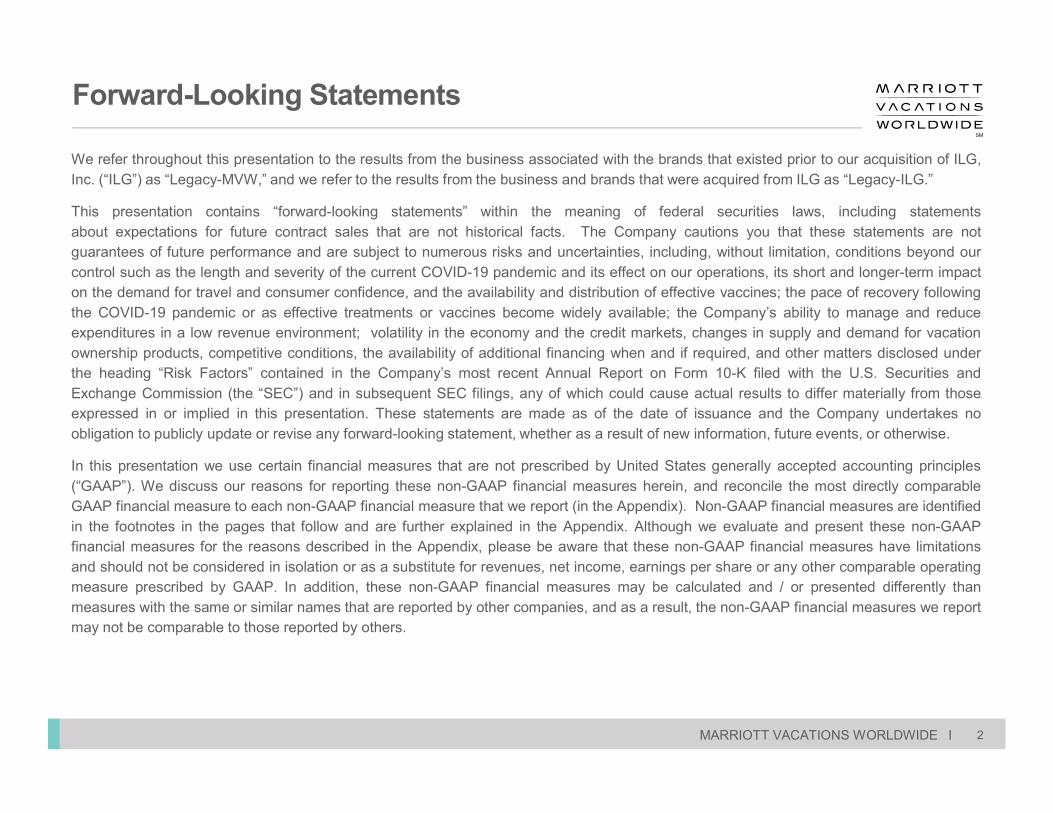
Forward-Looking Statements
We refer throughout this presentation to the results from the business associated with the brands that existed prior to our acquisition of ILG,Inc. (“ILG”) as “Legacy-MVW,” and we refer to the results from the business and brands that were acquired from ILG as “Legacy-ILG.”
This presentation contains “forward-looking statements” within the meaning of federal securities laws, including statementsabout expectations for future contract sales that are not historical facts. The Company cautions you that these statements are notguarantees of future performance and are subject to numerous risks and uncertainties, including, without limitation, conditions beyond ourcontrol such as the length and severity of the current COVID-19 pandemic and its effect on our operations, its short and longer-term impacton the demand for travel and consumer confidence, and the availability and distribution of effective vaccines; the pace of recovery followingthe COVID-19 pandemic or as effective treatments or vaccines become widely available; the Company’s ability to manage and reduceexpenditures in a low revenue environment; volatility in the economy and the credit markets, changes in supply and demand for vacationownership products, competitive conditions, the availability of additional financing when and if required, and other matters disclosed underthe heading “Risk Factors” contained in the Company’s most recent Annual Report on Form 10-K filed with the U.S. Securities andExchange Commission (the “SEC”) and in subsequent SEC filings, any of which could cause actual results to differ materially from thoseexpressed in or implied in this presentation. These statements are made as of the date of issuance and the Company undertakes noobligation to publicly update or revise any forward-looking statement, whether as a result of new information, future events, or otherwise.
In this presentation we use certain financial measures that are not prescribed by United States generally accepted accounting principles(“GAAP”). We discuss our reasons for reporting these non-GAAP financial measures herein, and reconcile the most directly comparableGAAP financial measure to each non-GAAP financial measure that we report (in the Appendix). Non-GAAP financial measures are identifiedin the footnotes in the pages that follow and are further explained in the Appendix. Although we evaluate and present these non-GAAPfinancial measures for the reasons described in the Appendix, please be aware that these non-GAAP financial measures have limitationsand should not be considered in isolation or as a substitute for revenues, net income, earnings per share or any other comparable operatingmeasure prescribed by GAAP. In addition, these non-GAAP financial measures may be calculated and / or presented differently thanmeasures with the same or similar names that are reported by other companies, and as a result, the non-GAAP financial measures we reportmay not be comparable to those reported by others.
2

MARRIOTT VACATIONS WORLDWIDE I
Vacation Ownership
7Iconic brands
Leading Provider of Vacation Experiences
120Resorts
700,000Owner families
Exchange and Third-Party Management
160Properties managed
3,200Exchange Resorts
1.7MMembers
Over NearlyServing
LeadingUpper Upscale
& Luxury Vacation
OwnershipDeveloper
Approximately
3
Nearly
Vacation Ownership Resorts and Owner Families include Welk Resorts, which are expected to be rebranded Hyatt Residence Club.

MARRIOTT VACATIONS WORLDWIDE I
A G E N D A
Powerful Business Model Driving Long-Term Growth
• Ideally Positioned For Travel Recovery
• Unique Business Model
• Long-Term Growth Strategy
4

MARRIOTT VACATIONS WORLDWIDE I
Strong liquidity position with substantial cost saving opportunities
Ideally Positioned For Travel Recovery
5
100% focused on leisure travel
Timeshare owners are avid travelers with vested interests in their vacations
Enviable owner base with large & attractive addressable market
Large square footage & in-room kitchens make properties better suited for social distancing

MARRIOTT VACATIONS WORLDWIDE I
29% 33%
18%20%
Highly Resilient Business Model
Adjusted EBITDA Contribution is based on 2019 results and is a non-GAAP measure (see Appendix for definition).
Management and Exchange
FinancingRentals
6
Vacation Ownership
Sales
Adjusted EBITDA Contribution
~Recurring
~45%of Adjusted EBITDA
Contribution fromRecurring Sources

MARRIOTT VACATIONS WORLDWIDE I
Most Contract Sales Historically Come From Guests Staying on Property
7Based on 2019 contract salesOther includes off-premise marketing channels (“OPC”), Linkage and other channels, a portion of which have been discontinued.
30%
50%
20%Other
VacationingOn-Property
Package Tours
~80%of Sales Come From On-Property Guests

MARRIOTT VACATIONS WORLDWIDE IDesert includes Palm Desert, Phoenix, and Scottsdale MARRIOTT VACATIONS WORLDWIDE I
Leisure Customers Are Traveling
8
Hawaii
64%
92%
Q1 2021 Q2 2021
Orlando
66%
86%
Q1 2021 Q2 2021
Florida Beaches
93%96%
Q1 2021 Q2 2021
South Carolina
77%
95%
Q1 2021 Q2 2021
U.S. Virgin Islands
Desert Resorts
66%88%
Q1 2021 Q2 2021
84%
94%
Q1 2021 Q2 2021
Select occupancies

MARRIOTT VACATIONS WORLDWIDE I
Contract Sales Continue to Recover
Q4 2020 to Q1 2021 exclude Welk Resorts, which was acquired on April 1, 2021. 9
178
226
362380-410
Q4 2020 Q1 2021 Q2 2021 Q3 2021E
Contract Sales($M)

MARRIOTT VACATIONS WORLDWIDE I
Bookings Are Up in Second Half 2021 Compared to Same Time in 2019
10
Owner & Preview Nights Booked
(000’s)
2,158
2,508
H2 2019 H2 2021
As of 7/6/2021 compared to the same time in 2019.Nights booked excludes Welk Resorts, which was acquired on April 1, 2021.

MARRIOTT VACATIONS WORLDWIDE I
$780M$780M
$97M$97M
• Available cash on hand(1)
• Gross notes available for securitization under warehouse facility
11
Strong Liquidity Position . . .
Nearly $1.5 Billion of Liquidity
As of June 30, 2021
$597M$597M• Additional borrowing capacity under revolving credit facility
1. Cash on hand reflects repayment of $500 million of 2026 Senior Notes in July 2021.
MARRIOTT VACATIONS WORLDWIDE I
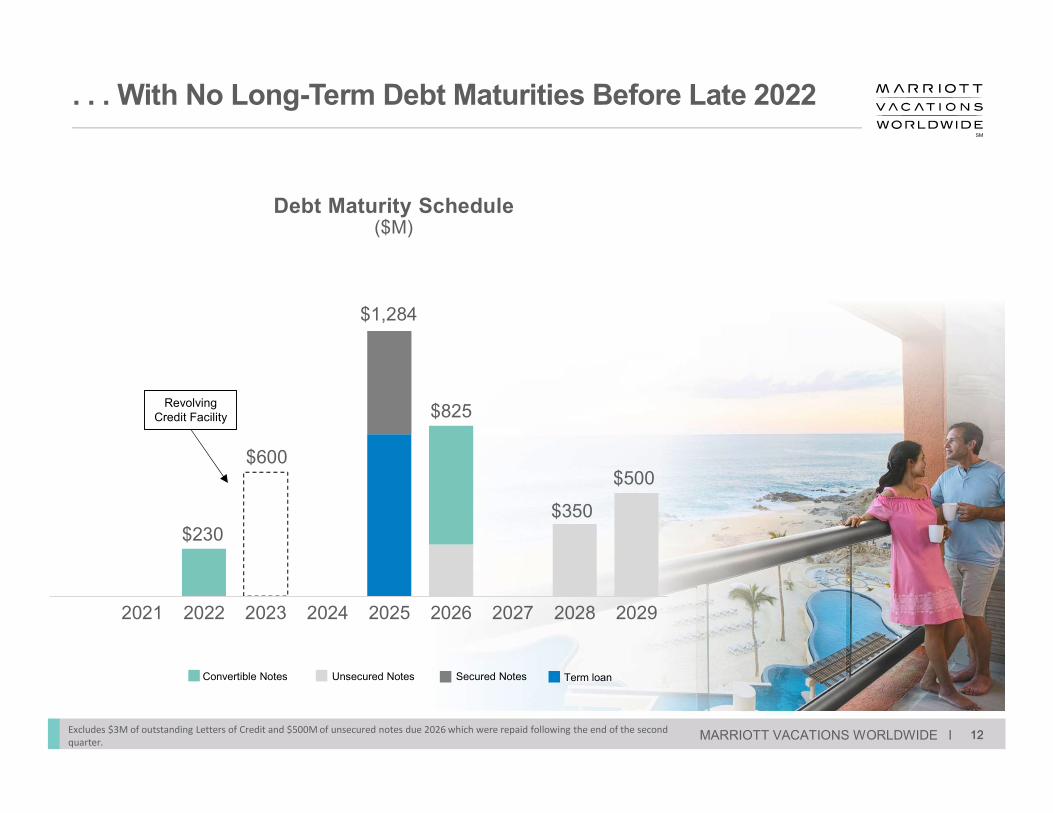
. . . With No Long-Term Debt Maturities Before Late 2022
$230
$825
$350
$500
2021 2022 2023 2024 2025 2026 2027 2028 2029
$1,284
$600
Debt Maturity Schedule ($M)
12Excludes $3M of outstanding Letters of Credit and $500M of unsecured notes due 2026 which were repaid following the end of the second quarter.
Revolving Credit Facility
12
Convertible Notes Unsecured Notes Secured Notes Term loan

MARRIOTT VACATIONS WORLDWIDE I
Targeting $200M+ Total Cost Savings
• Duplicate positions
• Public company costs
• Process alignment
• G&A / infrastructure
• Process consolidation
• Digital transformation
• Reduced applications
• IT platform optimization
• Infrastructure modernizationCOMPLETED INITIATIVES
~$150MSynergies
~$200M+Total
Savings
September 2018
June2021
13Run-rate synergies.
ADDITIONALSAVINGS
~$50M+To-Go Opportunities

MARRIOTT VACATIONS WORLDWIDE I
A G E N D A
Powerful Business Model Driving Long-Term Growth
• Ideally Positioned For Travel Recovery
• Unique Business Model
• Long-Term Growth Strategy
14

MARRIOTT VACATIONS WORLDWIDE I
We Have a Broad, Diverse Portfolio
Strengthened by the ILG Acquisition
• Sales of vacation ownership products & financing
• Management & rentals
Vacation Ownership~88% of Revenues
Exchange & Third-Party Management
~12% of Revenues
• Exchange
• Third-party management
15

MARRIOTT VACATIONS WORLDWIDE I
More Diverse, Less Capital-Intensive Model
Then Now
Weeks-based Points-based
Timeshare + Residences +
FractionalTimeshare + Exchange
Development Model
Development Model
BusinessBusiness
16
Sell the systemSales
CentersSales
CentersSite-specific
FundingFunding On balance sheet
Capital-efficient
More diverse
Less capital intensive
Perpetual sales centers
Solid free cash flow

MARRIOTT VACATIONS WORLDWIDE I
Large And Attractive Addressable Market
>35M
>$130k
~740
$1.5M
households – addressablemarket in U.S. alone
median annual income
FICO score
median net worth
17

MARRIOTT VACATIONS WORLDWIDE I
High-Margin Exchange & Third-Party Management Business Provides Strong Free Cash Flow
All numbers are based on 2019 except for Interval International members, which is based on June 30, 2021.Adjusted EBITDA Contribution is a non-GAAP measure. For definition and reconciliation see Appendix.
Capital Expenditures
$13M
Interval International Active Members
1.3MAverage Revenue per Member
$169
Key MetricsAdjusted EBITDA Contribution
18
~80%
~20%
Third-Party Management
Exchange

MARRIOTT VACATIONS WORLDWIDE I
Strong Performance Record
$719
$952
2015 2019
$393
$572
2015 2019
$1,112
$1,524
2015 2019
7%CAGR
10%CAGR
LegacyMVW Contract Sales
($M)
LegacyILG Contract Sales
($M)
CombinedContract Sales
($M)
8%CAGR
19

MARRIOTT VACATIONS WORLDWIDE I
Adjusted Free Cash Flow before Inventory and Capex
$2.6B
A Powerful Free Cash Flow Engine
$1.0BShares Repurchased
$0.2BDividends
~90% Returned to Shareholders
$0.2BCapital Expenditure
$1.0BInventory Investment
$1.4BAdjusted Free Cash Flow
MARRIOTT VACATIONS WORLDWIDE ICumulative 2015 to 2019. Free Cash Flow and Adjusted Free Cash Flow are non-GAAP measures. For definitionsplease see appendix. 20

MARRIOTT VACATIONS WORLDWIDE I
A G E N D A
Powerful Business Model Driving Long-Term Growth
• Ideally Positioned For Travel Recovery
• Unique Business Model
• Long-Term Growth Strategy
21

MARRIOTT VACATIONS WORLDWIDE I
Leveraging Strong License Relationships
As of December 31, 2020. 22
147M
112M
86M
25M
Number of Loyalty Members

MARRIOTT VACATIONS WORLDWIDE I
Driving Growth with Digital
Strengthen Our Digital Infrastructure
Grow Online Tour Packages
Enhance Customer Experiences
23

MARRIOTT VACATIONS WORLDWIDE IMARRIOTT VACATIONS WORLDWIDE I
Acquired Brands Underrepresented in Major Markets
• Las Vegas, NV
• Orlando, FL
• Maui, HI
• Waikiki, HI
• Big Island, HI
• Urban
• Key West, FL
• Aruba
• Cancun, Mexico
• Los Cabos, Mexico
• Asia Pacific
24Hyatt Residence Club includes Sirena del Mar by Welk Resorts, which is expected to be rebranded.

MARRIOTT VACATIONS WORLDWIDE I
Increasing Sales to Younger
GenerationsGrowing New
Owners
New OwnerGrowth
Millennial& GenX
Not Disclosed
Boomers
33%
57%
10%
25
~95kfirst-time buyers
added since 2016!!
Focus on New Owners and Younger Generations
Based on 2019 contract sales.

MARRIOTT VACATIONS WORLDWIDE I
Adding New Owners to the System Grows Revenue
Initial VacationOwnership Purchase
Additional Purchase
Development Revenue
Financing Revenue
Financing Revenue Management
Fees, Ancillary, Rental, Other
Total Revenue First Five Years
Other
Development Revenue
Average Revenue Contribution of Initial PurchasesThrough First Five Years
26

MARRIOTT VACATIONS WORLDWIDE I
Grow Exchange & Third-Party Management Business
Increase share of wallet with
enhanced product offerings
Grow affiliations& management
contracts
Expanddistribution
channels
27

MARRIOTT VACATIONS WORLDWIDE I
Capturing Revenue Synergies From ILG Acquisition
Best PracticesBest Practices Sales ExcellenceSales Excellence
Hotel Marketing Locations
CallTransfer
28
Volume per Guest (VPG)

MARRIOTT VACATIONS WORLDWIDE I
Acquisition of Welk Resorts Provides Long-term Growth and Margin Improvement
29
Plan to rebrand Welk to Hyatt
Residence Club
Plan to rebrand Welk to Hyatt
Residence Club
• Will expand number of Hyatt Residence Club keys by 90%
• More than double number of Owners to ~80k
• 3+ years of built inventory
Increase development
profit
Increase development
profit
• Replace high-cost marketing & sales channels
• Leverage branded marketing channels
• Introduce MVW’s sales training
Improve rental profit
Improve rental profit
• Leverage more efficient Hyatt distribution channels
Capture cost synergies
Capture cost synergies
• Leverage existing infrastructure to eliminate redundancies and deliver cost savings
• Opportunity to drive exchange savings through Interval International
Welk 2019 financials.
$123$150 - $160
2019A 2023/4E
Contract sales ($M)
2%
20% - 25%
2019A 2023/4E
Development profit (%)
$29
$60 - $70
2019A 2023/4E
Adjusted EBITDA ($M)

MARRIOTT VACATIONS WORLDWIDE I
Linking All Marriott-Branded Vacation Ownership Resorts
Today
Target
FutureProduct Form
MARRIOTT VACATIONS WORLDWIDE I 30

MARRIOTT VACATIONS WORLDWIDE I
Strong liquidity position with substantial cost saving opportunities
I N S U M M A R Y
Well Positioned For Travel Recovery
31
100% focused on leisure travel
Timeshare owners are avid travelers with vested interests in their vacations
Enviable owner base with large & attractive addressable market
Large square footage & in-room kitchens make properties better suited for social distancing

MARRIOTT VACATIONS WORLDWIDE I
APPENDIX
A-1

MARRIOTT VACATIONS WORLDWIDE I
A-33
In our presentation we report certain financial measures that are not prescribed by United States generally accepted accounting principles ("GAAP"). We discuss below our reasons for reporting
these non-GAAP financial measures, and we’ve made footnote references to them on the preceding pages. Although we evaluate and present these non-GAAP financial measures for the reasons
described below, please be aware that these non-GAAP financial measures have limitations and should not be considered in isolation or as a substitute for revenues, net income or any other
comparable operating measure prescribed by GAAP. In addition, these non-GAAP financial measures may be calculated and / or presented differently than measures with the same or similar
names that are reported by other companies, and as a result, the non-GAAP financial measures we report may not be comparable to those reported by others.
We evaluate non-GAAP financial measures, including Adjusted EBITDA and Adjusted Free Cash Flow, that exclude certain items such as cost reimbursements, acquisition related, organizational
and separation related, litigation, and other charges, because these non-GAAP financial measures allow for period-over-period comparisons of our on-going core operations before the impact of
these items. These non-GAAP financial measures also facilitate our comparison of results from our on-going core operations before these items with results from other vacation ownership
companies.
Adjusted Earnings Before Interest Expense, Taxes, Depreciation and Amortization (“Adjusted EBITDA”). We define Adjusted EBITDA as earnings, or net income or loss attributable to
common shareholders, before interest expense (excluding consumer financing interest expense associated with term loan securitization transactions), income taxes, depreciation and amortization.
Adjusted EBITDA reflects additional adjustments for certain items, as itemized in the discussion of Adjusted EBITDA in the Company’s most recent Annual Report on Form 10-K filed with the U.S.
Securities and Exchange Commission (the “SEC”) and in subsequent SEC filings, and excludes share-based compensation expense to address considerable variability among companies in
recording compensation expense because companies use share-based payment awards differently, both in the type and quantity of awards granted. For purposes of our EBITDA and Adjusted
EBITDA calculations, we do not adjust for consumer financing interest expense associated with term loan securitization transactions because we consider it to be an operating expense of our
business. We consider Adjusted EBITDA to be an indicator of operating performance, which we use to measure our ability to service debt, fund capital expenditures and expand our business. We
also use Adjusted EBITDA, as do analysts, lenders, investors and others, because this measure excludes certain items that can vary widely across different industries or among companies within the
same industry. For example, interest expense can be dependent on a company’s capital structure, debt levels and credit ratings. Accordingly, the impact of interest expense on earnings can vary
significantly among companies. The tax positions of companies can also vary because of their differing abilities to take advantage of tax benefits and because of the tax policies of the jurisdictions in
which they operate. As a result, effective tax rates and provision for income taxes can vary considerably among companies. EBITDA and Adjusted EBITDA also exclude depreciation and
amortization because companies utilize productive assets of different ages and use different methods of both acquiring and depreciating productive assets. These differences can result in
considerable variability in the relative costs of productive assets and the depreciation and amortization expense among companies. We believe Adjusted EBITDA is useful as an indicator of operating
performance because it allows for period-over-period comparisons of our on-going core operations before the impact of the excluded items. Adjusted EBITDA also facilitates comparison by us,
analysts, investors, and others, of results from our on-going core operations before the impact of these items with results from other vacation companies.
Free Cash Flow, Adjusted Free Cash Flow and Total Cash Flow. We evaluate Free Cash Flow as a liquidity measure that provides useful information to management and investors about the
amount of cash provided by operating activities after capital expenditures for property and equipment (excluding inventory) and the borrowing and repayment activity related to our securitizations,
which cash can be used for strategic opportunities, including acquisitions and strengthening the balance sheet. Adjusted Free Cash Flow and Total Cash Flow, which reflects additional adjustments
to Free Cash Flow for the impact of borrowings available from the securitization of eligible vacation ownership notes receivable, acquisition and restructuring charges, and changes in restricted cash,
allows for period-over-period comparisons of the cash generated by our business before the impact of these items. Analysis of Free Cash flow and Total Cash Flow also facilities management’s
comparison of our results with our competitors’ results.
Non-GAAP Financial Measures
A-2

MARRIOTT VACATIONS WORLDWIDE I
A-34
Revenues Excluding Cost Reimbursements. Cost reimbursements revenue includes direct and indirect costs that property owners' associations and joint ventures we participate in reimburse to us,
and relates, predominantly, to payroll costs where we are the employer. As we record cost reimbursements based upon costs incurred with no added markup, this revenue and related expense has no
impact on net income attributable to us because cost reimbursements revenue net of reimbursed costs expense is zero. We consider revenues excluding cost reimbursements to be a meaningful
metric as it represents that portion of revenue that impacts net income attributable to us.
Adjusted EBITDA Profit. We calculate Adjusted EBITDA Profit by dividing segment or total company Adjusted EBITDA, where applicable, by segment or total company revenues excluding cost
reimbursements, where applicable. We consider Adjusted EBITDA Profit to be an indicator of operating performance for our segments and total company, and believe it provides useful information to
investors, because it demonstrates the diversity of our business model and provides perspective regarding how much of our total Adjusted EBITDA Profit comes from each segment and the total
company.
Adjusted EBITDA Contribution. We calculate Adjusted EBITDA Contribution by adding up the results of operations from our Development, Resort management / Management and exchange, Rental
and Financing businesses, excluding allocations for general and administrative costs, royalty fees, and add backs for share-based compensation and depreciation, and then dividing that result by each
business’ results of operations, as reconciled herein. We consider Adjusted EBITDA Contribution to be an indicator of operating performance for our collective and separate businesses, and believe it
provides useful information to investors, because it demonstrates the diversity of our business model and provides perspective regarding how much of our total Adjusted EBITDA comes from each of
our businesses.
.
A-3
Non-GAAP Financial Measures
The company now refers to Development Margin as Development profit. While the calculation remains unchanged, the company believes the revised term better depicts the financial results being presented
2019 Adjusted Adjusted EBITDA Margin**
($'s in millions) EBITDA Margin** Contribution(1)
Development margin 310$ 29%
Management and exchange margin 348 33%
Rental margin 216 20%
Financing margin 185 18%
Total adjusted EBITDA margin 1,058$ 100%
(1) Represents the contribution toward Adjusted EBITDA.
VO and Exchange % Vacation % Exchange andExchange & Vacation Corporate and 2019 & Third Party Ownership Third Party
(In millions) Third Party Ownership Other Total Adjusted Revenues RevenuesRevenues
Sale of vacation ownership products -$ 1,354$ -$ 1,354$ 1,354$ Management and exchange 298 488 163 949 787Rental 61 512 - 573 573Financing 4 271 - 275 275Cost reimbursements 91 1,136 (119) 1,108 1,227
Total revenues 454 3,762 44 4,260 4,216Less: cost reimbursements (91) (1,136) 119 (1,108) (1,227)
Total revenues excluding cost reimbursements 364 2,625 163 3,152 2,989 88% 12%

MARRIOTT VACATIONS WORLDWIDE I
A-35
Cumulative Adjusted Free Cash Flow – 2015 through 2019
A-4Adjusted Free Cash Flow is a non-GAAP measure. For definition, please see A-2.
($'s in millions) 2015 2016 2017 2018 2019 Cumulative
Net cash provided by operating activities 109$ 141$ 142$ 97$ 382$ 871$ Capital expenditures for property and equipment (excluding inventory):
Other (36) (35) (26) (40) (46) (183)
Investment in operating portion of Surfers Paradise hotel that will be sold 1
(47) - - - - (47) Change in restricted cash 37 5 - - - 42 Borrowings from securitization transactions 255 377 400 539 1,026 2,597 Repayment of debt related to securitizations (278) (323) (293) (382) (880) (2,156)
Free cash flow 40 165 223 214 482 1,124 Adjustments:
ILG acquisition-related costs - - - 162 81 243
Litigation charges - - - 18 22 40 Inventory / other payments associated with capital efficient inventory arrangements - - - (33) (27) (60) Net insurance proceeds from business interruption claims - - - (57) (41) (98) Borrowings from non-traditional securitization transaction - - - - (59) (59) Organizational and separation-related, litigation and other charges 8 - - - - 8
Proceeds from sale of operating portion of Surfers Paradise hotel 1
47 - - - - 47
Accelerated payment of liability for Marriott Rewards customer loyalty program 2
66 - - - - 66
Other3
- - - 6 (21) (15) 68 (5) 45 (31) 58 135
Change in restricted cash - - (15) (14) (31) (60) Adjusted free cash flow 229$ 160$ 253$ 265$ 464$ 1,371$
4 Represents the net change in borrowings available from the securitizat ion of eligible vacation ownership notes receivable between year ends.
3 2018 - primarily an adjustment to exclude losses result ing from fraudulently induced electronic wire payment disbursements made to third parties; 2019 - primarily $21 million to exclude prior year Legacy-ILG net tax refunds and $2 million recovery of a port ion of the fraudulently induced electronic payment disbursements made in 2018, offset part ially by $2 million of integration related IT costs.
Borrowings available from the securitization of eligible vacation ownership notes
receivable4
NOTE: Beginning in fiscal year 2017, we now present the change in restricted cash as an adjustment to free cash flow, rather than including the change in restricted cash in free cash flow, but have not restated prior year presentat ion for this change.
1 Represents the estimated investment in, as well as the proceeds from the subsequent sale of, the operating portion of the Surfers Paradise hotel.
2 Represents the port ion of the Q1 2016 liability for Marriott Rewards customer loyalty program payment that was accelerated into Q4 2015.