Embed Size (px)
Citation preview

CONNECTING THE FUTURE
TurbOprOp markETfOrECasT 2016-2035
atrbroadcast atraircraft atraircraft atr atrchina
2 3
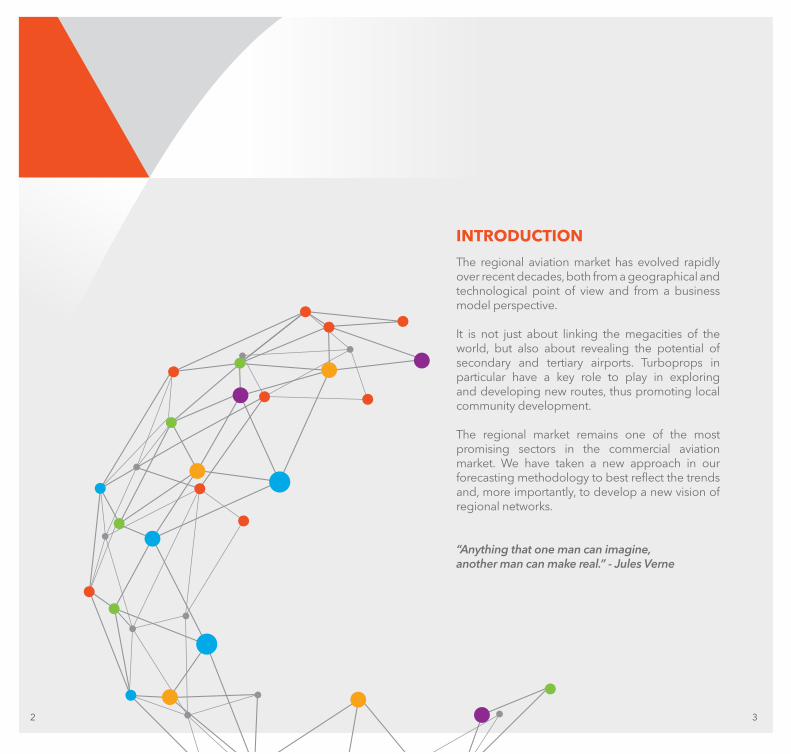
INTrODuCTION
The regional aviation market has evolved rapidly over recent decades, both from a geographical and technological point of view and from a business model perspective.
It is not just about linking the megacities of the world, but also about revealing the potential of secondary and tertiary airports. Turboprops in particular have a key role to play in exploring and developing new routes, thus promoting local community development.
The regional market remains one of the most promising sectors in the commercial aviation market. We have taken a new approach in our forecasting methodology to best reflect the trends and, more importantly, to develop a new vision of regional networks.
“Anything that one man can imagine,another man can make real.” - Jules Verne

5
EXECUTIVE SUMMARY ........................................................... P.06
REGIONAL TRAVEL TRENDS .................................................. P.14
ENVISIONING TOMORROW’S LANDSCAPE ....................... P.20
FOCUS ON REGIONS .............................................................. P.26
AFRICA & MIDDLE EAST .......................................................... P.28
ASIA PACIFIC ............................................................................. P.30
CHINA ........................................................................................ P.32
EUROPE & CIS ........................................................................... P.34
LATIN AMERICA & CARIBBEAN .............................................. P.36
NORTH AMERICA ..................................................................... P.38
FREIGHTER DEMAND ............................................................ P.40
SAFE HARBOUR STATEMENT ............................................... P.42
TabLE Of CONTENTs
4 5
ASSUMPTIONS
The following assumptions and definitions apply unless otherwise specified:
•ASK : Available Seat Kilometer – seats multiplied by distance.
• Mature markets: North America, Western Europe, Japan, South Korea, Australia, Singapore, Chinese Taipei, Hong Kong, New Zealand, South Africa.
• Turboprop in-service fleet are considered in the range of 20-80 seats in standard configuration. Those include aircraft currently in-production and launched programs.
•Network range up to 900 NM ~ 1,700 km ~1,000 mi.
•Route size considered: up to 300 daily seats each way per carrier.
•Traffic allocation to all types of existing aircraft categories from 20 to 200 seats, jet and turboprop technologies.

6 7
ExECuTIvE summary

8 9
2006 2008 2010 2012 2014 2016 2018 2020 2022 2024 2026 2028 2030 2032 2034 2036
ACTUAL FORECAST
+3
.9%
TR
AFF
IC
avEraGE aNNuaL TraffIC GrOWTH
ExECUTIvE SUMMARy
TraffIC GrOWTH
+3
.0%
GD
P
+3.9%
DEL
IvER
IES
IN S
ERv
ICE
GROWTH
REPLACEMENT
STAY IN SERVICE
+86%FLEET IN SERvICE
3,900
2016 2035
TurbOprOp DEmaNDExECUTIvE SUMMARy
TurbOprOp fLEET EvOLuTION aND DELIvErIEsIn-service passenger fleet
2,800
2,100
1,80065%
35%1,000
1,100
Fleet growth is envisioned to account for 65% of turboprop deliveries in the next 20 years. Half of this growth is driven by the creation of new routes as part of airlines network development strategy. The other half relates to the expanded usage of the turboprop technology in pre-existing markets.
10 11
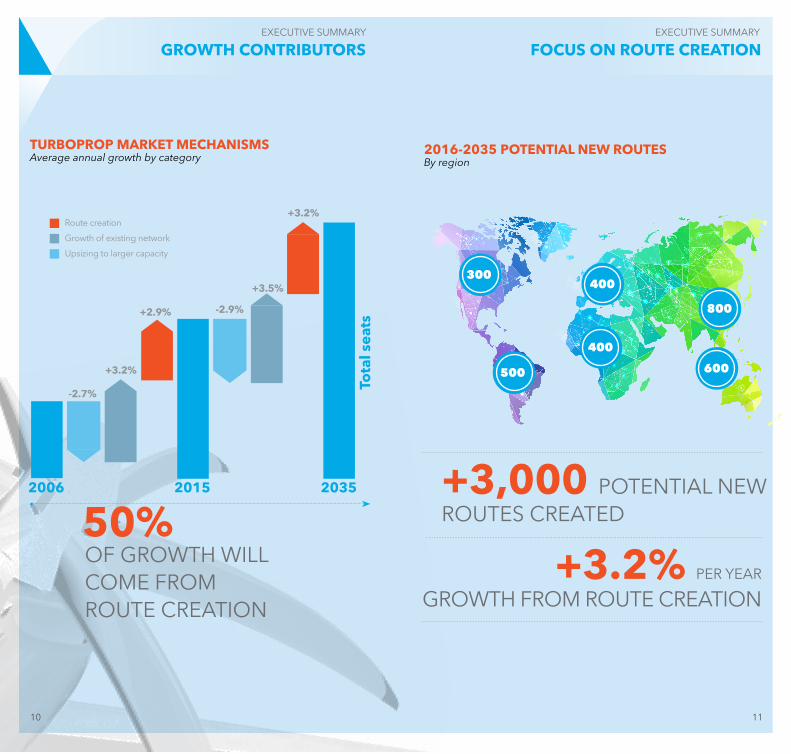
+3,000 POTENTIAL NEW ROUTES CREATED
+3.2% PER yEAR
GROWTH FROM ROUTE CREATION
300
400
800
600
400
500
fOCus ON rOuTE CrEaTION ExECUTIvE SUMMARy
2016-2035 pOTENTIaL NEW rOuTEs By region
ExECUTIvE SUMMARy
GrOWTH CONTrIbuTOrs
50%
TurbOprOp markET mECHaNIsmsAverage annual growth by category
Tota
l sea
ts
OF GROWTH WILL COME FROM ROUTE CREATION
Route creation
Growth of existing network
Upsizing to larger capacity
2006 2015
-2.7%
+3.2%
+2.9% -2.9%
+3.5%
+3.2%
2035
750
600450
400
300
300
AFRICA & MIDDLE EASTNORTH AMERICA
LATIN AMERICA & CARIBBEAN
EUROPE & CIS
ASIA PACIFICexcl. CHINA
CHINA
12 13
ExECUTIvE SUMMARy
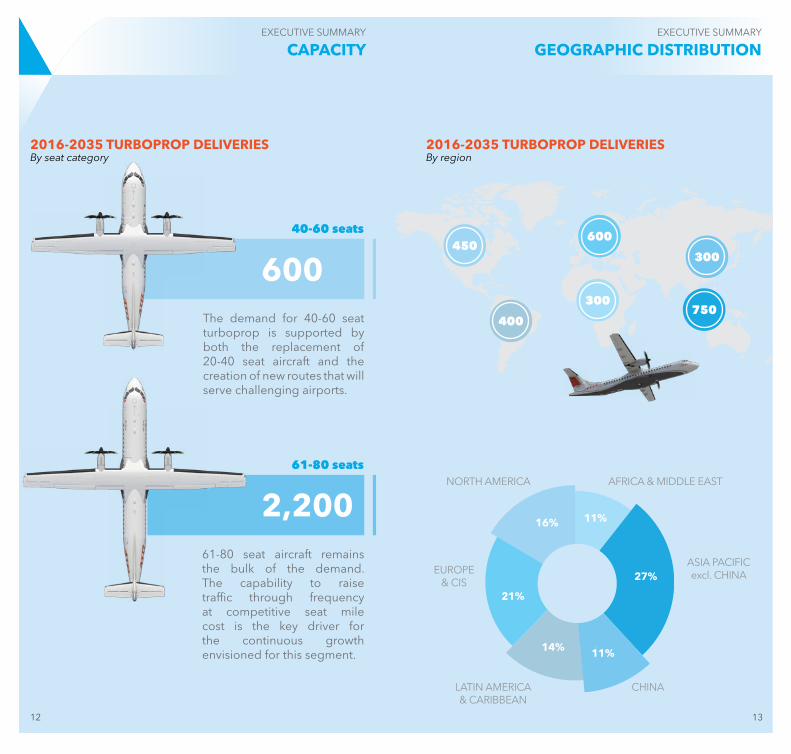
GEOGrapHIC DIsTrIbuTION
2016-2035 TurbOprOp DELIvErIEs By region
61-80 seats
2,200
40-60 seats
600
ExECUTIvE SUMMARy
CapaCITy
2016-2035 TurbOprOp DELIvErIEs By seat category
21%
16% 11%
14%
27%
11%
The demand for 40-60 seat turboprop is supported by both the replacement of 20-40 seat aircraft and the creation of new routes that will serve challenging airports.
61-80 seat aircraft remains the bulk of the demand. The capability to raise traffic through frequency at competitive seat mile cost is the key driver for the continuous growth envisioned for this segment.
14 15
rEGIONaL TravEL TrENDs

2006 2008 2010 2012 2014 2016 2018 2020 2022 2024 2026 2028 2030 2032 2034 2036
17
REGIONAL TRAvEL TRENDS
EmErGING ECONOmIEs DrIvE GrOWTH
REGIONAL TRAvEL TRENDS
maNy pEOpLE TO CONNECT
POPULATION
Early stage
Developing
Intermediate
Mature
Network development stageRoutes/M.km /M.hab2
rEGIONaL TraffIC DEmaND
+0.6%
+4.6%
EmErGING
maTurE
The quality of regional network is essential to balance economic growth.
There is a strong potential for the most populated countries to enhance their regional network and link the most remote communities.
Emerging markets’ demand has overtaken the mature markets’ capacity since 2011 in the regional sector.
The demand in emerging countries is expected to grow eight times faster than that of mature economies.
16
NETWOrk DEvELOpmENT by COuNTry
UP TO +5%
UP TO +6%
UP TO +8%
+10%FLIGHTS
REGIONAL GDP
TOURISTS
GENERATE
MORE SOCIAL DEVELOPMENT
MOREEMPLOYMENTFOREIGN DIRECT
INVESTMENT
18 19
REGIONAL TRAvEL TRENDS
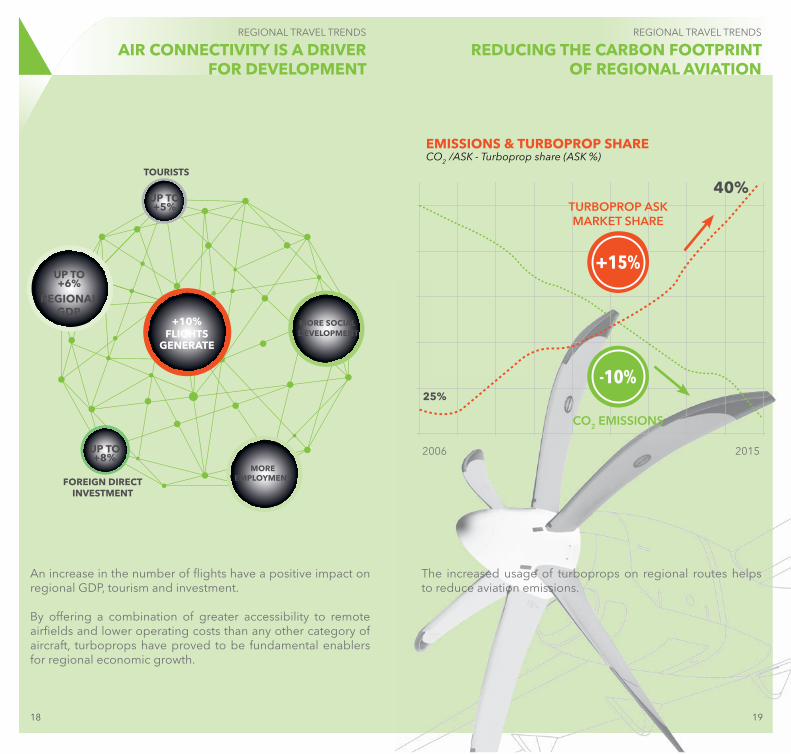
aIr CONNECTIvITy Is a DrIvEr fOr DEvELOpmENT
2006 2015
REGIONAL TRAvEL TRENDS
rEDuCING THE CarbON fOOTprINT Of rEGIONaL avIaTION
EmIssIONs & TurbOprOp sHarE CO2 /ASK - Turboprop share (ASK %)
-10%
+15%
25%
40%
The increased usage of turboprops on regional routes helps to reduce aviation emissions.
CO2 EMISSIONS
TURBOPROP ASK MARKET SHARE
An increase in the number of flights have a positive impact on regional GDP, tourism and investment.
By offering a combination of greater accessibility to remote airfields and lower operating costs than any other category of aircraft, turboprops have proved to be fundamental enablers for regional economic growth.

20 21
ENvIsIONING TOmOrrOW’s LaNDsCapE
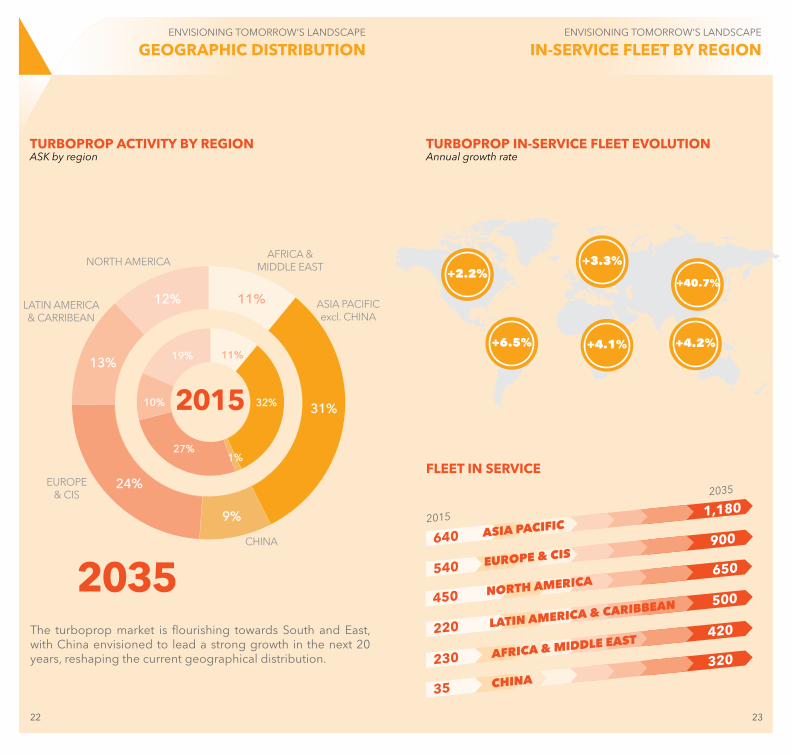
TurbOprOp aCTIvITy by rEGION ASK by region
2035
TurbOprOp IN-sErvICE fLEET EvOLuTION Annual growth rate
+3.3%
+4.1%
+2.2%
+6.5%
+40.7%
+4.2%
11%
31%
9%
24%
13%
12%
11%
32%
1% 27%
10%
19%
AFRICA & MIDDLE EASTNORTH AMERICA
LATIN AMERICA & CARRIBEAN
EUROPE & CIS
ASIA PACIFICexcl. CHINA
CHINA
2015
22 23
ENvISIONING TOMORROW’S LANDSCAPE
GEOGrapHIC DIsTrIbuTIONENvISIONING TOMORROW’S LANDSCAPE
IN-sErvICE fLEET by rEGION
2035
2015
500
LATIN AmerIcA & cArIbbeAN
220
650
NOrTH AmerIcA450
420
AfrIcA & mIDDLe eAST
230 320
cHINA35
900
1,180
ASIA PAcIfIc
eurOPe & cIS540
640
fLEET IN sErvICE
The turboprop market is flourishing towards South and East, with China envisioned to lead a strong growth in the next 20 years, reshaping the current geographical distribution.

ENvISIONING TOMORROW’S LANDSCAPE
50 100
150
200
250
300
350
400
450
500
550
600
650
700
750
800
850
900
950
1000
0
50%
100%
REGIONAL JETS
TURBOPROPS
2016 @ $1.5/USGal
2011 @ $3.3/USGal
2006 @ $2.3/USGal
2006
2015
2006
2015
2006
2015
2006
2015
2006
2015
0.01
0.1
1
2006 250 Nm
260 Nm
300 Nm
2011
2016
25
prOpELLEr Or faN: a maTTEr Of DIsTaNCE
Regardless of the fuel price, turboprops have extended their operational scope over jets, proving to be the preferred airline choice for short haul operations.
Growth in regional seats per capita is correlated with country’s wealth. As GDP per capita increases, the prospective for regional aviation drastically improves, especially when countries adopt regional air connectivity to accelerate economic growth.
sHarE Of fLIGHTs By distance (NM)
TurbOprOp OpEraTIONs prEfErrED up TO:
WEaLTH & aIr TraNspOrT DEvELOpmENT
ENvISIONING TOMORROW’S LANDSCAPE
rEGIONaL aIr TraNspOrT DEvELOpmENT
24 25
REGIONAL SEATS/CAPITA
GDP/CAPITA
Note: Focus on turboprops and regional jets from 40 to 80 seats in order to avoid capacity-driven choice.

26 27
fOCus ON rEGIONs

AvERAGE ANNUAL FLEET GROWTH
4.1%
34%
30%
300DELIvErIEs
TP75
TP50
400NEW rOuTEs
60240
Route creation
Replacement
Growth of existing network
36%
28 29
AIRCRAFT DELIvERy FORECAST
afrICa & mIDDLE EasT

AvERAGE ANNUAL FLEET GROWTH
4.2%
27%30%
43%
750DELIvErIEs
600NEW rOuTEs
Route creation
Replacement
Growth of existing network
TP75
TP50120
630
30 31
AIRCRAFT DELIvERy FORECAST
asIa paCIfIC(ExCLUDING CHINA)
AvERAGE ANNUAL FLEET GROWTH
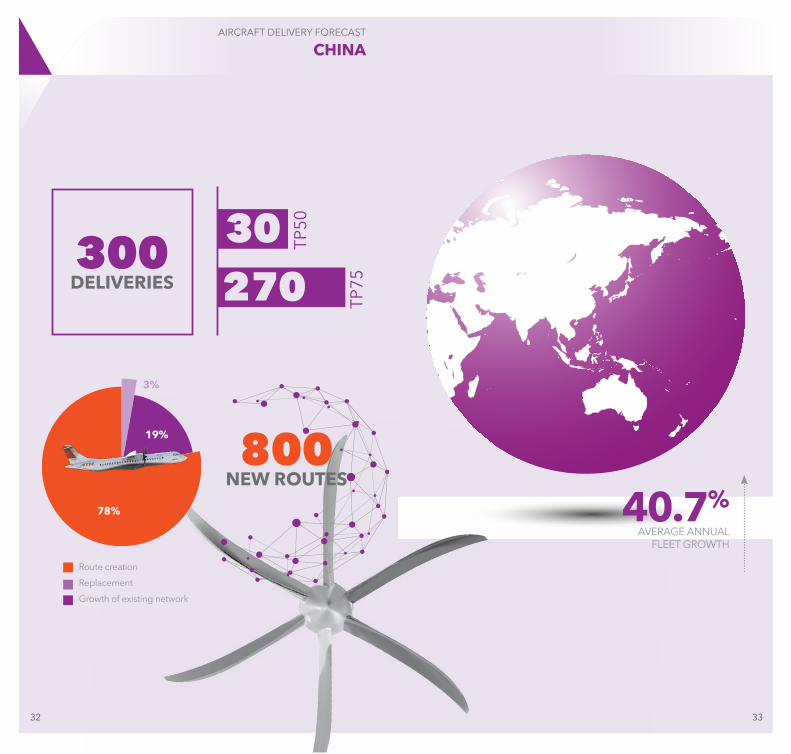
40.7%
3%
19%
78%
300DELIvErIEs
800NEW rOuTEs
TP75
TP5030
270
Route creation
Replacement
Growth of existing network
32 33
AIRCRAFT DELIvERy FORECAST
CHINa

AvERAGE ANNUAL FLEET GROWTH
3.3%
20%
40%
41%
600DELIvErIEs
400NEW rOuTEs
TP75
TP50110
490
Route creation
Replacement
Growth of existing network
34 35
AIRCRAFT DELIvERy FORECAST
EurOpE & CIs
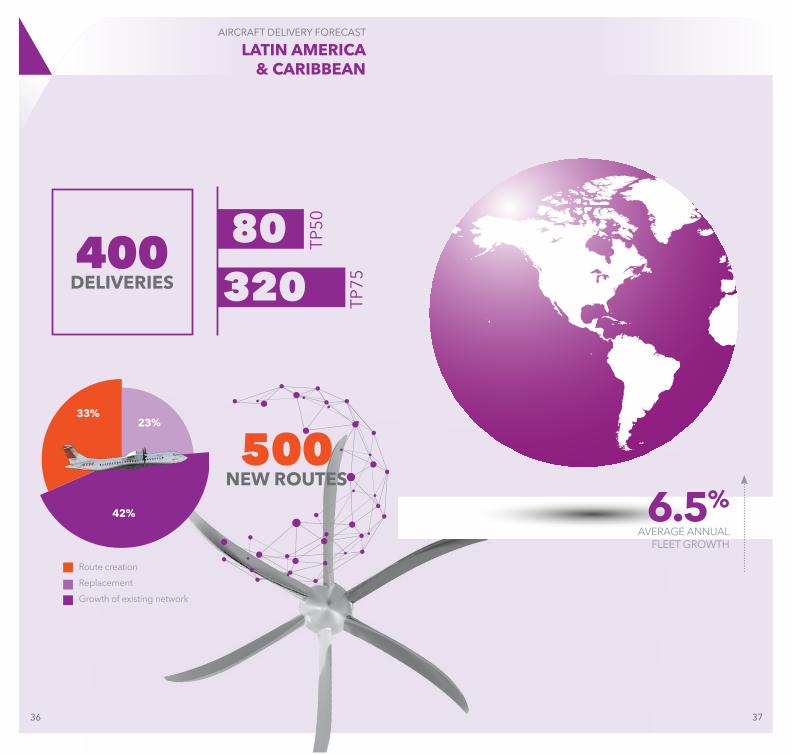
AvERAGE ANNUAL FLEET GROWTH
6.5%
33%23%
42%
400DELIvErIEs
500NEW rOuTEs
TP75
TP5080
320
Route creation
Replacement
Growth of existing network
36 37
AIRCRAFT DELIvERy FORECAST
LaTIN amErICa& CarIbbEaN
215Tp 70
DELIvErIEs
AvERAGE ANNUAL FLEET GROWTH
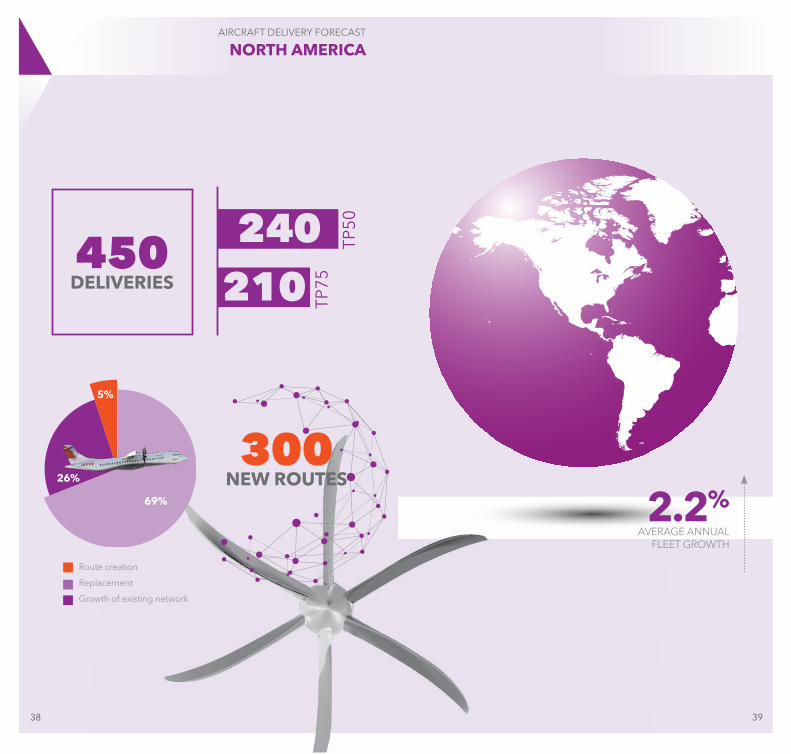
2.2%
38 39
AIRCRAFT DELIvERy FORECAST
NOrTH amErICa
450DELIvErIEs
TP50
TP75
300NEW rOuTEs
240210
5%
69%
26%
Route creation
Replacement
Growth of existing network

40 41
frEIGHTEr DEmaNDFREIGHTER MARKET
TurbOprOp frEIGHTEr fLEET EvOLuTION
CO
Nv
ERSI
ON
IN S
ERv
ICE
+35%FLEET IN SERvICE
460
2016 2035
420
340
120
300
40
More than 400 turboprop freighters are expected to be operated by 2035. The demand for these platforms increases with the adoption of e-commerce technology around the world, and the requirement of express service deliveries.In the next 20 years, the rise in demand of cargo services will be triggered by emerging economies. The current freighter fleet is 27 years old on average and requires prompt replacement in different forms: cargo-pax flexible variants and full freighter conversions.
Note: Freighter aircraft – excluding Eastern built – from 3t to 9t payload.
STAY IN SERVICE
GROWTH
REPLACEMENT
29%
71%

42 43
• The successful execution of internalperformance plans, including cost reduction and productivity efforts;• Product performance risks, as well asprogramme development and management risks;• Customer, supplier and subcontractorperformance or contract negotiations, including financing issues;• Competition and consolidation in theaerospace and defence industry;• Significant collective bargaining, labourdisputes;•Theoutcomeofpoliticalandlegalprocesses,including the availability of government financing for certain programmes and the size of defence and space procurement budgets;• Research and development costs inconnection with new products;• Legal, financial and governmental risksrelated to international transactions;• Legal and investigatory proceedings andother economic, political and technological risks and uncertainties.
Any forward-looking statement contained in this presentation/publication speaks as of the date of this presentation/publication release. ATR undertakes no obligation to publicly revise or update any forward-looking statements in light of new information,
safE HarbOur sTaTEmENT
DisclaimerThis presentation includes forward-looking statements. Words such as anticipates, believes, estimates, expects, intends, plans, projects, may, forecast and similar expressions are used to identify these forward-looking statements. Examples of forward-looking statements include statements made about strategy, rampup and delivery schedules, introduction of new products and services and market expectations, as well as statements regarding future performance and outlook.By their nature, forward-looking statements involve risk and uncertainty because they relate to future events and circumstances and there are many factors that could cause actual results and developments to differ materially from those expressed or implied by these forward-looking statements.
These factors include but are not limited to:• Changes in general economic, politicalor market conditions, including the cyclical nature of ATR business;•Significantdisruptionsinairtravel(includingas a result of terrorist attacks);• Currency exchange rate fluctuations, inparticular between the Euro and the U.S. dollar;

© A
TR. 2
016.
All
rig
hts
rese
rved
. Pro
pri
etar
y d
ocu
men
t of A
TR. T
his
do
cum
ent s
hall
not b
e re
pro
duc
ed o
r d
iscl
ose
d to
a th
ird p
arty
with
out
the
wri
tten
co
nsen
t of A
TR. T
his
do
cum
ent a
nd it
s co
nten
t sha
ll no
t be
used
for
any
pur
po
se o
ther
than
that
for
whi
ch it
is s
upp
lied
. ATR
, its
log
o, t
he d
istin
ctiv
e A
TR a
ircra
ft p
rofil
es a
nd p
aten
ted
info
rmat
ion
rela
ting
to th
e A
TR a
ircra
ft a
re th
e ex
clus
ive
pro
per
ty o
f ATR
and
are
sub
ject
to
co
pyr
ight
. Thi
s d
ocu
men
t and
all
info
rmat
ion
cont
aine
d h
erei
n ar
e th
e so
le p
rop
erty
of A
TR. N
o in
telle
ctua
l pro
per
ty r
ight
is g
rant
ed th
roug
h, o
r in
duc
ed b
y, th
e d
eliv
ery
of t
his
do
cum
ent o
r th
e d
iscl
osu
re o
f its
co
nten
t. Th
e st
atem
ents
mad
e he
rein
do
no
t co
nstit
ute
an o
ffer
or
a re
pre
sent
atio
n. T
hey
are
bas
ed o
n th
e m
entio
ned
ass
ump
tions
and
are
exp
ress
ed in
go
od
faith
.
aTr1, allée Pierre Nadot31712 Blagnac cedex - FranceT: +33 (0)5 62 21 62 21f: +33 (0)5 62 21 68 00
atrbroadcast atraircraft atraircraft atr atrchina