Embed Size (px)
Citation preview

MobileMarkets
& Trends
2007Facts &Figures
Consulting & Research
Sponsored by


Telecom Services &
Mobile Trends
3GEconomics
Mobile Equipment Dynamics
MobileHot Topics


Introduction

Mobile 2007 6
Introduction
With total revenues estimated at 616 billion USD in 2006, mo-bile services have generated the bulk of the increase in the telecom services market.
Growth in the mobile sector comes from enlargement of the customer base. Hav-ing passed the 2 billion mark in 2005, the number of mobile customers throughout the world reached 2.6 billion by the end of 2006. At the same time, however, the ARPU has declined (down 10% in 2005 and 2006).
In Western Europe, cuts in the rates for fixed-to-mobile call termination charges have largely contributed to the fall, but are not the sole explanation. The increasing numbers of cut-price services being offered by MVNOs in Northern Europe, the arrival of
“3G” in several markets, and growing com-petition in general have had a heavy impact on tariff rates. Although most operators have rolled out 3G services, migration towards these services has been relatively slow (9% of mobile customers possessed a 3G hand-set in mid-2006) and is not having much of an impact on operators’ revenues.
The year 2006 was marked by a certain number of achievements:
Significant 3G take-off, with 100 million UMTS customers worldwide at the end of the year
First commercial HSDPA mobile broadband
Introduction of Fixed-Mobile convergence offers in Europe
•
•
•
Mobile 2007 7
Introduction
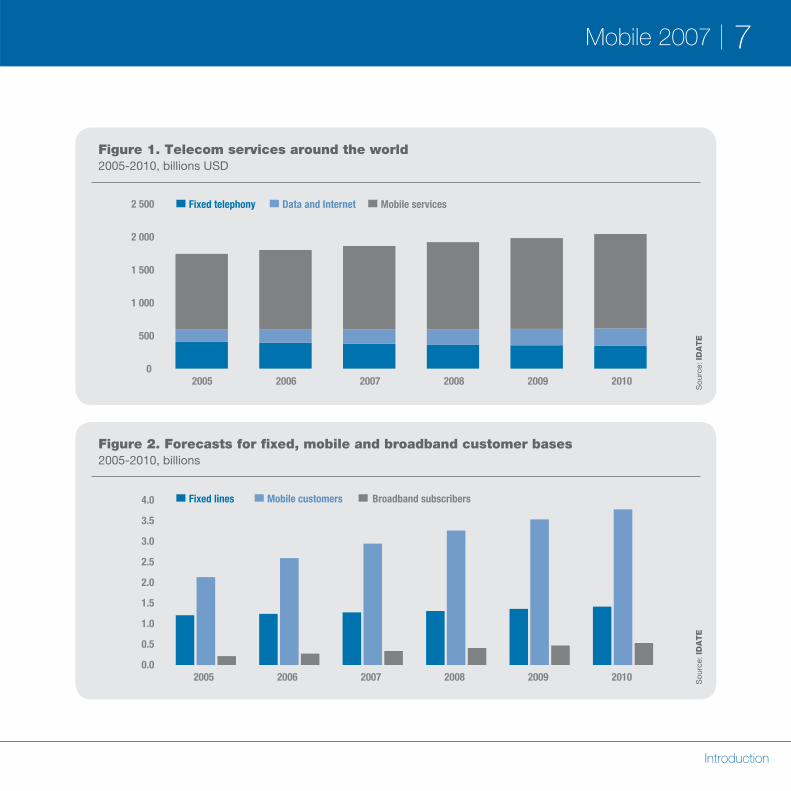
Figure 1. Telecom services around the world2005-2010, billions USD
Sou
rce:
IDA
TE
0
500
1 000
1 500
2 000
2 500
2005 2006 2007 2008 2009 2010
Fixed telephony Data and Internet Mobile services
Figure 2. Forecasts for fixed, mobile and broadband customer bases2005-2010, billions
Sou
rce:
IDA
TE
0.5
2.5
3.0
3.5
4.0
2005 2006 2007 2008 2009 2010
Fixed lines Mobile customers Broadband subscribers
0.0
1.0
1.5
2.0


Telecom Services &
Mobile Trends

Mobile 2007 10
Telecom Services & Mobile Trends
The slowdown in growth in the telecom services market experienced in 2004 con-tinued into 2005 and 2006. Our estimates put total world revenue in 2005 at 1.150 billion USD, up 5.6% on the previous year. Growth in 2006 can be expected to be slightly lower at 5.2%.
While the upswing in Internet services is offsetting the decline in telephony in the fixed sector, growth in the overall telecom services sector is largely accounted for
by mobile services. It is also being strongly driven by the expansion of telecom services in developing countries.
With total revenues estimated at 556 billion USD in 2005 and 616 billion USD in 2006, mobile services have generated the bulk of the increase in the telecom services market. In terms of value, by 2003 they had already exceeded fixed-line services. Estimated at 51% in 2006, their share of the telecom services market in general displays continuous growth.
The growth in telecom services is still fuelled by mobile
Table 1. Key data on the world telecom services market2005-2006
2005 2006
Market value 1 150 billion USD 1 200 billion USD
Annual growth rate 5.6% 5.2%
Share of mobile services 48.4% 51.0%
Share of developing countries 26.7% 29.1%
Fixed lines 1.21 billion 1.24 billion
Fixed penetration (% of population) 19.5% 19.7%
Mobile customers 2.14 billion 2.60 billion
Mobile penetration (% of population) 34.3% 41.3%
Broadband subscribers 215 million 277 million
Broadband penetration (% of population) 3.4% 4.4% Sou
rce:
ID
AT
E

Mobile 2007 11
Telecom Services & Mobile Trends
Figure 3. Customer bases around the globe2002-2006, millions
0
500
1 000
1 500
2 000
2 500
3 000
2002 2003 2004 2005 2006
Fixed lines Mobile customers Broadband customers
Sou
rce:
IDA
TE
Figure 4. Telecom services market2001-2005, annual growth rate (%)
Sou
rce:
IDA
TE
-6-4-202468
101214
2001 2002 2003 2004 2005 2006
USA + Canada European Union Japan
Mobile 2007 12
Telecom Services & Mobile Trends
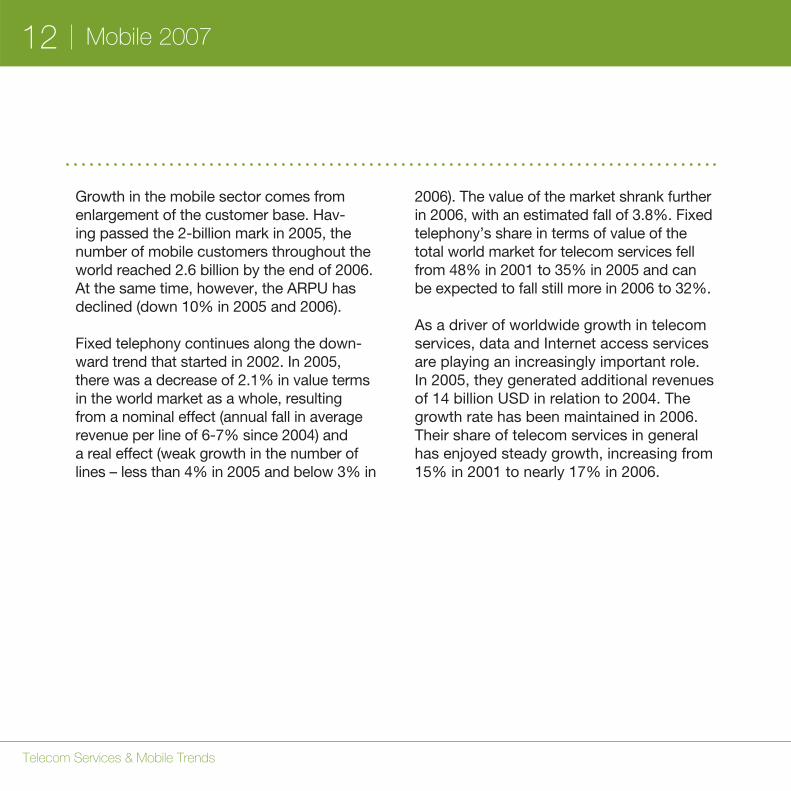
Growth in the mobile sector comes from enlargement of the customer base. Hav-ing passed the 2-billion mark in 2005, the number of mobile customers throughout the world reached 2.6 billion by the end of 2006. At the same time, however, the ARPU has declined (down 10% in 2005 and 2006).
Fixed telephony continues along the down-ward trend that started in 2002. In 2005, there was a decrease of 2.1% in value terms in the world market as a whole, resulting from a nominal effect (annual fall in average revenue per line of 6-7% since 2004) and a real effect (weak growth in the number of lines – less than 4% in 2005 and below 3% in
2006). The value of the market shrank further in 2006, with an estimated fall of 3.8%. Fixed telephony’s share in terms of value of the total world market for telecom services fell from 48% in 2001 to 35% in 2005 and can be expected to fall still more in 2006 to 32%.
As a driver of worldwide growth in telecom services, data and Internet access services are playing an increasingly important role. In 2005, they generated additional revenues of 14 billion USD in relation to 2004. The growth rate has been maintained in 2006. Their share of telecom services in general has enjoyed steady growth, increasing from 15% in 2001 to nearly 17% in 2006.

Mobile 2007 13
Telecom Services & Mobile Trends
Table 2. Customer bases - Industrialised countries vs. developing countries2001-2006, millions
2001 2002 2003 2004 2005 2006
FIXEDLINES
Industrialised countries 537 533 525 516 502 488
Developing countries 471 518 583 654 711 756
MOBILE CUSTOMERS
Industrialised countries 576 625 682 748 821 886
Developing countries 369 521 705 955 1 320 1 716
BROADBANDSUBSCRIBERS
Industrialised countries 34 58 86 120 155 186
Developing countries 2 5 16 36 60 91
Table 3. Telecom services deployment - Industrialised countries vs. developing countries2001-2006, number of customers / lines per 100 inhabitants
2001 2002 2003 2004 2005 2006
FIXEDDENSITY
Industrialised countries 56.8 56.1 55.1 53.9 52.2 50.6
Developing countries 9.4 10.2 11.3 12.6 13.5 14.2
MOBILE DENSITY
Industrialised countries 60.9 65.8 71.6 78.2 85.5 91.8
Developing countries 7.4 10.3 13.7 18.3 25.0 32.1
BROADBANDDENSITY
Industrialised countries 3.6 6.1 9.0 12.5 16.1 19.3
Developing countries 0.0 0.1 0.3 0.7 1.1 1.7
Sou
rce:
ID
AT
ES
ourc
e: ID
AT
E

Mobile 2007 14
Telecom Services & Mobile Trends
Mobile services
General evolution of the market
The world market for mobile telecom serv-ices in 2005 amounted to 556 billion USD. This meant an 11.1% increase, lower than the 13.7% growth achieved in 2004. With the exception of Africa and the Middle East, there was a decline in growth in all geographical regions. 2006 could see the same downward trend because of the slowdown in the indus-trialised countries, but it should nevertheless remain above the 10% mark at an estimated 10.5%. Growth has been far stronger in the developing countries (23% in 2005, 25% in 2006) than in the industrialised (7.1% in 2005, 5.3% in 2006). Expressed in value terms, the former countries are now accounting for an ever-larger share of the world total. At 28% in 2005 compared with 20% in 2002, their share can be expected to exceed 32% in 2006.
Four main factors have marked recent de-velopments in the mobile services market:
the enlargement of customer bases in the developing economies, particularly in the
•
major emerging markets but also in the industrialised countries, despite already high penetration rates
the growing importance of data services
the fall in ARPU in most countries
market consolidation
Customer base growth around the world
During the period 2002-2004; mobile cus-tomer bases expanded at an annual rate of 20-21%. In 2005, the number of customers rose to 26% to pass the 2-billion mark (2.14 billion at year-end 2005). IDATE estimates indicate only a slight slowdown in customer base growth in 2006, winding up at 22%. By the end of 2006, mobile customers around the world should number 2.6 billion. A large part of the increase in the customer base is fuelled by the developing countries. By the end of 2006, two-thirds of the world’s mobile customers will be found in a devel-oping country, compared with 50% at year-end 2003. In 2005-2006, these countries
•
•
•
Trends by activity segment

Mobile 2007 15
Telecom Services & Mobile Trends
Figure 5. Regional mobile density2002 / 2006, number of mobile customers per 100 inhabitants at year end
Sou
rce:
IDA
TE
79
5368
48
1910 9 4
109101
8476
53
3825
18
WesternEurope
EasternEurope
Advanced Asianeconomies
NorthAmerica
LatinAmerica
Middle East& North Africa
Developing Asianeconomies
Sub-SaharanAfrica
2002 2006
Figure 6. Leading mobile markets, in number of customersEnd 2006, millions
Sou
rce:
IDA
TE
0 50 100 150 200 250 300 350 400 450
ChinaUSA
RussiaIndia
JapanBrazil
GermanyItaly
UKIndonesia
TurkeyFranceSpain
MexicoPakistan
2002Net adds in 2003Net adds in 2004Net adds in 2005Net adds in 2006*
* estimated

Mobile 2007 16
Telecom Services & Mobile Trends
generated around 85% of the net increase in the worldwide customer base. Taking all developing countries into account, the customer base grew by almost 40% in 2005 and 30% in 2006. Particularly strong growth is displayed by the major emerging economies of Asia (China, India, Indonesia, Pakistan), Latin America (Brazil, Colombia) Europe (Russia, Ukraine, Turkey) and Africa (South Africa, Algeria, Nigeria). Customer bases in the industrialised nations continued to grow steadily (nearly 10% in 2005 and 8% in 2006), despite an already high pen-etration rate (86% on average at year-end 2005). In the USA and Canada, where the mobile market is still less developed than in Europe, customer bases were up 14% and 12% respectively in 2005. Growth is also above 10% in Italy, where penetration ex-ceeds 100%. Weak growth can nevertheless be found in some markets in the Asia-Pacific region (Taiwan, Hong Kong, Singapore) and in Europe (Denmark, Sweden, Norway).
Among the industrialised countries, the gap between the USA (estimated penetration of 70% at end 2005) and the EU (100%) remains, partly reflecting the wider use of
prepaid services in Europe. EU countries continue to display some of the world’s high-est penetration rates with several countries exceeding the 100% mark (e.g. Italy, the UK, Sweden and the Czech Republic).
Average penetration in the developing economies continues to rise – from 10% at the end of 2002 to 25% at the end of 2005, and it is likely to reach 32% by the end of 2006. Lying behind this average are quite varying situations. East European coun-tries display rates comparable with those in Western Europe. The lowest in the region at the end of 2005 was recorded in Romania (60%). Several countries outside the conti-nent of Europe display penetration rates of over 40%. These include countries in the Persian Gulf, Africa (Algeria, Tunisia, South Africa), Asia (Malaysia, Thailand, the Philip-pines) and Latin America (Chile, Argentina, Brazil, Colombia, Mexico, Venezuela). The period 2004-2005 also witnessed the emer-gence of a number of new major markets such as Bangladesh, India, Pakistan, Indo-nesia, Vietnam and Nigeria. Penetration in these countries is still below 15% but the market is expanding rapidly

Mobile 2007 17
Telecom Services & Mobile Trends
Figure 7. Mobile services market growth and geographic make-up
Sou
rce:
IDA
TE
Annual growth of market volume(mobile customer growth, %)
Market growth in value(growth of mobile services revenue, %)
The market’s geographic make-up(Total 2006, in volume, %)
The market’s geographic make-up(Total 2006, in value, %)
North America10
WesternEurope17
Africa & Middle East10
Eastern Europe13
Latin America11
DevelopingAsia, 31
Industrialised Asia, 8North America22
WesternEurope27
Africa & Middle East7
Eastern Europe7
Latin America7
DevelopingAsia, 12
IndustrialisedAsia, 18
32
34
32
27
17
9
-3
38
31
27
28
23
12
6
34
32
26
24
17
10
4
1-1
MENA
Sub-Saharan Africa
Developing Asia
Latin America
Eastern Europe
North America
Western Europe
Industrialised Asia
200420052006
45
38
52
28
40
15
9
47
5
60
64
29
35
14
10
51
5
36
39
34
26
12
7
18
6
MENA
Sub-saharan Africa
Developing Asia
Latin America
North America
Western Europe
Eastern Europe
Industrialised Asia
200420052006


Mobile Equipment Dynamics

Mobile 2007 20
Mobile Equipment Dynamics
Market development in volume
IDATE now expects the global mobile termi-nal market size for 2006 at 977 million units up from 836 million units in 2005, i.e. more than 17% growth.
In the long term, the mobile terminal market is now forecasted at 1,350 million units in 2010, i.e. a CAGR of 8.42% from 2006.
Market development in value
The global mobile terminal market revenues for 2006 expected to reach USD 117.0 bil-lions up from 110 billions in 2005, i.e. +6%, due to a decrease in the ASP driven by stronger than expected market growth in the emerging markets and significant com-petition on high-end handsets.
In the long term, the mobile terminal market is forecasted at USD 128 billions in 2010, i.e. a CAGR of 2.4% from 2006.
3G market
For 2006, IDATE forecasts the 3G market at 78 M units, i.e. 8% of the total mobile ter-minal market. By 2010, the 3G market will account for 259.1 M units, i.e. 19.2% of the total market volume
Mobile terminal market shares
In Q3 2006, the largest vendor Nokia con-tinued to grab market share in volume significantly thanks to outstanding perform-ance. Motorola’s market share decreased to 21.9% but remains out of reach: Sam-sung’s market share increased to 12.5%. Sony Ericsson reinforced its #4 position. LG is now the last actor of the top 5 with stable market share. Finally, other vendors’ market share drop bellow 15%.
Mobile Terminals

Mobile 2007 21
Mobile Equipment Dynamics
Table 4. Mobile Terminal market, shares of region2004-2009, volume in M units
2004 2005 2006(e) 2007(f) 2008(f) 2009(f) 2010(f)
North America 108.7 133.0 136.0 137.5 140.0 142.0 143.0
Asia Pacific 291.4 344.0 427.6 490.2 550.5 597.5 649.4
Western Europe 129.7 141.6 148.0 151.5 154.5 155.5 157.0
Latin America 52.0 63.9 89.0 110.0 130.0 145.0 163.6
Eastern Europe 71.0 93.5 102.4 106.8 110.0 115.0 125.0
Middle East & Africa 46.0 60.0 74.0 84.0 95.0 105.0 112.0
TOTAL WORLDWIDE 698.8 836.0 977.0 1 080.0 1 180.0 1 260.0 1 350.0 Sou
rce:
ID
AT
E
Table 5. Global Mobile Terminal shares2004-2009, % (unit based)
2005 2006
Q1 Q2 Q3 Q4 Q1 Q2 Q3(e)
Nokia 30.2 32.0 31.0 33.2 33.8 34.1 36.1
Motorola 16.1 17.8 18.0 17.7 20.8 22.6 21.9
Samsung 13.8 12.8 12.5 10.8 13.1 11.4 12.5
LG 6.2 6.4 7.2 6.4 7.0 6.7 6.7
Sony 5.3 6.2 6.4 6.4 6.0 6.8 8.1
Others 28.4 24.7 24.9 25.6 19.3 18.4 14.6 Sou
rce:
ID
AT
E
Figure 8. Global MobileTerminal Market2004-2010, in M units
Sou
rce:
IDA
TE
0
200
400
600
800
1 000
1 200
1 400
2004 2005 2006 2007 2008 2009 2010
Figure 9. Global MobileTerminal Market2004-2010, in B USD
Sou
rce:
IDA
TE
0
20
40
60
80
100
120
140
2004 2005 2006 2007 2008 2009 2010
Mobile 2007 22
Mobile Equipment Dynamics
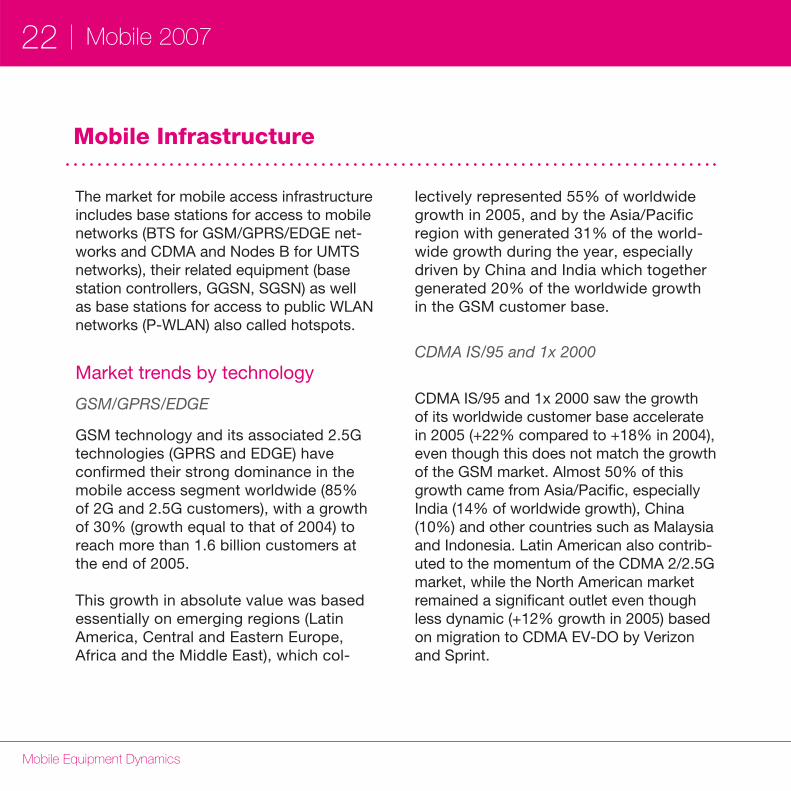
The market for mobile access infrastructure includes base stations for access to mobile networks (BTS for GSM/GPRS/EDGE net-works and CDMA and Nodes B for UMTS networks), their related equipment (base station controllers, GGSN, SGSN) as well as base stations for access to public WLAN networks (P-WLAN) also called hotspots.
Market trends by technology
GSM/GPRS/EDGE
GSM technology and its associated 2.5G technologies (GPRS and EDGE) have confirmed their strong dominance in the mobile access segment worldwide (85% of 2G and 2.5G customers), with a growth of 30% (growth equal to that of 2004) to reach more than 1.6 billion customers at the end of 2005.
This growth in absolute value was based essentially on emerging regions (Latin America, Central and Eastern Europe, Africa and the Middle East), which col-
lectively represented 55% of worldwide growth in 2005, and by the Asia/Pacific region with generated 31% of the world-wide growth during the year, especially driven by China and India which together generated 20% of the worldwide growth in the GSM customer base.
CDMA IS/95 and 1x 2000
CDMA IS/95 and 1x 2000 saw the growth of its worldwide customer base accelerate in 2005 (+22% compared to +18% in 2004), even though this does not match the growth of the GSM market. Almost 50% of this growth came from Asia/Pacific, especially India (14% of worldwide growth), China (10%) and other countries such as Malaysia and Indonesia. Latin American also contrib-uted to the momentum of the CDMA 2/2.5G market, while the North American market remained a significant outlet even though less dynamic (+12% growth in 2005) based on migration to CDMA EV-DO by Verizon and Sprint.
Mobile Infrastructure

Mobile 2007 23
Mobile Equipment Dynamics
Table 6. Mobile infrastructure revenues of major equipment manufacturers worldwide2003-2005, million USD
Total revenues (million USD) 2005 vs. 2004(%)2003 2004 2005
Ericsson 14 541 16 265 18 283 12.4
Nokia 6 989 7 918 8 153 3.0
Siemens 6 064 6 499 7 173 10.4
Alcatel 4 359 4 062 5 086 25.2
Lucent 3 946 5 108 5 967 16.8
Nortel 4 389 4 817 5 306 9.7
Motorola 4 417 5 457 5 112 -6.3
NEC 2 885 3 520 3 168 -10.0
Huawei 641 910 1 419 56.0
ZTE 651 1 165 1 079 - 7.4
Samsung n.a. 1 162 1 025 -11.8
LG 2 226 1 111 996 -10.4
Others (Fujitsu, UTStarcom…) n.a. 1 822 1 380 -24.3
TOTAL 51 108 59 838 64 148 7.2 Sou
rce:
ID
AT
E

Mobile 2007 24
Mobile Equipment Dynamics
UMTS
As far as 3G, 2005 was a decisive year in large scale commercialisation of UTMS technology. The UMTS customer base grew more than 170% to reach more than 45 million customers by the end of Decem-ber 2006 should see this trend confirmed with expected customer base growth of more than 130%. If the Japanese market is by far the market of reference, strong de-velopment in the Italian and English mar-kets make Europe the largest 3G region in the world.
CDMA EV-DO
CDMA EV-DO, a 3G technology from the CDMA world, is also developing at a sus-tained rate even though less than UMTS. The net slowdown in the growth of the primary market for this technology, South Korea, poses real questions as to this tech-nology’s prospects. In effect, the two lead-ing South Korean operators (KTF and SK Telecom) have decided to gradually migrate to HSDPA. However, the selection by KDDI in Japan and Verizon and (to a lesser degree) Sprint in the United States in favour of this technology seems to strengthen it

Mobile 2007 25
Mobile Equipment Dynamics
Table 7. Mobile access infrastructure market by technology2005-2010, million USD
2005 2006 2007 2008 2009 2010
Cellular 31 904 33 116 28 757 29 912 29 564 28 078
GSM/GPRS/EDGE 17 994 18 034 11 486 8 060 6 000 3 911
CDMA One/2000 1x 4 132 3 628 1 668 1 776 191 76
WCDMA/HSDPA 7 228 8 637 15 603 20 076 23 373 24 091
CDMA EV-DO 2 550 2 817 5 030 6 727 7 219 7 195
Carrier Wi-Fi/WiMAX/Wibro 3 383 4 253 4 978 5 641 6 003 6 359
TOTAL 35 287 37 369 33 735 35 553 35 567 34 437 Sou
rce:
ID
AT
E

3GEconomics

Mobile 2007 28
3G Economics
Asia heads the market, take-off in Europe
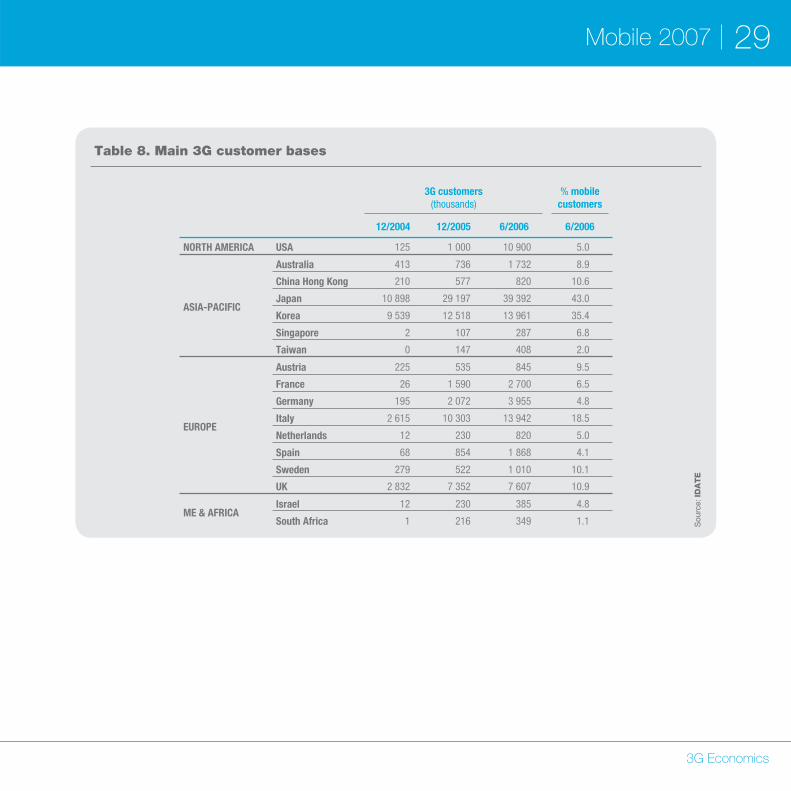
Between June 2005 and June 2006, the number of 3G customers doubled to over 100 million, corresponding to roughly 5% of the total mobile customer base. For the moment, 3G is limited to the industrialised countries. .
The Asia-Pacific region accounts for 50% of the world’s 3G customers. The number stands at 54 million, of which 29 million in Japan and 11 million in South Korea. Japan also leads in the spread of 3G services, with 43% of the country’s mobile customers possessing a 3G handset.
In Western Europe, most operators have rolled out 3G services. There are 38 mil-lion customers, i.e. 9% of the total mobile customer base. The number of 3G custom-ers rose 29 million over a period of twelve months. Italy and the United Kingdom lead the field with 56% of the European total. 3G customers in Italy accounted for 18% of
mobile customers in June 2006, a far higher proportion than in other countries of Europe. Also in Eastern Europe, operators in several countries have launched 3G services (namely Hungary, Romania, Slovenia and Slovakia).
In the USA, the number of 3G customers is estimated at 5% of the total mobile cus-tomer base.
3G services
Figure 10. 3G customers bygeographical regionJune 2006, % (ranked by nº of 3G customers)
Sou
rce:
IDA
TE
Western Europe36
North America, 11Asia-Pacific
50
Africa & Middle East, 1
Eastern Europe, 2
Mobile 2007 29
3G Economics
Table 8. Main 3G customer bases
3G customers(thousands)
% mobile customers
12/2004 12/2005 6/2006 6/2006
NORTH AMERICA USA 125 1 000 10 900 5.0
ASIA-PACIFIC
Australia 413 736 1 732 8.9
China Hong Kong 210 577 820 10.6
Japan 10 898 29 197 39 392 43.0
Korea 9 539 12 518 13 961 35.4
Singapore 2 107 287 6.8
Taiwan 0 147 408 2.0
EUROPE
Austria 225 535 845 9.5
France 26 1 590 2 700 6.5
Germany 195 2 072 3 955 4.8
Italy 2 615 10 303 13 942 18.5
Netherlands 12 230 820 5.0
Spain 68 854 1 868 4.1
Sweden 279 522 1 010 10.1
UK 2 832 7 352 7 607 10.9
ME & AFRICAIsrael 12 230 385 4.8
South Africa 1 216 349 1.1 Sou
rce:
ID
AT
E

Mobile 2007 30
3G Economics
Data services used chiefly in Europe and industrialised Asian countries
Mobile data services have displayed strong growth in recent years. The main categories comprise: messaging, transac-tion, information, entertainment, marketing, man-machine communication and secu-rity services. The growing importance of data services in the mobile service sector is leading to a major transformation of the industry, as an increasing proportion of revenues accruing to mobile operators is now shared with third parties, i.e. service and content providers.
In value terms, the market is dominated by the industrialised countries, which account for around 85% of the total figure. Two ma-jor regions stand out clearly in this context: Europe (mainly West European countries) and the Asia-Pacific region (industrialised countries), both far ahead of North America.
European countries account for over 30% of the world market for mobile services. SMS continue to dominate but their share is shrinking.
•
The industrialised nations of the Asia-Pa-cific region account for 45% of the world market for mobile data services (19% for Japan alone). It is these countries, too, that display the widest use of 3G serv-ices.
With only 14% of the total, North America lags behind. Data services there account for only 11% of revenues from mobile services in general, compared with an average 15% in Europe and 25% in the advanced economies of the Asia-Pacific region.
Average revenue per user (ARPU)
Heavy fall in ARPU levels
ARPU levels differ widely not only from one region to another but also within the group itself of industrialised countries. In Western Europe, the level is still well below that found in North America and the indus-trialised Asian countries, which reflects the comparatively high proportion of prepaid customers in Europe.
•
•

Mobile 2007 31
3G Economics
Figure 11. Mobile data services market in 2006
Sou
rce:
IDA
TE
Europe31
NorthAmerica12
Industrialised Asia45
Other countries10
25
15
11
10
6
17
11
4
4
2
Industrialised Asia
Europe
North America
Latin America
Other countries 20062002
Geographic make-up(%)
Data’s share of the mobile services market(in value, %)

Mobile 2007 32
3G Economics
In the period 2005-2006, ARPU levels have fallen in all the regional markets. Voice serv-ices have been specially affected because of the cuts in tariff rates (particularly via flat-rate options) and the voice-data substi-tution trend.
In Japan, the mobile ARPU fell from 80 USD in 2002 to 68 USD in 2006. Although the gap in relation to other countries has nar-rowed, Japan still has the highest mobile ARPU level of all the industrialised coun-tries. The fall has been particularly pro-nounced in voice services, while in the data sector, it tends to remain unchanged.
In the USA, on the other hand, overall ARPU levels have tended to remain steady, thanks to the increased use of data services that has offset the fall in the ARPU in the voice sector.
In Western Europe, the fall in ARPU levels varies from one country to the other. The rise in the ARPU from mobile data services is not high enough to offset the decline
in voice ARPU. The fall can be explained mainly by the reduction in fixed-to-mobile call termination charges. In the saturated mobile markets, however, tariff rates have also been heavil affected by the develop-ment of discount or no-frill offers by MVNOs in Northern Europe and, in the case of Italy, Sweden and the United Kingdom, the ar-rival of “3”.
In the developing countries, the strong growth in customer bases has led to a signif-icant fall in ARPU levels, which vary accord-ing to country. The level stands at 5 USD per month in Pakistan, 7 USD per month in India and Indonesia, 9 USD per month in China, 10 USD in Senegal, 12 USD in Brazil, 13 USD in Algeria, 17 USD in Nigeria and 20 USD per month in South Africa. In a great many African countries, the ARPU remains comparatively high, despite heavy price cuts. It stands at a little over 12 USD per month in the sub-Saharan countries (excluding South Africa), compared with 8 USD in the developing countries of Asia. Monthly mobile services ARPU in 2005

Mobile 2007 33
3G Economics
Table 9. Mobile voice and data ARPU in Japan, Western Europe and the USA2002-2006, USD per month
2002 2003 2004 2005 2006
USA
Voice ARPU 45.5 46.3 47.2 44.6 41.9
Data ARPU 1.9 2.4 2.7 3.9 5.2
Total mobile ARPU 47.4 48.8 49.9 48.5 47.1
Japan
Voice ARPU 63.8 58.6 55.4 52.7 49.0
Data ARPU 16.1 18.4 18.5 18.5 18.6
Total mobile ARPU 79.9 76.9 73.9 71.2 67.6
Western Europe
Voice ARPU 32.4 32.4 32.1 30.5 29.0
Data ARPU 3.7 4.5 4.9 5.3 5.4
Total mobile ARPU 36.0 36.9 37.0 35.8 34.4
Figure 12. Monthly ARPU of mobile services by geographical region2002-2006, USD per month
Sou
rce:
IDA
TE
54.0051.60 50.80 50.10 48.70
47.00 48.40 49.70 48.50 47.20
36.00 36.90 35.80 34.40
14.20 13.70 12.70 11.40 10.70
37.00
2002 2003 2004 2005 2006
Industrialised Asia
North America
Western Europe
Developing economies
Sou
rce:
ID
AT
E


MobileHot Topics

Mobile 2007 36
Mobile Hot Topics
The term MVNO defines a company that offers mobile services without actually possessing any frequency allocation and which is financially very dependent on its host MNO.
The financial stability of an MVNO natu-rally depends on the financial conditions surrounding the wholesale purchase of minutes from its MNO. MVNO sources of revenue are the same as for traditional mobile operators (except for wholesale revenues). The extent of the operating costs that weigh heavily on MVNOs depend on the particular activity. The costs required to enter the market are still relatively high and about two years of margins are normally needed for a company to be profitable. The financial compensation paid to MNOs depends on an MVNO’s negotiating power. The average reduction granted for whole-sale prices is about 30% in Western Eu-
ropean countries, except in specific cases (Virgin Mobile UK).
MVNO growth
By mid-2006, MVNOs are becoming established in both Europe and North America, and in some mobile markets in Asia. They are responding to a logic off-iner segmentation in what is now a mature market (about 30 million customers), i.e. a 60% rise in two years.
The main vehicles of MVNO growth are the market situation, technology and the regulatory framework.
MVNO development is also linked to the need to seek out new growth outlets in markets that are either saturated or are nearing saturation, as is the case in West-
MVNO: the new deal

Mobile 2007 37
Mobile Hot Topics
Table 10. Growth factors and potential of the MVNO phenomenon, by geographical zone
Western Europe North America Japan, South Korea
• A favourable regulatory environment
• Situation controlled by mobile operators (masters of the game and of costs)
• Moderate potential for 5 years
• A neutral regulatory environment
• Market led by FMC and FMS• Market led by the media• Situation controlled by
mobile and cable operators• High potential for 5 years
• A neutral regulatoryenvironment
• Very (too) competitive markets
• High access costs• Limited potential for 5 years
Network construction cost (*) +++ ++ +++
Quadruple play ++ +++ ++
Fixed-mobile convergence ++ +++ ++
Telecoms-media convergence ++ +++ ++
Fixed-mobile substitution +++ +++ +++
Regulation ++ to +++ (**) ++ +
Situation of the rise in mobile data traffic ++ ++ +++
Cellular customer voice traffic levels + +++ ++
ARPU ++ + +++
Cellular penetration rate +++ ++ +
(*) Frequencies + infrastructure(** ) Non-uniform transposition of EU Directives
Sou
rce:
MV
NO
Exe
cuti
ve s
um
mary

Mobile 2007 38
Mobile Hot Topics
ern Europe and North America, where there is still substantial room for conquer-ing customers.
The MVNO phenomenon is also unfolding against a background of network conver-gence and the adoption of added-value services.
Regulation is a main factor in the explo-sion of MVNOs in Europe. As a means for remedy, regulators can, in fact, impose MVNO agreements in the market. This may explain the contrasting degrees of devel-opment among different MVNOs in the European Union
Weight and scope of the MVNO phenomenon
By mid-2006, the MVNO phenomenon that emerged in Northern Europe in 1998 has spread to Western Europe and North
America, while its development in Asia is more measured. The number of MVNOs is highest in Europe although the United States is the country where they are most numerous (more than sixty virtual opera-tors). MVNO growth in Asia is mixed.
The situation in Western Europe also shows sharp contrasts. The phenomenon taps into more and more markets; Southern countries are facing monthly launches an-nouncements.
Early MVNOs brought about serious up-heavals in the mobile markets of some countries. A few MVNOs managed to seriously threaten MNOs with a significant share of the market, especially in North-ern Europe, where they hold most of the market in terms of volume. The arrival of MVNOs also led to considerable erosion in retail prices and a fall in ARPU, mainly at the bottom end of the market.

Mobile 2007 39
Mobile Hot Topics
Heavy data users
Content / media
Distribution & brand extension
No frills
SOPHISTICATION
ARPU
Voice and SMS Increasing data
Communities
Sou
rce:
ID
AT
E
Figure 13. Towards higher sophistication, customization and ARPU

Mobile 2007 40
Mobile Hot Topics
As part of their ongoing quest to differenti-ate themselves from the competition, wireline telcos are now adding mobile services to the mix, in view of rolling out quadruple play bun-dles. If integrated operators can rely on their mobile subsidiaries, the remaining landline telcos are achieving their expansion through either MVNO agreements (US cablecos) or co-branding (Vodafone-FastWeb, UPC-One), while a handful among them have become integrated operators via strategic acquisitions (Softbank, Orange in Spain) or investments in unbundling (Mobistar).
And we are seeing a growing number of convergent device initiatives (UMA, SIP) which take advantage of Wi-Fi with home zone offers (reduced rates for calls from home over Wi-Fi). But the vast majority of players are focused on fixed-mobile bun-dles and, without going all the way to the quadruple play (except for cablecos), they are concentrating their efforts on fixed-mo-bile voice offers, benefiting from network synergies (termination), and more and more on a combination of fixed internet access, in some cases with naked DSL, and mobile telephony.
A number of cellular only telcos are work-ing to encourage users to switch from landline to all mobile by offering large vol-ume formulas (3 in the UK), in some cases unmetered (Bouygues Telecom), or very appealing tariffs for certain calls (same net-work, same community, etc.). And some have successfully reproduced home zone formulas, without the technological com-ponent, such as O2’s Genion. Most, how-ever (Vodafone, O2), are now making the move to fixed-mobile bundles acting as an FVNO.
All operators have set their sights beyond fixed-mobile access, working to develop convergent communication (IM) and en-tertainment (access to content) services as a means of distinguishing themselves from the pack and, if possible, of generat-ing added revenue thanks to increased data traffic and paid services, and possibly advertising. But some services will not be able to be implemented at a reasonable cost without deploying new technologies, hence certain players’ growing interest in NGN and IMS.
Fixed-Mobile Convergence
Mobile 2007 41
Mobile Hot Topics
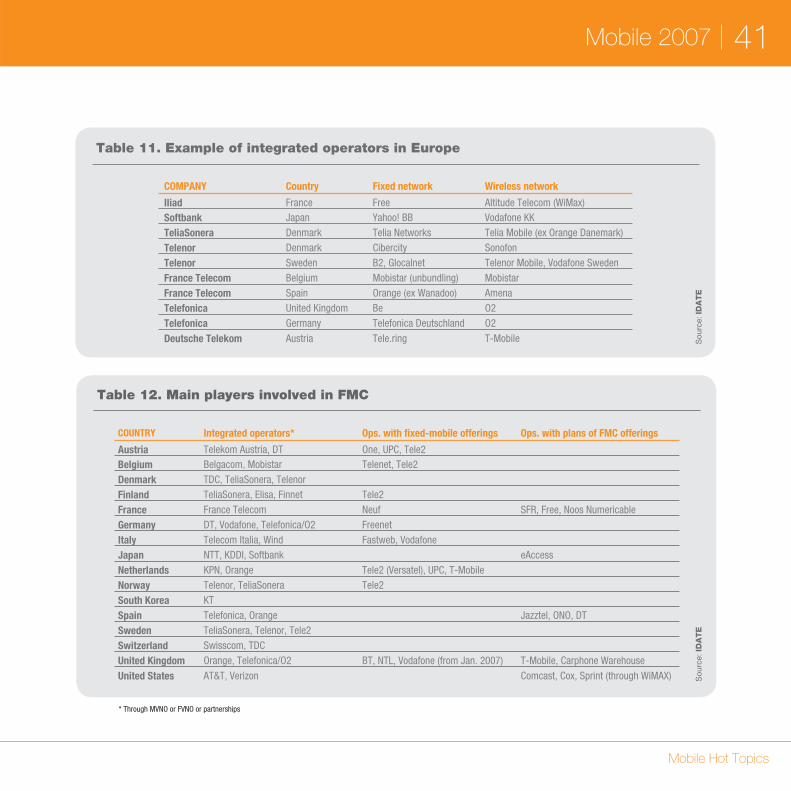
Table 11. Example of integrated operators in Europe
COMPANY Country Fixed network Wireless network
Iliad France Free Altitude Telecom (WiMax)Softbank Japan Yahoo! BB Vodafone KK
TeliaSonera Denmark Telia Networks Telia Mobile (ex Orange Danemark)
Telenor Denmark Cibercity Sonofon
Telenor Sweden B2, Glocalnet Telenor Mobile, Vodafone Sweden
France Telecom Belgium Mobistar (unbundling) Mobistar
France Telecom Spain Orange (ex Wanadoo) Amena
Telefonica United Kingdom Be O2
Telefonica Germany Telefonica Deutschland O2
Deutsche Telekom Austria Tele.ring T-Mobile
Table 12. Main players involved in FMC
COUNTRY Integrated operators* Ops. with fixed-mobile offerings Ops. with plans of FMC offerings
Austria Telekom Austria, DT One, UPC, Tele2Belgium Belgacom, Mobistar Telenet, Tele2
Denmark TDC, TeliaSonera, Telenor
Finland TeliaSonera, Elisa, Finnet Tele2
France France Telecom Neuf SFR, Free, Noos Numericable
Germany DT, Vodafone, Telefonica/O2 Freenet
Italy Telecom Italia, Wind Fastweb, Vodafone
Japan NTT, KDDI, Softbank eAccess
Netherlands KPN, Orange Tele2 (Versatel), UPC, T-Mobile
Norway Telenor, TeliaSonera Tele2
South Korea KT
Spain Telefonica, Orange Jazztel, ONO, DT
Sweden TeliaSonera, Telenor, Tele2
Switzerland Swisscom, TDC
United Kingdom Orange, Telefonica/O2 BT, NTL, Vodafone (from Jan. 2007) T-Mobile, Carphone Warehouse
United States AT&T, Verizon Comcast, Cox, Sprint (through WiMAX)
Sou
rce:
ID
AT
ES
ourc
e: ID
AT
E* Through MVNO or FVNO or partnerships

Mobile 2007 42
Mobile Hot Topics
What course will mobile television and video offers take?
Three main courses can be identified in terms of the distribution of mobile TV and video services.
The Unicast solution uses cellular net-works (for streaming or downloading). Largely used by operators, this option will have difficulty sustaining the more wide-spread distribution of mobile TV at an acceptable cost;
The Multicast solution on cellular net-works (MBMS) is still in its test phase;
The Broadcast solution uses a terrestrial and/or satellite network downlink, at least for voice. However, decisions have to be taken on the standards used and heavy investment is required (especially to provide indoor reception).
Mobile telephony is also gradually enter-ing the digital home in the form of portable
•
•
•
players which store and play multimedia content. Fixed-to-mobile convergence also heralds the possibility of connecting a portable device to fixed Internet via a Wi-Fi connection, not just for voice-over-IP ser-vices but also for accessing content.
The specific features of each solution could lead to some network specialisa-tion, in response to where the content is consumed and the content people want to consume:
cellular networks for mobile VOD
broadcast networks dedicated to live mobile TV, especially outdoors
broadband Internet connection for transferring “live” TV to a mobile device at home
the mobile as a portable multimedia
•
•
•
•
Mobile Video and TV

Mobile 2007 43
Mobile Hot Topics
Table 13. Mobile TV and video revenues2006-2011, million euros
2006 2007 2008 2009 2010 2011
France 25 34 206 409 618 846
United Kingdom 20 65 162 346 624 967
Germany 13 40 109 246 476 766
Italy 45 118 249 484 828 1 169
Spain 6 21 49 118 269 517 Sou
rce:
ID
AT
E
OutdoorIndoor
Figure 14. Methods of broadcasting tomobile terminals
Video Cellular on demand
Live TV
Broadcastto mobile
TV signaltransfer
Filetransfer
Sou
rce:
ID
AT
E

Mobile 2007 44
Mobile Hot Topics
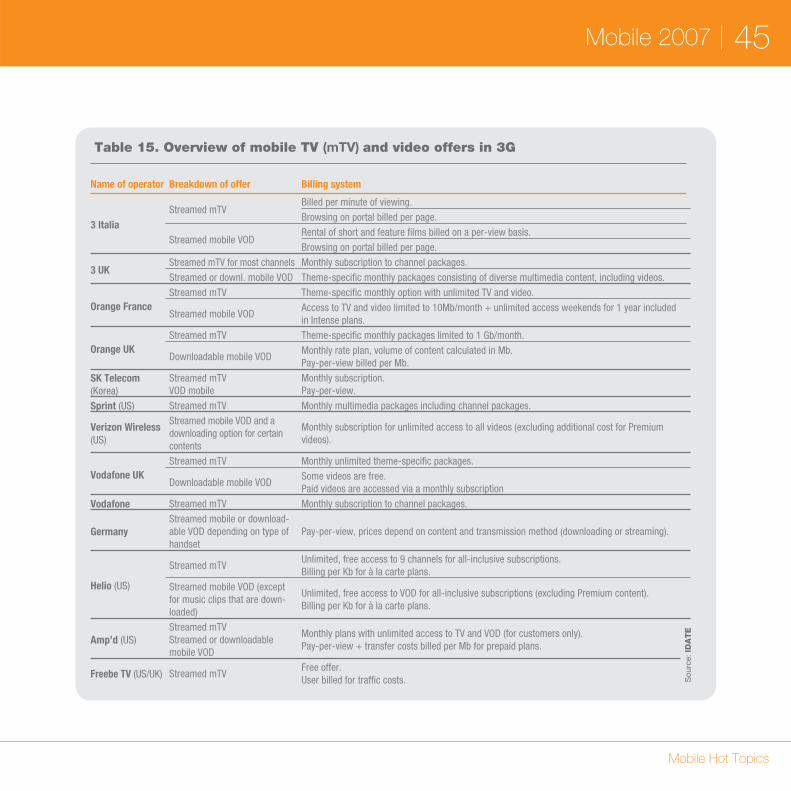
Positioning of mobile TV and video
Mobile TV and video are clearly handled differently, depending on whether the offer is in 3G or broadcast. For TV packages available via cellular networks, the offer is included in the operator’s multimedia services portal. It even plays a central role in operators’ efforts to encourage consum-ers to migrate to broadband subscriptions (Edge/3G/3G+). Most of the time, 3G mobile VOD services are not in a separate, clearly identified offer on the multimedia portal.
Videos may in fact be accessed via themed sections which, in addition to video, of-fer other multimedia content related to the particular theme.
Less comprehensive than 3G offers, broad-cast packages are generally sold in a single block and use very attractive subscription plans: free trial periods, compatible handset subsidies, etc. The pricing for 3G mobile TV offers is quite mixed, while TV services broadcast on mobile are generally sold in the form of monthly subscriptions.
Table 14. Overview of mobile TV (mTV) and video offers in broadcast
Name of operator Breakdown of offer Billing system
3 ItaliaBroadcasted mTV (DVB-H)
Monthly subscription to DVB-H channel package (excl. Playboy which is part of a separate offer).Unlimited access to DVB-H channel package (excluding Playboy) with an all-inclusive voice subscription.
Telecom Italia MobileBroadcasted mTV (DVB-H)
Monthly subscription providing users access to 30 content items (not including WAP navigation costs which are billed separately).
Virgin Mobile (UK) Streamed mTV (DAB)Monthly subscription to channel package for prepaid plans.Unlimited access to channel bouquet with an all-inclusive voice subscription.
SK Telecom - TU Media (Korea)
Streamed mTV (S-DMB)Hook-up fees.Monthly subscription to channel package (excluding pay-per-view channel).Pay-per-view programmes billed on a per-use basis.
MBCO (Japan) Streamed mTV (S-DMB)Hook-up fees.Monthly subscription to MoBaHo! service.Monthly subscription to all or part of the channel package via different options available.
Japanese terrest. offer Streamed mTV (ISDB-T) Free channel package.Korean terrestrial offer Streamed mTV (T-DMB) Free channel package. S
ourc
e: ID
AT
E
Mobile 2007 45
Mobile Hot Topics
Table 15. Overview of mobile TV (mTV) and video offers in 3G
Name of operator Breakdown of offer Billing system
3 ItaliaStreamed mTV
Billed per minute of viewing.
Browsing on portal billed per page.
Streamed mobile VODRental of short and feature films billed on a per-view basis.
Browsing on portal billed per page.
3 UKStreamed mTV for most channels Monthly subscription to channel packages.
Streamed or downl. mobile VOD Theme-specific monthly packages consisting of diverse multimedia content, including videos.
Orange FranceStreamed mTV Theme-specific monthly option with unlimited TV and video.
Streamed mobile VOD Access to TV and video limited to 10Mb/month + unlimited access weekends for 1 year included in Intense plans.
Orange UKStreamed mTV Theme-specific monthly packages limited to 1 Gb/month.
Downloadable mobile VODMonthly rate plan, volume of content calculated in Mb.Pay-per-view billed per Mb.
SK Telecom (Korea)
Streamed mTVVOD mobile
Monthly subscription.Pay-per-view.
Sprint (US) Streamed mTV Monthly multimedia packages including channel packages.
Verizon Wireless (US)
Streamed mobile VOD and a downloading option for certain contents
Monthly subscription for unlimited access to all videos (excluding additional cost for Premium videos).
Vodafone UKStreamed mTV Monthly unlimited theme-specific packages.
Downloadable mobile VODSome videos are free.Paid videos are accessed via a monthly subscription
Vodafone Streamed mTV Monthly subscription to channel packages.
GermanyStreamed mobile or download-able VOD depending on type of handset
Pay-per-view, prices depend on content and transmission method (downloading or streaming).
Helio (US)
Streamed mTVUnlimited, free access to 9 channels for all-inclusive subscriptions.Billing per Kb for à la carte plans.
Streamed mobile VOD (except for music clips that are down-loaded)
Unlimited, free access to VOD for all-inclusive subscriptions (excluding Premium content).Billing per Kb for à la carte plans.
Amp’d (US)Streamed mTV Streamed or downloadable mobile VOD
Monthly plans with unlimited access to TV and VOD (for customers only).Pay-per-view + transfer costs billed per Mb for prepaid plans.
Freebe TV (US/UK) Streamed mTV Free offer.User billed for traffic costs. S
ourc
e: ID
AT
E

Mobile 2007 46
Mobile Hot Topics
Portable Media Player
Pioneered by the iPod, portable media players are making their way en masse into digital homes, offering large content storage capabilities (the new iPod has a capacity of 80 Gb), and the ability to enjoy the content outside the home. Some devices can even be plugged directly into speakers, and so becoming a portable hi-fi.
These new portable players offer a wide range of features. In addition to video and music players, they allow users to down-load video, music, games and photos from their computer or media centre, in addition to enabling game, audio books and radio and TV programme downloads from online services.
Another type of portable player, notably the one developed by Thomson, can be com-pared to a mobile STB. Equipped with a screen, the portable player lets users watch DTT broadcasts at home when connected to the TV set, or watch DTT channels when on the move outside the home. Also now avail-able on the market are portable DVD players
equipped with a DTT tuner, marketed by Toshiba, among others.
So there are a host of portable players available, offering a range of features and connectable to the digital home. The vast majority of these devices are, however, video/music players which serve to extend the digital home to nomadic use in the out-side world.
The global portable player market is a very dynamic one, with growth estimates of 9% in 2005 and 10% in 2006 for Europe, so doubling in the space of a year. More specifically, the MP3 and MP4 market is expected to increase in value by 60% in that time.
The North American market is thought to represent double the European market in 2005, with the portable audio-video player segment accounting for close to 25% of the total market. Digital media players equipped with a hard drive are now owned by 2% of the American population, a per-centage that is projected to increase to 17% by 2010.
Digital Home

Mobile 2007 47
Mobile Hot Topics
Figure 15. Equipment rate in the US for digital media players with hard drive2004-2010, %
Sou
rce:
porta
ble
mul
timed
ia a
naly
sis
and
fore
csts
, 200
5.P
ark
ass
ocia
tes
2004 2006e 2007e 2008e 2009e 2010e2005
01
2
4
6
11
17
2003 2004 2005 2006
Figure 16. Growth of portable MP3 player equipment in French households2003-2006, %
Sou
rce:
Use
IT s
urve
y, 2
006.
IDA
TE
3
10
19
30

Mobile 2007 48
Mobile Hot Topics
3G Spectrum cost
In Western Europe, operators spent a total of roughly 100 billion EUR to acquire UMTS licenses, as indicated in the table.
By way of comparison, Asian operators have paid less than 6 billion EUR for their UMTS licenses, although the major mar-
Spectrum
kets of China and India have not yet al-located 3G licenses – a process which will dramatically increase the price of spectrum in the region.
For now, South Korea and Taiwan were home to the highest prices paid by opera-tors for 3G spectrum in the region

Mobile 2007 49
Mobile Hot Topics
Table 16. Price per UMTS license in selected countries
Country 3G Holders Price per licence (EUR) Spectrum FDD+ TDD Method
Austria
tele.ring 0.113 billion 2x5MHz + 5MHz
Auction
T-Mobile Austria 0.120 billion 2x5MHz + 5MHzMobilkom (Telekom Austria) 0.121 billion 2x5MHz + 5MHzConnect Austria 0.120 billion 2x5MHz + 5MHzH3G 0.114 billion 2x5MHz + 5MHzTelefonica 0.118 billion 2x5MHz + 5MHz
BelgiumBelgacom Mobile (Proximus) 0.15 billion 2x15MHz + 5MHz
AuctionBASE 0.15 billion 2x15MHz + 5MHzMobistar 0.15 billion 2x15MHz + 5MHz
Denmark
TDC 0.127 billion 2x15MHz + 5MHz
Sealed-bid processTelia Denmark 0.127 billion 2x15MHz + 5MHzOrange 0.127 billion 2x15MHz + 5MHzH3G 0.127 billion 2x15MHz + 5MHz
FranceOrange France 619 million,
plus a 1% tax onUMTS revenues
2x15MHz + 5MHzBeauty contestSFR 2x15MHz + 5MHz
Bouygues Telecom 2x15MHz + 5MHz
Germany
Vodafone D2 8.4 billion 2x5MHz + 5MHz
Auction
T-Mobile Deutschland 8.5 billion 2x5MHz + 5MHzE-Plus 8.4 billion 2x5MHz + 5MHzO2 Germany 8.4 billion 2x5MHz + 5MHzMobilcom* 8.4 billion 2x5MHz + 5MHzQuam (3G Group) 8.4 billion 2x5MHz + 5MHz
Italy
TIM 2.417 billion 2x10MHz + 5MHzHybrid:
auction and beauty contest
Vodafone Omnitel 2.448 billion 2x10MHz + 5MHzWind 2.427 billion 2x10MHz + 5MHzISPE2000 2.442 billion 2x15MHz + 5MHzAndala (H3G) 2.427 billion 2x15MHz + 5MHz
The Netherlands
KPN Mobile 0.7 billion 2x15 MHz +5MHz
AuctionVodafone (Libertel) 0.7 billion 2x15 MHz +5MHzOrange (Dutchtone) 0.4 billion 2x10 MHzTelfort 0.4 billion 2x10 MHzT-Mobile Netherlands 0.4 billion 2x10 MHz
Spain
Telefonica Moviles 0.13 billion 2x15MHz + 5MHz
Beauty contestVodafone Spain (Airtel) 0.13 billion 2x15MHz + 5MHzAmena 0.13 billion 2x15MHz + 5MHzXfera 0.13 billion 2x15MHz + 5MHz
United Kingdom
Vodafone UK 9.85 billion 2x15MHz + 5MHz
AuctionO2 UK 6.65 billion 2x10MHz + 5MHzOrange UK 6.75 billion 2x10MHz + 5MHzT-Mobile UK 6.61 billion 2x10MHz + 5MHzHutchison 3G UK 7.23 billion 2x15MHz
Sou
rce:
ID
AT
E


Annex
Mobile Market Data

Mobile 2007 52
Annex | Mobile Market Data
1. Key general indicators
Population million (December 2005) 60.7
Mobile customers million (Start of July 2006) 48.7
Cellular penetration % (Start of July 2006) 80.1
2. Key market indicators
ARPU 1 EUR (December 2005) 33.3
MoU 2 minutes (December 2005) 235
Prepaid % (December 2005) 36.1
3G customers million (Start of July 2006) 2.7
3. Mobile operators market share
Orange France % (Start of July 2006) 47
SFR % (Start of July 2006) 36
Bouygues Telecom % (Start of July 2006) 17
4. Mobile customers and penetration rate
MOBILE SERVICES 2002 2003 2004 2005 2006 2007 2008 2009 2010
Mobile customers thousand 37 343 40 389 43 140 46 459 50 000 53 754 56 738 58 391 60 405
Annual change % - 8.2 6.8 7.7 7.6 7.5 4.9 3.6 3.4
Density % population 62.3 67.1 71.4 76.6 82.1 88.0 92.0 95.0 98.0
France
Sou
rce:
ID
AT
ES
ourc
e: ID
AT
ES
ourc
e: ID
AT
ES
ourc
e: ID
AT
E
1 net service revenue per user2 outgoing call traffic per customer per month

Mobile 2007 53
Annex | Mobile Market Data
Germany
1. Key general indicators
Population million (December 2005) 82.4
Mobile customers million (Start of July 2006) 82.0
Cellular penetration % (Start of July 2006) 99.5
2. Key market indicators
ARPU 1 EUR (December 2005) 26.0
MoU 2 minutes (December 2005) 80.0
Prepaid % (December 2005) 49.6
3G customers million (Start of July 2006) 3.9
3. Mobile operators market share
T-Mobile Germany % (Start of July 2006) 37
Vodafone Germany % (Start of July 2006) 36
E-Plus % (Start of July 2006) 14
O2 Germany % (Start of July 2006) 13
4. Mobile customers and penetration rate
MOBILE SERVICES 2002 2003 2004 2005 2006 2007 2008 2009 2010
Mobile customers thousand 59 177 64 793 71 314 79 182 85 046 88 169 89 783 90 563 91 334
Annual change % - 9.5 10.1 11.0 7.4 3.7 1.8 0.9 0.9
Density % population 71.9 78.6 86.5 96.1 103.2 107.0 109.0 110.0 111.0
Sou
rce:
ID
AT
ES
ourc
e: ID
AT
ES
ourc
e: ID
AT
ES
ourc
e: ID
AT
E1 net service revenue per user2 outgoing call traffic per customer per month

Mobile 2007 54
Annex | Mobile Market Data
Italy
1. Key general indicators
Population million (December 2005) 58.1
Mobile customers million (Start of July 2006) 75.3
Cellular penetration % (Start of July 2006) 129.6
2. Key market indicators
ARPU 1 EUR (December 2005) 25.7
MoU 2 minutes (December 2005) 118.0
Prepaid % (December 2005) 91
3G customers million (Start of July 2006) 13.9
3. Mobile operators market share
TIM % (Start of July 2006) 40
Vodafone Italy % (Start of July 2006) 32
Wind % (Start of July 2006) 19
3 Italy % (Start of July 2006) 9
4. Mobile customers and penetration rate
MOBILE SERVICES 2002 2003 2004 2005 2006 2007 2008 2009 2010
Mobile customers thousand 54 300 58 644 62 661 71 514 80 000 84 896 87 218 88 933 90 041
Annual change % - 4.3 10.6 14.1 11.9 6.1 2.7 2.0 1.2
Density % population 93.7 97.7 107.9 123.1 137.6 146.0 150.0 153.0 155.0
Sou
rce:
ID
AT
ES
ourc
e: ID
AT
ES
ourc
e: ID
AT
ES
ourc
e: ID
AT
E1 net service revenue per user2 outgoing call traffic per customer per month
Mobile 2007 55
Annex | Mobile Market Data
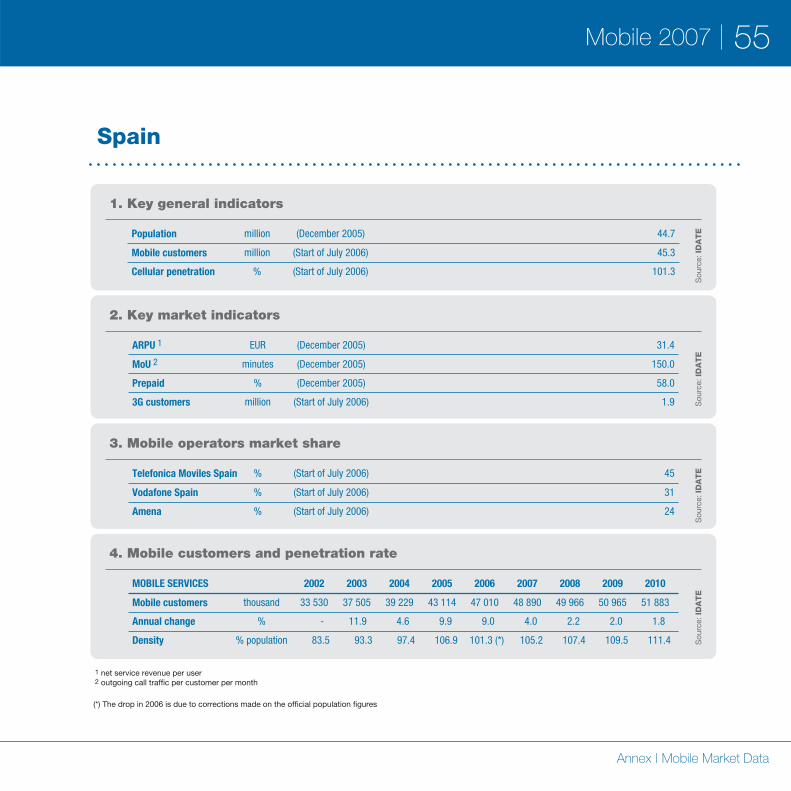
Spain
1. Key general indicators
Population million (December 2005) 44.7
Mobile customers million (Start of July 2006) 45.3
Cellular penetration % (Start of July 2006) 101.3
2. Key market indicators
ARPU 1 EUR (December 2005) 31.4
MoU 2 minutes (December 2005) 150.0
Prepaid % (December 2005) 58.0
3G customers million (Start of July 2006) 1.9
3. Mobile operators market share
Telefonica Moviles Spain % (Start of July 2006) 45
Vodafone Spain % (Start of July 2006) 31
Amena % (Start of July 2006) 24
4. Mobile customers and penetration rate
MOBILE SERVICES 2002 2003 2004 2005 2006 2007 2008 2009 2010
Mobile customers thousand 33 530 37 505 39 229 43 114 47 010 48 890 49 966 50 965 51 883
Annual change % - 11.9 4.6 9.9 9.0 4.0 2.2 2.0 1.8
Density % population 83.5 93.3 97.4 106.9 101.3 (*) 105.2 107.4 109.5 111.4
Sou
rce:
ID
AT
ES
ourc
e: ID
AT
ES
ourc
e: ID
AT
ES
ourc
e: ID
AT
E(*) The drop in 2006 is due to corrections made on the official population figures
1 net service revenue per user2 outgoing call traffic per customer per month

Mobile 2007 56
Annex | Mobile Market Data
United Kingdom
1. Key general indicators
Population million (December 2005) 60.4
Mobile customers million (Start of July 2006) 68.0
Cellular penetration % (Start of July 2006) 112.9
2. Key market indicators
ARPU 1 EUR (December 2005) 27.7
MoU 2 minutes (December 2005) 145.0
Prepaid % (December 2005) 66.3
3G customers million (Start of July 2006) 7.6
3. Mobile operators market share
O2 UK % (Start of July 2006) 25
Vodafone UK % (Start of July 2006) 24
Orange UK % (Start of July 2006) 22
T-Mobile UK % (Start of July 2006) 24
3 UK % (Start of July 2006) 5
4. Mobile customers and penetration rate
MOBILE SERVICES 2002 2003 2004 2005 2006 2007 2008 2009 2010
Mobile customers thousand 50 888 54 494 62 143 67 754 69 200 70 561 71 914 73 214 74 461
Annual change % - 7.1 14.0 9.0 2.1 2.0 1.9 1.8 1.7
Density % population 84.9 90.7 103.1 112.1 114.2 116.1 118.0 119.8 121.5 S
ourc
e: ID
AT
ES
ourc
e: ID
AT
ES
ourc
e: ID
AT
ES
ourc
e: ID
AT
E
1 net service revenue per user2 outgoing call traffic per customer per month

Mobile 2007 57
Annex | Mobile Market Data
USA
1. Key general indicators
Population million (December 2005) 295.8
Mobile customers million (Start of July 2006) 220.6
Cellular penetration % (Start of July 2006) 74.6
2. Key market indicators
ARPU 1 EUR (December 2005) 39.0
MoU 2 minutes (December 2005) na
Prepaid % (December 2005) 10-20
3G customers million (Start of July 2006) 11.9
3. Mobile operators market share
Cingular Wireless % (Start of July 2006) 26
Verizon Wireless % (Start of July 2006) 25
Sprint Nextel % (Start of July 2006) 23
T-Mobile USA % (Start of July 2006) 11
Others % (Start of July 2006) 15
4. Mobile customers and penetration rate
MOBILE SERVICES 2002 2003 2004 2005 2006 2007 2008 2009 2010
Mobile customers thousand 140 767 158 722 182 140 207 896 232 750 252 958 270 404 285 044 296 796
Annual change % - 12.8 14.8 14.1 12.0 8.7 6.9 5.4 4.1
Density % population 48.9 54.7 62.2 70.3 78.0 84.0 89.0 93.0 96.0
Sou
rce:
ID
AT
ES
ourc
e: ID
AT
ES
ourc
e: ID
AT
ES
ourc
e: ID
AT
E1 net service revenue per user2 outgoing call traffic per customer per month

Mobile 2007 58
Annex | Mobile Market Data
China
1. Key general indicators
Population million (December 2005) 1 284.3
Mobile customers million (Start of July 2006) 410.9
Cellular penetration % (Start of July 2006) 32
2. Key market indicators
ARPU 1 EUR (December 2005) 7.8
MoU 2 minutes (December 2005) na
Prepaid % (December 2005) 60-66
3G customers million (Start of July 2006) 0
3. Mobile operators market share
China Mobile % (Start of July 2006) 67
China Unicom % (Start of July 2006) 33
4. Mobile customers and penetration rate
MOBILE SERVICES 2002 2003 2004 2005 2006 2007 2008 2009 2010
Mobile customers thousand 207 500 268 649 317 602 374 446 450 000 535 000 630 000 695 000 770 000
Annual change % - 29.5 18.2 17.9 20.2 18.9 17.8 10.3 10.8
Density % population 16.2 20.9 24.7 29.2 35.0 41.7 49.1 54.1 60.0
Sou
rce:
ID
AT
ES
ourc
e: ID
AT
ES
ourc
e: ID
AT
ES
ourc
e: ID
AT
E
1 net service revenue per user2 outgoing call traffic per customer per month

Mobile 2007 59
Annex | Mobile Market Data
Japan
1. Key general indicators
Population million (December 2005) 127.4
Mobile customers million (Start of July 2006) 92.9
Cellular penetration % (Start of July 2006) 72.9
2. Key market indicators
ARPU 1 EUR (December 2005) 57.3
MoU 2 minutes (December 2005) na
Prepaid % (December 2005) 3.4
3G customers million (Start of July 2006) 39.4
3. Mobile operators market share
NTT Docomo % (Start of July 2006) 56
KDDI % (Start of July 2006) 28
Softbank Mobile % (Start of July 2006) 16
4. Mobile customers and penetration rate
MOBILE SERVICES 2002 2003 2004 2005 2006 2007 2008 2009 2010
Mobile customers thousand 73 500 79 800 85 500 90 200 95 612 101 349 107 430 111 727 116 196
Annual change % - 8.8 7.1 5.5 6.0 6.0 6.0 4.0 4.0
Density % population 57.8 62.7 67.1 70.8 75.0 79.5 84.3 87.7 91.4
Sou
rce:
ID
AT
ES
ourc
e: ID
AT
ES
ourc
e: ID
AT
ES
ourc
e: ID
AT
E
1 net service revenue per user2 outgoing call traffic per customer per month

Mobile 2007 60
Annex | Mobile Market Data
South Korea
1. Key general indicators
Population million (December 2005) 48.6
Mobile customers million (Start of July 2006) 39.4
Cellular penetration % (Start of July 2006) 81.0
2. Key market indicators
ARPU 1 EUR (December 2005) 26.6
MoU 2 minutes (December 2005) na
Prepaid % (December 2005) 3-5
3G customers million (Start of July 2006) 14.2
3. Mobile operators market share
SK Telecom % (Start of July 2006) 51
KTF % (Start of July 2006) 32
LG Telecom % (Start of July 2006) 17
4. Mobile customers and penetration rate
MOBILE SERVICES 2002 2003 2004 2005 2006 2007 2008 2009 2010
Mobile customers thousand 32 343 33 592 36 588 38 342 40 067 41 790 43 504 45 244 46 872
Annual change % - 3.9 8.9 4.8 4.5 4.3 4.1 4.0 3.6
Density % population 67.4 69.7 75.6 78.8 82.0 85.2 88.4 91.6 94.6
Sou
rce:
ID
AT
ES
ourc
e: ID
AT
ES
ourc
e: ID
AT
ES
ourc
e: ID
AT
E
1 net service revenue per user2 outgoing call traffic per customer per month


ENTER
Enter is IE business school’s Center for the Analysis of the Information Society and Telecommunications. It is the leading Spanish think tank on this field, providing information, analysis and forecasting from a digital convergence perspective.
Enter has arrived at a unique positioning in Spain in relation to similar centers by offering the following distinguishing features:
A multidisciplinary focus, encompassing technological, economic, social and regulatory aspects of the digital convergence process.
Independence, combining private and public sector entities on its board.
International outreach, developing a network with some of the most prestigious think tanks and research centers worldwide.
A future-oriented approach, basing its analyses not only on the current context but also on future scenarios.
Enter’s core activities include the dissemination of knowledge, preparation of reports, project development, organization of workshops and consulting services.
•
•
•
•Enter enjoys the support of the following companies and organisations:
AbertisAccentureAlcatel-LucentAETICOrange
Economy Society
Technology Regulation
TelecomElectronics
IT
Media
DigitalConvergence
IntelIT DeustoMicrosoftRed.esTelefónica

IDATE
Since 1977, IDATE has established itself over the years as one of the leading centres for exchange and analysis in Europe, specialising in the Telecommunications, Internet and Media sectors.
Consulting: present in all of the sectors’ strategic developments IDATE has established its credibility and independence in leading consultancy and study missions on behalf of its clients, for whom, its multidisciplinary teams of economists and engineers are in a position to analyse the impact of market, regulatory and technological evolutions on their business and strategies.
Reports and publications: a truly global Observatory on the Communications and Information Technology sectors IDATE relies on its specialised teams and continuous investment in its information and strategic monitoring system – Observatory of the digital world – in order to publish a thorough portfolio of sectorial and thematic reports which are regularly up-dated. Among them, stands out DIGIWORLD the World Observatory of the Information and Technology sectors.
A Forum focusing on Europe’s Information and Communication Technologies IDATE has set in place a platform enabling an exchange between company heads, public policy makers and the academic world :
The IDATE Foundation was set-up with the impetus of driving open and independent
•
reflection, associating the largest businesses involved in the sector. Today, it gathers more than 25 international groups (Telecommunications operators, TV channels, manufacturers, software services, banks and financial organisations, ...).
DigiWorld Summit (14-15 November 2007) has become established as an annual conference serving as a point of reference for those company heads, public policy makers and experts who come together to debate the issues at stake in the future of Information Technology.
IDATE also embraces the world of academic research. Notably through its economic journal COMMUNICATIONS & STRATEGIES, a quarterly research and analysis publication with the very best economic analysis and covering the major issues facing businesses.
•
•
IDATE FoundationCOMMUNICATIONS & STRATEGIES journal
DigiWorld Summit
Training & seminars
Market Research
Internationalbenchmark
Public policyAssessment
FORUM
CO
NSU
LTING
RESEARCH
DigiWorld yearbook
Market reports & database
Services & subscription


Mobile 2007
Copyright © 2007By ENTER and IDATE
Published byENTERMaria de Molina, 6 - 1ª28006 Madrid (Spain)www.enter.es
Design, Edition & Layout:ideas4design
Printed by:OMÁN Impresores
All rights reserved. No part of this publication may be reproduced, stored in a retrieval system, or transmitted, in any form or by any means, electronic, mechanical, photocopying, recording, or otherwise, without the prior permission of ENTER or IDATE.
Legal Deposit: M-5424-2007Printed in Spain
All data and information published in this report are taken from the following IDATE market reports:
‘World Telecom Equipment Market’(IDATE, Atlas Collection, 2007 edition)
‘World Telecom Services Market’(IDATE, Atlas Collection, 2007 edition)
‘Mobile Terminal Monitoring’(IDATE, Monitoring Collection, 2007 edition)
‘Radio Spectrum - Key issues’(IDATE, Analysis Collection, 2007 edition)
‘Telecoms in Europe’(IDATE, Analysis Collection, 2007 edition)
‘3.5-4G - Mobile Operators’ Strategies’(IDATE, Analysis Collection, 2007 edition)
‘Video Games on Mobile phones - challenges & outlook’(IDATE, Focus Collection, 2007 edition)
‘Podcasting’(IDATE, Focus Collection, 2007 edition)
‘Fixed-Mobile Convergence’(IDATE, Focus Collection, 2007 edition)
‘Broadband Wireless Access - Potential for mobile WiMAX & alternative BWA technologies’(IDATE, Focus Collection, 2006 edition)
‘Digital Home - Any Content, Anytime, Anywhere on any device?’(IDATE, Focus Collection, 2006 edition)
‘Mobile Consumer Electronics - the era of nomadic content’(IDATE, Focus Collection, 2006 edition)
‘MVNO - The new deal’(IDATE, Focus Collection, 2006 edition)
Contact: Marshall Shrago - tél : +33 467 144 488 - [email protected]


w w w.idate.orgw w w.enter.es
Consulting & Research