Embed Size (px)
Citation preview

Accessing China Roadshow: Latest Developments
September 2016
Markets and Securities Services

• China A Shares - Potential Transition To Global Indexes
• Shanghai & Shenzhen - Hong Kong Stock Connect, You Need To Get Ready Now
• China Connect - Launch of Shenzhen - Hong Kong Stock Connect
• China Interbank Bond Market Access
Summary

FTSE Russell 3
ftserussell.com
China A SharesPotential transition to global indexes
September 2016
Sudir Raju, Manging Director

FTSE Russell 4
FTSE Russell is not an investment firm and this pre sentation is not advice about any investment activity. None of the information in this presentation or reference to a FTSE Russell index constitutes an offer to buy or sell, or a promotion of, a security. This presentation is solely for informati onal purposes. Accordingly, nothing contained in this presentation is intended to constitute legal, tax, securities, or investment advice, nor an opinion re garding the appropriateness of making any investment through our indexes.
Views expressed here are subject to change. These v iews do not necessarily reflect the opinion of FTSE Russell or the London S tock Exchange Group plc.

FTSE Russell 5
• China’s investment landscape
• Investor access to mainland China
• Investment schemes for accessing mainland China
• FTSE country classification approach
• Index reviews of China A-shares
• FTSE Russell’s toolset to support our clients - FTSE Global China A Inclusion Indexes
• Any Questions?
Agenda

FTSE Russell 6
China’s investment landscape (1)
1. Largest economy in the world in PPP terms1
- Largest manufacturer in the world2
- Largest online retail market in the world3#
- Largest share of global greenhouse gas emissions (28%)4
- Largest investor in renewable energy5
- Largest population in the world (1.4 billion) 6
2. Second largest equity market in the world7
3. Third largest fixed income market in the world7
1. International Monetary Fund, April 20162. McKinsey, June, 20133. Morgan Stanley, 13 March, 2015. # China is also expected to become the world’s largest retail market by 2018, 4. International Monetary Fund, April 20165. The Financial Times, 9 January, 20156. World Bank, 20147. FTSE Russell

FTSE Russell 7
China’s investment landscape (2)
• Listings on the Shanghai & Shenzhen Stock Exchanges have almost doubled in the past 10 years
• Total market value has increased by a multiple of 6
Shanghai & Shenzhen Stock Exchanges Total Company Listings (2006-2015)
0
500
1,000
1,500
2,000
2,500
3,000
2006 2007 2008 2009 2010 2011 2012 2013 2014 2015
Num
ber
of C
ompa
nies
0
1,000
2,000
3,000
4,000
5,000
6,000
7,000
8,000
9,000
2006 2007 2008 2009 2010 2011 2012 2013 2014 2015
Tot
al M
arke
t Val
ue (
US
Dbn
)
Shanghai & Shenzhen Stock Exchanges Total Market Value USDbn (2006-2015)
Source: Shanghai & Shenzhen Stock Exchanges - data as at 31 May 2016

FTSE Russell 8
China’s investment landscape (3)
• China’s equity market expansion is influencing global markets
• 7 of the top 10 companies in Asia Pacific are from China
• 4 of the top 10 global banks are from China
Rank Company Country
Total Market Value
(USDbn)
1 China Mobile China 233.5
2 ICBC China 224.5
3 Tencent Holdings China 209.1
4 PetroChina China 195.7
5 China Construction Bank China 162.2
6 Toyota Motor Japan 159.6
7 Agricultural Bank of China China 153.7
8 Bank of China China 141.6
9 Samsung Electronics South Korea 135.5
10 Taiwan Semiconductor Taiwan 123.6
Top Ten Companies – Asia Pacific
Rank Company Country
Total Market Value
(USDbn)
1 Wells Fargo & Company USA 256.5
2 JPMorgan Chase & Co USA 240.3
3 ICBC China 224.5
4 China Construction Bank China 162.2
5 Bank of America USA 154.4
6 Agricultural Bank of China China 153.7
7 Bank of China China 141.6
8 Citigroup USA 138.7
9 HSBC Holdings UK 126.4
10 Commonwealth Bk of Aus Australia 95.3
Top Ten Companies – Global Banks
Source: FTSE Russell - data as at 31 May 2016

FTSE Russell 9
China’s investment landscape (4)
• International investors only hold a small proportion of China A-shares
• The Shanghai and Shenzhen Stock Exchanges at the end of March 2016 had a combined market value of USD 7 trillion
• Total aggregate approved QFII/RQFII quota was USD 153.9 billion
• Total international take-up of China A-shares is 2~3%
Source: FTSE Russell, SAFE, Shanghai & Shenzhen Stock Exchanges - data as at 31 March 2016

FTSE Russell 10
Investor access to China via overseas listings
• P Chips have the largest number of listings but H-shares are the largest by weight
• N-shares market values have grown considerably since Alibaba’s listing in 2014
57
136
23
167
617
Number of Constituents
1.9
39.4
19.2
22.4
16.90.3
Weight in Universe (%)
B-shares H-shares N-shares P Chips Red Chips S Chips
Source: FTSE Russell - data as at 31 May 2016

FTSE Russell 11
China A -shares are significantly larger than other China share class listings
• A-shares are largest by number and listing
• Only a small number of investors have access to the mainland market
Number of Constituents Weight in Universe (%)
57 13623
167
617
1,541
0.7 14.1
6.9
8.0
6.00.1
64.2
B-shares H-shares N-shares P Chips Red Chips S Chips A-shares
Source: FTSE Russell - data as at 31 May 2016

FTSE Russell 12
China Share Classes – A-shares
• Largest industries – Basic Materials, Industrials, Consumer Goods & Financials
• Limited exposure to Oil & Gas, Telecoms & Utilities
A-shares
Source: FTSE Russell - data as at 31 May 2016
1.7 11.5
21.7
14.86.75.6
2.8
28.4
6.3 Oil & Gas
Basic Materials
Industrials
Consumer Goods
Health Care
Consumer Services
Telecoms
Utilities
Financials
Technology
Traditional industries = 48%
New economy industries = 19%

FTSE Russell 13
China Share Classes – H-shares
A-shares
Source: FTSE Russell - data as at 31 May 2016
1.7 11.5
21.7
14.86.75.6
2.8
28.4
6.3 9.04.0
9.8
4.32.61.31.8
2.363.8
1.2
H-sharesOil & Gas
Basic Materials
Industrials
Consumer Goods
Health Care
Consumer Services
Telecoms
Utilities
Financials
Technology
• H-shares are dominated by Financials
Financials account for 64%
Traditional industries = 18%

FTSE Russell 14
China Share Classes – P Chips
A-shares
Source: FTSE Russell - data as at 31 May 2016
1.7 11.5
21.7
14.86.75.6
2.8
28.4
6.3 9.04.0
9.8
4.32.61.31.8
2.363.8
1.2
H-shares P Chips3.4 4.4
4.6
14.8
4.0
5.22.1
7.8
53.8
Oil & Gas
Basic Materials
Industrials
Consumer Goods
Health Care
Consumer Services
Telecoms
Utilities
Financials
Technology
• P Chips are dominated by Technology (i.e. Tencent)
Technology accounts for 54%

FTSE Russell 15
China Share Classes – N-shares
A-shares
Source: FTSE Russell - data as at 31 May 2016
1.7 11.5
21.7
14.86.75.6
2.8
28.4
6.3 9.04.0
9.8
4.32.61.31.8
2.363.8
1.2
H-shares P Chips3.4 4.4
4.6
14.8
4.0
5.22.1
7.8
53.8
N-shares0.4 0.6
61.6
0.2
37.2
Oil & Gas
Basic Materials
Industrials
Consumer Goods
Health Care
Consumer Services
Telecoms
Utilities
Financials
Technology
• N-share are dominated by Consumer Services (Alibaba = 43%) & Technology (Baidu = 24%)
Consumer Services
Technology

FTSE Russell 16
China Share Classes – Red Chips
A-shares
Source: FTSE Russell - data as at 31 May 2016
1.7 11.5
21.7
14.86.75.6
2.8
28.4
6.3 9.04.0
9.8
4.32.61.31.8
2.363.8
1.2
H-shares P Chips3.4 4.4
4.6
14.8
4.0
5.22.1
7.8
53.8
N-shares Red Chips12.4
0.3
16.9
2.32.6
37.6
7.4
17.62.5
Oil & Gas
Basic Materials
Industrials
Consumer Goods
Health Care
Consumer Services
Telecoms
Utilities
Financials
Technology
0.4 0.6
61.6
0.2
37.2
• Telecoms, Oil & Gas, Industrials & Financials account for 85% of Red Chips
• China Mobile is the largest Red Chip (34%)
Telecoms
Industrials
Oil & GasFinancials

FTSE Russell 17
China Share Classes – B-shares
A-shares
Source: FTSE Russell - data as at 31 May 2016
1.7 11.5
21.7
14.86.75.6
2.8
28.4
6.3 9.04.0
9.8
4.32.61.31.8
2.363.8
1.2
H-shares P Chips3.4 4.4
4.6
14.8
4.0
5.22.1
7.8
53.8
N-shares Red Chips B-shares
12.40.3
16.9
2.32.6
37.6
7.4
17.62.5 7.9
28.4
32.6
1.5
12.0
3.2
10.24.2
Oil & Gas
Basic Materials
Industrials
Consumer Goods
Health Care
Consumer Services
Telecoms
Utilities
Financials
Technology
0.4 0.6
61.6
0.2
37.2
• Basic Materials, Industrials & Consumers Goods account for 69% of all B-shares
Traditional industries = 69%

FTSE Russell 18
Access to China A -shares is limited via overseas listings
% of China A-shares by Market Cap Accessed by Other China Share Classes (May 2016)
34.4
7.2
3.0
23.7
0
5
10
15
20
25
30
35
40
FTSE China A LargeCap Index
FTSE China A MidCap Index
FTSE China A SmallCap Index
FTSE China A AllCap Index
Source: FTSE Russell - data as at 31 May 2016
• Only 24% of China A-share companies by market cap can be accessed by other China share classes
• Large cap China A-shares have the highest representation but still only 34%

FTSE Russell 19
China A -shares as a diversification tool
FTSE China A All Cap Index Rolling 12 Month Correlations (2006-2016)
10 Year Annualised Relative Returns Compared to the FTSE Global All Cap Index
(USD TRI %)
-2
0
2
4
6
8
10
12
14
16
FTSEChina A
Large CapIndex
FTSEChina AMid Cap
Index
FTSEChina A
Small CapIndex
FTSEChina A AllCap Index
FTSEChina AllCap Index
FTSEEmergingAll CapIndex
FTSE China All Cap IndexFTSE Emerging All Cap IndexFTSE Global All Cap Index
Source: FTSE Russell - data as at 31 May 2016
• Historically investor access to China A-shares has been via large caps that have shown lower returns
• China A-share mid/small cap indexes have performed strongly over past 10 years
• China A-share index correlations to global equities (incl. China) are low
-0.1
0
0.1
0.2
0.3
0.4
0.5
0.6
0.7
0.8
2006 2007 2008 2009 2010 2011 2012 2013 2014 2015
Co
rre
lati
on
Past performance is no guarantee of future results. Returns shown may reflect hypothetical historical performance. Please see the page 50 for important legal disclosures.
FTSE Russell 20
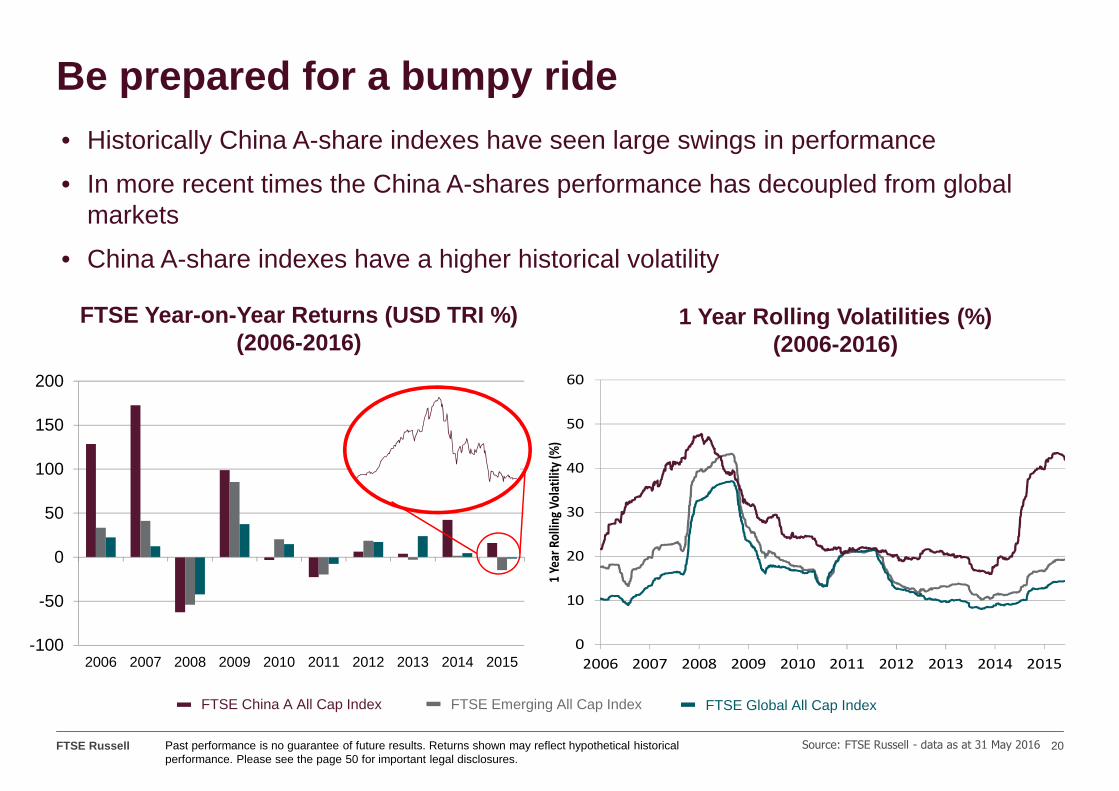
Be prepared for a bumpy ride
1 Year Rolling Volatilities (%) (2006-2016)
FTSE Year-on-Year Returns (USD TRI %)(2006-2016)
-100
-50
0
50
100
150
200
2006 2007 2008 2009 2010 2011 2012 2013 2014 2015
FTSE China A All Cap Index FTSE Emerging All Cap Index FTSE Global All Cap Index
Source: FTSE Russell - data as at 31 May 2016
• Historically China A-share indexes have seen large swings in performance
• In more recent times the China A-shares performance has decoupled from global markets
• China A-share indexes have a higher historical volatility
0
10
20
30
40
50
60
2006 2007 2008 2009 2010 2011 2012 2013 2014 2015
1 Y
ear
Ro
llin
g V
ola
tilit
y (%
)
Past performance is no guarantee of future results. Returns shown may reflect hypothetical historical performance. Please see the page 50 for important legal disclosures.
FTSE Russell 21
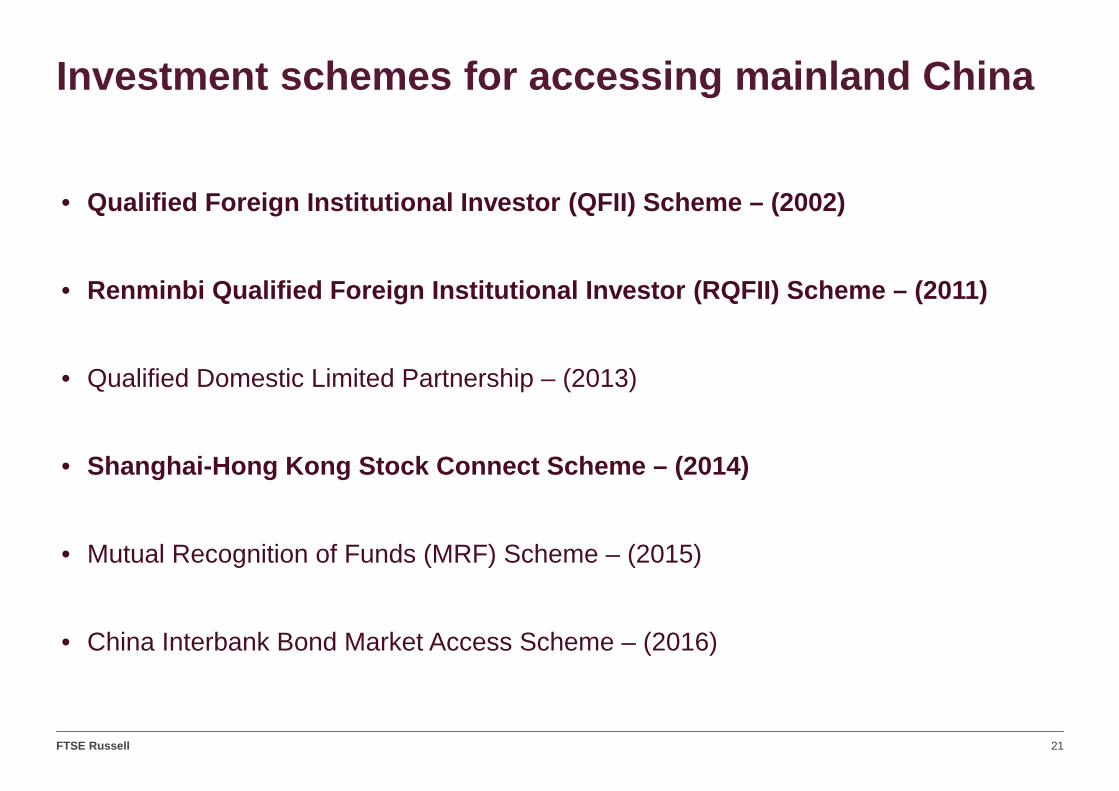
Investment schemes for accessing mainland China
• Qualified Foreign Institutional Investor (QFII) Sch eme – (2002)
• Renminbi Qualified Foreign Institutional Investor ( RQFII) Scheme – (2011)
• Qualified Domestic Limited Partnership – (2013)
• Shanghai-Hong Kong Stock Connect Scheme – (2014)
• Mutual Recognition of Funds (MRF) Scheme – (2015)
• China Interbank Bond Market Access Scheme – (2016)

FTSE Russell 22
Investment schemes for accessing China A -shares –QFII, RQFII and Stock Connect
Source: FTSE Russell, CSRC, SAFE
QFII RQFII Shanghai-Hong Kong Stock Connect (North Bound)
Launch Year 2002 2011 2014
Scheme Currency USD RMB RMB
Eligible Entities Commercial banks, securities companies, fund management firms, insurance companies, pension funds, sovereign wealth funds. Size and operational experience qualifications apply
Financial institutions based in 15 jurisdictions e.g. USA, Hong Kong, U.K., France, Singapore, Germany, South Korea, Australia, Switzerland, Luxembourg, Canada
All Hong Kong and overseas investors (including both retail and institutional)
No approval needed
Eligible Investments Stocks, bonds, funds, warrants, IPOs, index futures
Same as QFII • All constituents stocks of SSE180 and 380 Indexes
• All dual listed shares (H shares that have A-shares in Shanghai SE)
• Exceptions: Stocks on “risk alert board”, IPOs
Total Allocated Quota and # of Licensees(May 2016)
USD 81bn, 273 entities RMB 502bn (USD 76bn), 165 entities • RMB 300bn (USD46bn) in aggregate balance
• RMB 13bn (USD2bn ) daily cap.
Liquidity • 3 months lock up period (Was 1 year, before Feb. 2016)
• Open-ended funds can invest/repatriate on a daily basis (Was weekly, before Feb 2016)
• Cannot repatriate more than 20% of previous year end’s total assets each month
• Open-Ended Funds: 1-year injection period. Daily injection and repatriation, no lock up period
• Other products: 6 month investment period, 1 year lock-up, monthly repatriation
• Daily and no restriction for sell transaction
• Buy- trades are subject to quota on a net buy
• Cannot buy-sell-then-buy the same stock on the same day
FTSE Russell 23
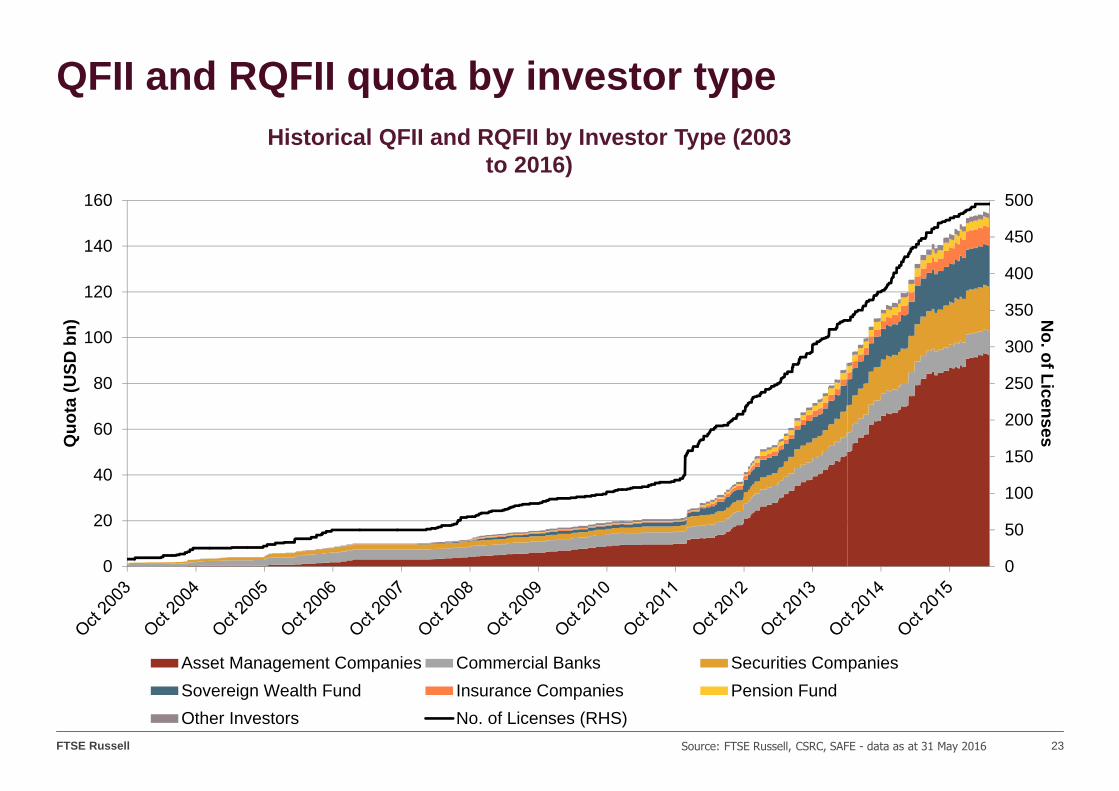
QFII and RQFII quota by investor type
Source: FTSE Russell, CSRC, SAFE - data as at 31 May 2016
Historical QFII and RQFII by Investor Type (2003 to 2016)
0
50
100
150
200
250
300
350
400
450
500
0
20
40
60
80
100
120
140
160
No. of Licenses
Quo
ta (
US
D b
n)
Asset Management Companies Commercial Banks Securities Companies
Sovereign Wealth Fund Insurance Companies Pension Fund
Other Investors No. of Licenses (RHS)

FTSE Russell 24
FTSE country classification approach
• Process is carried out annually in September
• Classifies countries as either developed, advanced emerging, secondary emerging or frontier
• Assessment on twenty one “Quality of Markets” criteria and on the country’s economic status as measured by GNI per capita
• China A-share market has been on the Watch List for potential inclusion in secondary emerging since 2005
• It fails two tests out of the nine Secondary Emerging Quality of Markets criteria based on review results of September 2015
24

FTSE Russell 25
FTSE country classification approach
FTSE Quality of Markets Criteria for the China A-sh ares Market
CRITERIA Secondary Emerging
China A-share2015
MARKET AND REGULATORY ENVIRONMENT
Formal stock market regulatory authorities actively monitor market (e.g. SEC, FSA, SFC) x Pass
No objection to or significant restrictions or penalties applied to the investment of capital or the repatriation of capital and income
x Not met
CUSTODY AND SETTLEMENT
Settlement – Rare incidence of failed trades x Pass
Custody – Sufficient competition to ensure high-quality custodian services x Pass
Clearing & Settlement – T+3, T+5 for Frontier x T+0
DEALING LANDSCAPE
Brokerage – Sufficient competition to ensure high quality broker services x Pass
Liquidity – Sufficient broad market liquidity to support sizable global investment x Pass
Transaction Costs – Implicit and explicit costs to be reasonable and competitive x Pass
Transparency – Market depth information / visibility and timely trade reporting process x Pass
Source: FTSE Group as at September 2013
25

FTSE Russell 26
FTSE country classification approach
Areas of Concern for the China A-shares Market
• Capital mobility, e.g. approval process, lock-up period and repatriation cycle of the QFII/RQFII schemes
• Settlement and clearing (security settlement on T+0, money settlement on T+1)
• Company suspensions
26

FTSE Russell 27
China Suspensions
27
0
2,000
4,000
6,000
8,000
10,000
12,000
0
100
200
300
400
500
600
700
2008 2009 2010 2011 2012 2013 2014 2015 2016
Index Value
Num
ber
of S
uspe
nsio
ns a
nd
Trad
ing
Hal
ts
Source: FTSE Russell, Bloomberg - data as at 31 May 2016
FTSE China A All Cap Index (RHS) Total (LHS)Suspensions Trading Halts
Number of Suspensions and Trading Halts in the FTSE China A All Cap Index (2008-2016)
• On 9 July 2015, 664 of the 1,424 constituents in the FTSE China A All Cap Index were suspended/halted
• On 31 May 2016, 121 companies or 5.94% are suspended/halted in the index

FTSE Russell 28
• Including China A-shares in the Asia Pacific ex Japan review universe would impact the index reviews
• China will become 55% of the review universe
• Large swings in market value would impact the review of other countries and increase turnover
• India would be the next largest market with 8.8%
• China should be reviewed as stand alone country
• Similar to how FTSE Russell reviews Japan
• All China share-classes will be reviewed in one universe
• FTSE Russell’s free float rule would need to be updated
• PetroChina is the 4th largest company (USD 195.7bn) in Asia Pacific but its A-share only has a free float of 2.5% (USD 4.5bn)
28
Index reviews of China A -shares

FTSE Russell 29
• Created to support the transition of China A-shares to FTSE’s Global Indexes
• The Inclusion Indexes offer various options, and an investor can determine which is most relevant:
• Allocation of A-shares based on aggregate quota granted to QFIIs and RQFIIs. As the quota amount increases the weight of China A-shares becomes larger in FTSE’s global benchmarks. This is the headline version of the China A Inclusion Indexes
• Allocation of A-shares based on the China’s foreign ownership limit, but not QFII/RQFII quota amounts. Inclusion indexes using this allocation method are referred to as China A Inclusion (No Quota) Indexes
• A customised allocation of A-shares
• Market participants who do not wish to have China A-shares in their global benchmarks can continue to use the FTSE Global Equity Index Series, which will remain unchanged
• The mechanism can accommodate other market access schemes, such as the Shanghai-HK and potentially the Shenzhen-HK Stock Connect programme, when they are considered suitable
29
FTSE Global China A Inclusion Indexes

FTSE Russell 30
0
5
10
15
20
25
30
35
40
Dec 2005 Dec 2007 Dec 2009 Dec 2011 Dec 2013 Dec 2015 Dec 2017 Dec 2019 Dec 2021 Dec 2023 Dec 2025
We
igh
t o
f C
hin
a A
-sh
are
s (%
)
000000000000 Time
China A-shares
weight adjusted
by Foreign
Ownership Limits
26.9%
3.0%
35.8%
4.4%
5.9%
0.5%
China A-shares
weight adjusted
by Free Float
Current
China A-shares
weight adjusted
by Aggregate
Approved Quota
Transition of China A -shares in Global Benchmarks
Weight in FTSE Emerging Markets All Cap China A Inc lusion Index
Weight in FTSE Global All Cap China A Inclusion Ind ex
Source: FTSE Russell - data as at 31 May 2016Past performance is no guarantee of future results. Returns shown may reflect hypothetical historical performance. Please seethe page 50 for important legal disclosures. This graph contains forward-looking representations based upon a number of assumptions concerning future conditions that ultimately may prove to be inaccurate.

FTSE Russell 3131
China’s expansion in various FTSE Emerging Markets All Cap Indexes (%)
25.0 23.518.3 16.0
5.9
26.935.8
0
10
20
30
40
50
60
China(excluding China
A-shares)
China(including China
A-shares at their aggregatequota)
China(including China
A-shares at their foreignownership adjusted weight)
China(including ChinaA-shares at their
free float adjustedweight)
%
China A-share B-share, H-share, Red chip, P chip
FTSE Emerging All Cap Index
FTSE Emerging Markets All Cap
China A Inclusion Index
FTSE Emerging Markets All Cap
China A Inclusion (No Quota) Index
Hypothetical index with neither FOL nor R/QFII quota restrictions for A-
shares
Source: FTSE Russell - data as at 31 May 2016

FTSE Russell 32
Summary & questions
• The FTSE Global China A Inclusion Indexes are tools to help clients transition/respond to the inclusion of China A-shares in global benchmarks
• The indexes are evolving to reflect changes in the China A-shares market and the needs of our clients
• The indexes includes China A-shares at a weighting equivalent to their aggregate approved R/QFII quota, foreign ownership limits and customised allocations
• In the headline version the weighting of China A-shares will increase as access to the mainland market increases
• FTSE Russell will continue to work with our clients and regulators/exchanges to support the inclusion of China A-shares in our benchmarks

FTSE Russell 33
Question
Q6. Should China A -shares be included in global benchmarks?
a) Yes, access is sufficient for their inclusion
b) No, it is too early for their inclusion
c) Still do not know

FTSE Russell 34
Disclaimer
© 2016 London Stock Exchange Group plc and its applicable group undertakings (the “LSE Group”). The LSE Group includes (1) FTSE International Limited (“FTSE”), (2) Frank Russell Company (“Russell”), (3) FTSE TMX Global Debt Capital Markets Inc. and FTSE TMX Global Debt Capital Markets Limited (together, “FTSE TMX”) and (4) MTSNext Limited (“MTSNext”). All rights reserved.
FTSE Russell® is a trading name of FTSE, Russell, FTSE TMX and MTS Next Limited. “FTSE®”, “Russell®”, “FTSE Russell®” “MTS®”, “FTSE TMX®”, “FTSE4Good®” and “ICB®” and all other trademarks and service marks used herein (whether registered or unregistered) are trade marks and/or service marks owned or licensed by the applicable member of the LSE Group or their respective licensors and are owned, or used under licence, by FTSE, Russell, MTSNext, or FTSE TMX.
All information is provided for information purposes only. Every effort is made to ensure that all information given in this publication is accurate, but no responsibility or liability can be accepted by any member of the LSE Group nor their respective directors, officers, employees, partners or licensors for any errors or for any loss from use of this publication or any of the information or data contained herein.
No member of the LSE Group nor their respective directors, officers, employees, partners or licensors make any claim, prediction, warranty or representation whatsoever, expressly or impliedly, either as to the results to be obtained from the use of the FTSE Russell Indexes or the fitness or suitability of the Indexes for any particular purpose to which they might be put.
No member of the LSE Group nor their respective directors, officers, employees, partners or licensors provide investment advice and nothing in this document should be taken as constituting financial or investment advice. No member of the LSE Group nor their respective directors, officers, employees, partners or licensors make any representation regarding the advisability of investing in any asset. A decision to invest in any such asset should not be made in reliance on any information herein. Indexes cannot be invested in directly. Inclusion of an asset in an index is not a recommendation to buy, sell or hold that asset. The general information contained in this publication should not be acted upon without obtaining specific legal, tax, and investment advice from a licensed professional.
No part of this information may be reproduced, stored in a retrieval system or transmitted in any form or by any means, electronic, mechanical, photocopying, recording or otherwise, without prior written permission of the applicable member of the LSE Group. Use and distribution of the LSE Group index data and the use of their data to create financial products require a licence from FTSE, Russell, FTSE TMX, MTSNext and/or their respective licensors.
Past performance is no guarantee of future results. Charts and graphs are provided for illustrative purposes only. Index returns shown may not represent the results of the actual trading of investable assets. Certain returns shown may reflect back-tested performance. All performance presented prior to the index inception date is back-tested performance. Back-tested performance is not actual performance, but is hypothetical. The back-test calculations are based on the same methodology that was in effect when the index was officially launched. However, back- tested data may reflect the application of the index methodology with the benefit of hindsight, and the historic calculations of an index may change from month to month based on revisions to the underlying economic data used in the calculation of the index.
This publication may contain forward-looking statements. These are based upon a number of assumptions concerning future conditions that ultimately may prove to be inaccurate. Such forward-looking statements are subject to risks and uncertainties and may be affected by various factors that may cause actual results to differ materially from those in the forward-looking statements. Any forward-looking statements speak only as of the date they are made and no member of the LSE Group nor their licensors assume any duty to and do not undertake to update forward-looking statements.

ftserussell.com

Shanghai & Shenzhen – Hong Kong Stock Connect
You Need To Get Ready Now
5 Sep 2016
Strictly Private and Confidential For Institutional Clients Only

Shenzhen VS Shanghai Connect I
Source: http://www.hkex.com.hk/eng/market/sec_tradinfra/chinaconnect/Documents/Briefing%20to%20Participants%20on%20Shenzhen-Hong%20Kong%20Stock%20Connect.pdfData as of Aug 20163
7
SZ Connect SH ConnectTrading Hours • Opening call auction: 9:15-9:25 • Opening call auction: 9:15-9:25
• Continuous auction: 9:30-11:30; 13:00-14:57 • Continuous auction: 9:30-11:30; 13:00-15:00
• Closing call auction: 14:57-15:00 • Not applicable
• Order can be sent 5 minutes prior to the start.
Order Cancellation Unexecuted Orders
• Can be cancelled during trading hours except 09:20-09:25 and 14:57-15:00
• Can be cancelled during trading hours except 09:20-09:25
Confirmed Orders
Order may be cancelled by SZSE trading system after it has been confirmed due to the unsuccessful order validation. An example of this is the order price exceeded the current price range.
• Not applicable
Eligible Stock • Around 880 (Main: ~270, SME: ~410, ChiNext: ~200) • Around 567
• Market Capitalization ~ RMB 15 Trillion (74%) • Market Capitalisation ~RMB 21.8 Trillion (85%)
• ADT : RMB230 bn (68%) • ADT : RMB137 bn (68%)
• Constituent stocks of the SZSE Component Index and SZSE Small/Mid Cap Innovation Index with market capitalization >= RMB 6 billion
• Constituent stocks of the SSE 180 Index and SSE 380 Index
• Shares dual listed on SZSE and SEHK (A+H shares)
• Shares dual listed on SSE and SEHK (A+H shares)
• Except : shares not traded in RMB; IPOs (Risk Warning Board: Can only Sell)
• ETF will be announced separately after Shenzhen-Hong Kong Stock Connect has been in operation for a period of time and upon the satisfaction of relevant conditions
• More focus on new industries securitye.g. Technology companies
• More focus on traditional industriese.g. banking and utility etc.

Shenzhen VS Shanghai Connect II
Source: http://www.hkex.com.hk/eng/market/sec_tradinfra/chinaconnect/Documents/Briefing%20to%20Participants%20on%20Shenzhen-Hong%20Kong%20Stock%20Connect.pdfData as of Aug 20163
8
SZ Connect SH ConnectEligible Investors •All HK and overseas investors except for ChiNext
Market of SZSE, only those investors who are institutional professional investors *
•All HK and overseas investors
Quota •Aggregate Quota abolished
•Daily Quota RMB 13bn •Daily Quota RMB 13bn
Fees •Same fees as Shanghai Connect
Operations model •Same model as Shanghai-Connect, same SPSA and integrated model applicable for Shenzhen Connect.
Pre-trade checking Require
CCASS 5-digit Stock Code
•00XXXX –>7XXXX (Main Board & SME Board)•300XXX -> 77XXX (ChiNext Market) (To be confirmed by HKEX)
•60XXXX -> 9XXXX
*Subject to resolution of related regulatory issues, other investors can trade ChiNext stocks listed on Shenzhen Stock Exchange

Trading Information
Source: http://www.hkex.com.hk/eng/market/sec_tradinfra/chinaconnect/Documents/Briefing%20to%20Participants%20on%20Shenzhen-Hong%20Kong%20Stock%20Connect.pdfData as of Aug 20163
9
Trading on Hong Kong Holidays Open only:• both SEHK and SSE/SZSE are open for business; and• banking services of both markets are open on the corresponding money settlement days
Order Types Limit orders only (SSE/SZSE limit orders may be executed at or better than the input price)
Order Modification Not allowed (must cancel and re-input order)
Board Lot 100 shares (applicable to buy orders only)
Odd Lot Sell orders only (should be made in one single order)
Max Order Size 1 mn shares
Spread Uniform at RMB 0.01
Price Limit •In general ±10% on previous closing price (±5% for ST and *ST stocks)•Price of buy orders must not be lower than 3% of current best bid price (in its absence the latest trade price; and in the absence of both then previous closing price)
Day (Turnaround) Trading Not allowed
Manual Trade / Block Trade Not allowed
Margin Trading •Only eligible A shares are allowed•SSE/SZSE may suspend margin trading in specific A shares if the volume of margin trading in such A shares exceeds a certain threshold
Stock Borrowing & Lending (SBL)
•Only allowed for (i) covered short selling and (ii) meeting pre-trade checking•Only eligible persons may lend China Connect Securities
Short Selling •Only eligible A shares are allowed (see List of Eligible SSE/SZSE Securities for Short Selling)•Short selling orders must be (i) flagged; (ii) in multiple of 100 shares and (iii) subject to tick rule•Short selling quantity of is subject to a daily limit (1%) and a 10-day cumulative limit (5%)•SSE/SZSE may suspend short selling of specific A shares if the short selling activities of such A shares exceed a certain threshold•There are reporting requirements (Short Selling Weekly Report, Large Open Short Position Report)•Short selling statistics are available on HKEX website to facilitate short selling
Non-trade Transfer Allowable for:•SBL for covered short selling purpose (not more than one month duration);•SBL for the purpose of satisfying the pre-trade checking (1 day duration which cannot be rolled over);•Transfers between EPs and their clients for the purpose of rectifying error trades;•Post-trade allocation of shares to different funds/sub-funds by fund managers;•Other situations specified by SSE, SZSE and ChinaClear.

Why Citi?
Citi is committed to the China business with a full end-to-end solution:• Complete end-to-end solution:
• Commitment to Stock Connect from day 1 of Stock Connect launch in October 2014 :
• Citi clients have been able to trade Stock Connect across all execution channels (high touch, algorithms and program trading)
• Research coverage of 143 A shares covered as of August (and 65 at launch) (Shanghai-listed: 90 / Shenzhen-listed: 53)
• No 1 foreign broker for SPSA account(Source: HKEx)
• CNH liquidity: Citibank is one of the 7 CNH Primary Liquidity Providers who is also a full-service broker
Best-in-classresearch
Tradeexecution
FXFacilitations
Post Trade andCustodian
1
40

Citi is ready for Shenzhen Connect
41
• Citi target to be ready to trade Shenzhen Connect on day 1 for all desks (High Touch, Program Trading, and Electronics Execution)
• Citi will handle the closing auction in Shenzhen (there is no closing auction in Shanghai)
• Citi algorithms will be optimized for seamless execution quality and consistency in Shenzhen
• Same Custodian and Trading accounts can be used for both Shanghai and Shenzhen

Citi ResearchCiti Research
• Global footprint :
• First mover in A-share coverage: covered 65 A-shares when SH-HK Connect launched in Oct 2014
• As of August 2016, Citi Research covers 143 A-shares (Shanghai-listed: 90/Shenzhen-listed: 53) with focus on
Healthcare, Media, Tech and Consumer
• Consistently ranked #1 for HK/China stock recommendation performance among 18 peers, per Starmine®
• 2016 Asia Institutional Investor(II) survey:
� The most improved firm: Citi racks up the biggest gains of the region’s best sell-side analysts
� 12 teams ranked Top 3: #1 in Property, #1 in Small/Mid-Cap, and #1 in Utilities;
� #2 in HK, #3 in Insurance, #3 in Oil & Gas, and #3 in Transportation
• 2015 II China survey: #1 in Utilities, #1 in Property, #1 in Small-Mid caps
42

Citi China Macro Day
LIU Mingkang Jean Claude Trichet
Former President of theEuropean Central Bank. MadeNewsweek's list of world's most
43
powerful Bernanke. “Person of Financial
along with He was
Ben named
the Year” Times
by the (2007),
“Policymaker of the Year” twiceby The International Economymagazine (1991 and 2007)
First Chairman of the China CommissionBanking Regulatory
(CBRC) between March 2003 andOctober 2011. He was also theDeputy Director of the Committeefor Economic Affairs of theNational Committee of the ChinesePeople’s Political ConsultativeConference and a member of theMonetary Policy Committee of thePeople‘s Bank of China.

Annual China Conference in Shenzhen and Macau
Alfred SchipkeResident Chief Rep. for China IMF
Andrew ShengDistinguished Fellow
Asia Global Institute. Chief Advisor to the
China Banking Regulatory Commission
Greg GibbCo-Chairman & CEO, Lufax
China’s Largest P2P Lender
James P RubinForeign Affairs Columnist Sunday Times
Ex-Chief spokesperson US State Dept
Jiemian YangVice President
Shanghai Institute for
International Studies
Lord Mervyn KingEconomist
Former Governor of the Bank of
England, and Chief of its Monetary
Policy Committee
Weiqun ChenFormer deputy Director of the
Office of the Board of Supervisors
The State-owned Assets Supervision
and Administration Commission of
the State Council (SASAC)
44

Citi China Stock Connect Daily
• Citi CN Stock Connect Daily, Weekly A/H Strategy Report, Southbound Stampede research series
45

A-Shares Conference and Explorer Series
• Annual Citi A-Share Conference in Hong Kong • A-Shares Explorer Series
cffr11
•
in Empero r
SAuqustXi'a
n, Terracot ta Ar ny
Mausoleum of the Fi rs
tO

Achieve Best Execution of China Equities with Citi
Citi’s Execution Consultants partner with you to provide Best Execution by helping you measure and manage implementation of your trades across channels:
High Touch trading desk: full-service trading team that manages your execution according to your bespoke requirements
Electronic Execution: a full suite of high-performance algorithms and DMA provided by a team of dedicatedalgorithmic trading experts who train and advise you on the optimal way to implement your strategy
Program Trading: a globally-integrated team to help you manage rebalances, inclusion and deletion events and cash flows across all markets globally in a seamless manner
CNH Funding:• Citigroup Global Markets can prefund client on T+0• For buy trades, clients can choose to settle T+0 or T+1 (We can also arrange extend settlement)• If you settle in CNH, no extra funding cost will be charged as it is embedded in the commission rate• If you settle in USD, Citigroup can facilitate FX trading and the funding cost will be reflected on the FX rate
provided by our FX desk.
Seamless liquidity and execution consulting:
47
Cash Swap / Pnotes
Stock Connect Yes Yes
QFII N/A Yes

CustodianCitibank NA• 4th largest custodian in the world
• US$15 trillion of assets under custody
• Leading proprietary network providing clients unique access to local market expertise and global reach
• Leading provider of integrated RMB/CNH banking and FX services
• Local Market Expertise on Stock Connect, QFII, RQFII and other China market access channels
Shanghai-Hong Kong Stock Connect 1st Anniversary Trading and Investor Education Awards by HKEx• Top 3 Largest SPSA Portfolio Value
• Top 3 Highest Number of SPSA Accounts Opened
48
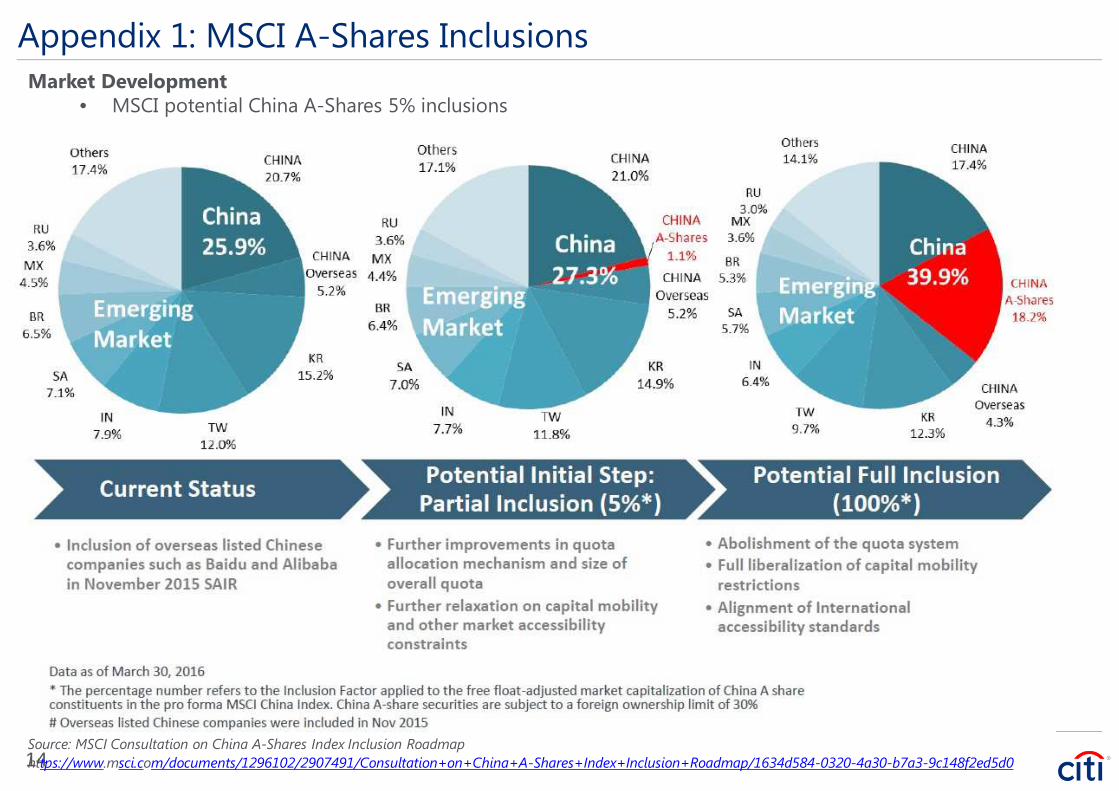
Source: MSCI Consultation on China A-Shares Index Inclusion Roadmap1ht4tps://www.msci.com/documents/1296102/2907491/Consultation+on+China+A-Shares+Index+Inclusion+Roadmap/1634d584-0320-4a30-b7a3-9c148f2ed5d0
Appendix 1: MSCI A-Shares InclusionsMarket Development
• MSCI potential China A-Shares 5% inclusions

In any instance where distribution of this communication is subject to the rules of the US Commodity Futures Trading Commission (“CFTC”), this communication constitutes an invitation to consider entering into a derivatives transaction under U.S. CFTC Regulations §§ 1.71 and 23.605, where applicable, but is not a binding offer to buy/sell any financial instrument.This communication is prepared by individual sales and/or trading personnel of Citi which distributes this communication by or through its locally authorised affiliates (collectively, “Citi”). Sales and/or trading personnel are not research analysts, and the information in this communication (“Communication”) is not intended to constitute “research” as that term is defined by applicable regulations. Unless otherwise indicated, any reference to a research report or research recommendation is not intended to represent the whole report and is not in itself considered a recommendation or research report. All views, opinions and estimates expressed in this Communication (i) may change without notice and (ii) may differ from those views, opinions and estimates held or expressed by Citi or other Citi personnel.This Communication is provided for information and discussion purposes only, is subject to change without notice, is strictly confidential, may not be reproduced and is intended for your use only. It does not include a number of terms and conditions that will be included in any actual transaction and final terms and conditions are subject to further discussion and negotiation nor does it purport to identify all risks (direct or indirect). This communication is not a commitment to deal in any product, offer financing or enter into any transaction described herein. Unlessotherwise indicated, (i) it does not constitute an offer or recommendation to purchase or sell any financial instruments or other products, (ii) it does not constitute a solicitation if it is not subject to the rules of the CFTC (but see discussion above regarding communication subject to CFTC rules) and (iii) it is not intended as an official confirmation of any transaction. Unless otherwise expressly indicated, this Communication does not take into account the investment objectives or financial situation of any particular person. Recipients of this Communication should obtainadvice based on their own individual circumstances from their own tax, financial, legal and other advisors before making an investment decision, and only make such decisions on the basis of the investor's own objectives, experience and resources. The information contained in thisCommunication is based on generally available information and, although obtained from sources believed by Citi to be reliable, its accuracy and completeness cannot be assured, and such information may be incomplete or condensed.This communication is directed exclusively at market professionals, financial intermediaries and institutional investor customers and is not intended for distribution to retail customers. Any on-distribution has not been approved or authorized by Citi, who expressly disclaims liability for such on-distribution.Citi is not acting as your agent, fiduciary or investment adviser and is not managing your account. The provision of information in this communication is not based on your individual circumstances and should not be relied upon as an assessment of suitability for you of a particular product or transaction. It does not constitute investment advice and Citi makes no recommendation as to the suitability of any of the products or transactions mentioned. Even if Citi possesses information as to your objectives in relation to any transaction, series of transactions or tradingstrategy, this will not be deemed sufficient for any assessment of suitability for you of any transaction, series of transactions or trading strategy. Save in those jurisdictions where it is not permissible to make such a statement, we hereby inform you that this communication should not be considered as a solicitation or offer to sell or purchase any securities, deal in any product or enter into any transaction. You should make any trading or investment decisions in reliance on your own analysis and judgment and/or that of your independent advisors and not in reliance onCiti and any decision whether or not to adopt any strategy or engage in any transaction will not be Citi’s responsibility. Citi does not provide investment, accounting, tax, financial or legal advice; such matters as well as the suitability of a potential transaction or product or investmentshould be discussed with your independent advisors. Prior to dealing in any product or entering into any transaction, you and the senior management in your organisation should determine, without reliance on Citi, (i) the economic risks or merits, as well as the legal, tax and accountingcharacteristics and consequences of dealing with any product or entering into the transaction (ii) that you are able to assume these risks, (iii) that such product or transaction is appropriate for a person with your experience, investment goals, financial resources or any other relevantcircumstance or consideration. Where you are acting as an adviser or agent, you should evaluate this communication in light of the circumstances applicable to your principal and the scope of your authority.The information in this communication, including any trade or strategy ideas, is provided by individual sales and/or trading personnel of Citi and not by Citi’s research department and therefore the directives on the independence of research do not apply. Any view expressed in this communication may represent the current views and interpretations of the markets, products or events of such individual sales and/or trading personnel and may be different from other sales and/or trading personnel and may also differ from Citi’s published research – the views in thiscommunication may be more short term in nature and liable to change more quickly than the views of Citi research department which are generally more long term. On the occasions where information provided includes extracts or summary material derived from research reportspublished by Citi’s research department, you are advised to obtain and review the original piece of research to see the research analyst’s full analysis. Any prices used herein, unless otherwise specified, are indicative. Although all information has been obtained from, and is based upon sources believed to be reliable, it may be incomplete or condensed and its accuracy cannot be guaranteed. Citi makes no representation or warranty, expressed or implied, as to the accuracy of the information, the reasonableness of any assumptions used in calculating any illustrativeperformance information or the accuracy (mathematical or otherwise) or validity of such information. Any opinions attributed to Citi constitute Citi’s judgment as of the date of the relevant material and are subject to change without notice. Provision of information may cease at anytime without reason or notice being given. Commissions and other costs relating to any dealing in any products or entering into any transactions referred to in this communication may not have been taken into consideration.Any scenario analysis or information generated from a model is for illustrative purposes only. Where the communication contains “forward-looking” information, such information may include, but is not limited to, projections, forecasts or estimates of cashflows, yields or return, scenario analyses and proposed or expected portfolio composition. Any forward-looking information is based upon certain assumptions about future events or conditions and is intended only to illustrate hypothetical results under those assumptions (not all of which are specifiedherein or can be ascertained at this time). It does not represent actual termination or unwind prices that may be available to you or the actual performance of any products and neither does it present all possible outcomes or describe all factors that may affect the value of any applicableinvestment, product or investment. Actual events or conditions are unlikely to be consistent with, and may differ significantly from, those assumed. Illustrative performance results may be based on mathematical models that calculate those results by using inputs that are based on assumptions about a variety of future conditions and events and not all relevant events or conditions may have been considered in developing such assumptions. Accordingly, actual results may vary and the variations may be substantial. The products or transactions identified in any of the illustrative calculations presented herein may therefore not perform as described and actual performance may differ, and may differ substantially, from those illustrated in this communication. When evaluating any forward looking information you should understand the assumptionsused and, together with your independent advisors, consider whether they are appropriate for your purposes. You should also note that the models used in any analysis may be proprietary, making the results difficult or impossible for any third party to reproduce. This communication isnot intended to predict any future events. Past performance is not indicative of future performance.Citi shall have no liability to the user or to third parties, for the quality, accuracy, timeliness, continued availability or completeness of any data or calculations contained and/or referred to in this communication nor for any special, direct, indirect, incidental or consequential loss ordamage which may be sustained because of the use of the information contained and/or referred to in this communication or otherwise arising in connection with the information contained and/or referred to in this communication, provided that this exclusion of liability shall notexclude or limit any liability under any law or regulation applicable to Citi that may not be excluded or restricted.The transactions and any products described herein may be subject to fluctuations of their mark-to-market price or value and such fluctuations may, depending on the type of product or security and the financial environment, be substantial. Where a product or transaction provides for payments linked to or derived from prices or yields of, without limitation, one or more securities, other instruments, indices, rates, assets or foreign currencies, such provisions may result in negative fluctuations in the value of and amounts payable with respect to such product prior to orat redemption. You should consider the implications of such fluctuations with your independent advisers. The products or transactions referred to in this communication may be subject to the risk of loss of some or all of your investment, for instance (and the examples set out below arenot exhaustive), as a result of fluctuations in price or value of the product or transaction or a lack of liquidity in the market or the risk that your counterparty or any guarantor fails to perform its obligations or, if this the product or transaction is linked to the credit of one or more entities, any change to the creditworthiness of the credit of any of those entities.Citi (whether through the individual sales and/trading personnel involved in the preparation or issuance of this communication or otherwise) may from time to time have long or short principal positions and/or actively trade, for its own account and those of its customers, by makingmarkets to its clients, in products identical to or economically related to the products or transactions referred to in this communication. Citi may also undertake hedging transactions related to the initiation or termination of a product or transaction, that may adversely affect the market price, rate, index or other market factor(s) underlying the product or transaction and consequently its value. Citi may have an investment banking or other commercial relationship with and access to information from the issuer(s) of securities, products, or other interests underlying a product or transaction. Citi may also have potential conflicts of interest due to the present or future relationships between Citi and any asset underlying the product or transaction, any collateral manager, any reference obligations or any reference entity.Any decision to purchase any product or enter into any transaction referred to in this communication should be based upon the information contained in any associated offering document if one is available (including any risk factors or investment considerations mentioned therein) and/or the terms of any agreement. Any securities which are the subject of this communication have not been and will not be registered under the United States Securities Act of 1933 as amended (the Securities Act) or any United States securities law, and may not be offered or sold within the United States or to, or for the account or benefit of, any US person, except pursuant to an exemption from, or in a product or transaction, not subject to, the registration requirements of the Securities Act. This communication is not intended for distribution to, or to be used by, any person or entity in any jurisdiction or country which distribution or use would be contrary to law or regulation.This communication contains data compilations, writings and information that are confidential and proprietary to Citi and protected under copyright and other intellectual property laws, and may not be reproduced, distributed or otherwise transmitted by you to any other person for any purpose unless Citi’s prior written consent have been obtained.Although Citibank, N.A. (together with its subsidiaries and branches worldwide, "Citibank") is an affiliate of Citi, you should be aware that none of the financial instruments or other products mentioned in this Communication (unless expressly stated otherwise) are (i) insured by the Federal Deposit Insurance Corporation or any other governmental authority, or (ii) deposits or other obligations of, or guaranteed by, Citibank or any other insured depository institution.IRS Circular 230 Disclosure: Citi and its employees are not in the business of providing, and do not provide, tax or legal advice to any taxpayer outside of Citi. Any statements in this Communication to tax matters were not intended or written to be used, and cannot be used or relied upon, by any taxpayer for the purpose of avoiding tax penalties. Any such taxpayer should seek advice based on the taxpayer’s particular circumstances from an independent tax advisor.Citi specifically prohibits the redistribution of this Communication in whole or in part without the written permission of Citi and Citi accepts no liability whatsoever for the actions of third parties in this respect.Copyright © 2015 Citigroup Inc. and/or its affiliates. All rights reserved. CITI, CITI and Arc Design, CITIBANK and CITIGROUP are trademarks and service marks of Citigroup Inc. and/or its affiliates and are used and registered throughout the world.
[TRADEMARK
© 2016 Citigroup Global Markets Inc. Member SIPC. All rights reserved. Citi and Citi and Arc Design are trademarks and service marks of Citigroup Inc. or its affiliates and are used and registered throughout the world.
© 2016 Citibank, N.A. All rights reserved. Citi and Citi and Arc Design are trademarks and service marks of Citigroup Inc. or its affiliates and are used and registered throughout the world.
© 2016 Citigroup Inc. All rights reserved. Citi and Citi and Arc Design are trademarks and service marks of Citigroup Inc. or its affiliates and are used and registered throughout the world.
© 2016 Citigroup Global Markets Limited. Authorised by the Prudential Regulation Authority and regulated by the Financial Conduct Authority and the Prudential Regulation Authority. All rights reserved. Citi and Citi and Arc Design are trademarks and service marks of Citigroup Inc. or its affiliates and are used and registered throughout the world.

China Connect – Launch of Shenzhen-Hong Kong Stock ConnectSeptember 2016
Markets and Securities Services
This document is solely for information and we will not be responsible for updating any information contained herein. It is not intended to provide specific advice on any other matter. If advice is required, legal, tax or otherwise, you should consult our own advisors, legal or otherwise. No responsibility for any loss occasioned as result of using this document is accepted. Under no circumstances it is to be considered an offer or sell or a solicitation to buy any investment or product. © 2016 Citibank, N.A. All rights reserved.
Cindy T. Chen Country Head Hong Kong Securities [email protected]

Important Note
• This document is solely for information and Citi will not be responsible for updating any information contained herein. It is not intended to provide specific advice on any other matter. If advice is required—legal, tax or otherwise—you should consult your own advisers, legal or otherwise. No responsibility for any loss occasioned as a result of using this document is accepted. Under no circumstances is it to be considered an offer to sell or a solicitation to buy any investment or product
• The formal launch of Shenzhen-Hong Kong Stock Connect will only take place after preparation for the relevant trading and clearing rules and systems has been finalized, all regulatory approvals have been granted, market participants have sufficiently adapted their operational and technical systems, and all necessary arrangements for cross-boundary regulatory and enforcement cooperation, as well as investor education, have been in place. A separate announcement will be made with respect to the formal launch date.
• Since rules on trading, clearing and settlement may not have been completely promulgated or finalize by relevant authorities, therefore Citi solutions may be amended or changed in the course of the implementation of the Shenzhen Hong Kong Stock Connect

Agenda
I. Overview of China Connect Schemes 1
II. Key Features and Changes 3
III. China Connect vs QFII/RQFII 6
IV. How to Get Ready 8

China Connect | Expand Further
China and Hong Kong continue to expand the mutual market access with addition of Shenzhen and more to come
1
China A Equity
SH Connect (2014)SZ Connect (2016)
IPO (TBD)
Exchange Traded Fund
SH/SZ Connect (2017)
Mutual Recognition of
Funds
MRF (2015)
Bond
CIBM Connect (TBD)Listed Bond Connect
(TBD)
• Most efficient and scalable China access platform for international investors• Expanding to other major asset classes ETFs, bonds

China Connect | A Transformational Breakthrough
Stock Connect is a transformational breakthrough for global investors to access the China A-shares market
Why is it a transformational breakthrough?
• Available to everyone from day one (e.g. retail investors, institutions, hedge funds, overseas investors)
• No approval or license required (e.g. no approval from CSRC, SAFE, PBOC, SFC)
• Scalable model and designed to be multi-assets and multi-markets (e.g. ability to extend to Shenzhen Exchange, equity derivatives, ETF, etc.)
• Broader impacts (IPO, index, RMB internationalization)
Source: World Federation of Stock Exchanges as of June 2015
World’s Largest Stock Exchanges – Market Capitaliza tions (US$ trillion)
19.2
HK 3.8
7.2 6.54.9
3.42 1.8 1.6
Shanghai5.7
Shenzhen3.9
NYSE HongKong,
Shanghai,Shenzhen
NASDAQOMX
LondonStock
ExchangeGroup
JapanExchangeGroup -Tokyo
NYSEEuronext
TMXGroup
DeutscheBörse
BSE India
13.4
~568 stocks~90% Market Cap ~80% ADT
“Home Market” rules or laws apply to the extent possible; price discovery remains
in the home market.
Shanghai Northbound
Hong Kong or Overseas Investors
SSE
SEHK Members
SEHK Subsidiary
Hong Kong
Mainland China
Daily Quota RMB13bn (~US$2bn)
2
~880 stocks~74% Market Cap ~68% ADT
“Home Market” rules or laws apply to the extent possible; price discovery remains
in the home market.
Shenzhen Northbound
Hong Kong or Overseas Investors
SZSE
SEHK Members
SEHK Subsidiary
Hong Kong
Mainland China
RMB13bn (~US$2bn)

Key Features and Changes

China Connect | Shenzhen Northbound and Southbound
Key features and changes
Northbound SouthboundQuota • Aggregated Quota: None
• Daily Net Buy Quota: RMB 13 bn• Aggregated Quota :None• Daily Net Buy Quota: RMB 10.5 bn
Eligible Stock
~880 Stocks Main: ~270, SME: ~410, ChiNext: ~200
~ RMB 15 trillion (74%) Market Cap. ~ RMB 230 billion (68%) ADT
• Constituent stocks of the SZSE Component Index and SZSE Small/Mid Cap Innovation Index with market capitalization > RMB 6 billion;
• A shares of SZSE-listed companies which have H shares listed on SEHK
• Exceptions: (1) Shares that are not traded in RMB; (2) Shares under “risk alert”; (3) No IPOs
~417 stocks (vs. 318 stocks for Shanghai southbound)
~HKD 21 trillion (87%) Market Cap.~ HKD 39 billion (92%) ADT
• Constituent stocks of the Hang Seng Composite LargeCap/MidCap Index;
• Constituent stocks of the Hang Seng Composite SmallCap Index with market capitalization > HKD 5 billion;
• H shares of SEHK-listed companies which have A shares listed on SZSE or SSE
• Exceptions: (1) Shares that are not traded in RMB; (2) Shares under “risk alert”; (3) No IPOs
Eligible Investors
• ChiNext stocks are limited to Professional Investors initially
• Aggregate balance RMB 500k or more in securities and cash accounts
Source: Hong Kong Exchanges and Clearing Limited (HKEx), Citi Securities Services 3
Shenzhen Stock Exchange
SEHK Subsidiary
SEHK Members
Eligible Mainland Investors
SZSE Subsidiary
Stock Exchange of Hong Kong
SZSE Members
Hon
g K
ong
Mai
nlan
d C
hina
Northbound Southbound
RMB 10.5 bnDaily Quota: RMB 13 bn
HK or Overseas Investors

China Connect | Shanghai vs. Shenzhen (Northbound)There are only minor differences between Shanghai and Shenzhen northbound connection thus allows the Shenzhen launch to be relatively quick for the market to get ready
Northbound SSE (Shanghai) SZSE (Shenzhen)
Eligible Investors • No restrictions; open to all Hong Kong, overseas institutional and individual investors
• No restrictions; open to all Hong Kong, overseas institutional and individual investors, except for ChiNext which is limited to institutional professional investors initially
Eligible Securities • Constituent stocks of the SSE 180 and 380 • All dual-listed shares i.e. SSE-SEHK A+H (68)• Exceptions: (1) Shares that are not traded in RMB; (2)
Shares under “risk alert”; (3) No IPOs
• ~569 Stocks, ~RMB 30 trillion (~90%) Market Cap
• Constituent stocks of the SZSE Component and SZSE Small/Mid Cap Innovation with market capitalization > RMB 6billion*
• All dual-listed shares SZSE-SEHK A+H • Exceptions: (1) Shares that are not traded in RMB; (2) Shares
under “risk alert”; (3) No IPOs• ~880 Stocks , ~ RMB 15 trillion (74%) Market Cap.
Trading Hours • Opening call auction: 9:15-9:25 (SEHK will accept orders at 09:10)
• Continuous auction: 9:30-11:30; 13:00-15:00
• Opening call auction: 9:15-9:25 (SEHK will accept orders at 09:10)
• Continuous auction: 9:30-11:30; 13:00-14:57 • Closing call auction: 14:57-15:00
Order Cancellation • Unexecuted orders: can be cancelled during trading hours except 09:20-09:25
• Confirmed Orders: Not applicable
• Unexecuted orders: can be cancelled during trading hours except 09:20-09:25 and 14:57-15:00
• Confirmed Orders: Confirmed order may be cancelled by SZSE due to the unsuccessful order validation
Risk Management
Measures
• ChinaClear Shanghai Branch will apply its risk management measures on the HKSCC’s unsettled positions on the SSE securities e.g. Mainland Settlement Deposit (MSTD), Mainland Security Deposit (MSCD)
• ChinaClear Shenzhen Branch will apply its risk management measures on the HKSCC’s unsettled positions on the SZSE securities
CCASS Stock Code • 60XXXX (SSE) >>> 9XXXX • 00XXXX (Main and SME) >>> 7XXXX • 300XXX (ChiNext) >>>77XXX
Source: Hong Kong Exchanges and Clearing Limited (HKEx), Citi Securities Services
4
*Subject to final regulatory approval, the periodic review of eligible stocks will be in line with half-yearly rebalancing of underlying indexes e.g. 6-month daily average 1 Nov 2015 till 30 Apr 2016 (review period for end 2016 launch)

China Connect | Implementation Timeline and Open Items
August September October November December 2016
Key Open Items Before Launch
1 Rules Amendments • CSRC & SFC to approval Shenzhen Connect rules which is expected to include details on SBL, order types• Pending amendment of CCASS Rules, which may impact the Terms and Conditions for Stock Connect services• Potential relaxation on the shares lock up rule and buy in exemption may be permitted for A-shares
2 CGT clarification from SAT • Confirmation that the capital gains tax temporarily waived (Circular 79) will also apply to Shenzhen shares including stock, stock index/futures and equity investment funds. Dividends withholding tax of 10%
Preparation for the launch of Shenzhen-Hong Kong is expected to take about four months
5
August 16CSRC & SFCAnnouncement
August – SeptemberBriefing Sessions for Participants
September – NovemberRule Amendments
(at least 6 weeks from Announcement date)
Mid/Late NovemberOfficial Launch
August – Until the launchMarket Communication & Investor Education
Market Rehearsals (Three weekends)
Final Regulatory Approval on
Commencement
Official Launch
Source: Hong Kong Exchanges and Clearing Limited (HKEx), Citi Securities Services

China Connect vs QFII/RQFII

China Connect vs. RQFII/QFII
Key differences between China Connect and RQFII/QFII
China Connect (Northbound) RQFII (since 2011) QFII (s ince 2002)
Eligible Investors
• Available to all overseas investors since day 1
• Except ions: ChiNext are limited to Professional Institutional Investors at initial stage)
• No license required from CSRC
• Only available to approved RQFII jurisdiction (currently 17)
• Subsidiaries of PRC fund management companies, securities companies, domestic commercial banks, insurance companies based in the RQFII jurisdiction
• Other institutions registered and mainly operated in the RQFII jurisdictions and possess asset management license from the relevant regulators of their jurisdictions
• Only available to qualified institutions in markets with MOU with China (currently 55)
• Commercial Banks (≥ 10yrs in operation, US$5 billion AUM, US$300mm Tier 1 Capital)
• Securities Companies (≥ 5yrs in operation, US$5 billion AUM, US$500mm Capital)
• AMC, insurance companies and other institutions (experience of 2+ years, and AUM ≥ US$500mm)
Quota • Daily Net Buy Quota: RMB 13 billion each for Shanghai and Shenzhen
• No aggregate total quota ceiling
• No approval from SAFE or CSRC required
• Quota approved: RMB510 billion (Aug ’16) for 208 RQFII entities
• Go through a filing process onlyo if the applied quota < =“Basic Quota” for
commercial institutions outside Mainland. Additional quota requires approval from SAFE
• SWFs, central banks and monetary authorities are not subject to Basic Quota and are able to file the intended investment quota according to their investment needs
• Quota approved: US$81.48 billion (as of Aug ’16) for the 299 QFIIs from 30 countries
• Go through a filing process onlyo if the applied quota < =“Basic Quota” for
commercial institutions outside Mainlando if the applied quota < = US$5 billion for SWFs,
central banks and monetary authorities, • Additional quota requires approval from SAFE• Minimum Basic Quota of each QFII is USD 20MM
Eligible Investments
• Constituent stocks of SSE 180 & 380, SZSE Component Index and SZSE Small/Mid Cap Innovation Index with market capitalization > RMB 6 billion1
• All dual-listed shares i.e. SSE-SEHK and SZSE-SEHK A+H
• Exceptions: Shares not traded in RMB, Shares under “risk alert”, IPOs
• All SSE and SZSE stocks• Corporate, government, enterprise,
convertible and interbank bond market• Securities investment funds including
closed-end, open-ended and ETFs• Others such as warrants, index futures,
IPOs
• Same as RQFII
1. Subject to final regulatory approval, the periodic review of eligible stocks will be in line with half-yearly rebalancing of underlying indexes e.g. 6-month daily average 1 Nov 2015 till 30 Apr 2016 (review period for end 2016 launch)
2. Basic Quota for commercial institutions outside of Mainland is USD 100 million + 0.2% of the average assets size in past 3 years - Existing quota . 6
China Connect – vs. RQFII/QFII (continue)
Key differences between China Connect and RQFII/QFII
China Connect (Northbound) RQFII (since 2011) QFII (s ince 2002)
Currency • Offshore RMB • Offshore RMB • USD or other major foreign currencies
Securities Lending and Borrowing
• Permitted with restrictions • Not available • Not available
Liquidity • Daily liquidity • No restriction for sell trades• Buy trades are subject to daily net buy
quota• Trading and settlement flow are
subject to a closed-loop mechanism under which income from securities sales shall be returned to origin instead of being deposited with local market
• Quota shall be used within 1 year upon quota is granted or approved
• Open-ended fundso Daily injection and repatriationo No lock-up period
• All other RQFIIso 3 months (instead of 1 year) lock-up
period from the date that accumulative principal injection reaches RMB100MM
o Daily injection and repatriation (instead of six months injection period and Monthly repatriation)
o For principal repatriation, principal can be re-injected, but net amount of investment capital remitted to China shall be within the investment quota (instead of quota will be reduced accordingly)
• Quota shall be used within 1 year upon quota is granted or approved
• Monthly repatriation capped at 20% of its total QFII investments at the end of prior year
• Open-ended fundso Daily injection and repatriationo 3 months lock-up period from date of the
US$20mm principal injection• All other QFIIso 3 months lock-up period from date of the
US$20mm principal injectiono Daily injection and repatriation o For principal repatriation, principal can be re-
injected, but the net amount of capital remitted into China must be within the investment quota. No need to file with SAFE
Funding or
Cash account
• Prefunding not required• No approval required from PBOC
• RQFII custodian must confirm available cash before trade occurs
• Obtain approval from RMB/FCY from PBOC
• QFII custodian must confirm available cash before trade occurs
• Obtain approval from RMB/FCY from PBOC
7

How to get ready

Get Familiar with China Market and Shenzhen

Turnover No. 1, Size No. 2, Benchmark weight No. 8
Source: Wind, Bloomberg, Factset and Citi Research. Note: GDP data as of 2014; Mkt Cap and Turnover data as of Nov 2015; MSCI AC World Index data as of Dec 18, 2015
35%
3%
3%
3%
3%
4%
4%
5%
6%
13%
23%
0% 5% 10% 15% 20% 25% 30% 35% 40%
Others
India
Russia
Italy
Brazil
UK
France
Germany
Japan
China
US2014 Global GDP Distribution
Total 2014 Global GDP was USD 77 tn based on 185 countries worldwide
19%
1%
1%
1%
1%
2%
2%
3%
5%
27%
39%
0% 5% 10% 15% 20% 25% 30% 35% 40% 45%
Others
India
Australia
Canada
Germany
Korea
Euronext
BATS - Europe
Japan
US
China
Global Equity Turnover Distribution
Total Global Market Turnover was USD 103 tn (Jan - Nov, 2015) based on 58 Exchanges' data
20%
2%
2%
2%
3%
3%
3%
5%
8%
16%
37%
0% 5% 10% 15% 20% 25% 30% 35% 40%
Others
Australia
Korea
India
Canada
Germany
France
UK
Japan
China
USGlobal Equity Market Cap Distribution
Total Global Market Cap was USD 66 tn based on Bloomberg Statistics
13.3%
1.5%
2.3%
2.6%
2.8%
3.2%
3.3%
3.4%
6.7%
8.1%
53.0%
0% 10% 20% 30% 40% 50% 60%
Others
Korea
Australia
China
Canada
Germany
Switzerland
France
UK
Japan
USA
MSCI AC World Index Weight
Total MSCI AC World Index Market
8

Source: Various Stock Exchanges, US Census Bureau, Bank of Japan, CHFS and Citi ResearchNote: China Overall means all Mainland Chinese companies listed in China A-share, HK, US, SGP and others.
US Equity Holding Structure Japan Equity Holding Structure EU Equity Holding Structure TW Equity Holding Structure
0%
10%
20%
30%
40%
50%
60%
70%
80%
90%
100% 1
970
197
4
197
8
198
2
198
6
199
0
199
4
199
8
200
2
200
6
201
0
201
4
Foreigners
Corporates
Securities Cos
Insurance Cos
Trust Banks
Regional Banks
Households
0%
10%
20%
30%
40%
50%
60%
70%
80%
90%
100%
1975
1979
1983
1987
1991
1995
1999
2003
2007
2011
Foreigners
General government
Investment funds andothers
Insurance corps andpension funds
Banks
Non financial corps
Households
0%
10%
20%
30%
40%
50%
60%
70%
80%
90%
100%
1952
1957
1962
1967
1972
1977
1982
1987
1992
1997
2002
2007
Foreigners
Federal governmentretirement funds
Property-casualty insurancecompanies
Exchange-traded funds
Life insurance companies
State and local government
retirement funds
Private pension funds
Mutual funds
Household sector
0%
10%
20%
30%
40%
50%
60%
70%
80%
90%
100%
199
7
199
9
200
1
200
3
200
5
200
7
200
9
201
1
201
3
Foreigners
Juridical People
Corporat ions
Trust Funds
Financial Insts
Governments
Households
46%
19%
39%
24%
37%
15%
9%
29%
10%
16%
49%
47%
43%
22%27%
28%
1%
5%
1.3%
31%24%
32%
13%
33%
0%
10%
20%
30%
40%
50%
60%
70%
80%
90%
100%
China A(1Q2016)
Japan(2014)
Taiwan(2013)
Korea(2012)
US(2010)
EU(2012)
Foreigners
Gov't andCorporates
InstitutionalInvestors
Retailors
Structual trends of China A-share holding structure
80%
20% 20%
41%
9%
13%
9%
8%
0%
10%
20%
30%
40%
50%
60%
70%
80%
90%
100%
Retailors InstitutionalInvestors
Retailors DomesticInstitutions
Foreigners
Others
Mainland China
EU
US
HK and A-shares Stock Exchange Trading Value Market Share
A-share HK
9
Trend toward Internationalization & Institutionalization

75% of China listcos’ market_cap in A-shares
Source: Bloomberg, Wind and Citi Research
US$9.4tn Market_cap of Chinese Companies Global Distribution Map
China A-SH42%
China A-SZ33%
HK20%
US5%
SGP/EU/Others0%
SH180
61%SH380
21%
SH Dual
List1%
Not
Connected
17%
SH total US$4.0tn, 83% connected
SZ-HK Connect Univers
e75%
Others25%
SZ total US$3.1tn, 75% to be connected
China total US$9.4tn
CSI30046%
Non-CSI300
54%
CSI300 , US$3.3tn, 46% of China A-shr mkt_cap
MXCN82%
Non-
MXCN18%
MXCN , US1.5tn, 82% of China HK mkt_cap, ~85% connected
MFs Benchmark
Stock Connect
10

93% of China listcos’ turnover in A-shares
Source: Bloomberg, Wind and Citi Research, as of Dec, 2015
US$40tn Turnover of Chinese Companies Global Distribution Map
China A-SH49%
China A-SZ44%
HK4%
US3%
SH180
49%
SH380
29%
Not
Connected
21%
SH total US$19.4tn, 80% connected
SZ30042%
Others58%
SZ total US$17.5tn, at least 40% to be connected
China total US$40tn, ~45% turnover is investable already
CSI30037%
Non-CSI300
63%
CSI300 , US$13.6tn, 37% of China A-shr turnover
MXCN81%
Non-
MXCN19%
MXCN , US1.3tn, 81% of China HK turnover
MFs Benchmark
Stock Connect
11

Shenzhen -- China’s Transition Future
Source: Bloomberg, Wind and Citi Research, as of April 14, 2016
45%
44%
3%
49% 50%
9%
36%
55%
46%
19%33%
11%
41%
12%
11%
45%
67%
42%
30%
71%33%
35%
42%
61%54%
6%
46%
71%
65%
19%
11%
30%
9%
10%
20%30% 9%
12%
20% 13%
93%
13%17%
35%
24%
10%
0
1
2
3
4
5
6
7
8
9
10
IT Capital Goods Banks Materials Retailing Energy Real Estate Health Care Cons Stap Utilities Diversified Fin Telecom Auto Transportation Insurance
Rmb61tn (USD 9.4tn) Market Value Geographical Distribution By Sector
SZ SH Hong Kong US and others
Rmb tn
9.4
8.3
7.5
5.7 5.6
3.6 3.6
3.2
2.7
2.1 2.1 2.01.9 1.8 1.7
12

SZ/ SH Market StatisticsAverage 74% of Shanghai listcos are SOE controlled
Only 38% of Shenzhen listcos are SOE controlled
Source: Wind and Citi Research; Note: Sector distribution by mkt-cap. Source: Wind and Citi Research; Note: Sector distribution by mkt-cap.
61% 58%
40% 37% 36%30% 29% 29% 25% 20%
9% 6% 5% 3% 1%
0%
10%
20%
30%
40%
50%
60%
70%
80%
90%
100%
SH SOE/ Private % Comparison by SectorsPrivate SOE
SOE Average: 74%
100% 100%
83%74% 72% 70% 70%
64% 62% 60% 56%
26% 25%
11%
0%
10%
20%
30%
40%
50%
60%
70%
80%
90%
100%
SZ SOE/ Private % Comparison by SectorsPrivate SOE
SOE Average: 38%
YTD, turnover velocity in Shenzhen 4.0x vs. 3.0x in Shanghai
Retail is holding more shares in Shenzhen than Shanghai
Source: Wind and Citi Research; Note: Turnover Velocity is calculated using annualized trading value divided by average total market cap.
Source: Wind and Citi Research
0%
50%
100%
150%
200%
250%
300%
350%
400%
450%
500%
2005 2006 2007 2008 2009 2010 2011 2012 2013 2014 2015
SH vs SZ Turnover Velocity ComparisonSH SZ
37%
60%
7%
8%
0%
10%
20%
30%
40%
50%
60%
70%
80%
90%
100%
SH SZ
SH vs. SZ Holding Structure Comparison
Foreigner
Gov't andCorporates
InstitutionalInvestor
RetailInvestor
IPO waiting list concentration on Shenzhen
Source: Wind and Citi Research; Note: Using number of companies given data availability.
Main Board (most in SH)
32%
SME (SZ)29%
GEM (SZ)39%
IPO Waiting List Distrubition - SH vs. SZ
13

Get familiar with UCITS or relevant funds requirements

Commission for the Supervision of the Financial Sector (CSSF) Central Bank of Ireland
The main conditions imposed by the CSSF are:
• the use of a delivery versus payment (“DVP”) settlement process avoiding additional counterparty risks;
• The depositary or an entity within its custodial network (i.e. a sub-custodian) must ensure that it retains control over the shares at all times
• ensuring that accounts opened by the Luxembourg depositary with the Hong Kong sub-custodian are segregated at the level of UCITS sub-funds or structured as UCITS assets omnibus accounts of the Luxembourg depositary with the Hong Kong sub-custodian; and
• the disclosure in the prospectus and KIID has to cover the specific legal risks of compulsory use of the local central securities depositaries, Hong Kong Securities Clearing Company Limited and ChinaClear for custody of securities on a cross border basis and other specific risks.
On July 15, 2015, the Central Bank of Ireland published an important update to its UCITS and AIFMD Q&A permitting Irish authorized investment funds to acquire Chinese shares via the Stock Connect program. Key conditions are:• The depositary or an entity within its custodial network (i.e. a sub-
custodian) must ensure that it retains control over the shares at all times
• The depository or a member of its custodial network can be a General Clearing Participant, Direct Clearing Participant or Custodian Participant as appropriately determined by the depositary in fulfilment of its legal obligations
• The depository must review the Stock Connect infrastructure arrangements to ensure that its legal obligations can be met
• The depositary needs to satisfy itself that the manner in which the shares are to be held meet with the requirements of the UCITS / AIFMD Regulations and any conditions imposed by the Central Bank
Stock Connect - UCITS RequirementsSome regulated funds are required true RVP/DVP solution to avoid counterparty risk and to maintain full control over the shares at all times to better protect the assets of the fund
14
• Definition of DVP per BIS: A security settlement mechanism that links to a security transfer and a fund transfers in such a way as to ensure that delivery occurs if and only if the corresponding payment occurs.
• UCITS V imposes a ‘strict liability’ on the Fund Depositary/Global Custodian. This means that if an asset of the fund is lost, the Fund Depositary has an immediate obligation to replace the asset or equivalent cash value, even if the asset was lost due to the actions of its delegates. Fund Depositaries are also will bear the burden of proof to demonstrate that it has performed its duties, acts in solely in interest of the investors and exercise prudent measure to protect the fund’s assets. A depositary can only avoid this strict liability standard where it can prove, cumulatively, that the loss was as a result of anexternal event, beyond its reasonable control , the consequences of which would have been unavoidable despite all reasonable efforts to the contrary in performing all of its tasks.

Agency Broker/PB Model Standard SPSA Model C/SPSA+
Global Custodian
Depositary Bank /Trustee
Mainland China
Manager
Appoints GCInstruct s GC under
POA provided by Depositary /Trustee
Domicile of the Fund
Local Custodian
Hong Kong
Stock Connect EP (HK Broker)
SSE Shares are pre-delivered to local broker
No contractual relationship between
local custodian and EP
ChinaClear (CSD)
HKSCC/CCASS(CSD)
Maintains account with HKSCC/CCASS
Global Custodian
Depositary Bank /Trustee
Mainland China
Manager
Appoints GCInstruct s GC under
POA provided by Depositary /Trustee
Domicile of the Fund
Local Custodian
Hong Kong
Stock Connect EP (HK Broker)
• Shares are no longer within the custodian chain
• Not true RVP/DVP
Local Custodian transfer shares to EP
ChinaClear (CSD)
HKSCC/CCASS(CSD)
Maintains account with HKSCC/CCASS
Global Custodian
Depositary Bank /Trustee
Mainland China
Manager
Appoints GCInstruct s GC under
POA provided by Depositary /Trustee
Domicile of the Fund
Local Custodian
Hong Kong
ChinaClear (CSD)
HKSCC/CCASS(CSD)
Maintains account with HKSCC/CCASS
Stock Connect (Northbound) — Available Stock Connect Solutions
� Shares are held by the local custodian bank at the local depository (CCASS)
� Custodian maintain full control of the shares at all time
shares are held by the broker at the local
depository (CCASS)
Citi Model C and SPSA+ solutions provides real-time RVP/DVP settlement and maintain proper segregation and control of the fund assets
15

Clarify requirements and select solutions

Shenzhen Connect – How to get ready ?How to get ready for Shenzhen Connect
16
Existing China Connect clients
1. Review Fund Prospectus (amendment, risk disclosure or approval required?)
2. Check with Trustee or Depot bank to confirm new requirements (if any)
3. Review changes to the Stock Connect Terms and Conditions from your broker and custodian (if any)
New China Connect Investors
1. Decide on the Equity and Custody solution (e.g. Model C and SPSA+)
• Equity solution e.g. High Touch, Electronic (including E2C), PT and D1 (swap)
• For trust or retail funds, recommend confirming wit h your custodian whether they offer true DVP settle ment and multiple broker support
• Establish CNH FX or funding arrangement with custodian or broker
2. Review operation specifics including cutoff times for T+0 settlement
3. Review Custody Stock Connect Documentation
• Custody China Connect General Terms and Conditions & Custody China Connect Fee Agreement (if applicable)
• SPSA Form (if applicable)
4. Review Broker Stock Connect Documentation
Citi Solutions:
• Citi offers unique true DVP and multiple brokers solutions i.e. Model C or SPSA+ which will apply to Shenzhen shares
• Same accounts, Investor ID and cutoff times available for Shanghai HK Connect will apply to Shenzhen HK Connect.
• No new document requirements expected to this point (subject to review of the final rules)
• Existing Stock Connect fee schedule will be applied to Shenzhen shares

How Citi Can Help?
Citi is committed to be the go-to bank for China market access
SPSA Award
Shanghai-Hong Kong Stock Connect 1 st Anniversary Trading and Investor Education Awards
Top 3 Largest SPSA Portfolio Value
Top 3 Highest Number of SPSA Accounts Opened
• Offers the most comprehensive suite of solutions for investors to access Stock Connect
• Local Market Expertise on Stock Connect, QFII, RQFII and other China market access channels
• Leading provider of clearing services for brokers and uniquely capable of supporting a multi-broker arrangement
• Citi also developed unique Model C and Citi SPSA+ solutions specifically to allow regulated funds to use multiple brokers for execution and most importantly remain in compliance with relevant fund regulations such as UCITS, 40Act and MPFA or SFC regulated funds. Citi’s Model C and SPSA solutions allow the funds to
− Utilize multiple brokers and transact under true DVP / RVP environment to eliminate counterparty risk with the broker
− Ensure proper segregation of assets throughout the entire custodian chain
− Ensure the depositary bank and the sub custodian bank maintain full control over the securities at all times
− Ensure shares are held by custodian bank (instead of the broker affiliate of the custodian bank) in the entire chain instead of using a broker as a sub-custodian which may trigger requirements for the trustee or global custodian to perform diligence on thebroker
� 4th largest custodian in the world
� US$15 trillion of assets under custody
� Largest proprietary network providing clients unique access to local market expertise and global reach
� Leading provider of integrated RMB/CNH banking and FX services
� Citigroup Global Markets offers premier execution capability including integrated research, high-touch and electronic execution for cash and synthetic trading
� Citi Investment Research and Analysis (CIRA) offers independent, thorough market and stock analysis covering over 100 Stock Connect shares
17

IRS Circular 230 Disclosure: Citigroup Inc. and its affiliates do not provide tax or legal advice. Any discussion of tax matters in these materials (i) is not intended or written to be used, and cannot be used or relied upon, byyou for the purpose of avoiding any tax penalties and (ii) may have been written in connection with the "promotion or marketing" of any transaction contemplated hereby ("Transaction"). Accordingly, you should seek advicebased on your particular circumstances from an independent tax advisor.
In any instance where distribution of this communication is subject to the rules of the US Commodity Futures Trading Commission ("CFTC"), this communication constitutes an invitation to consider entering into a derivativestransaction under U.S. CFTC Regulations §§ 1.71 and 23.605, where applicable, but is not a binding offer to buy/sell any financial instrument.
Any terms set forth herein are intended for discussion purposes only and are subject to the final terms as set forth in separate definitive written agreements. This presentation is not a commitment to lend, syndicate a financing, underwrite orpurchase securities, or commit capital nor does it obligate us to enter into such a commitment, nor are we acting as a fiduciary to you. By accepting this presentation, subject to applicable law or regulation, you agree to keep confidential theinformation contained herein and the existence of and proposed terms for any Transaction.
Prior to entering into any Transaction, you should determine, without reliance upon us or our affiliates, the economic risks and merits (and independently determine that you are able to assume these risks) as well as the legal, tax and accountingcharacterizations and consequences of any such Transaction. In this regard, by accepting this presentation, you acknowledge that (a) we are not in the business of providing (and you are not relying on us for) legal, tax or accounting advice, (b)there may be legal, tax or accounting risks associated with any Transaction, (c) you should receive (and rely on) separate and qualified legal, tax and accounting advice and (d) you should apprise senior management in your organization as tosuch legal, tax and accounting advice (and any risks associated with any Transaction) and our disclaimer as to these matters. By acceptance of these materials, you and we hereby agree that from the commencement of discussions withrespect to any Transaction, and notwithstanding any other provision in this presentation, we hereby confirm that no participant in any Transaction shall be limited from disclosing the U.S. tax treatment or U.S. tax structure of such Transaction.
We are required to obtain, verify and record certain information that identifies each entity that enters into a formal business relationship with us. We will ask for your complete name, street address, and taxpayer ID number. We may alsorequest corporate formation documents, or other forms of identification, to verify information provided.
Any prices or levels contained herein are preliminary and indicative only and do not represent bids or offers. These indications are provided solely for your information and consideration, are subject to change at any time without notice and arenot intended as a solicitation with respect to the purchase or sale of any instrument. The information contained in this presentation may include results of analyses from a quantitative model which represent potential future events that may ormay not be realized, and is not a complete analysis of every material fact representing any product. Any estimates included herein constitute our judgment as of the date hereof and are subject to change without any notice. We and/or ouraffiliates may make a market in these instruments for our customers and for our own account. Accordingly, we may have a position in any such instrument at any time.
Although this material may contain publicly available information about Citi corporate bond research, fixed income strategy or economic and market analysis, Citi policy (i) prohibits employees from offering, directly or indirectly, a favorable ornegative research opinion or offering to change an opinion as consideration or inducement for the receipt of business or for compensation; and (ii) prohibits analysts from being compensated for specific recommendations or views contained inresearch reports. So as to reduce the potential for conflicts of interest, as well as to reduce any appearance of conflicts of interest, Citi has enacted policies and procedures designed to limit communications between its investment banking andresearch personnel to specifically prescribed circumstances.
[TRADEMARK SIGNOFF: add the appropriate signoff for the relevant legal vehicle]
© 2016 Citigroup Global Markets Inc. Member SIPC. All rights reserved. Citi and Citi and Arc Design are trademarks and service marks of Citigroup Inc. or its affiliates and are used and registered throughout the world.
© 2016 Citibank, N.A. All rights reserved. Citi and Citi and Arc Design are trademarks and service marks of Citigroup Inc. or its affiliates and are used and registered throughout the world.
© 2016 Citigroup Inc. All rights reserved. Citi and Citi and Arc Design are trademarks and service marks of Citigroup Inc. or its affiliates and are used and registered throughout the world.
© 2016 Citigroup Global Markets Limited. Authorised by the Prudential Regulation Authority and regulated by the Financial Conduct Authority and the Prudential Regulation Authority. All rights reserved. Citi and Citi and Arc Design aretrademarks and service marks of Citigroup Inc. or its affiliates and are used and registered throughout the world.
© 2016 Citibank, N.A. London. Authorised and regulated by the Office of the Comptroller of the Currency (USA) and authorised by the Prudential Regulation Authority. Subject to regulation by the Financial Conduct Authority and limitedregulation by the Prudential Regulation Authority. Details about the extent of our regulation by the Prudential Regulation Authority are available from us on request. All rights reserved. Citi and Citi and Arc Design are trademarks and servicemarks of Citigroup Inc. or its affiliates and are used and registered throughout the world.
© 2016 [Name of Legal Vehicle] [Name of regulatory body.] All rights reserved. Citi and Citi and Arc Design are trademarks and service marks of Citigroup Inc. or its affiliates and are used and registered throughout the world.
Citi believes that sustainability is good business practice. We work closely with our clients, peer financial institutions, NGOs and other partners to finance solutions to climate change, develop industry standards, reduce our own environmentalfootprint, and engage with stakeholders to advance shared learning and solutions. Citi’s Sustainable Progress strategy focuses on sustainability performance across three pillars: Environmental Finance; Environmental and Social RiskManagement; and Operations and Supply Chain. Our cornerstone initiative is our $100 Billion Environmental Finance Goal – to lend, invest and facilitate $100 billion over 10 years to activities focused on environmental and climate solutions.

China Interbank Bond Market Access
September 2016
Markets and Securities Services
For Institutional Investors Only—Not for Distribution to Retail Customers.Not For Onward Distribution
Joanne GohVice President, China Market Specialist, China Securities [email protected] (86) 21 2896 2318
Zoey GaoVice President, Global RMB Product, Citi [email protected](86) 21 2896 6638

Table of Contents
Overview of CIBM 3
CIBM Policy Updates 10
Appendix: Citi Markets and Securities Service Capability 15
Appendix: QFII and RQFII Market Update 19
Appendix: Understanding RMB 34
79
Overview of CIBM

40.97%
30.82%
8.73%
3.46%
1.96%
1.72%
1.68%
1.41%
1.16%
1.04%
USD
EUR
GBP
JPY
CAD
CNY
AUD
CHF
SEK
HKD
Bond Outstanding amount reach RMB 57 trillion
The China bond market has grown more than sixtimes in size since 2005, making China the largestamong emerging markets and the third largest inthe world by issuance.
Trading activity has grown rapidly and the marketis very liquid with ~RMB 485 trillion in total tradingvolume as of June 2016.
Current Status of RMB and China Bond Market
World Payment Shares in SWIFTJune 2016
Top 6 Currency in Global Payments
China is now the world’s largest economymeasured by purchasing power parity (PPP) andthe largest trading nation. RMB has been showinga consistent three-digit growth over the past twoyears with an increase in value of payments by+321%. The successful RMB inclusion in the SDRbasket (in effect from October 2016) will shake upthe way the world thinks about a ‘reserve asset’.
6 57
Source: RMB tracker by SWIFT Source: Winds
The RMB is fast becoming an attractive global currency and the China bond market has also gained its international position in terms of bond issuance and trading volume.
China Total Bond Outstanding AmountJune 2016, in RMB trillion
57
0
10
20
30
40
50
60
70
2006 2007 2008 2009 2010 2011 2012 2013 2014 2015 YTD2016
47% Debt to GDP Ratio
China’s bond market is still small by GDP Sharecompared to global or regional peers.
In 2016, the estimated national debt of Chinawas at about 46.76 percent of the grossdomestic product.
47
Source: Statista EST.
47%
0%
50%
100%
150%
200%
250%
300%
Country Debt to GDP Ratio June 2016 (%)
81

3 years 5 years 10 yearsChina 2.395% 2.540% 2.739%US 0.891% 1.189% 1.594%UK 0.137% 0.227% 0.591%Germany -0.624% -0.501% -0.051%Japan -0.189% -0.165% -0.069%Korea 1.232% 1.259% 1.435%
-1%
0%
1%
2%
3%
3-10
yea
rs Y
ield
s fo
r G
over
nmen
t Bon
dsA
ugus
t 201
6Higher Yields for a High Quality Sovereign
China
US
Korea
UK
Germany
Japan
Chinese bonds have historically offered significantly higher yields relative to other major bond markets, despite China’s strong sovereign credit quality. Historically low correlation to other developed and emerging market debt.
Source: investing.com
82

Complex Regulatory and Operational Framework of Bond MarketBond types are regulated by different government bodies from issuance, trading and investor market perspectives, and cleared by different custodians, all of which create additional complexity for wide access to China’s bond market.
Interbank Bond Market (CIBM) Exchange Market
People’s Bank of China (PBOC)China Securities Regulatory Commission
(CSRC)
Government Bonds
PBOC Bills/Bonds
Financial Bonds
Mid-term Financing Bills
Short-term Financing Bills
Enterprise Bonds
Government Bonds
Financial Bonds
Corporate Bonds
Convertible Bonds
Detachable CB
Enterprise Bonds
MOF
PBOC
CSRC
NAFMII
NDRC
CCDC or SHCH
CSDCCustodian Transfer
ROII, RMB Clearing & RMB
Participant Banks
Securities Co.,Mutual Funds,
QFII, RQFII
Institutional & Retail Investors
Insurance Companies
Listed BanksTrust Companies
Social Security Fund
Non-listed Commercial Banks
PBOC NCSSF CIRC CSRCCBRC
Regulates Market Trading
Regulates the Investors
Eligible Investors
Regulates the Bond Issuance
Key: China Central Depository & Clearing Co., Ltd (CCDC); Shanghai Clearing House (SHCH); China Securities Depository and Clearing Corporation Limited (CSDC); Ministry of Finance (MOF); National Association of Financial Market Institutional Investors (NAFMII), formed in 2007 and supervised by PBOC ; National Development and Reform Commission (NDRC); China Banking Regulatory Commission (CBRC); National Council for Social Security Fund, PRC (NCSSF); China Insurance Regulatory Commission (CIRC)
83

13.99%
3.02%
0.21%
16.91%
55.14%
0.61%
0.13%
9.98%
CIBM Remains Dominant
Source: Winds
Historical Trading Volumein RMB trillion
Bonds with Detachable Warrants
China Exchange Market—10.87 % of Total Bond MarketChina Interbank Bond Market—89.13% of Total Bond Mar ketAssets under custody as of August 2016, total valu e of RMB 41.41 trillion(%)
Assets under custody as of August 2016, total value of RMB 5.05 trillion(%)
Source: CSDCSource: CCDC
Government Bond
Policy Bank Bonds
Enterprisebonds Government
Bond Local Government Bond
Policy Bank Bonds
Enterprise bonds
Corporate Bond
Convertible Bond
SME PE Bond
3.88% 9.72% 12.6%21.63%
23.09%
30.84%
20.24%
96.12% 90.28%
87.4% 78.37%
76.91%
69.16%
79.76%
0
50
100
150
200
250
300
350
400
450
500
2010 2011 2012 2013 2014 2015 Aug 2016
Exchange Market China Interbank Bond Market
84
Government Bond26%
Local Governnment
Bond21%
Central Bank Bills1%
Policy Bank Bills30%
Agency Bond3%
Financial Bond4%
Capital Instrument2%
Enterprise Bonds9%
Asset Backed Securities
1%
MTN3%

Growth in Foreign Investor Access
Small Number of Foreign Investors
Spot Bonds
Others
Credit Lending 0% , but expected to be growing as PBOC started to allowed certain foreign investors to invest in those instruments.
Repo
Derivatives
Sources: CCDC, CFETS, SHCH
Who is already in ? What are they investing in? What a re the trends?
• Ease of market access requirements for foreigninvestors by gradually changing current approvalprocess into filing process
• Foreign investors could invest in otherinstruments in CIBM other than spot bonds
• The expected bond connect and the inclusion ofRMB in the SDR basket should bring in freshdemand from foreign investors for RMBdenominated assets
• Considering the rising nominal GDP, doublingthe ratio of bond market cap/GDP ratio in thenext decade could quadruple the size of thebond market
51
100
138
211
305
349
0
50
100
150
200
250
300
350
400
2011 2012 2013 2014 2015 August2016
No. of Foreign Institutional Investors allowed access to bond market as of August 2016
May 2016, in RMB billion
Source: CCDC
Interbank Traded Bonds
Bond under Custody ~RMB 41 trillion ~90%As of August 2016, ~90% of China onshore bonds under custody are inCIBM. Stock Exchanges + Counter only accounted for ~10%.
Spot Bonds
Spot bond trading at ~RMB 53 trillion~13%As of August 2016, most foreign investors could only invest in spot bonds inCIBM, which is 13.37% of total CIBM trading volume. Most transactions(~87%) are from credit lending and repo.
Bonds held by Foreigners
Total foreigners holding bonds ~RMB 0.68 trillion~1.7%As of August 2016, foreign holdings of China domestic bonds were~RMB 686 billion or 1.66% of the market. Domestic commercial banksdominate trading activity in CIBM with ~ 60% market share.
85
296
201
28
17
1
Government Bond
Policy Bank Bonds
Mid Term Notes
Enterprise Bond
Commercial Bonds

Overview Foreign Institutional Investors (FII) in CIBM
As of July 2016 Source: CCDC/SCH
FII’s Trading Characteristics
As of July 2016, 332 FIIs acquired permission to enter CIBM where 94% domestic bonds are traded. FII’s total domesticbond holding was RMB663bn (or 1.63% of China bond market), of which ~80% was attributable to CIBM.
Buy trade dominates, but can be further detailed:� Banks prefer hold-to-maturity investment� AMCs have similar volumes of buy and sell
trade� Very similar pattern to domestic investors
Typical counterparties in CIBM� Domestic banks� Foreign banks� Securities companies
How to find a counterparty� Own channel� Bond settlement agent (BSA)� Via BSA� Domestic alliances such as investment advisors
36%
46%
17%
1%
Bond Maturity Distribution
Up to 1 year 1~5 years 5~10 years Moren than 10 years
As of end of 2015 Source: CCDC/SCH
FII’s participation in CIBM
44%
42%
14%
Investor Type Distribution
Other FI RQFII QFII
As of July 2016 Source: CFETS
55.3%37.1%
3.1% 4.3% 0.2%
Holdings Distribution
Treasury Bond Policy Bank Bond Enterprise Bond
Mid Term Notes Commercial Bond
86

CIBM Policy Updates

Updated Guidance on CIBM AccessIn Q2 2016, China regulators released several FAQs and procedures for ROIIs entering the China Interbank Bond Market (CIBM) and China Interbank Foreign Exchange Market (CIFM).
For Overseas Financial Institutions: For ROIIs:
May 2016:
PBOC and SAFE publishes FAQs,Implementation Details and SAFE Notices provideexplicit guidance and clarification for foreigninvestors to enter CIBM April 2016:
PBOC released FAQs and procedures on Foreign CentralBanks, Sovereign Wealth Funds and Supranational (ROIIs)investing the CIBM and CIFM to address many technical details.
May 2016:CCDC, SHCH and CFETS releases operationguidelines for foreign investors to invest in CIBM
88
Key issues solved/clarified: Overseas Financial Institut ion ROII
Account opening/closure Complete within 3 days, given documents submitted are in good order.
Network connect set up /terminationComplete within 3 days, given the submitted documents are in good order and there is zero balance in theaccount with no outstanding rights.
Investment quota and liquidity No quota limitation. No fund repatriation restriction.
Product and AgreementCash bondBond lending: Lending agreementBond forward, IRS and FRA (hedging purpose ) : NAFMII.
Bond derivatives: NAFMII or ISDABond Repurchase: NAFMIIBond lending: Lending agreement
Inbound/Outbound transfer
Principal injection and repatriation are allowed in eitherRMB or foreign currency.Maintain FX/RMB currency proportion for inbound andoutbound with no more than 10% deviation, except the firstrepatriation.
Principal injection and repatriation are allowedin either RMB or foreign currency after FXconversion onshore
RMB special accountOpen with domestic bank, which shall be used exclusivelyfor fund settlement of bond trading.
Open with PBOC or domestic bank, which shallbe used for fund settlement of bond trading.
Agent Selection N/ADual agent allowed. Non-trade transfer allowedbetween PBOC and commercial banksaccount.
88

CIBM: A Step Towards Internationalization
ROII program Expanded FI program QFII/RQFII RMB participating bank /RMB clearing bank
Year Published 2015 2016 2011/2013 2010
Qualified investors
Central Banks, SWFs, Supranationals
Banks, insurance companies, securities companies, funds and other asset management firms, as well as the investment products issued by these institutions; long term investors recognized by PBOC, such as pension funds, charity funds, endowment funds
QFII and RQFII holder to apply CIBM access in a separate application process
RMB clearing banks Oversea RMB clearing banks with positive offshore RMB balance from RMB XB business
Quota No quota • No quota• manage the program under the “macro
prudential” method
• QFII: quota by investors
• RQFII: quota by region and investors
Quota by bank
Products Cash bond, bond repo, bond lending, bond forward, IRS, FRA
• Cash bond• Others: Bond repo will be allowed for RMB
participating banks and clearing banks
Cash bond Cash bondBond repo (need NAFMII)
Access method to CIBM
(1) PBOC as agent(2) Bond settlement bank as
agent(3) Direct Participation
Domestic commercial banks with agency qualification
Domestic commercial banks with agency qualification
Domestic commercial banks with agency qualification
Market Access Registration RegistrationVia bond settlement bank
Approval Approval
FX Onshore: Access FX as CFETs member via(1) PBOC as agent(2) FX agent bank(3) Direct ParticipationFor FX spot, forward, swap, option
Offshore:Fund transfer
Onshore: • FX conversion with bond settlement bank• Repatriation is allowed as long as outgoing
FX mix (FCY vs. RMB) is within 10% of that brought in
Offshore:Fund transfer
QFII: • Onshore FX
conversion with custodian bank
RQFII:• Offshore RMB
in/outflow
• Offshore RMB in/outflow
89

ROIIsSWFs, central banks/monetary
authorities, international organization
RMB BanksRMB clearing/participating banks,
insurance companies in HK/ SG/ TW
Other FIsOther FIs, e.g. asset managers,
securities companies, pension funds
All other OFIs, Exc. ROIIWhich can be recognized by PBOC
as “mid/long-term investors”
ROIIsSWFs, central banks/ monetary
authorities, international organization
Simplified CIBM Access Process
Bond Agent
PRC Custodian
PBOC
Bond Agent/ PBOC
PBOC
CSRC SAFE
PBOC
PBOC Open Accounts or Registration with
• CCDC
• SCH
• CFETS
• Bond agent/ custodian bank
Bond Agent PBOC
PBOC
Engage PBOC as Bond Agent
Seek CIBM access and Quota Approval
Engage Bond Agent Seek CIBM Access and Quota Approval
Engage PRC Custodian Seek QFII/RQFII License Approval
Seek QFII/RQFIIQuota Approval
Seek CIBM Access and Quota Approval
Engage PBOC or Type A as Bond Agent
Filing with PBOC BJ, No Quota Cap
Engage Bond Agent,Bond Agent Reviews the Eligibility
Filing with PBOC SH, No Quota Cap
Engage PRC Agent/Custodian
Engage PRC Agent/Custodian
Filing with PBOC
Regulatory Approval Process Account OpeningBefore 2015
Current
No quota restriction, qualified investors only need to do a filing with PBOC to get into CIBM.
90

Key Highlights of Expanded FI Programs Quota Cap
Investors Market Entry
The Announcement encourages
long-term foreign investors to invest
in CIBM and No Quota Capfor eligible investors.
Broaden the investors Banks, insurance companies, securities companies, funds and other asset management firms, as well as the investment products issued by these institutions; long term investors recognized by PBOC, such as pension funds, charity funds, endowment funds.
The eligible foreign institutional
investors can invest in products
allowed by the PBOC,
e.g. cash bond , etc.
RMB participating banks can
conduct bond repo
The eligible foreign institutional
investor can participate in CIBM
via filing with PBOC
Shanghai Headquarter through a bond settlement agent.
Two page registration form with
20 business day turn-around
C I B M
Bond InstrumentsQuota Cap
In 2016 H1, China took a major step toward encouraging long-term foreign institutional investors to invest in the world’s third-largest bond market.
RepatriationFXTransfer RMB from Offshore to onshore. Can conduct FX forward,
swap for hedging bond portfolio, subject to basis risk.
FX conversion only; register with SAFE, conduct via bond
settlement bank
For investor, foreign currency outflow remittance is allowed. Foreign
currency mix has to maintain similar level as its inflow
to China, within 10% deviation
91

Appendix: Citi Markets & Securities Service Capability

Present in Major Cities Across the Country Citi Mile stones in China
Citi in China
Representative Office
Lending Company
COE
Existing Branch
Tianjin
Beijing
Shenzhen
Chengdu
Dalian
Hangzhou
Shanghai
Guiyang Guangzhou
Nanjing
Wuxi
Changsha
Chongqing
1 8 20 30 55 60 9,000 159,0001st foreign QFII
custodian bank and 1st foreign bank to
launch QDII
Top Rated custodian in China for 8
years
Top QFII custodian with 20% market
share
Capacity ataround 30%
Consumer outlets covering 13 major cities
in China
Captured 60% market share in the insurance
QDII
Employees in China
Settlements per year with100% settlement rate
1902 1st established operations in Shanghai
2002 1st international bank granted an FX license
2003
2008
2007
2006
2009
2012
Launched RMB debit cards
Received regulatory approval to act as an interbank bond market maker.
1st foreign bank to launch sole branded credit card in China; launched Citi Oriental Securities, securities JV mainly focusing on underwriting business.
Launching RMB services to local residents
2013 1st batch of foreign banks to launch domestic fund distribution business
2014
1st international bank with a custodian bank license; cleared 1st trade of the QFII scheme
1st international bank receiving QDII license and approval to offer custodian service; Strategic alliance with Guangfa Bank
Pilot Foreign Currency Cross Border Treasury Center Solution in Shanghai Free Trade Zone
Citi QFII/RQFII Clients
Citi partners with local banks to offer CIBM service to clients
2015
93

Citi in China Interbank Bond Market
• Top bond market maker and PBoC Primary Dealer
– One of the only three foreign banks
– Awarded Excellent Bond Market Marker 2015
– Large trading volume (ranked No.1 in foreign banks and No.6 among all players)
– Direct communication channels with Regulators; participate in PBoC’s open market operation
– Active influence towards Regulator’s Policy & Product Innovation (Invited by regulators to join most key advisory panels)
• Pioneer in derivatives market
– Widely recognized by partners and competitors as top 3 in CNY IRS market
– First to trade CNY IRS with foreign counterparties (Mar 2006)
– First to trade Shibor linked IRS in China (Jan 2007)
– First peer of CRM (credit risk mitigation tool, Onshore CDS) dealers
– First trade of LPR IRS
• Active in primary market
– Underwriter for Sovereign Panda Bond issued by Korea Finance Ministry with strong book building capability
China Interbank Bond Market—Market Makers
� Industrial & Commercial Bank of China
� Agricultural Bank of China
� Bank of China
� China Construction Bank
� China Merchants Bank
� China CITIC Bank
� Citi China
� China Everbright Bank
� Industrial Bank
� China Minsheng Bank
� Ever Growing Bank
� Bank of Beijing
� Bank of Shanghai
� Bank of Nanjing
� Bank of Hangzhou
� Bank of Hankou
� CITIC Securities
� Guotai Junan Securities
� JP Morgan China
� China Development Bank
� Bank of Communications
� Standard Charter Bank
� China International Capital Corporation
� Guangdong Development Bank
� Shanghai Pudong Development Bank
94

Citi FX Capability
June 2015� Overall FX House of the Year
� FX Option House of the Year
Risk Magazine Institutional Investor Rankings
July 2015� Best Global Bank
� Best Emerging Markets Investment Bank Globally
Euromoney Awards for Excellence
November 2015• Best FX Bank Overall
• Best Bank for Forwards FX
• Best Bank for FX in North America
• Best Bank for USD/JPY
• Best Bank for FX for Corporates
• Best Bank for FX for Investors
FX Week Best Banks Awards
• Best Bank for FX in North America
• Best Bank for e-Trading
• Best Bank for FX Prime Brokerage
• Best bank for FX research
November 2015� Best FX Bank Globally
� Best FX Bank in Latin America
� Best FX Bank in North America
� Best bank for Corporate Currency Hedging
Global Finance Best FX Provider Awards
October 2015� Best Single Dealer Platform - Citi Velocity Trading
Financial News
Year Awards
2010
Most popular Derivatives Market Maker Award
Best CFETS Member Award
Spot Trading Excellence Award
Derivatives Trading Excellence Award
2011
Most popular Derivatives Market Maker Award
Best CFETS Member Award
Spot Trading Excellence Award
CFETS FX Trader Excellence Award
2012CFETS Market Maker Improvement Award
Best CFETS Member Award
2013CFETS Market Maker Improvement Award
CFETS FX Trader Excellence Award
2014
CFETS RMB Trader Excellence Award
CFETS RMB Trader Excellence Award
Citi Ranked 16th in the CFETS Top 100 RMB Market Makers.
Onshore China
• In 2006, Citi was appointed as the China Interbank FX market marker, one of the first foreign banks to get approval
– One of the most active market makers in the Interbank Foreign Exchange Market in China.
• In March 2011, Citi received approval to trade Yuan options
Globally
95

Appendix: QFII and RQFII Market Update

US, 27%
China, 2%
Japan, 14%
Germany,7%
France, 6%
UK, 5%
Rest of the
World, 41%
GDP Weighting 1990World GDP 22.5 Trillion
China: Too Big to Ignore
97
Source: Bloomberg, SSE, SZSE
China Stock Market is the 2 nd largest worldwideAs of June 2016, total trading volume of both the Shanghai and Shenzhenstock exchange reached USD~39 trillion, and ranked 2nd largest in terms ofmarket capitalization.
Global Exchange Market CapitalizationJune 2016, in USD trillion
Source: International Monetary Fund, World Economic Outlook Database
GDP Weighting 2015World GDP 73.4 trillion
The world's second largest economy GDP weighting in USD trillion, 2015
Rest of the World,
44%
US, 24%
China, 15%
World Payment Shares in SWIFTJune 2016
Top 6 Currency in Global PaymentsChina is now the world’s largest economy measured by purchasingpower parity (PPP) and the largest trading nation. RMB has beenshowing a consistent three-digit growth over the past two years with anincrease in value of payments by +321%. The successful RMB inclusionin the SDR basket (in effect from October 2016) will shake up the way theworld thinks about a ‘reserve asset’.
Source: RMB tracker by SWIFT
0
5
10
15
20
25
30
US China Japan Hong Kong UK
40.97%30.82%
8.73%3.46%
1.96%1.72%1.68%1.41%1.16%1.04%
USDEURGBPJPYCADCNYAUDCHFSEKHKD
MarketNo. of Listed Companies
Market Cap(in USD billion)
Average DailyTrading Value(in USD billion)
Shanghai Main Board
1,122 3,784 29
Shenzhen Main Board
478 997 13
Shenzhen- SME Board
791 1,419 24
Shenzhen-ChiNext Board
512 781 15
Summary of China Equity Market June 2016
US25.30%
China15.52%
Japan6.01%Germany
4.73%
France3.76%
UK3.36%
Rest of the World
41.32%

China Mutual Funds Market(NAV of Open-ended Funds in RMB Billion)
China Foreign Exchange MarketUSD / RMB Foreign Exchange Rate
2–30 Years Yields for Government BondsAugust 2015
Equity—China A Share1H16 China A share Market Movement
China Markets PerformanceChina foreign exchange, funds and bonds market also performed correspondingly to reflect the boom and collapse of the stock market and China capital market development.
Source: BloombergSource: Investing.com
Source: SAFE Source: AMAC
-1.00%
0.00%
1.00%
2.00%
3.00%
4.00%
2 Yrs 5 Yrs 10 Yrs 30 Yrs
JP US UK CN
6.30
6.35
6.40
6.45
6.50
6.55
6.60
6.65
6.70
6.75
2500
2600
2700
2800
2900
3000
3100
3200
3300
3400
3500
04/01/2016 04/02/2016 04/03/2016 04/04/2016 04/05/2016 04/06/2016
3,622 3,486
4,221
5,124
6,681 7,114
8,397 7,950
-
1,000
2,000
3,000
4,000
5,000
6,000
7,000
8,000
9,000
Dec 2012 Jun 2013 Dec 2013 Jun 2014 Dec 2014 Jun 2015 Dec 2015 Jun 2016
98

QFII and RQFII: Main Channel For China A Shares Investment
99
The QFII scheme was established in 2002 to attracted foreign institutional investors to invest in China’s domestic A-share market. RQFII was launched around 10 years after the QFII schemes to be further expanded to meet the increasing demand for offshore RMB products.
Source: CSRC, SAFE.
QFIIs Around the World
APAC169
USD 47.865 bn
North America59
USD 11.038 bn
Europe65
USD17.128 bnMiddle East
3USD 5 bn
Africa1
USD 0.15 bn
• No. of QFIIs
• Size of Quota
Continuous Expansion of RQFII (RMB in Billions)
Country/Region
Inception Date Quota Ceiling
No. of RQFIIs with Quota
Total Approved Quota
Hong Kong 2011 270 79 270
Singapore 2013 100 23 56.5
UK 2013 80 15 30.1
France 2014 80 7 24
Korea 2014 120 34 74
Germany 2014 80 2 6.543
Qatar 2014 30 0 0
Canada 2014 50 2 1.825
Australia 2014 50 1 30
Switzerland 2015 50 1 5
Luxemburg 2015 50 3 10
Chile 2015 50 0 0
Hungary 2015 50 0 0
Malaysia 2015 50 0 0
UAE 2015 50 0 0
Thailand 2015 50 0 0
United States 2016 250 0 0
QFII Scheme RQFII Scheme
The Qualified Foreign Institutional Investors (QFII) scheme isa program that allows foreign asset owners, sell sides andasset managers to make foreign currency –denominated(primarily USD) investments into securities markets on theChina.
The QFII scheme has transformed from an initial test-bed forforeign participation in the China securities market to thecornerstone of China’s cross-border programs. We believeQFII will paly a pivotal role in the opening of China’s capitalaccount.
The RMB Qualified Foreign Institutional Investors (RQFII) scheme is topromote usage of the RMB abroad by providing a RMB-denominatedinvestment channel into China’s capital-controlled environment.
The RQFII scheme has been dominated by asset managers since thescheme’s inception in 2011. We are now seeing the scheme grow to includeasset owners and the sell side.

Key Highlights of QFII New Rules
Simplified Quota Approval Mechanism• Basic Quota. QFII can make a filing with SAFE for a “basic
investment quota” based on certain % of its total asset or AUMThe Basic Quota is set within a range of US$20 million to US$5billion (increased from the previous upper limit of US$1 billion).
• For certain types of QFIIs such as SWFs, central banks andmonetary authorities, the Basic Quota will not apply and they mayapply a quota up to US$5 billion through filing process.
• SAFE’s approval is only required when the quota being appliedfor exceeds the Basic Quota.
Injection Period Removed and Lock-up Period Improved• 3 months lock-up period for all the QFIIs. The new lock-up period
for principal repatriation has been shortened from1 year to 3 months for non-open-ended funds other than pensionfunds, insurance funds, mutual funds, charitable funds,endowment funds, governments and monetary authorities
• 6 months injection period removed, but a QFII will need to use itsquota within one year of the filing or approval
Flexible Cross-border Remittance• Daily basis injection or repatriation on the net subscription or
redemption for open-end fund
• The net amount of investment capital remitted into China shall bewithin the investment quota
• No approval needed for non-open-end fund principal repatriation.No restriction in term of frequency of repatriation fornon-open-end fund
• The monthly net repatriation cap still applicable to all QFIIs (being20% of its total onshore assets as at the end of the previous year)
On February 4, 2016, SAFE eased QFII access with more transparent quota allocations and easier in/outflow.
Type of QFII Basic Quota Calculation
For QFII or its Group Company Who Have Their Majority of Assets (or Assets Under Management) outside of China
• US$100 million + 0.2% of the average assets size in thelatest three years – Existing RQFII quota (in US$)
• The basic quota granted shall notexceed US$5 billion
For QFII or its Group Company Who Have the Majority of Assets (or Assets Under Management) inside of China
• Equivalent RMB 5 billion + 80% of the assets size in the last fiscal year – Existing RQFII quota (in US$)
• The basic quota granted shall not exceed US$5 billion
Foreign SWFs, Central Banks and International Monetary Authorities
• The basic quota granted shall not exceed US$5 billion
100

Key Highlights of R-QFII New RulesSAFE announced the new R-QFII rules on September 5, 2016
Simplified Quota Approval Mechanism
• Basic Quota. R-QFII can make a filing with SAFE for a
"basic investment quota" based on certain % of its total asset
or AUM.
• For certain types of R-QFIIs such as SWFs, central banks
and monetary authorities , the Basic Quota will not apply
and they shall self-determine the intended investment quota
through filing process.
• SAFE's approval is only required when the quota being
applied for exceeds the Basic Quota.
Injection period removed and lock-up period improved
• 3 months lock-up period for all the R-QFIIs except open
ended fund, commence from the date when accumulated
principal injection reaches to RMB 100 million .
Flexible cross-border remittance
• Daily injection or repatriation are allowed for all R-QFII
product types.
• Re-injection of principal is now allowed for non-open-end
fund within the investment quota.
Type of R-QFII Basic Quota Calculation
For R-QFII or its group company with majority of assets (or assets under management) outside of China
USD 100 million in RMB equivalent+ 0.2% of the average assets size in the latest three years - Existing QFII quota (in RMB)
For R-QFII or its group company with majority of assets (or assets under management) inside of China
RMB 5 billion + 80% of the average assets size in the last fiscal year- Existing QFII quota (in RMB)
Foreign SWFs, Central Banks and international monetary authorities
Determine the intended investment quota at its own discretion.
101

Comparison of QFII and RQFII SchemesQFII R-QFII
Quota
• No individual quota ceiling, Quota shall be used within 1-year upon approval
• Aggregated quota ceiling: US$$ 150 billion• Aggregated quota ceiling: each RQFII eligible countries has a
aggregated quota ceiling, within a range RMB 50 billion to RMB 250 billion
1. Only go through filing process– For commercial institutions, if the applied quota < = “Basic Quota”– For SWFs, central banks and monetary authorities, if the applied quota <
= US$$ 5 billion2. Any applied quota larger than the Point 1 above, quota approval needed
from SAFE
1. Only go through filing process– For commercial institutions, if the applied quota < = “Basic Quota”– For SWFs, central banks and monetary authorities: own discretion
2. Any applied quota larger than the Point 1 above, quota approval needed from SAFE
Eligible Investors or Institutions
• Commercial Banks (≥10 years in operation,US$5 billion AUM, US$300 million Tier 1 Capital)
• Securities Companies (≥5years in operation,US$5 billion AUM, US$500 million Capital)
• AMC, insurance companies and other institutions (Experience of 2+ years, and AUM ≥US$500 million
• PRC AMC, securities companies, commercial banks, insurance companies in approved RQFII markets
• Other institutions registered and mainly operated in RQFII approved markets and possess asset management license from the relevant regulators of their jurisdictions
Currency • Quoted granted in US$ or other major foreign currency • Quoted granted in RMB
Add. Quota Gap Period • No waiting time for additional quota application
Liquidity for Open-end Fund Account
• Daily injection and repatriation
• 3 months lock-up period starting from the date US$20 million principal injected
• No lock-up period
Liquidity for Non-open-end Fund Account
• 3 months lock-up period starting from the date US$20 million principal injected
• 3 months lock-up period since accumulated principal injection reaches to RMB 100 million.
• No injection period restriction
• No restriction on repatriation frequency
• For principal repatriation, principal can be re-injected, but the net amount of investment capital remitted into China shall be within the investment quota
• For profit repatriation, audit reports issued by domestic accounting firm and relevant tax payment evidence are needed
• For profit repatriation, audit reports issued by domestic accounting firm and relevant tax payment evidence are needed
Monthly Cap• For all the QFIIs, monthly repatriation capped at 20% of its total asset of
QFII investments at the end of last year• No monthly cap.
102

Overview of QFII/RQFII Asset Allocation and Investment
0%
5%
10%
15%
20%
25%
30%
35%
40%
45%
Bank Food, Drinkand
Tobacco
DurableConsumerGoods and
Clothing
Transport Material Cars andAutoparts
Other
QF
II’s
Pos
ition
Dis
trib
utio
n
0.9%3.5% 4.2%
14.5%
47.2%
29.6%
0%
5%
10%15%
20%
25%30%
35%
40%45%
50%
<0 0-5 5-10 10-15 15-20 >20
QF
II’s
Pos
ition
Dis
trib
utio
n
Stock ROE%
80%
15%
5%
CSI 300 Component Stocks SME Board Enterprises Board0 10 20 30 40 50 60 70 80 90 100
QFII
RQFII
Bond Fund Equity Cash and Other
As of Aug 2016. Source: Wind
As of Mar 2016. Source: CSRCSource: CSRC Apr 2016 Training
Total Asset: $29.94bn Equivalent
Total Asset: $29.94bn
As of Aug 2016. Source: Wind
QFII/RQFII’s position distribution in China A-shares by industry and by stock ROE
QFII/RQFII’s asset allocation QFII/RQFII’s equity investment allocation in China A-shares
QFII/RQFII’s asset allocation is majorly attributable to China A-shares, while their equity investment indicate strong “valueinvestment” strategy, with 80% investment flowing into high ROE CSI 300 component stocks.
103

270
10080 80
120
80
3050 50 50 50 50 50 50 50 50
250
270
56.5
30.1 24
74
6.543 0 1.825
30
5 100 0 0 0 0 0
0
50
100
150
200
250
300
Hong Kong Singapore UK France Korea Germany Qatar Canada Australia Switzerland Luxembourg Chile Hungary Malaysia UAE Thailand USA
Quo
ta (
RM
B b
n, b
y Q
2 20
16)
Quota Ceiling (RMB bn) Total Approved quota (RMB bn)
RQFII Landscape
Source: SAFE, CSRC.
HK: 270/270
Singapore: 56.5/100
UK: 30.1/80
France: 24/80
Germany: 6.543/80
Korea:74/120Switzerland 5/50
Luxembourg: 10/50
Canada: 1.825/50
Chile: 0/50
Hungary: 0/50
Malaysia: 0/50
Thailand: 0/50
UAE: 0/50
Qatar: 0/30
Australia: 30/50
USA: 0/250
Quota ceiling/Approved Quota ( RMB billion)
104

RQFII and QFII Quota Availability for Foreign Investors as of June 2016
RQFII USD 218bn (USD 76bn approved)
USD 68.82bn Available QFII Quota
USD 81.18bn Approved QFII Quota
QFII USD 150bn (USD 81bn approved)
HKRMB270bn of
RMB270 approved
UKRMB30.1bn of 80bn approved
FranceRMB24bn of 80bn
approved
GermanyRMB6.543bn of 80bn approved
KoreaRMB74bn of 120bnapproved
Singapore RMB 56.5 bn of 100 approved
Australia RMB
10bn of 50
approved
Chile RMB 0bn
of 50 approved
Canada RMB
1.825bn of 50
approved
Hungary RMB 0bn
of 50 approved
Malaysia RMB 0bn
of 50 approved
UAERMB 0bn
of 50 approved
ThailandRMB 0bn
of 50 approved
QatarRMB
0bn of 30
approved
Switzerland RMB
5bn of 50 approved
Luxembourg RMB 10bn of
50 approved
Source: SAFE
US0bn of RMB250
approved
105

QFII/RQFII Application ProcessUnder normal situation, the QFII/RQFII application takes around 2-3months to complete.
CSRC
SAFE
PBOC
CSDCC
SSE
Obtain securities investment license
Obtain Investment Quota via filing/approval process
Obtain approval for RMB and FCY account with custodian bank
Apply investor IDs in both CSDCC Shanghai and Shenzhen branches
Filing with Shanghai and Shenzhen Stock Exchange above approval
Capital Injection
Prepare application documents
Start Trading
3-5 Weeks
2-3Months
2 Weeks
SAFE
PBOC
CSDCC
SSE/SZSE
106

QFII/RQFII Application RequirementForeign investors intending to enter China securities market must meet certain qualifications for getting the approval from CSRC and SAFE.
QFII Years of Business Experience Net Asset Assets under Management Other Requirement
Fund Management Company, Insurance Companies and Other Institutional Investors*
2+ N/ANo less than
USD 500 millionN/A
Securities Firms 5+No less than USD 0.5
billionNo less than
USD 5 billionN/A
Commercial Banks 10+ N/ANo less than
USD 5billionTier 1 capital not less than
USD 300 million
MOU Between CSRC and Applicant’s financial regulator
RQFII Application Requirement
Subsidiaries of PRC fund management companies, securities companies, domestic commercial banks, insurance companies
Based in Hong Kong/UK/Singapore/France/Korea/Germany /Qatar/Canada/Australia/Switzerland/Luxemburg/Chile /Hungary /Malaysia, UAE, Thailand and the US
Other institutions possess asset management license from the relevant regulators
registered and mainly operated in Hong Kong/UK/Singapore/France/Korea/Germany /Qatar/ Canada/Australia/ Switzerland/ Luxemburg/Chile/Hungary/Malaysia/UAE/Thailand/US
*Other Institutional Investors include pension funds, charity funds, donation funds, trust companies, government investment management companies etc.107

QFII/RQFII Documentation Requirement
QFII RQFII
Regulator Purpose of Application
Required Documentation
CSRC License
• CSRC QFII / RQFII Application Form
• Registration forms of QFII / RQFII team
• Investment Plan
• Copy of Business License
• Copy of Financial License
• Certificate of proof that key personnel of applicant satisfy requirements for qualification of practice in the country where theapplicant is domiciled
• Statement on any substantial penalties by regulators in the last three years
• Statement on fund sources and domestic securities investment plan
• Audited financial statements for the latest year
• Power of attorney signed with PRC custodian
• Other documents required by CSRC
SAFE Quota
For Basic quota filing:
• Explanation Letter for application of quota filing
• QFII Registration Form
• Audited balance sheets for the past 3 years/last year (or audit reports for securities AUM, etc.)
• Securities Investment business license issued by CSRC
• Evidence document for approved RQFII quota (if applicable)
For quota application ( if the asked quota > basic quota):
• Application letter
• Audited balance sheets for the past 3 years/last year (or audit reports for securities AUM, etc.)
• Other materials required by SAFE
Qualified institutions should apply to CSRC for QFII/R-QFII license and subsequently to SAFE for investment quota.
108

Citi China Custodian QFII/RQFII Operational Support Capabilities
Settlement Services� Efficient settlement of transactions and enhanced
operational efficiency through our advanced technology and processing platforms
� Highest STP rate in the industry - 99%
� For China A, for those clients which may not be able to send out the settlement instruction before cut-off time ( e.g. due to time zone issue), Citi China now can facilitate them to settle based on CSDC data. Those client only need to pre-set a SI with Citi china to authorize Citi China to settle without settlement instruction and based on CSDC data.
Asset Servicing� Robust corporate actions offering
� Income payment
� Proxy voting : flexible voting methods
� Corporate actions calendar: we provide the corporate actions calendar to our R-QFII clients who require the service. The corporate actions calendar is a value-added report to R-QFII clients, which is a weekly summary covering all living corporate actions events of the A-shares of the China stock market. With this corporate actions calendar, R-QFII clients will be able to have a full picture on the whole corporate actions event.
Reporting� Full support of QFII/RQFII reporting requirements for internal
and regulatory reporting, including comprehensive substantial shareholding reports, securities and cash holdings, corporate actions, executive MIS reports, investment activity reports and annual financial reporting of the client’s investment, inward and outward remittances, foreign exchange conversions
� Assist to communicate with regulators on reporting and information disclosure requirement
Value Added Services� Timely provision of market information and notification of any
regulatory changes to QFII rules
� Citi maintains a consistent and regular interaction with the regulators and market participants in order to ensure that our clients get the most updated and accurate information in a timely manner.
� Assist to resolve problems/errors between the broker and the central depository (CSDCC), and complete special regulatory reporting and abnormal cash movement after approval
� Perform periodic service reviews to receive RQFII’s feedback on our services, which will enable us to improve our services
Citi China has a dedicated QFII/R-QFII operation team to support the daily operation work, including regulatory reporting, client service, settlement and corporate actions.
109

Partnership with Other Services ProviderWell-established relationships between Citi and top local services providers. By working closely together, Citi China manage to deliver best class custodial services in QFII and RQFII space.
Below is a reference list with our QFII/RQFII’s services providers which have been working with Citi many years .
� CICC
� Citic� UBS
� Goldman Gaohua� Shenyin & Waiguo
� Haitong
� Guosen� Galaxy
� Guangfa� Guotai Junan
Brokers� Harvest
� Bosera� China AMC
� China International Fund Management
� Aegon-Industrial
� Huabao
Asset Managers� Haitong futures
� Citic futures� Galaxy futures
� Guotai Junan futures
Futures Companies� EY
� KMPG� Deloitte
� PWC
CPA Firms
110

Appendix: Understanding RMB

Understand RMB
London
TaiwanHong Kong
Singapore
RMB (Renminbi)
Chinese Currency(Onshore)
Capital AccountCurrent Account
Restricted Restricted
Today - “One Currency, Two Systems”
RMB (Renminbi)
CNH(Offshore)
CNY(Onshore)
Capital AccountCurrent Account
Unrestricted Subject to ApprovalSubject to Approval
• Current account and capital account strictly controlled. No cross-border allowed
• G3 currencies used for cross-border trade and investment
• Little exposure for RMB outside China; no offshore RMB market
Before 2009 - Domestic
RMB is developing quickly as a functional currency for trade settlement and cross-border investment
• FX daily band onshore + PBOC Intervention
• RMB as Top 5 World Payment Currency* (20%+ of China RMB trade settled)
• In the process of liberalizing capital account
• No FX restriction offshore• Onshore + Offshore FX Daily
Volume: $285Bn+
• ‘Orphan Currency’: no natural oversight structure
SH
Convertible
*SWIFT, Data as of 2015; +According to Triennial Central Bank Survey of foreign exchange and derivatives market activity in 2013
112

RMB FX and Interest Rate Market
Source: Bloomberg. Data as of Jan 13, 2016.
FX Rate (Aug 2010 – Jan 2016)
Interest Rate (Aug 2012 – Jan 2016)
-0.2
-0.15
-0.1
-0.05
0
0.05
0.1
0.15
0.2
6
6.1
6.2
6.3
6.4
6.5
6.6
6.7
6.8
6.9
USDCNH-USDCNY (right)
USDCNH
USDCNY
0
2
4
6
8
10
12
3M HIBOR (HK)
3M SHIBOR (Shanghai)
113

RMB in Reserve PortfolioOffshore RMB Centers Cross Border Trade Settlement
Trade Currency
Any corporate can use RMB to settle trade anywhere in the world
Investment Currency Reserve Currency
RMB increasingly used in cross-border investment and financing
RMB on its way to become a world reserve currency
RMB entered Special Drawing Rights currency basket in Nov 2015
20 has established arrangement for clearing and settlement
At least 38 central banks hold RMB reserves as of 2014 (IMF 2015 survey)
The Roadmap of RMB Internationalization
London
TaiwanHong Kong
Singapore
2007: RMB-denominated bond2010: CNH transferability, access to China bond market, RMB-denominated ETFs2011: RMB IPO, 2013: CNH HIBOR fixing2014: HK Primary Liquidity Provider (Citi)
2011: RQFII 1 - RMB20bn2011: RMB FDI and ODI, FIE financing offshore2012: RMB inter-company loan2013: RQFII 3 - RMB270bn, further relaxation
on RMB FDI2014: SFTZ: 2-way RMB pooling2014: SH-HK stock connect, RQDII (no quota)2015: Mutual Recognition of Funds (MRF)
2009: Pilot for 5 Cities
2010: 20 Provinces
2011: Nationwide in China
2009: Pilot for 3 countries/ territories
2010: All countries/ territories
China
Rest of World
Documentation
2012: Provincial pilots of simplification
2013: Nationwide simplification
2014: SFTZ: no documentation
Cross-border Investments
Currency Swap Agreements
Bilateral currency swap agreements between China and 32 central banks
114

SDR Inclusion is Positive for Long-term Capital Flows into RMB Assets
Background
• IMF formally announced the inclusion of the RMB as a fifth currency in the SDR currency basket from October 1, 2016 onward, with a weighting of 10.92%
• It could encourage an increase in global asset diversification into RMB assets and promote RMB internationalization
• Global asset allocations and diversification into RMB assets will likely be gradual
Global FX Reserve
• Global FX reserves (ex-China) as of 2Q15: US$7.8 trillion
• The US$ took 63.8% of the world’s allocated FX reserves outstanding, while the RMB is estimated to have taken merely 1.1% as of 2Q15
AssumptionsAccording to IMF, RMB may have taken 1–2% of the world’s allocated FX reserves outstanding as of 2015. A industry survey of central banks sponsored in April 2015 highlights that the RMB could account for 5% of global FX reserves in 5 years, and 10% (US$780 billion) in 10 years, With this assumption, we can back out an annual growth rate of 23% of RMB allocations. The graph shows a projected trend based on this growth rate.
0200,000400,000600,000800,000
1,000,0001,200,0001,400,000
Jap
an
Sau
di A
rabi
a
Sw
itzer
land
Tai
wan
Rus
sia
Sou
th K
orea
Bra
zil
Hon
g K
ong
Indi
a
Sin
gapo
re
Ger
man
y
Mex
ico
Alg
eria
Tha
iland UK
Fra
nce
Top 20 Countries Ranked by FX Reserve (Ex-China)( US$ in Billions)
0
200
400
600
800
1,000
2015 2020 2025
Projected Growth of RMB Allocation(US$ in Billions)
Allocation into RMB Assets
• The direct SDR-related flows would be FX conversions by IMF members ($280 Billion as of 3Q15) to maintain their quotas in the appropriate proportion by the end of September 2016
• As China opens up channels for investment, private and public sector allocation to RMB assets is expected to rise
• It is estimated that the RMB’s share in global reserves could reach 5% in five years, and 10% in 10 years
Source: IMF, Citi Research.
115

Onshore-Offshore Liquidity Comparison
FX Forward/ Swap IRS CCS FXO
Onshore Deliverable CNY
� Accessible for ROIIs
Avg. Daily Vol: USD 20-40bn
Avg. Deal Size: USD 10-20m
Tenor: Up to 10yrs
Liquid Tenor: Up to 1yr
� Accessible for ROIIs
Avg. Daily Vol: CNY 25bn
Avg. Deal Size: CNY 100-200m
Tenor: Up to 10yrs
Liquid Tenor: Up to 5yrs
� Accessible for ROIIs
Thin Liquidity
� Accessible for ROIIs
Avg. Daily Vol: USD 200-300m
Avg. Deal Size: USD 10-20m
Tenor: Up to 3yrs
Liquid Tenor: Up to 1yr
Offshore Non-Deliverable CNY
� No access for onshore entities
Avg. Daily Vol: USD 10bn
Avg. Deal Size: USD 20m
Tenor: Up to 5yrs
Liquid Tenor: Up to 1yr
� No access for onshore entities
Avg. Daily Vol: USD 2bn
Avg. Deal Size: USD 20-30m
Tenor: Up to 10yrs
Liquid Tenor: Up to 5yr
� No access for onshore entities
Avg. Daily Vol: USD 50-300m
Avg. Deal Size: USD 10-50m
Tenor: Up to 10yrs
Liquid Tenor: Up to 1yr
� No access for onshore entities
Avg. Daily Vol: USD 500m
Avg. Deal Size: USD 30m
Tenor: Up to 5yrs
Liquid Tenor: Up to 1yr
Offshore Deliverable CNH
� No access for onshore entities
Avg. Daily Vol: USD 20-40bn
Avg. Deal Size: USD 20-50m
Tenor: Up to 5yr
Liquid Tenor: Up to 1yr
� No direct access for onshore entities
� New market (CNH HIBOR)
Thin Liquidity
� No access for onshore entities� New market (CNH HIBOR)
Avg. Daily Vol: USD 600-800m
Avg. Deal Size: USD 10-50m
Tenor: Up to 10yrs
Liquid Tenor: Up to 5yr
� No access for onshore entities
Avg. Daily Vol: USD 1bn
Avg. Deal Size: USD 50-100m
Tenor: Up to 3yrs
Liquid Tenor: Up to 3yrs
Source: SAFE, Citi Research
116

In any instance where distribution of this communication is subject to the rules of the US Commodity Futures Trading Commission (“CFTC”), this communication constitutes an invitation to consider entering into a derivatives transaction under U.S. CFTC Regulations §§ 1.71 and 23.605, where applicable, but is not a binding offer to buy/sell any financial instrument. This communication is prepared by individual sales and/or trading personnel of Citi which distributes this communication by or through its locally authorised affiliates (collectively, “Citi”). Sales and/or trading personnel are not research analysts, and the information in this communication (“Communication”) is not intended to constitute “research” as that term is defined by applicable regulations. Unless otherwise indicated, any reference to a research report or research recommendation is not intended to represent the whole report and is not in itself considered a recommendation or research report. All views, opinions and estimates expressed in this Communication (i) may change without notice and (ii) may differ from those views, opinions and estimates held or expressed by Citi or other Citipersonnel. This Communication is provided for information and discussion purposes only, is subject to change without notice, is strictly confidential, may not be reproduced and is intended for your use only. It does not include a number of terms and conditions that will be included in any actual transaction and final terms and conditions are subject to further discussion and negotiation nor does it purport to identify all risks (direct or indirect). This communication is not a commitment to deal in any product, offer financing or enter into any transaction described herein. Unless otherwise indicated, (i) it does not constitute an offer or recommendation to purchase or sell any financial instruments or other products, (ii) it does not constitute a solicitation if it is not subject to the rules of the CFTC (but see discussion above regarding communication subject to CFTC rules) and (iii) it is not intended as an official confirmation of any transaction. Unless otherwise expressly indicated, this Communication does not take into account the investment objectives or financial situation of any particular person. Recipients of this Communication should obtain advice based on their own individual circumstances from their own tax, financial, legal and other advisors before making an investment decision, and only make such decisions on the basis of the investor's own objectives, experience and resources. The information contained in this Communication is based on generally available information and, although obtained from sources believed by Citi to be reliable, its accuracy and completeness cannot be assured, and such information may be incomplete or condensed. This communication is directed exclusively at market professionals, financial intermediaries and institutional investor customers and is not intended for distribution to retail customers. Any on-distribution has not been approved or authorized by Citi, who expressly disclaims liability for such on-distribution. Citi is not acting as your agent, fiduciary or investment adviser and is not managing your account. The provision of information in this Communication is not based on your individual circumstances and should not be relied upon as an assessment of suitability for you of a particular product or transaction. It does not constitute investment advice and Citi makes no recommendation as to the suitability of any of the products or transactions mentioned. Even if Citi possesses information as to your objectives in relation to any transaction, series of transactions or trading strategy, this will not be deemed sufficient for any assessment of suitability for you of any transaction, series of transactions or trading strategy. Save in those jurisdictions where it is not permissible to make such a statement, we hereby inform you that this Communication should not be considered as a solicitation or offer to sell or purchase any securities, deal in any product or enter into any transaction. You should make any trading or investment decisions in reliance on your own analysis and judgment and/or that of your independent advisors and not in reliance on Citi and any decision whether or not to adopt any strategy or engage in any transaction will not be Citi’s responsibility. Citi does not provide investment, accounting, tax, financial or legal advice; such matters as well as the suitability of a potential transaction or product or investment should be discussed with your independent advisors. Prior to dealing in any product or entering into any transaction, you and the senior management in your organisation should determine, without reliance on Citi, (i) the economic risks or merits, as well as the legal, tax and accounting characteristics and consequences of dealing with any product or entering into the transaction (ii) that you are able to assume these risks, (iii) that such product or transaction is appropriate for a person with your experience, investment goals, financial resources or any other relevant circumstance or consideration. Where you are acting as an adviser or agent, you should evaluate this Communication in light of the circumstances applicable to your principal and the scope of your authority. The information in this Communication, including any trade or strategy ideas, is provided by individual sales and/or trading personnel of Citi and not by Citi’s research department and therefore the directives on the independence of research do not apply. Any view expressed in this Communication may represent the current views and interpretations of the markets, products or events of such individual sales and/or trading personnel and may be different from other sales and/or trading personnel and may also differ from Citi’s published research – the views in this Communication may be more short term in nature and liable to change more quickly than the views of Citi research department which are generally more long term. On the occasions where information provided includes extracts or summary material derived from research reports published by Citi’s research department, you are advised to obtain and review the original piece of research to see the research analyst’s full analysis. Any prices used herein, unless otherwise specified, are indicative. Although all information has been obtained from, and is based upon sources believed to be reliable, it may be incomplete or condensed and its accuracy cannot be guaranteed. Citi makes no representation or warranty, expressed or implied, as to the accuracy of the information, the reasonableness of any assumptions used in calculating any illustrative performance information or the accuracy (mathematical or otherwise) or validity of such information. Any opinions attributed to Citi constitute Citi’s judgment as of the date of the relevant material and are subject to change without notice. Provision of information may cease at any time without reason or notice being given. Commissions and other costs relating to any dealing in any products or entering into any transactions referred to in this Communication may not have been taken into consideration. Any scenario analysis or information generated from a model is for illustrative purposes only. Where the Communication contains “forward-looking” information, such information may include, but is not limited to, projections, forecasts or estimates of cashflows, yields or return, scenario analyses and proposed or expected portfolio composition. Any forward-looking information is based upon certain assumptions about future events or conditions and is intended only to illustrate hypothetical results under those assumptions (not all of which are specified herein or can be ascertained at this time). It does not represent actual termination or unwind prices that may be available to you or the actual performance of any products and neither does it present all possible outcomes or describe all factors that may affect the value of any applicable investment, product or investment. Actual events or conditions are unlikely to be consistent with, and may differ significantly from, those assumed. Illustrative performance results may be based on mathematical models that calculate those results by using inputs that are based on assumptions about a variety of future conditions and events and not all relevant events or conditions may have been considered in developing such assumptions. Accordingly, actual results may vary and the variations may be substantial. The products or transactions identified in any of the illustrative calculations presented herein may therefore not perform as described and actual performance may differ, and may differ substantially, from those illustrated in this Communication. When evaluating any forward looking information you should understand the assumptions used and, together with your independent advisors, consider whether they are appropriate for your purposes. You should also note that the models used in any analysis may be proprietary, making the results difficult or impossible for any third party to reproduce. This Communication is not intended to predict any future events. Past performance is not indicative of future performance. Citi shall have no liability to the user or to third parties, for the quality, accuracy, timeliness, continued availability or completeness of any data or calculations contained and/or referred to in this communication nor for any special, direct, indirect, incidental or consequential loss or damage which may be sustained because of the use of the information contained and/or referred to in this Communication or otherwise arising in connection with the information contained and/or referred to in this Communication, provided that this exclusion of liability shall not exclude or limit any liability under any law or regulation applicable to Citi that may not be excluded or restricted. The transactions and any products described herein may be subject to fluctuations of their mark-to-market price or value and such fluctuations may, depending on the type of product or security and the financial environment, be substantial. Where a product or transaction provides for payments linked to or derived from prices or yields of, without limitation, one or more securities, other instruments, indices, rates, assets or foreign currencies, such provisions may result in negative fluctuations in the value of and amounts payable with respect to such product prior to or at redemption. You should consider the implications of such fluctuations with your independent advisers. The products or transactions referred to in this Communication may be subject to the risk of loss of some or all of your investment, for instance (and the examples set out below are not exhaustive), as a result of fluctuations in price or value of the product or transaction or a lack of liquidity in the market or the risk that your counterparty or any guarantor fails to perform its obligations or, if the product or transaction is linked to the credit of one or more entities, any change to the creditworthiness of the credit of any of those entities. Citi (whether through the individual sales and/or trading personnel involved in the preparation or issuance of this Communication or otherwise) may from time to time have long or short principal positions and/or actively trade, for its own account and those of its customers, by making markets to its clients, in products identical to or economically related to the products or transactions referred to in this Communication. Citi may also undertake hedging transactions related to the initiation or termination of a product or transaction, that may adversely affect the market price, rate, index or other market factor(s) underlying the product or transaction and consequently its value. Citi may have an investment banking or other commercial relationship with and access to information from the issuer(s) of securities, products, or other interests underlying a product or transaction. Citi may also have potential conflicts of interest due to the present or future relationships between Citi and any asset underlying the product or transaction, any collateral manager, any reference obligations or any reference entity. Any decision to purchase any product or enter into any transaction referred to in this Communication should be based upon the information contained in any associated offering document if one is available (including any risk factors or investment considerations mentioned therein) and/or the terms of any agreement. Any securities which are the subject of this Communication have not been and will not be registered under the United States Securities Act of 1933 as amended (the Securities Act) or any United States securities law, and may not be offered or sold within the United States or to, or for the account or benefit of, any US person, except pursuant to an exemption from, or in a product or transaction, not subject to, the registration requirements of the Securities Act. This Communication is not intended for distribution to, or to be used by, any person or entity in any jurisdiction or country which distribution or use would be contrary to law or regulation. This Communication contains data compilations, writings and information that are confidential and proprietary to Citi and protected under copyright and other intellectual property laws, and may not be reproduced, distributed or otherwise transmitted by you to any other person for any purpose unless Citi’s prior written consent have been obtained. Although Citibank, N.A. (together with its subsidiaries and branches worldwide, "Citibank") is an affiliate of Citi, you should be aware that none of the financial instruments or other products mentioned in this Communication (unless expressly stated otherwise) are (i) insured by the Federal Deposit Insurance Corporation or any other governmental authority, or (ii) deposits or other obligations of, or guaranteed by, Citibank or any other insured depository institution. IRS Circular 230 Disclosure: Citi and its employees are not in the business of providing, and do not provide, tax or legal advice to any taxpayer outside of Citi. Any statements in this Communication to tax matters were not intended or written to be used, and cannot be used or relied upon, by any taxpayer for the purpose of avoiding tax penalties. Any such taxpayer should seek advice based on the taxpayer’s particular circumstances from an independent tax advisor. Citi specifically prohibits the redistribution of this Communication in whole or in part without the written permission of Citi and Citi accepts no liability whatsoever for the actions of third parties in this respect. Copyright © 2016 Citigroup Inc. and/or its affiliates. All rights reserved. CITI, CITI and Arc Design, CITIBANK and CITIGROUP are trademarks and service marks of Citigroup Inc. and/or its affiliates and are used and registered throughout the world.


![2015 Financial Review.pptx [Read-Only] · Institutional Annual Operating Budget History Expenditures $224.5 $227.2 $271.5 Source: FY2016 Original Budget BOT Presentation Eastern’s](https://img.pdfslide.us/doc/110x75/6002a23d0344e85585252e9f/2015-financial-read-only-institutional-annual-operating-budget-history-expenditures.jpg)