Embed Size (px)
Citation preview
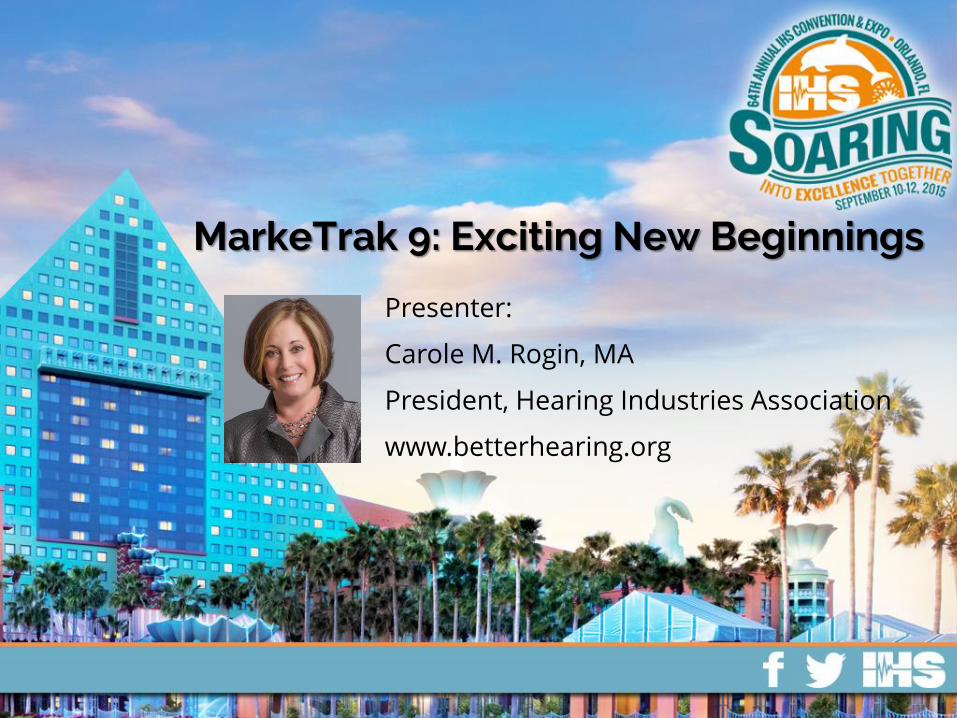
MarkeTrak 9: Exciting New Beginnings
Presenter:
Carole M. Rogin, MA
President, Hearing Industries Association
www.betterhearing.org

The views expressed in presentations made at International Hearing Society (IHS) educational events are those of the speaker and not necessarily of IHS. Presentations at IHS events, or the presence of a speaker at an IHS event, does not constitute an endorsement of the speaker's views.
From the desk of
our Attorney
Download the slides at www.ihsinfo.org/convention
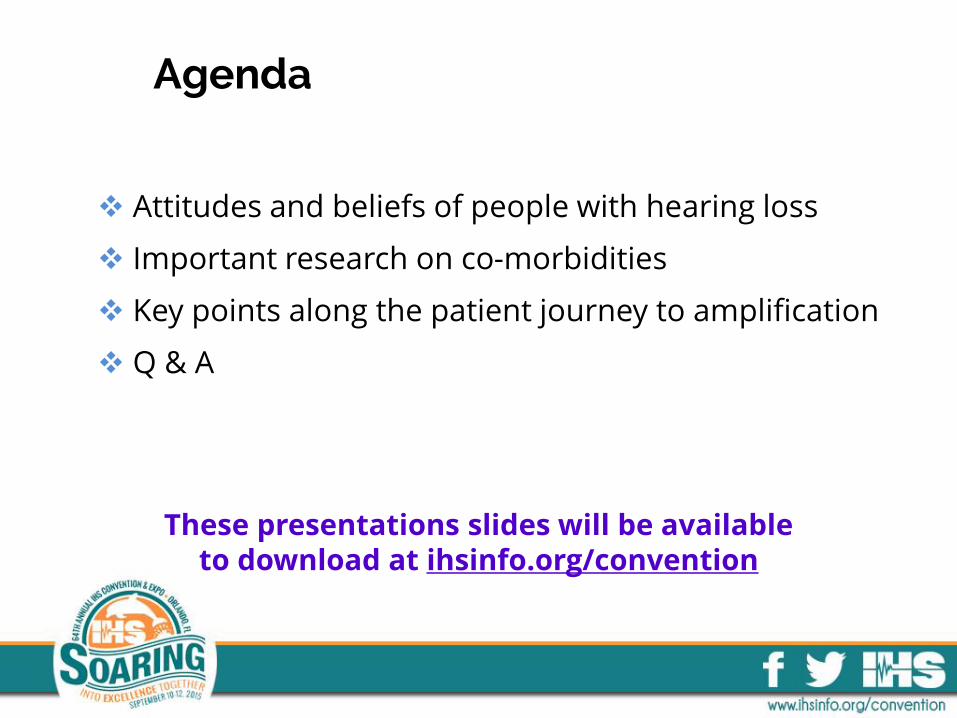
Attitudes and beliefs of people with hearing loss
Important research on co-morbidities
Key points along the patient journey to amplification
Q & A
Agenda
These presentations slides will be available to download at ihsinfo.org/convention
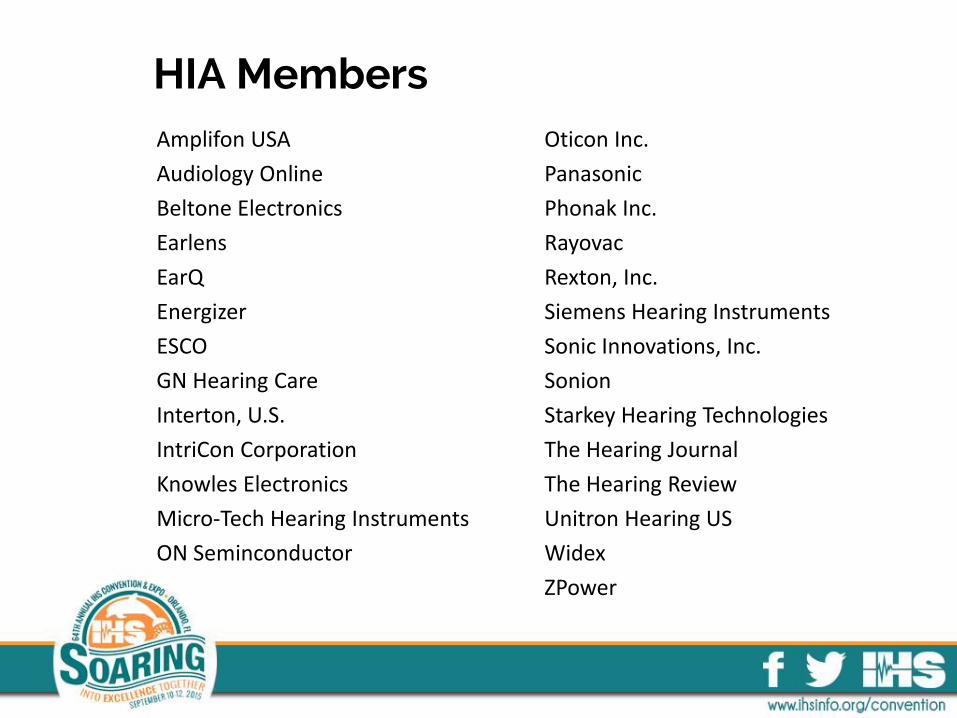
Amplifon USA
Audiology Online
Beltone Electronics
Earlens
EarQ
Energizer
ESCO
GN Hearing Care
Interton, U.S.
IntriCon Corporation
Knowles Electronics
Micro-Tech Hearing Instruments
ON Seminconductor
HIA Members Oticon Inc.
Panasonic
Phonak Inc.
Rayovac
Rexton, Inc.
Siemens Hearing Instruments
Sonic Innovations, Inc.
Sonion
Starkey Hearing Technologies
The Hearing Journal
The Hearing Review
Unitron Hearing US
Widex
ZPower
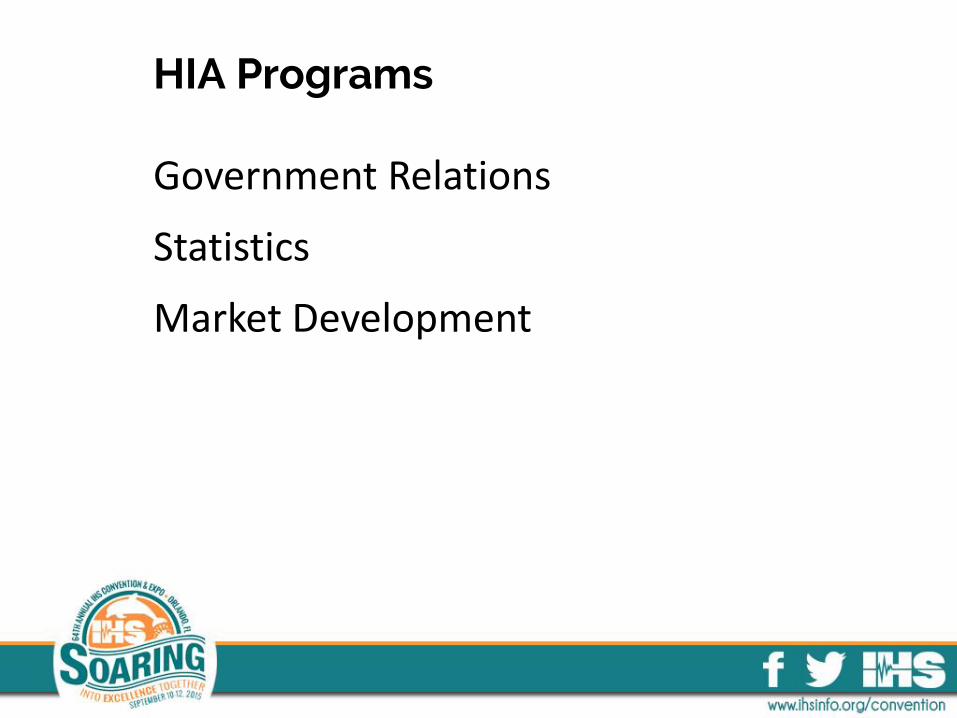
Government Relations
Statistics
Market Development
HIA Programs
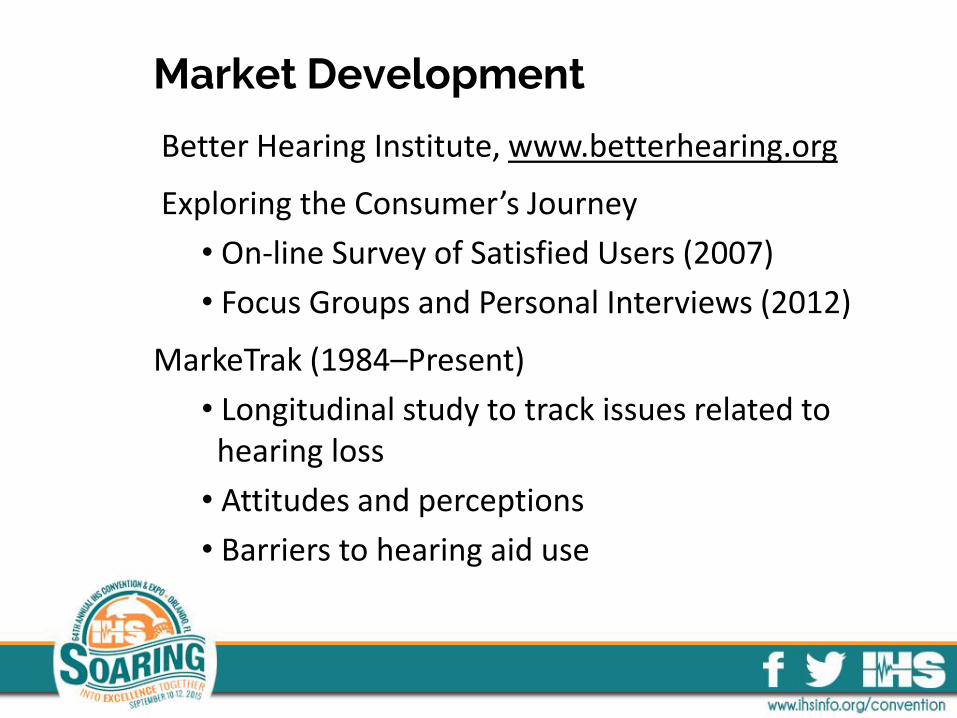
Market Development
Better Hearing Institute, www.betterhearing.org
Exploring the Consumer’s Journey
• On-line Survey of Satisfied Users (2007)
• Focus Groups and Personal Interviews (2012)
MarkeTrak (1984–Present)
• Longitudinal study to track issues related to hearing loss
• Attitudes and perceptions
• Barriers to hearing aid use
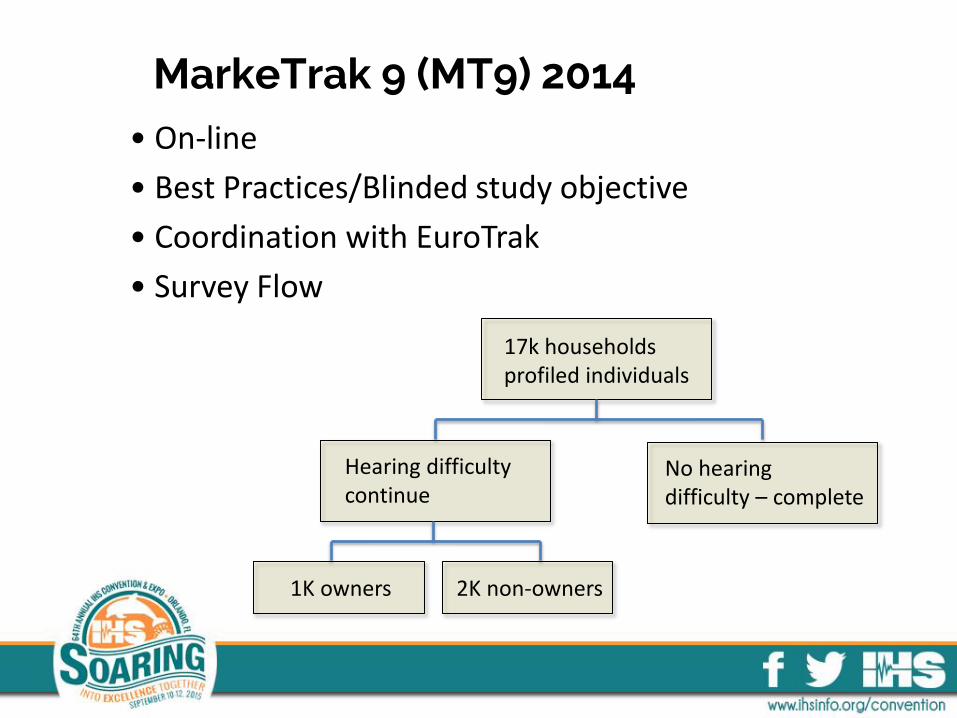
MarkeTrak 9 (MT9) 2014 • On-line
• Best Practices/Blinded study objective
• Coordination with EuroTrak
• Survey Flow
17k households profiled individuals
Hearing difficulty continue
No hearing difficulty – complete
2K non-owners 1K owners
Hearing difficulty continue
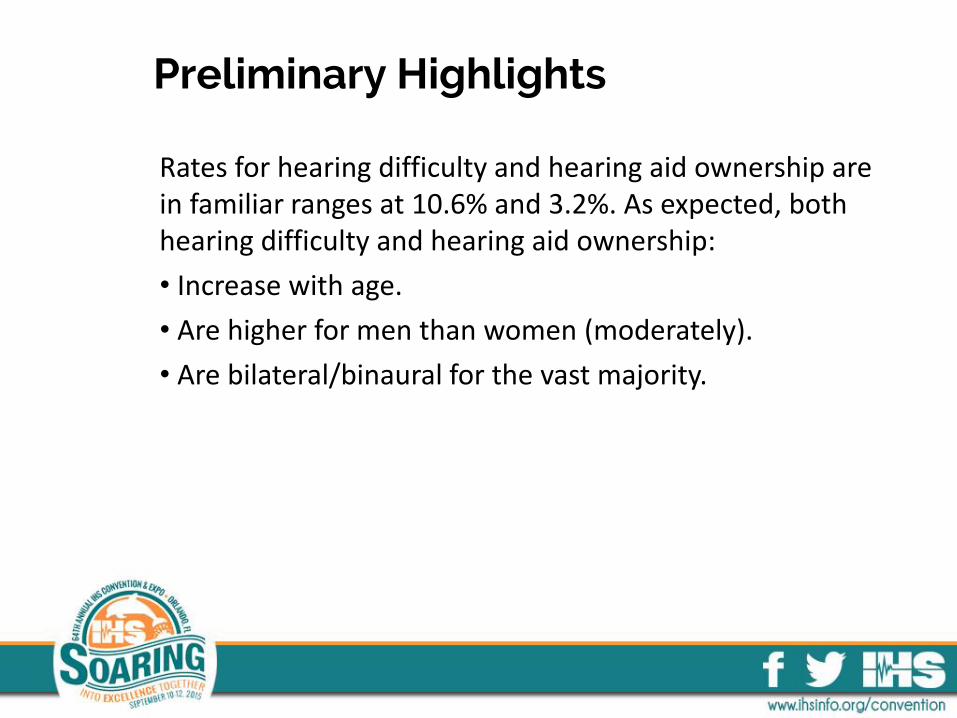
Preliminary Highlights
Rates for hearing difficulty and hearing aid ownership are in familiar ranges at 10.6% and 3.2%. As expected, both hearing difficulty and hearing aid ownership:
• Increase with age.
• Are higher for men than women (moderately).
• Are bilateral/binaural for the vast majority.
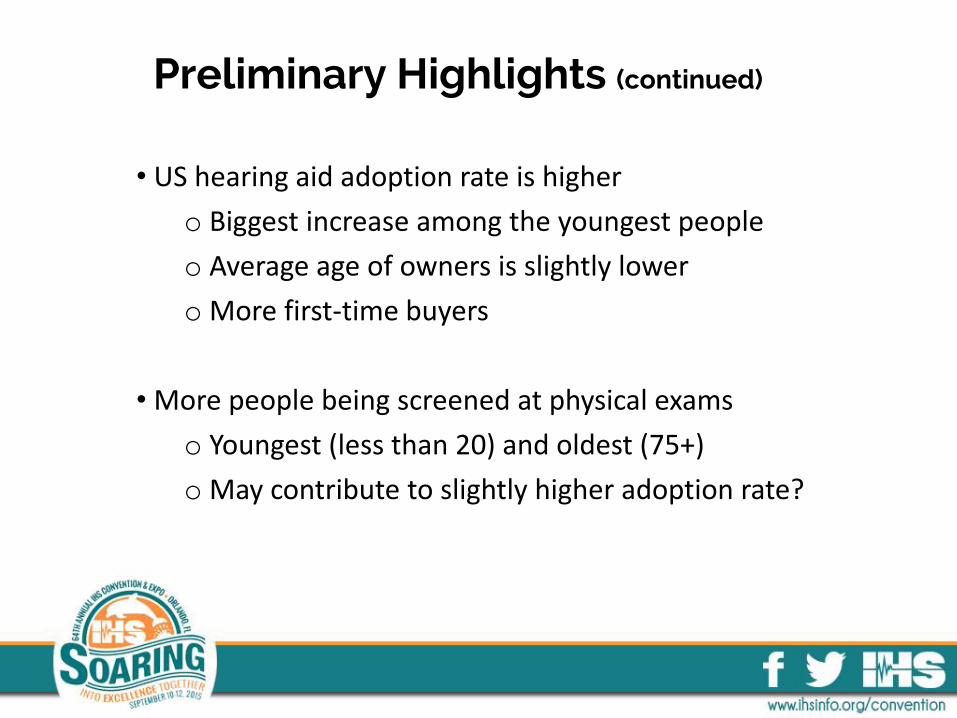
Preliminary Highlights (continued)
• US hearing aid adoption rate is higher
o Biggest increase among the youngest people
o Average age of owners is slightly lower
o More first-time buyers
• More people being screened at physical exams
o Youngest (less than 20) and oldest (75+)
o May contribute to slightly higher adoption rate?
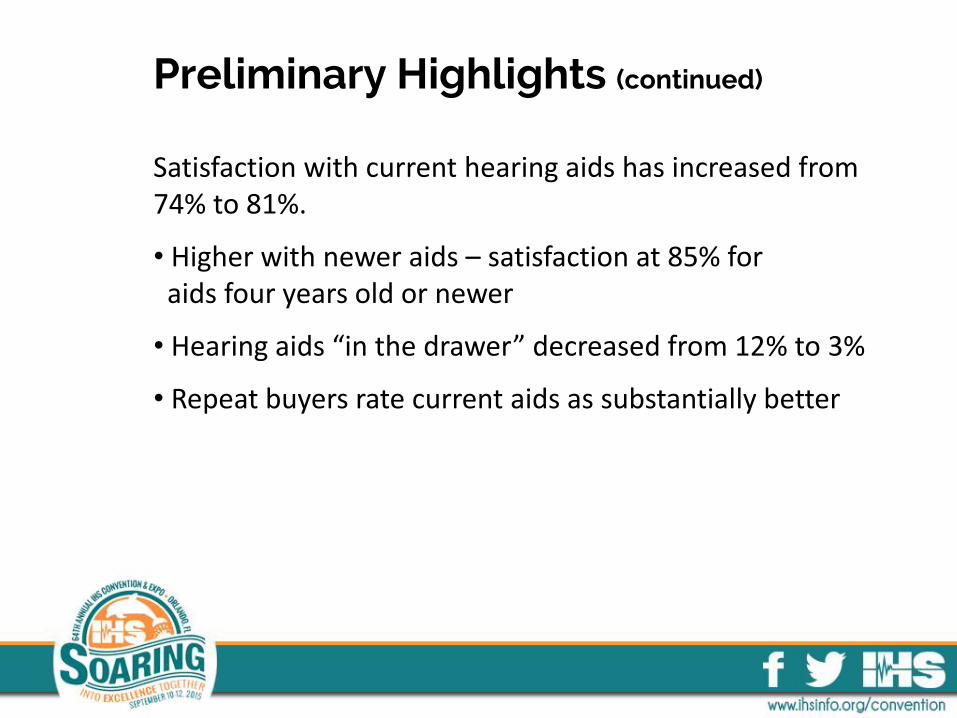
Preliminary Highlights (continued)
Satisfaction with current hearing aids has increased from 74% to 81%.
• Higher with newer aids – satisfaction at 85% for aids four years old or newer
• Hearing aids “in the drawer” decreased from 12% to 3%
• Repeat buyers rate current aids as substantially better
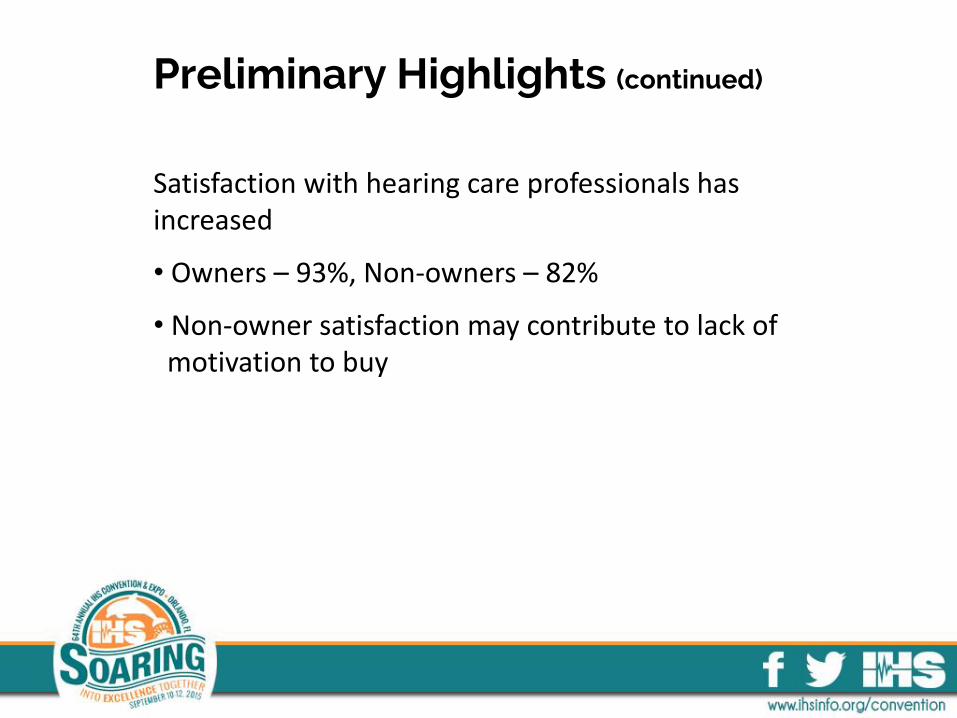
Preliminary Highlights (continued)
Satisfaction with hearing care professionals has increased
• Owners – 93%, Non-owners – 82%
• Non-owner satisfaction may contribute to lack of motivation to buy
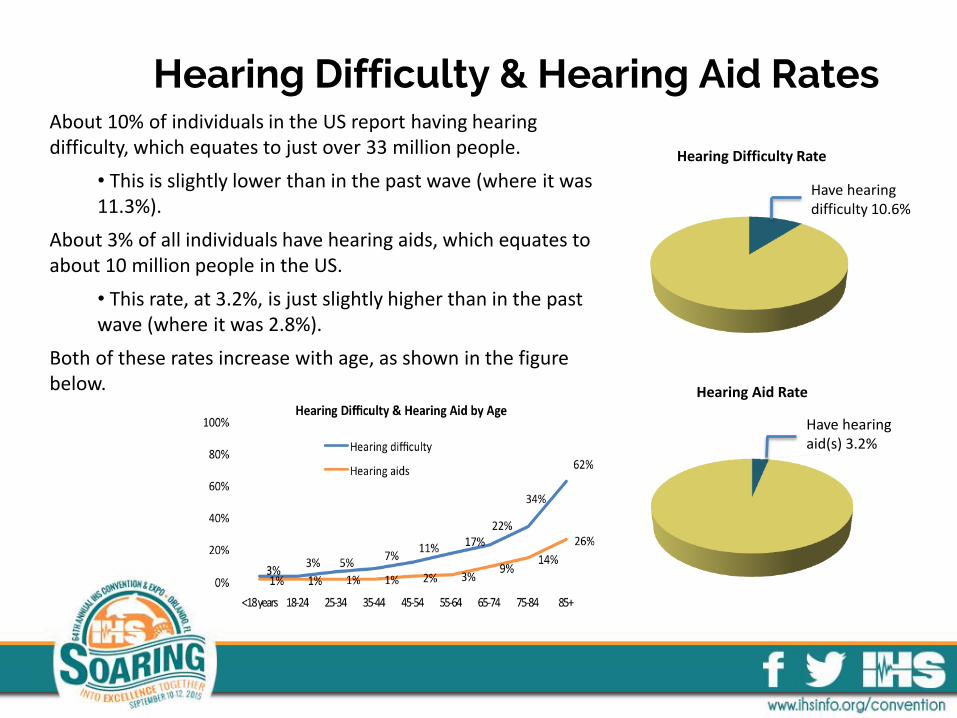
Hearing Difficulty & Hearing Aid Rates About 10% of individuals in the US report having hearing difficulty, which equates to just over 33 million people.
• This is slightly lower than in the past wave (where it was 11.3%).
About 3% of all individuals have hearing aids, which equates to about 10 million people in the US.
• This rate, at 3.2%, is just slightly higher than in the past wave (where it was 2.8%).
Both of these rates increase with age, as shown in the figure below.
Have hearing difficulty 10.6%
Hearing Difficulty Rate
Have hearing aid(s) 3.2%
Hearing Aid Rate
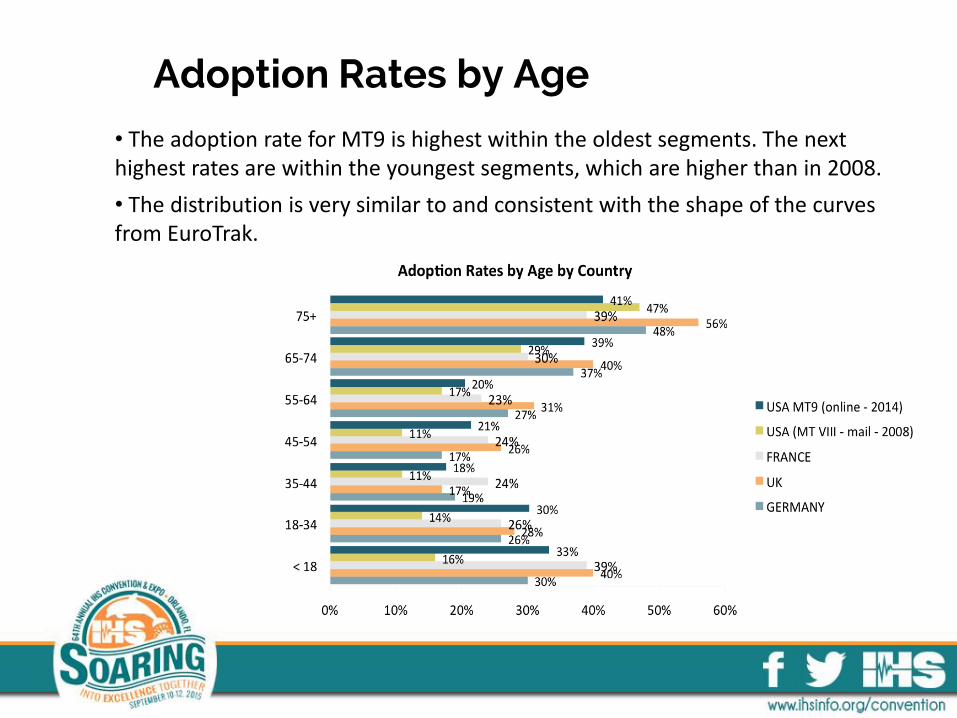
Adoption Rates by Age
• The adoption rate for MT9 is highest within the oldest segments. The next highest rates are within the youngest segments, which are higher than in 2008.
• The distribution is very similar to and consistent with the shape of the curves from EuroTrak.
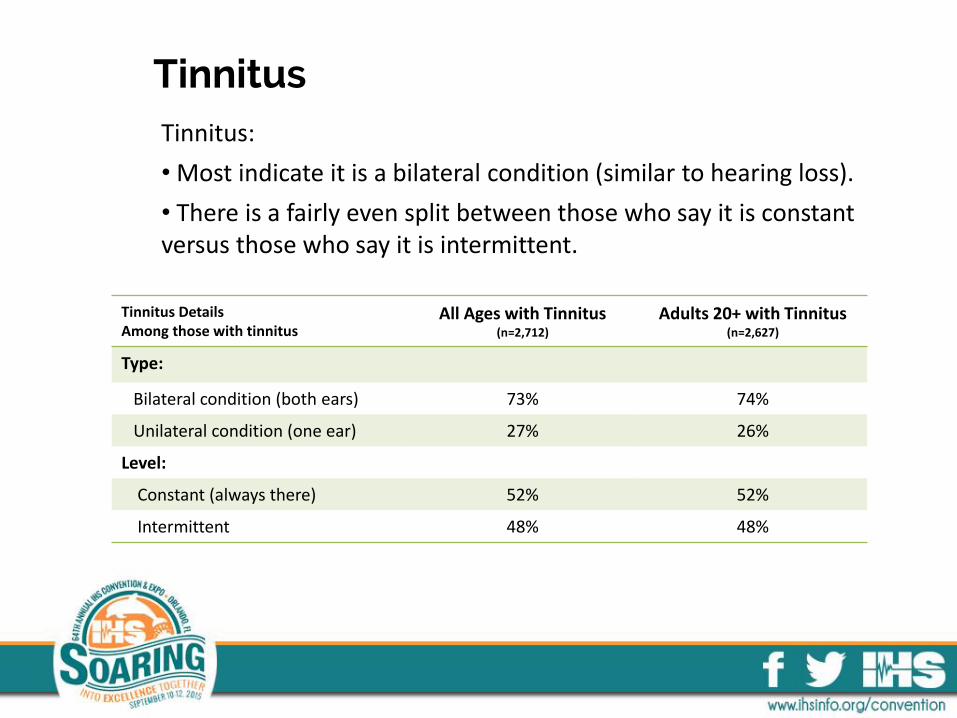
Tinnitus Tinnitus:
• Most indicate it is a bilateral condition (similar to hearing loss).
• There is a fairly even split between those who say it is constant versus those who say it is intermittent.
Tinnitus Details Among those with tinnitus
All Ages with Tinnitus (n=2,712)
Adults 20+ with Tinnitus (n=2,627)
Type:
Bilateral condition (both ears) 73% 74%
Unilateral condition (one ear) 27% 26%
Level:
Constant (always there) 52% 52%
Intermittent 48% 48%

Personal Sound Amplification Product (PSAP) Defined as “a device that amplifies sound that was not fit by a hearing care professional”.
• About 1% of the population reported having a personal sound amplifier, based upon this definition.
• This equates to about 9.4% of those with hearing difficulty.
Have condition Have PSAP
Rates for Conditions
10.6%
1%
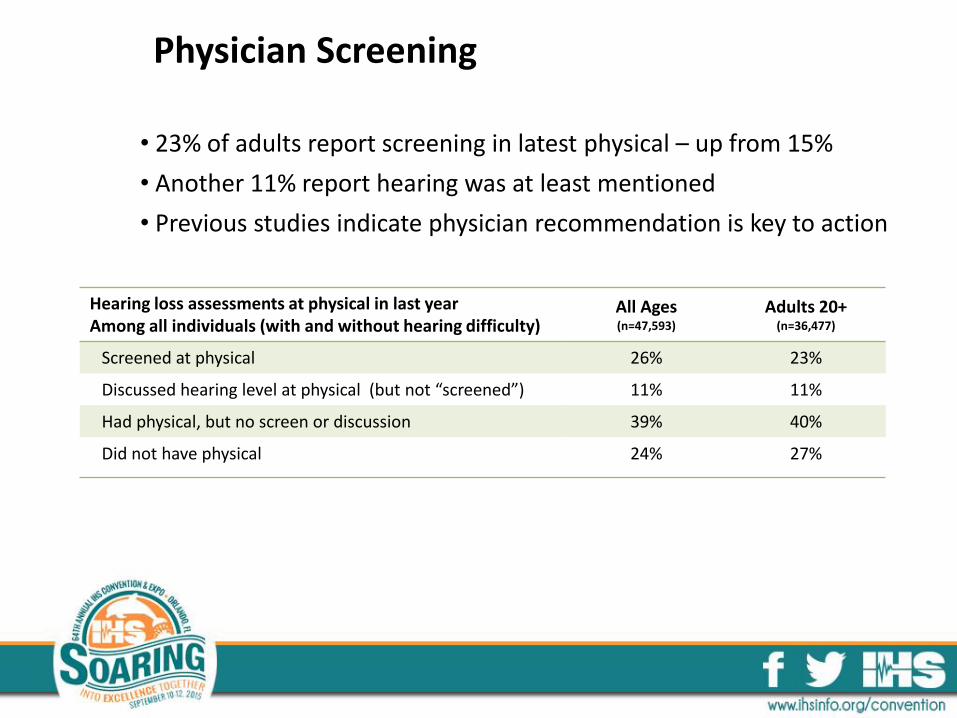
Physician Screening • 23% of adults report screening in latest physical – up from 15%
• Another 11% report hearing was at least mentioned
• Previous studies indicate physician recommendation is key to action
Hearing loss assessments at physical in last year Among all individuals (with and without hearing difficulty)
All Ages (n=47,593)
Adults 20+ (n=36,477)
Screened at physical 26% 23%
Discussed hearing level at physical (but not “screened”) 11% 11%
Had physical, but no screen or discussion 39% 40%
Did not have physical 24% 27%
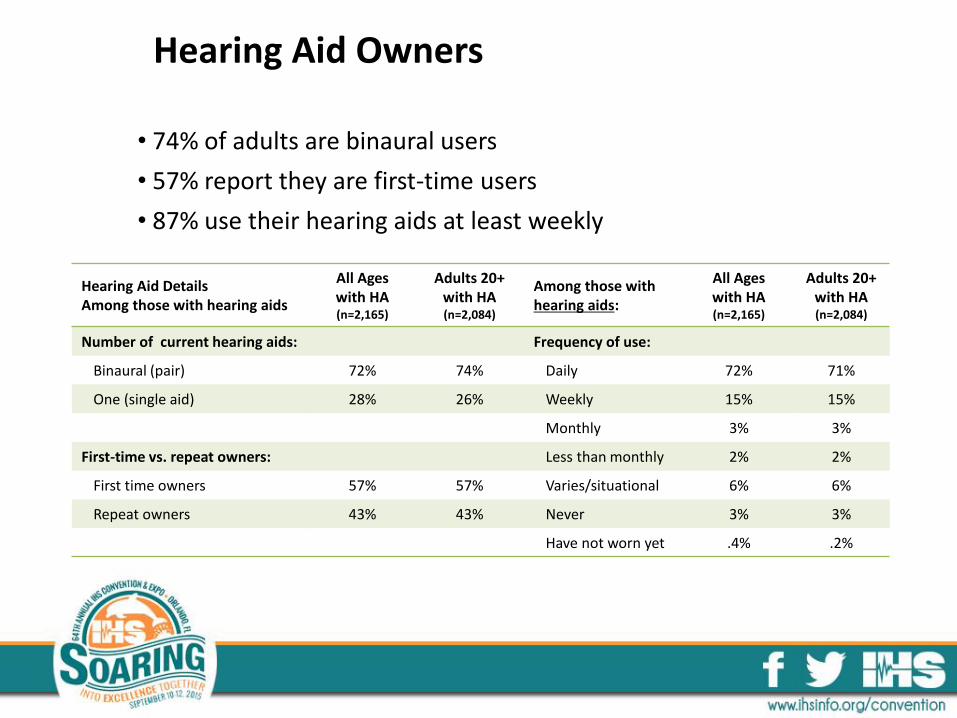
Hearing Aid Owners
• 74% of adults are binaural users
• 57% report they are first-time users
• 87% use their hearing aids at least weekly
Hearing Aid Details Among those with hearing aids
All Ages with HA (n=2,165)
Adults 20+ with HA (n=2,084)
Among those with hearing aids:
All Ages with HA (n=2,165)
Adults 20+ with HA (n=2,084)
Number of current hearing aids: Frequency of use:
Binaural (pair) 72% 74% Daily 72% 71%
One (single aid) 28% 26% Weekly 15% 15%
Monthly 3% 3%
First-time vs. repeat owners: Less than monthly 2% 2%
First time owners 57% 57% Varies/situational 6% 6%
Repeat owners 43% 43% Never 3% 3%
Have not worn yet .4% .2%
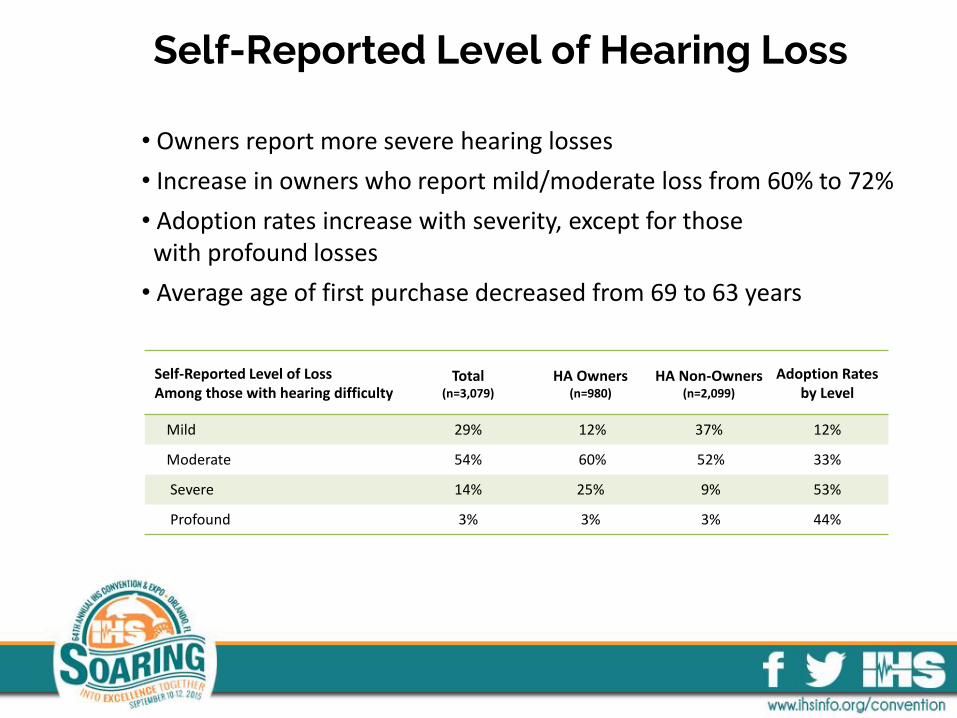
Self-Reported Level of Hearing Loss • Owners report more severe hearing losses
• Increase in owners who report mild/moderate loss from 60% to 72%
• Adoption rates increase with severity, except for those with profound losses
• Average age of first purchase decreased from 69 to 63 years
Self-Reported Level of Loss Among those with hearing difficulty
Total (n=3,079)
HA Owners (n=980)
HA Non-Owners (n=2,099)
Adoption Rates by Level
Mild 29% 12% 37% 12%
Moderate 54% 60% 52% 33%
Severe 14% 25% 9% 53%
Profound 3% 3% 3% 44%
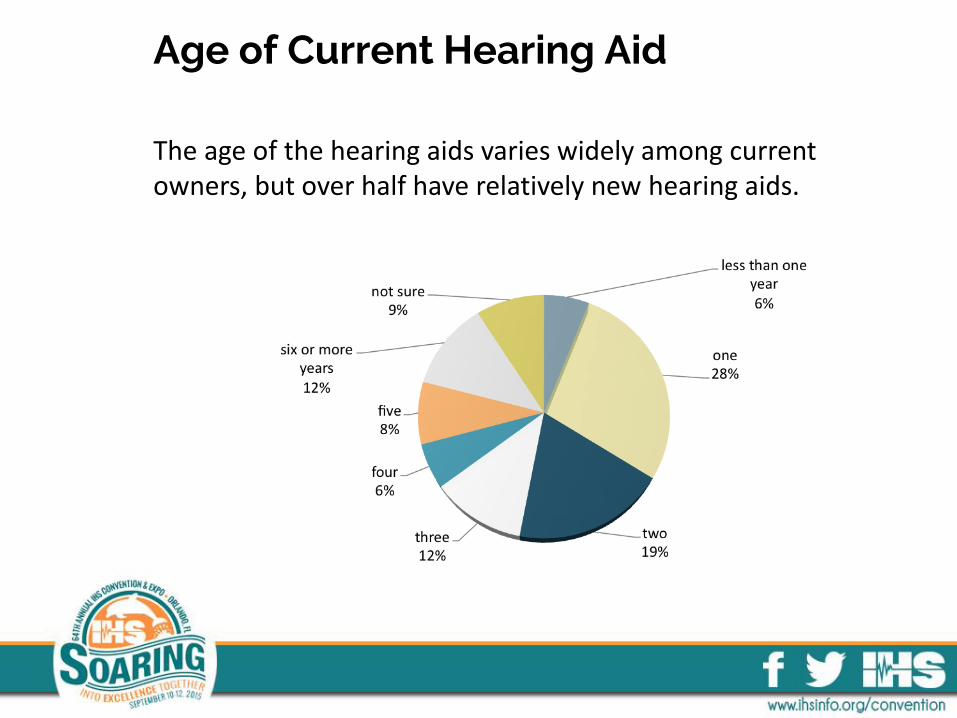
Age of Current Hearing Aid The age of the hearing aids varies widely among current owners, but over half have relatively new hearing aids.
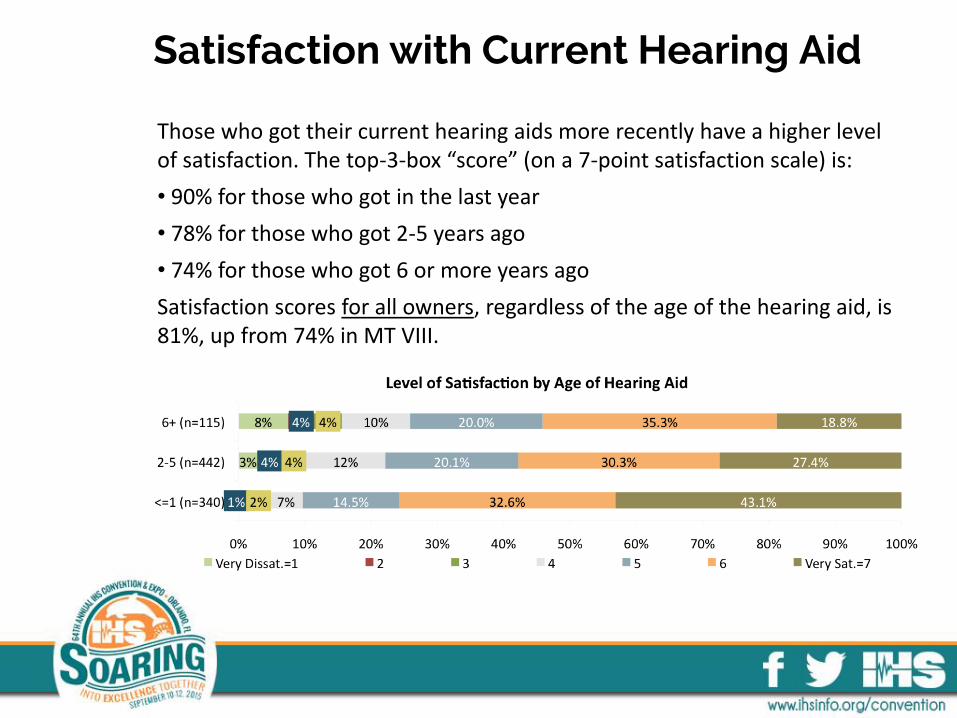
Satisfaction with Current Hearing Aid Those who got their current hearing aids more recently have a higher level of satisfaction. The top-3-box “score” (on a 7-point satisfaction scale) is:
• 90% for those who got in the last year
• 78% for those who got 2-5 years ago
• 74% for those who got 6 or more years ago
Satisfaction scores for all owners, regardless of the age of the hearing aid, is 81%, up from 74% in MT VIII.
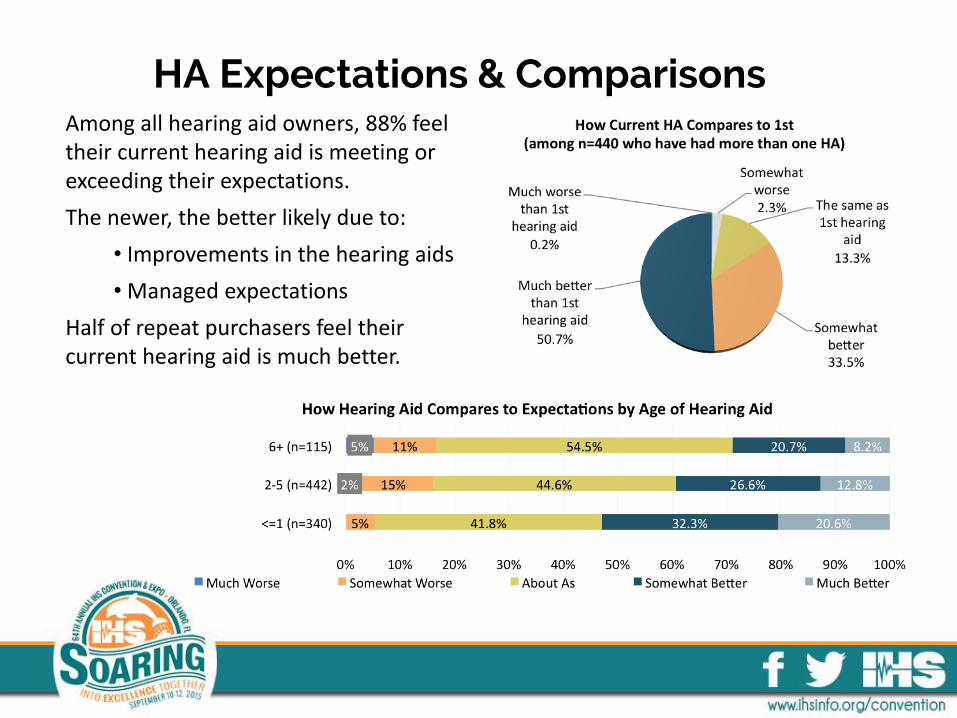
HA Expectations & Comparisons Among all hearing aid owners, 88% feel their current hearing aid is meeting or exceeding their expectations.
The newer, the better likely due to:
• Improvements in the hearing aids
• Managed expectations
Half of repeat purchasers feel their current hearing aid is much better.
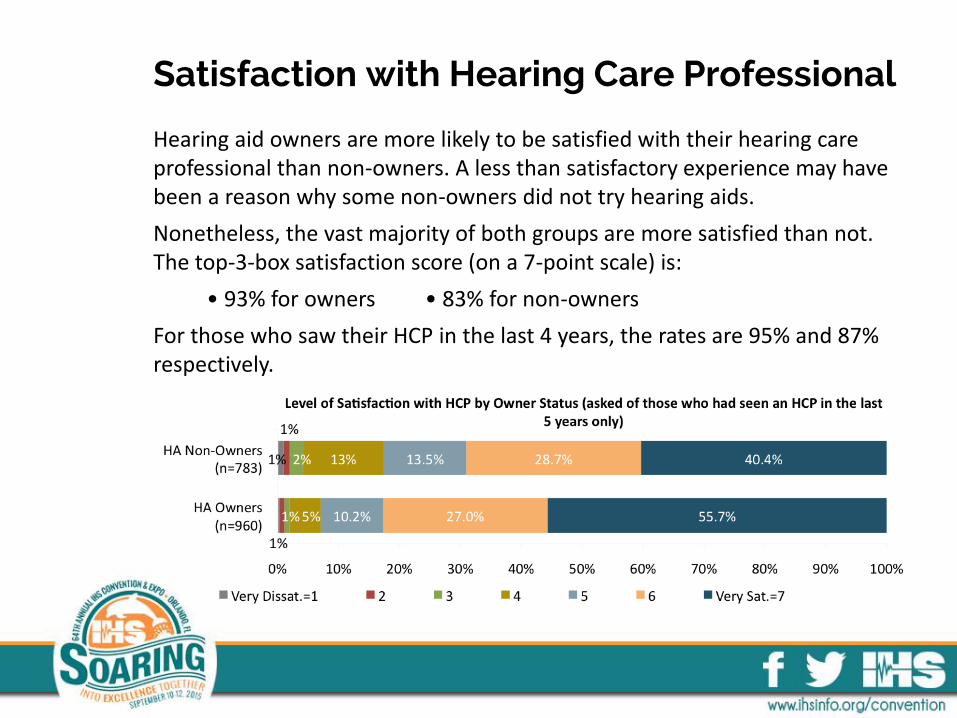
Satisfaction with Hearing Care Professional
Hearing aid owners are more likely to be satisfied with their hearing care professional than non-owners. A less than satisfactory experience may have been a reason why some non-owners did not try hearing aids.
Nonetheless, the vast majority of both groups are more satisfied than not. The top-3-box satisfaction score (on a 7-point scale) is:
• 93% for owners • 83% for non-owners
For those who saw their HCP in the last 4 years, the rates are 95% and 87% respectively.
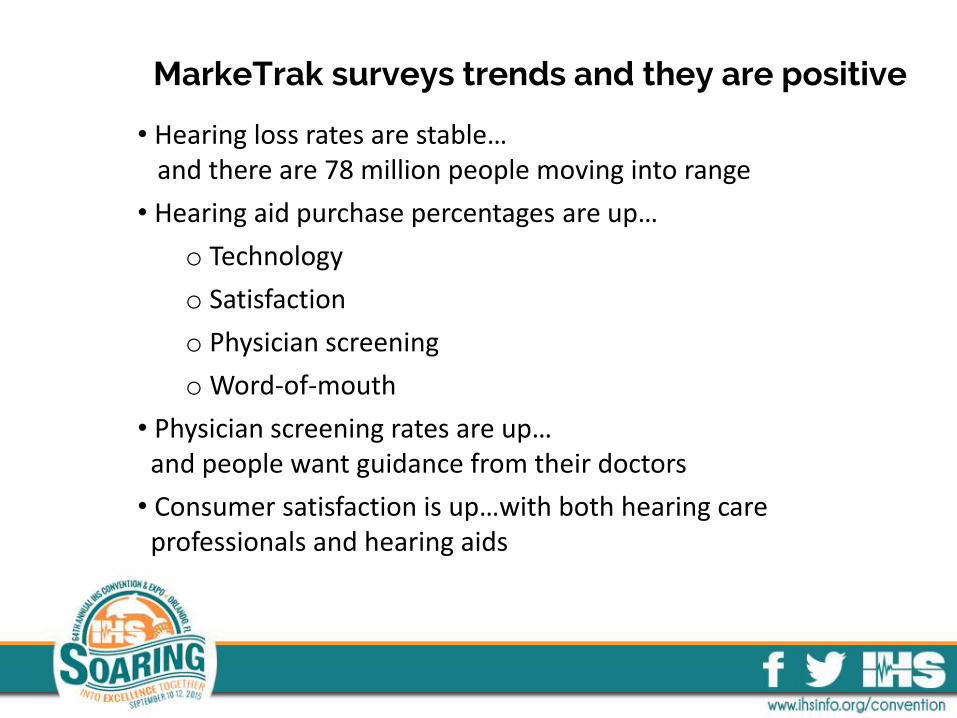
MarkeTrak surveys trends and they are positive
• Hearing loss rates are stable… and there are 78 million people moving into range
• Hearing aid purchase percentages are up…
o Technology
o Satisfaction
o Physician screening
o Word-of-mouth
• Physician screening rates are up… and people want guidance from their doctors
• Consumer satisfaction is up…with both hearing care professionals and hearing aids
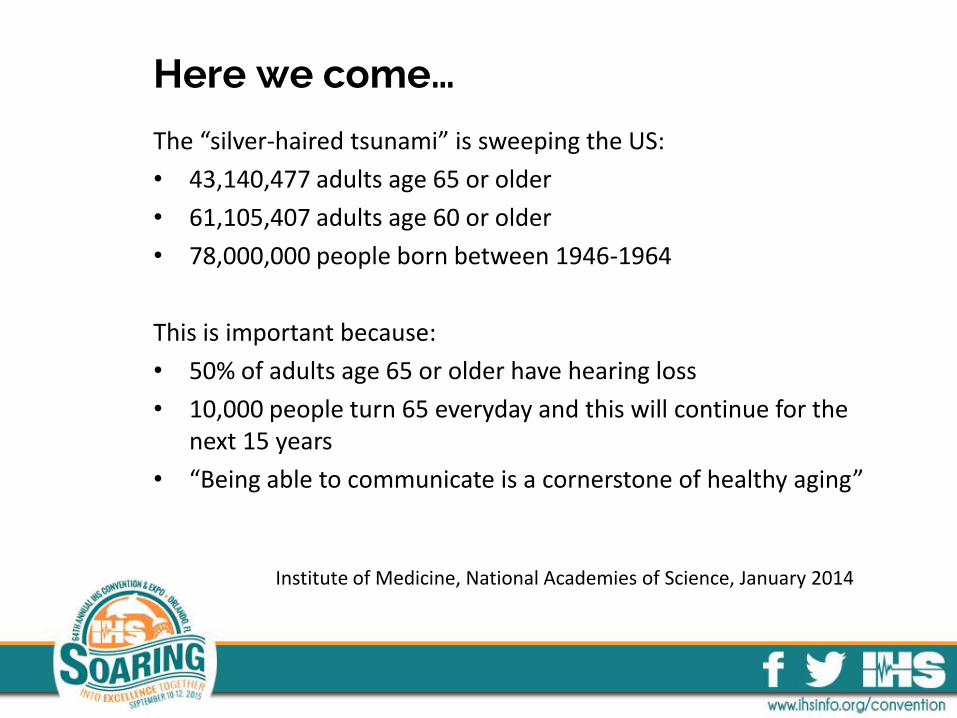
Here we come…
Institute of Medicine, National Academies of Science, January 2014
The “silver-haired tsunami” is sweeping the US:
• 43,140,477 adults age 65 or older
• 61,105,407 adults age 60 or older
• 78,000,000 people born between 1946-1964
This is important because:
• 50% of adults age 65 or older have hearing loss
• 10,000 people turn 65 everyday and this will continue for the next 15 years
• “Being able to communicate is a cornerstone of healthy aging”
Institute of Medicine (IOM) Workshop
• www.iom.edu/hearingloss-aging
• Washington, DC – January 2014
• Convention of experts in Aging, Gerontology, Mobility, Ophthalmology, Cognition, Psychology, Public Health, Healthcare Delivery Systems and Public Health Policy
• Presentations on array of negative impacts of untreated hearing loss
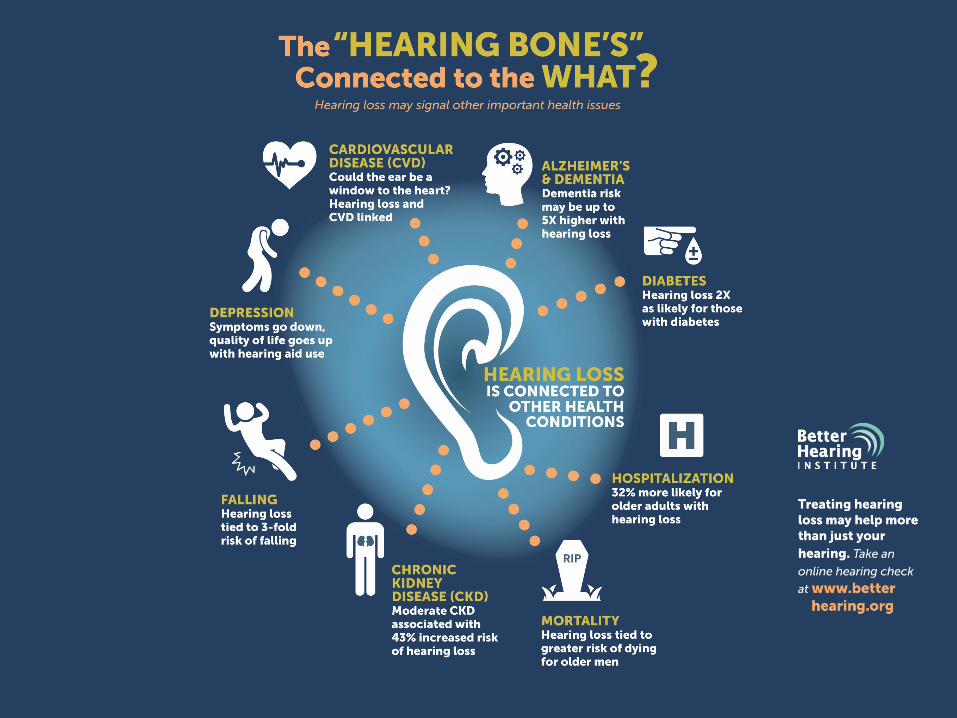
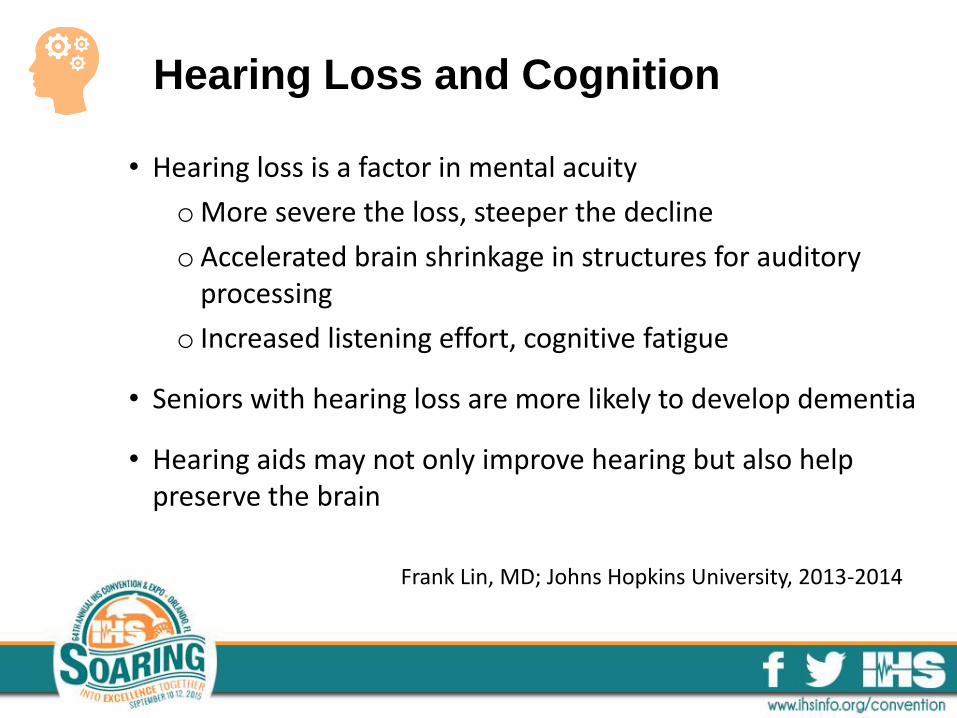
Hearing Loss and Cognition
• Hearing loss is a factor in mental acuity
oMore severe the loss, steeper the decline
o Accelerated brain shrinkage in structures for auditory processing
o Increased listening effort, cognitive fatigue
• Seniors with hearing loss are more likely to develop dementia
• Hearing aids may not only improve hearing but also help preserve the brain
Frank Lin, MD; Johns Hopkins University, 2013-2014
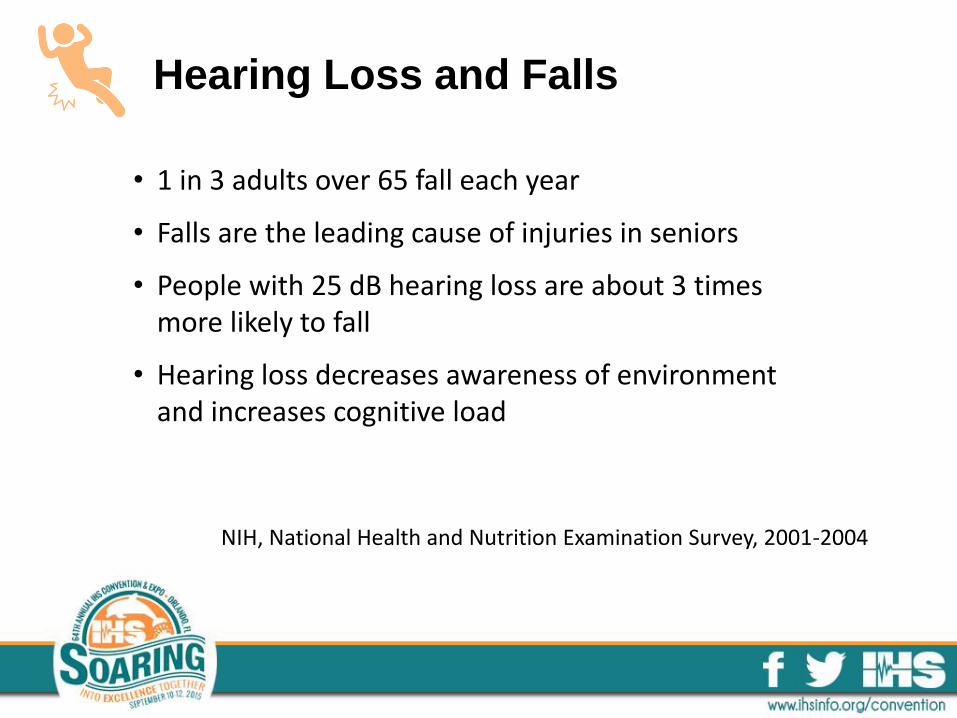
Hearing Loss and Falls
• 1 in 3 adults over 65 fall each year
• Falls are the leading cause of injuries in seniors
• People with 25 dB hearing loss are about 3 times more likely to fall
• Hearing loss decreases awareness of environment and increases cognitive load
NIH, National Health and Nutrition Examination Survey, 2001-2004
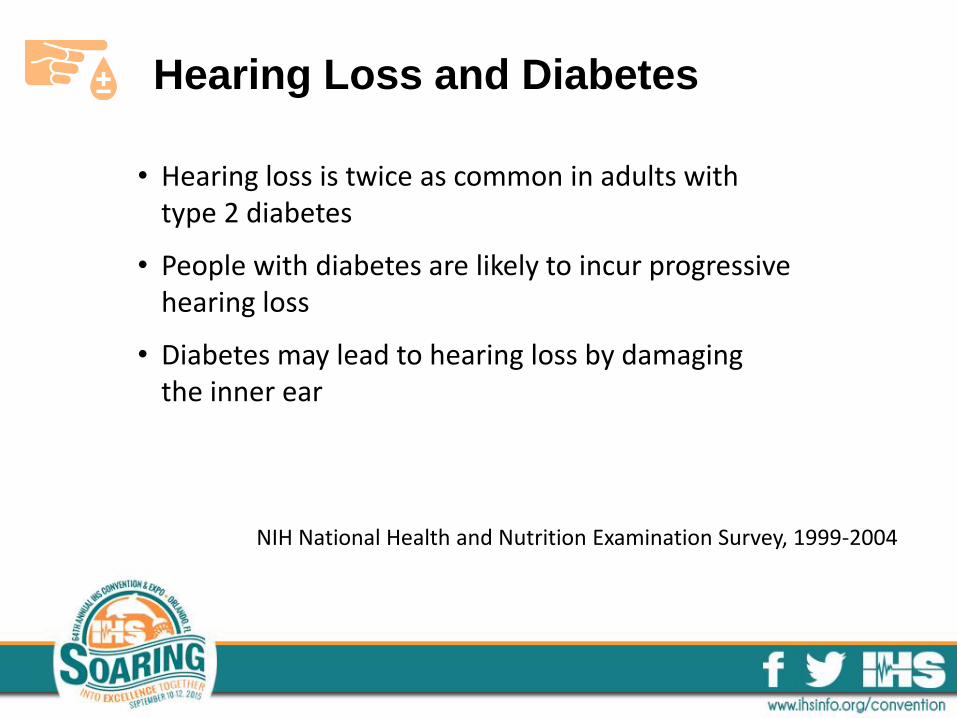
Hearing Loss and Diabetes
• Hearing loss is twice as common in adults with type 2 diabetes
• People with diabetes are likely to incur progressive hearing loss
• Diabetes may lead to hearing loss by damaging the inner ear
NIH National Health and Nutrition Examination Survey, 1999-2004
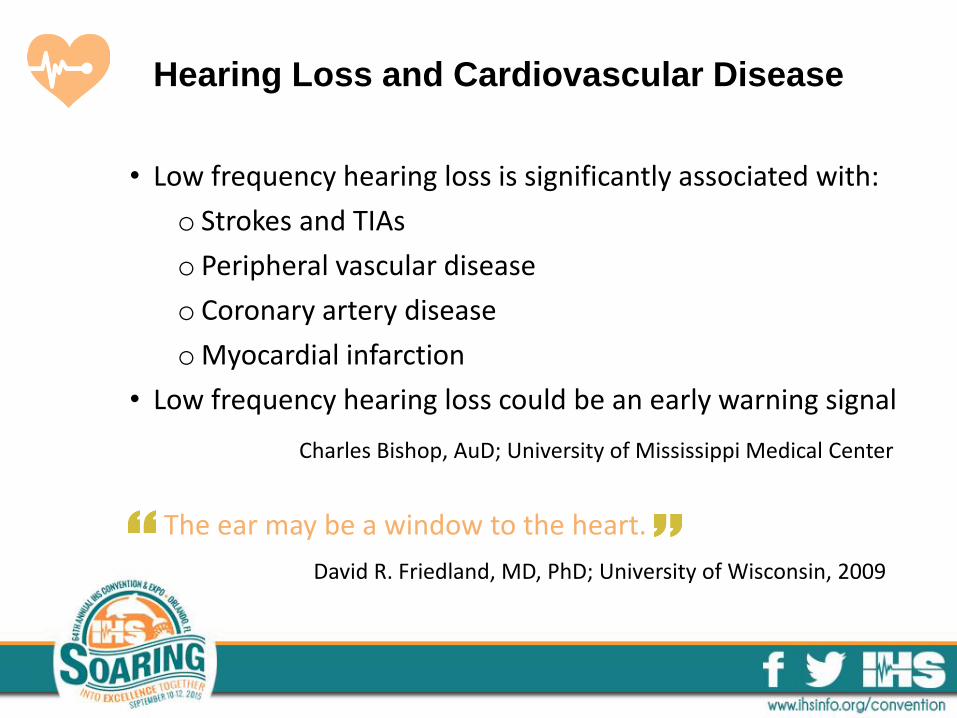
Hearing Loss and Cardiovascular Disease
• Low frequency hearing loss is significantly associated with:
o Strokes and TIAs
o Peripheral vascular disease
o Coronary artery disease
oMyocardial infarction
• Low frequency hearing loss could be an early warning signal
David R. Friedland, MD, PhD; University of Wisconsin, 2009
The ear may be a window to the heart.
Charles Bishop, AuD; University of Mississippi Medical Center
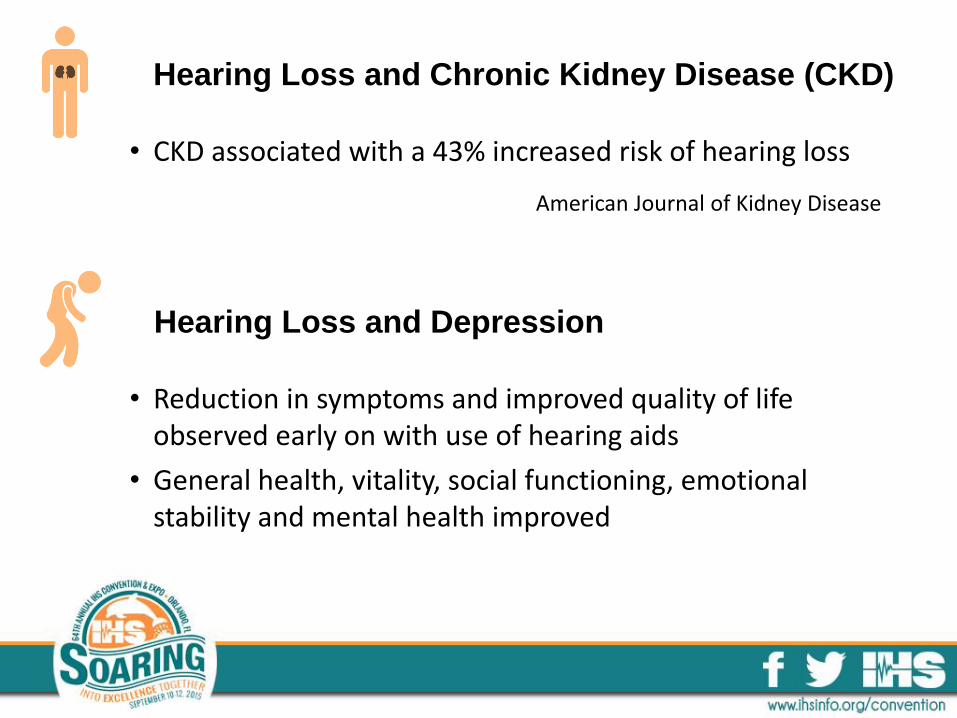
Hearing Loss and Chronic Kidney Disease (CKD)
• CKD associated with a 43% increased risk of hearing loss
American Journal of Kidney Disease
Hearing Loss and Depression
• Reduction in symptoms and improved quality of life observed early on with use of hearing aids
• General health, vitality, social functioning, emotional stability and mental health improved
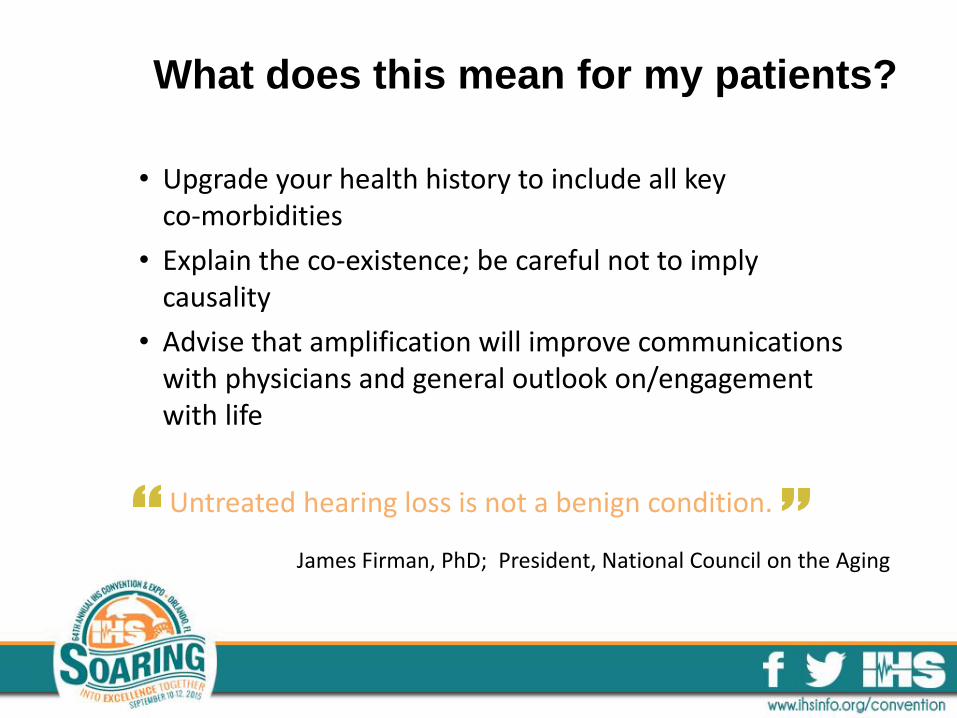
What does this mean for my patients?
• Upgrade your health history to include all key co-morbidities
• Explain the co-existence; be careful not to imply causality
• Advise that amplification will improve communications with physicians and general outlook on/engagement with life
Untreated hearing loss is not a benign condition.
James Firman, PhD; President, National Council on the Aging
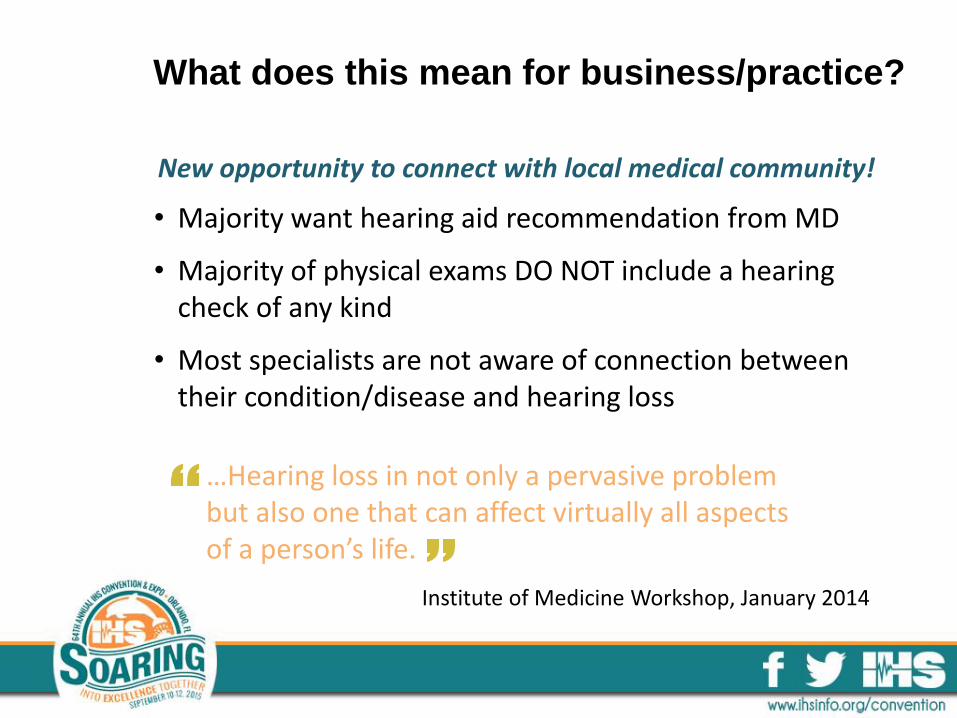
What does this mean for business/practice?
• Majority want hearing aid recommendation from MD
• Majority of physical exams DO NOT include a hearing check of any kind
• Most specialists are not aware of connection between their condition/disease and hearing loss
…Hearing loss in not only a pervasive problem but also one that can affect virtually all aspects of a person’s life.
Institute of Medicine Workshop, January 2014
New opportunity to connect with local medical community!
Institute of Medicine Workshop, January 2014
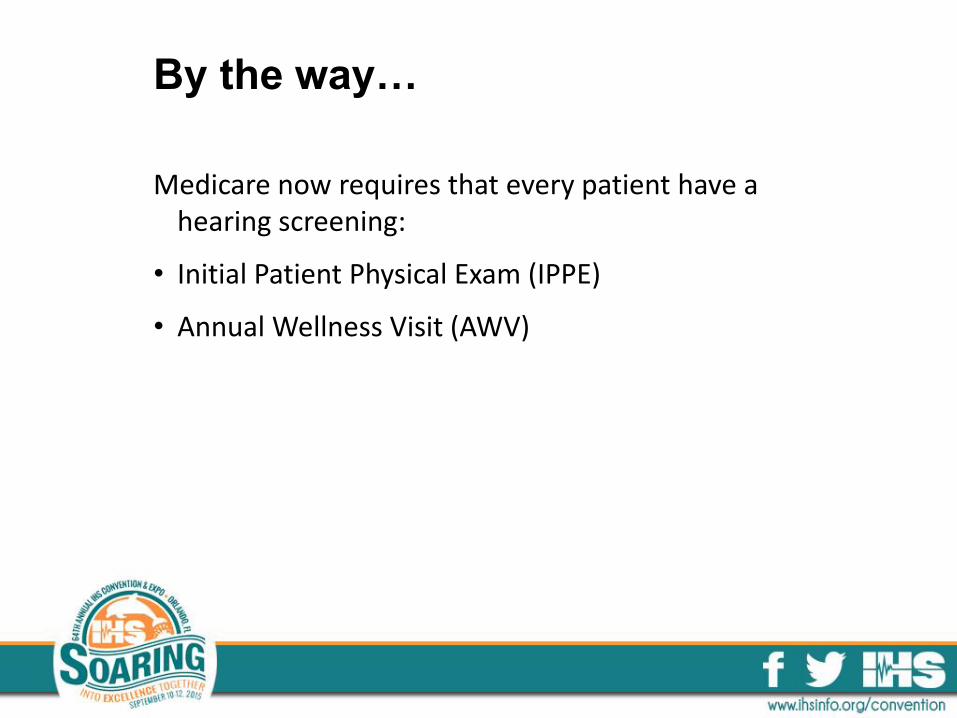
By the way…
Medicare now requires that every patient have a hearing screening:
• Initial Patient Physical Exam (IPPE)
• Annual Wellness Visit (AWV)
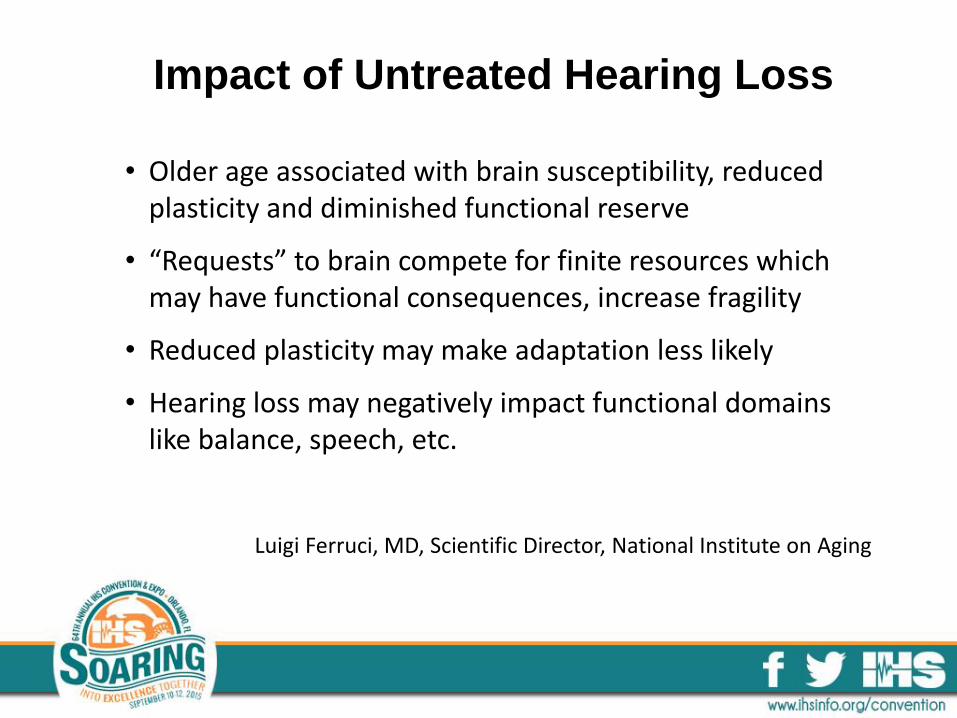
Impact of Untreated Hearing Loss
• Older age associated with brain susceptibility, reduced plasticity and diminished functional reserve
• “Requests” to brain compete for finite resources which may have functional consequences, increase fragility
• Reduced plasticity may make adaptation less likely
• Hearing loss may negatively impact functional domains like balance, speech, etc.
Luigi Ferruci, MD, Scientific Director, National Institute on Aging
www.betterhearing.org/hearingpedia
www.iom.edu/hearingloss-aging
When you are hard of hearing you struggle to hear;
When you struggle to hear you get tired;
When you get tired you get frustrated;
When you get frustrated you get bored;
When you get bored you quit.
I didn’t quit today!
Institute of Medicine Workshop, January 2014
Questions?
Contact Carole M. Rogin, MA at
Visit www.betterhearing.org