Embed Size (px)
Citation preview
Marketing Study for Corn Stover in Missouri
Report Submitted to: Missouri Stover Products
August 5, 2011
Authors
Joe Horner, MS, is an extension economist with the Commercial Agriculture Program at the University of Missouri. He works extensively with agricultural producers, focusing on production economics and expansion strategies. He has twenty years of experience with extension, serving as a regional extension dairy specialist and as a state extension economist. He is also a graduate of the Graduate Institute of Cooperative Learning. He has also worked internationally as a volunteer with VOCA and with various University of Missouri connected training projects. Ryan Milhollin, MBA, is a project manager / extension associate with the Commercial Agriculture Program at the University of Missouri. He has eight years of experience in extension, working on various educational programs and feasibility reports related to the dairy, beef and biofuel industries. He has substantial experience working in dairy and beef production in the areas of business planning and management, finance, risk management, and environmental regulations. He received BSs in Agricultural Economics and Business Administration from the University of Missouri in May 2002 and completed a MBA from Columbia College in December 2006.
Table of Contents SECTION 1 - CORN STOVER OPTIONS AND PRICING ........................................................ 1 SECTION 2 - POTENTIAL CORN STOVER MARKETS .......................................................... 3 SECTION 3 - SUPPLY, DEMAND AND PROXIMITY TO MARKETS .................................... 10 SECTION 4 - BIOMASS COMPETITOR ANALYSIS AND SUPPLY ........................................ 24 SECTION 5 - SUITABLE TARGET MARKETS AND DEMAND ............................................ 32 SECTION 6 - BUSINESS MODELS FOR CORN STOVER PRODUCERS ................................ 34 SOURCES .............................................................................................................................. 36
1
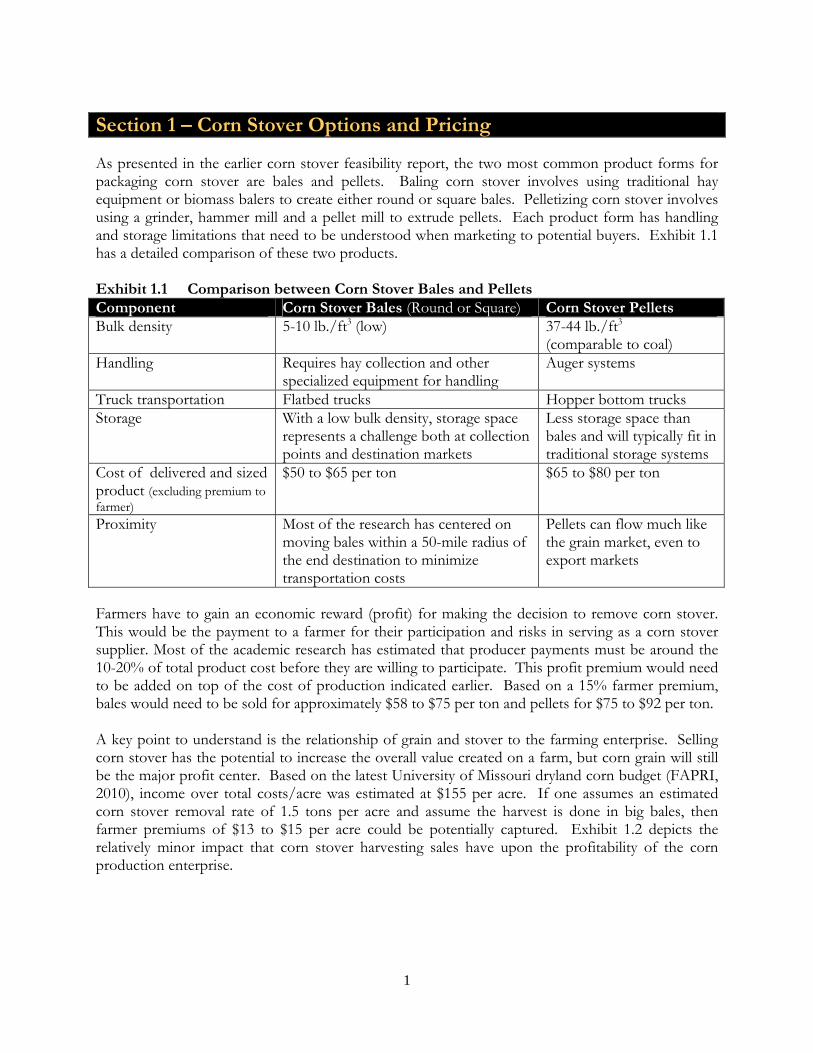
Section 1 – Corn Stover Options and Pricing As presented in the earlier corn stover feasibility report, the two most common product forms for packaging corn stover are bales and pellets. Baling corn stover involves using traditional hay equipment or biomass balers to create either round or square bales. Pelletizing corn stover involves using a grinder, hammer mill and a pellet mill to extrude pellets. Each product form has handling and storage limitations that need to be understood when marketing to potential buyers. Exhibit 1.1 has a detailed comparison of these two products. Exhibit 1.1 Comparison between Corn Stover Bales and Pellets Component Corn Stover Bales (Round or Square) Corn Stover Pellets Bulk density 5-10 lb./ft3 (low) 37-44 lb./ft3
(comparable to coal) Handling Requires hay collection and other
specialized equipment for handling Auger systems
Truck transportation Flatbed trucks Hopper bottom trucks Storage With a low bulk density, storage space
represents a challenge both at collection points and destination markets
Less storage space than bales and will typically fit in traditional storage systems
Cost of delivered and sized product (excluding premium to farmer)
$50 to $65 per ton $65 to $80 per ton
Proximity Most of the research has centered on moving bales within a 50-mile radius of the end destination to minimize transportation costs
Pellets can flow much like the grain market, even to export markets
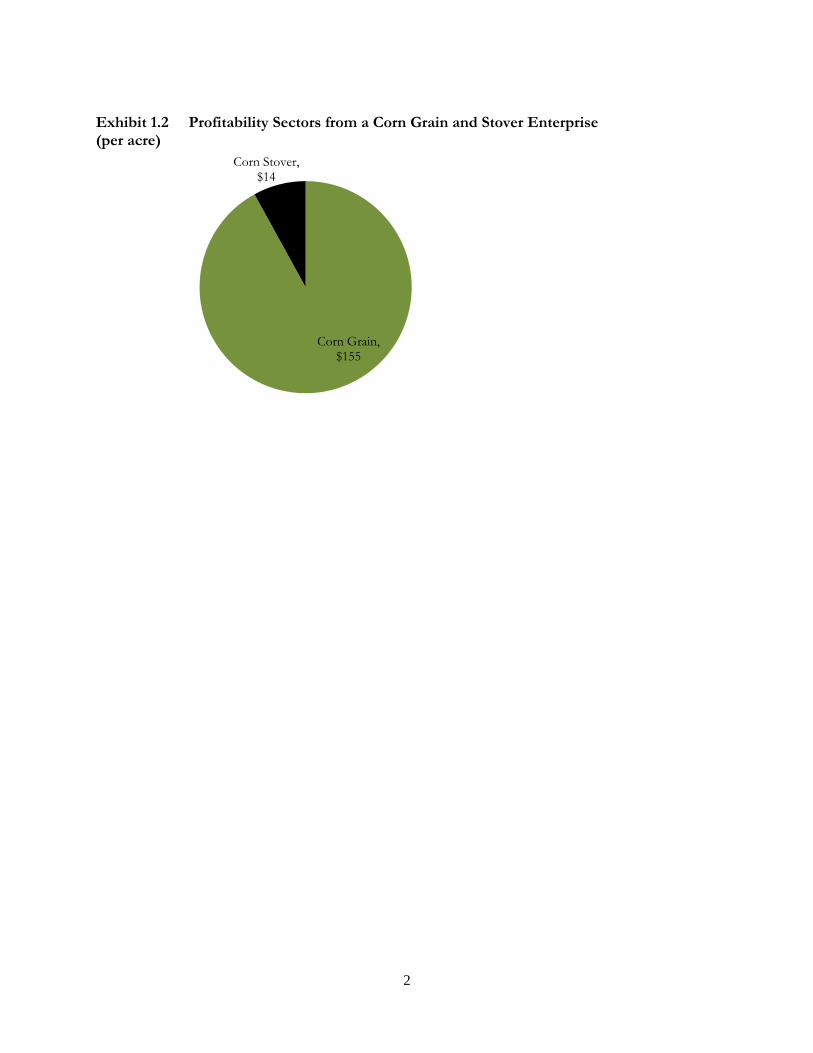
Farmers have to gain an economic reward (profit) for making the decision to remove corn stover. This would be the payment to a farmer for their participation and risks in serving as a corn stover supplier. Most of the academic research has estimated that producer payments must be around the 10-20% of total product cost before they are willing to participate. This profit premium would need to be added on top of the cost of production indicated earlier. Based on a 15% farmer premium, bales would need to be sold for approximately $58 to $75 per ton and pellets for $75 to $92 per ton. A key point to understand is the relationship of grain and stover to the farming enterprise. Selling corn stover has the potential to increase the overall value created on a farm, but corn grain will still be the major profit center. Based on the latest University of Missouri dryland corn budget (FAPRI, 2010), income over total costs/acre was estimated at $155 per acre. If one assumes an estimated corn stover removal rate of 1.5 tons per acre and assume the harvest is done in big bales, then farmer premiums of $13 to $15 per acre could be potentially captured. Exhibit 1.2 depicts the relatively minor impact that corn stover harvesting sales have upon the profitability of the corn production enterprise.
2
Exhibit 1.2 Profitability Sectors from a Corn Grain and Stover Enterprise (per acre)
Corn Grain, $155
Corn Stover, $14
3
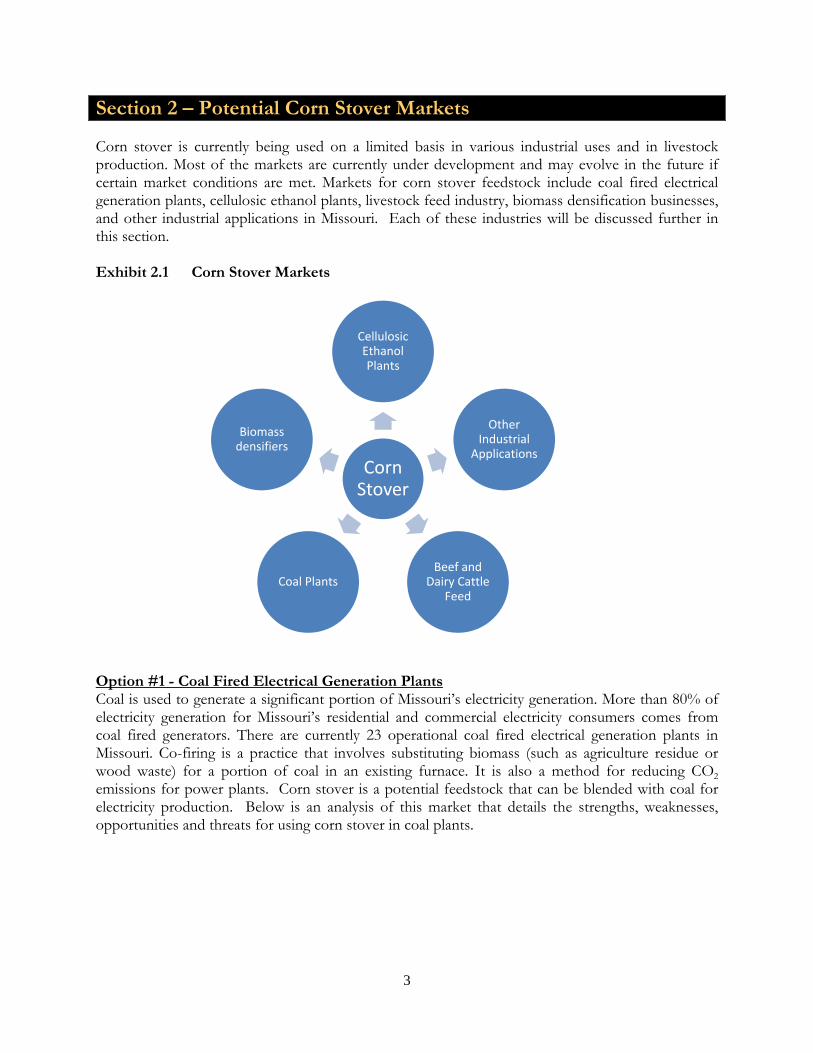
Section 2 – Potential Corn Stover Markets Corn stover is currently being used on a limited basis in various industrial uses and in livestock production. Most of the markets are currently under development and may evolve in the future if certain market conditions are met. Markets for corn stover feedstock include coal fired electrical generation plants, cellulosic ethanol plants, livestock feed industry, biomass densification businesses, and other industrial applications in Missouri. Each of these industries will be discussed further in this section. Exhibit 2.1 Corn Stover Markets
Option #1 - Coal Fired Electrical Generation Plants Coal is used to generate a significant portion of Missouri’s electricity generation. More than 80% of electricity generation for Missouri’s residential and commercial electricity consumers comes from coal fired generators. There are currently 23 operational coal fired electrical generation plants in Missouri. Co-firing is a practice that involves substituting biomass (such as agriculture residue or wood waste) for a portion of coal in an existing furnace. It is also a method for reducing CO2
emissions for power plants. Corn stover is a potential feedstock that can be blended with coal for electricity production. Below is an analysis of this market that details the strengths, weaknesses, opportunities and threats for using corn stover in coal plants.
Corn Stover
Cellulosic Ethanol Plants
Other Industrial
Applications
Beef and Dairy Cattle
FeedCoal Plants
Biomass densifiers
4
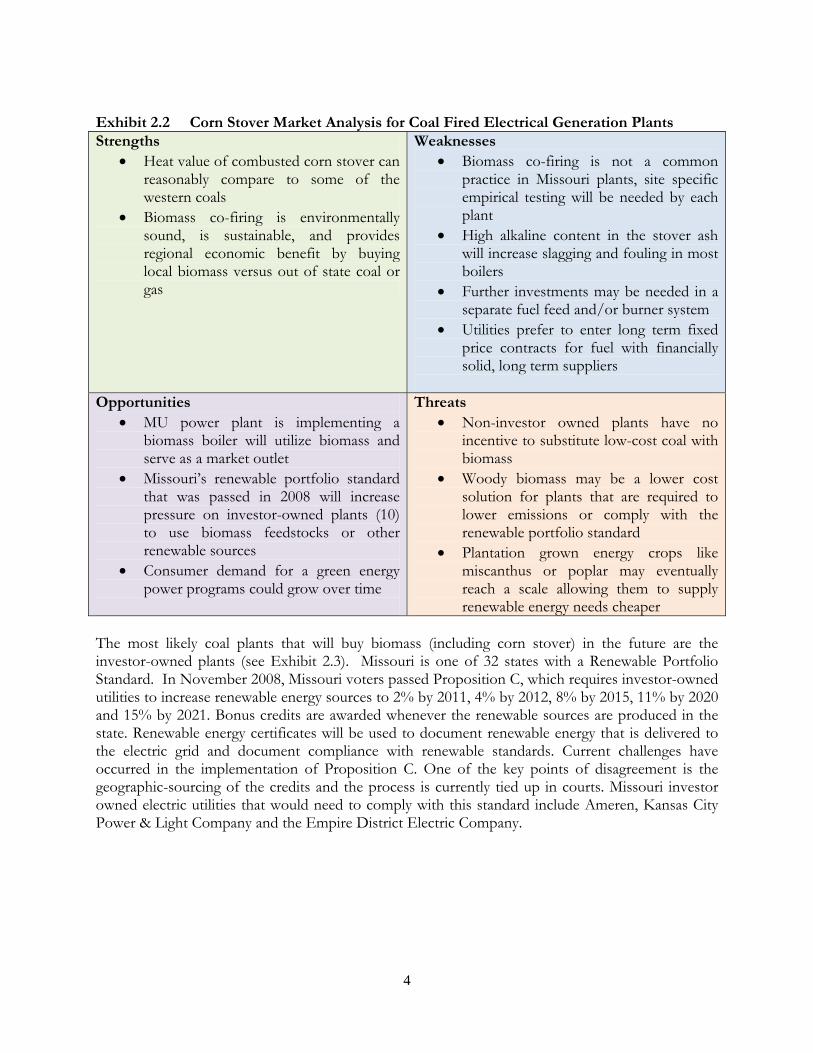
Exhibit 2.2 Corn Stover Market Analysis for Coal Fired Electrical Generation Plants Strengths
Heat value of combusted corn stover can reasonably compare to some of the western coals
Biomass co-firing is environmentally sound, is sustainable, and provides regional economic benefit by buying local biomass versus out of state coal or gas
Weaknesses Biomass co-firing is not a common
practice in Missouri plants, site specific empirical testing will be needed by each plant
High alkaline content in the stover ash will increase slagging and fouling in most boilers
Further investments may be needed in a separate fuel feed and/or burner system
Utilities prefer to enter long term fixed price contracts for fuel with financially solid, long term suppliers
Opportunities MU power plant is implementing a
biomass boiler will utilize biomass and serve as a market outlet
Missouri’s renewable portfolio standard that was passed in 2008 will increase pressure on investor-owned plants (10) to use biomass feedstocks or other renewable sources
Consumer demand for a green energy power programs could grow over time
Threats Non-investor owned plants have no
incentive to substitute low-cost coal with biomass
Woody biomass may be a lower cost solution for plants that are required to lower emissions or comply with the renewable portfolio standard
Plantation grown energy crops like miscanthus or poplar may eventually reach a scale allowing them to supply renewable energy needs cheaper
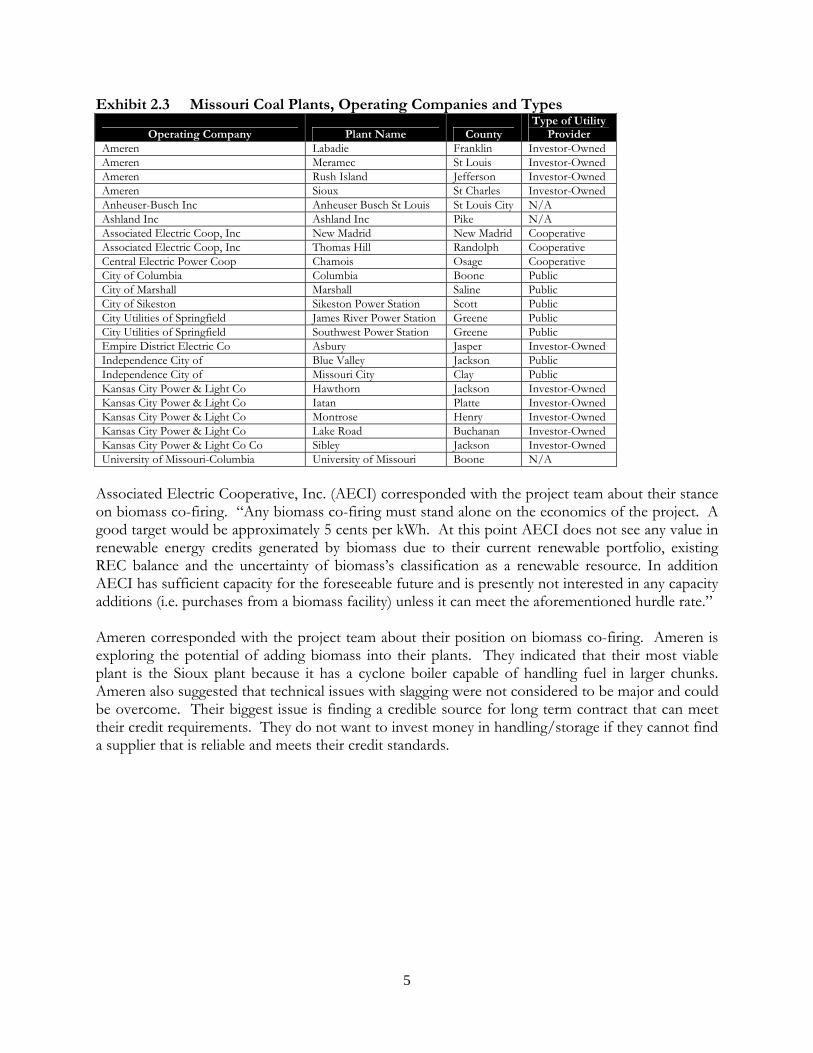
The most likely coal plants that will buy biomass (including corn stover) in the future are the investor-owned plants (see Exhibit 2.3). Missouri is one of 32 states with a Renewable Portfolio Standard. In November 2008, Missouri voters passed Proposition C, which requires investor-owned utilities to increase renewable energy sources to 2% by 2011, 4% by 2012, 8% by 2015, 11% by 2020 and 15% by 2021. Bonus credits are awarded whenever the renewable sources are produced in the state. Renewable energy certificates will be used to document renewable energy that is delivered to the electric grid and document compliance with renewable standards. Current challenges have occurred in the implementation of Proposition C. One of the key points of disagreement is the geographic-sourcing of the credits and the process is currently tied up in courts. Missouri investor owned electric utilities that would need to comply with this standard include Ameren, Kansas City Power & Light Company and the Empire District Electric Company.
5
Exhibit 2.3 Missouri Coal Plants, Operating Companies and Types
Operating Company Plant Name County Type of Utility
Provider Ameren Labadie Franklin Investor-Owned Ameren Meramec St Louis Investor-Owned Ameren Rush Island Jefferson Investor-Owned Ameren Sioux St Charles Investor-Owned Anheuser-Busch Inc Anheuser Busch St Louis St Louis City N/A Ashland Inc Ashland Inc Pike N/A Associated Electric Coop, Inc New Madrid New Madrid Cooperative Associated Electric Coop, Inc Thomas Hill Randolph Cooperative Central Electric Power Coop Chamois Osage Cooperative City of Columbia Columbia Boone Public City of Marshall Marshall Saline Public City of Sikeston Sikeston Power Station Scott Public City Utilities of Springfield James River Power Station Greene Public City Utilities of Springfield Southwest Power Station Greene Public Empire District Electric Co Asbury Jasper Investor-Owned Independence City of Blue Valley Jackson Public Independence City of Missouri City Clay Public Kansas City Power & Light Co Hawthorn Jackson Investor-Owned Kansas City Power & Light Co Iatan Platte Investor-Owned Kansas City Power & Light Co Montrose Henry Investor-Owned Kansas City Power & Light Co Lake Road Buchanan Investor-Owned Kansas City Power & Light Co Co Sibley Jackson Investor-Owned University of Missouri-Columbia University of Missouri Boone N/A
Associated Electric Cooperative, Inc. (AECI) corresponded with the project team about their stance on biomass co-firing. “Any biomass co-firing must stand alone on the economics of the project. A good target would be approximately 5 cents per kWh. At this point AECI does not see any value in renewable energy credits generated by biomass due to their current renewable portfolio, existing REC balance and the uncertainty of biomass’s classification as a renewable resource. In addition AECI has sufficient capacity for the foreseeable future and is presently not interested in any capacity additions (i.e. purchases from a biomass facility) unless it can meet the aforementioned hurdle rate.” Ameren corresponded with the project team about their position on biomass co-firing. Ameren is exploring the potential of adding biomass into their plants. They indicated that their most viable plant is the Sioux plant because it has a cyclone boiler capable of handling fuel in larger chunks. Ameren also suggested that technical issues with slagging were not considered to be major and could be overcome. Their biggest issue is finding a credible source for long term contract that can meet their credit requirements. They do not want to invest money in handling/storage if they cannot find a supplier that is reliable and meets their credit standards.
6
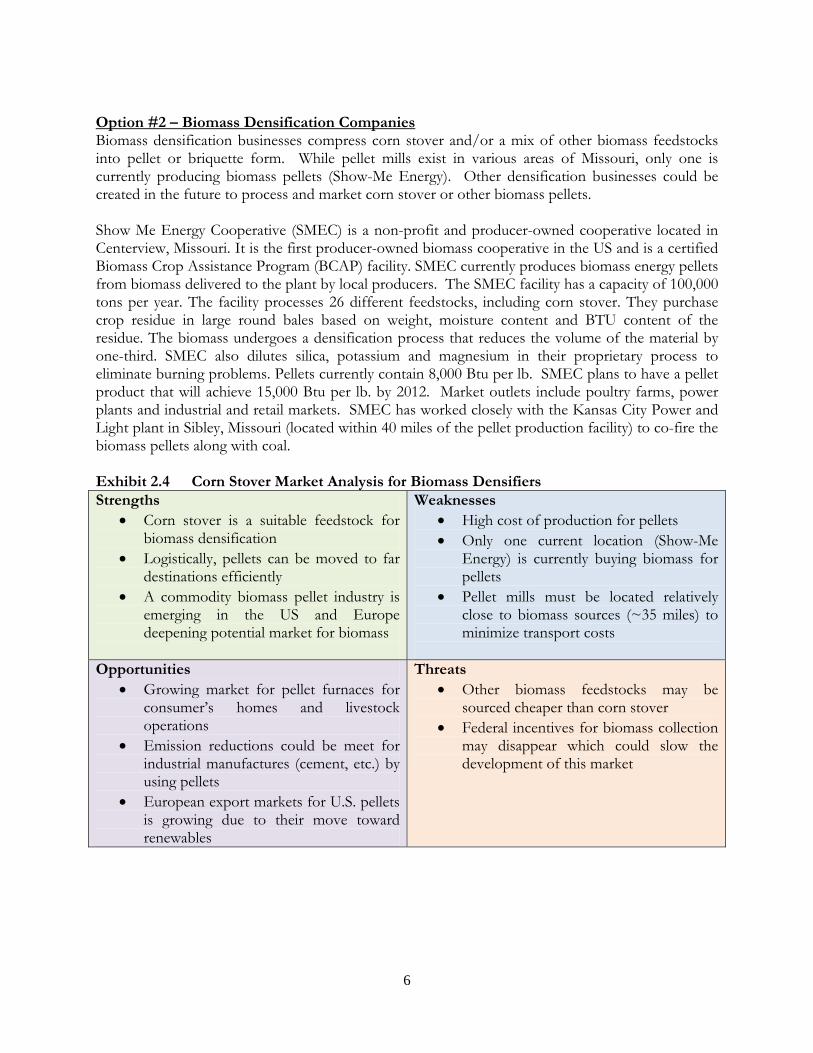
Option #2 – Biomass Densification Companies Biomass densification businesses compress corn stover and/or a mix of other biomass feedstocks into pellet or briquette form. While pellet mills exist in various areas of Missouri, only one is currently producing biomass pellets (Show-Me Energy). Other densification businesses could be created in the future to process and market corn stover or other biomass pellets. Show Me Energy Cooperative (SMEC) is a non-profit and producer-owned cooperative located in Centerview, Missouri. It is the first producer-owned biomass cooperative in the US and is a certified Biomass Crop Assistance Program (BCAP) facility. SMEC currently produces biomass energy pellets from biomass delivered to the plant by local producers. The SMEC facility has a capacity of 100,000 tons per year. The facility processes 26 different feedstocks, including corn stover. They purchase crop residue in large round bales based on weight, moisture content and BTU content of the residue. The biomass undergoes a densification process that reduces the volume of the material by one-third. SMEC also dilutes silica, potassium and magnesium in their proprietary process to eliminate burning problems. Pellets currently contain 8,000 Btu per lb. SMEC plans to have a pellet product that will achieve 15,000 Btu per lb. by 2012. Market outlets include poultry farms, power plants and industrial and retail markets. SMEC has worked closely with the Kansas City Power and Light plant in Sibley, Missouri (located within 40 miles of the pellet production facility) to co-fire the biomass pellets along with coal. Exhibit 2.4 Corn Stover Market Analysis for Biomass Densifiers Strengths
Corn stover is a suitable feedstock for biomass densification
Logistically, pellets can be moved to far destinations efficiently
A commodity biomass pellet industry is emerging in the US and Europe deepening potential market for biomass
Weaknesses High cost of production for pellets Only one current location (Show-Me
Energy) is currently buying biomass for pellets
Pellet mills must be located relatively close to biomass sources (~35 miles) to minimize transport costs
Opportunities Growing market for pellet furnaces for
consumer’s homes and livestock operations
Emission reductions could be meet for industrial manufactures (cement, etc.) by using pellets
European export markets for U.S. pellets is growing due to their move toward renewables
Threats Other biomass feedstocks may be
sourced cheaper than corn stover Federal incentives for biomass collection
may disappear which could slow the development of this market
7
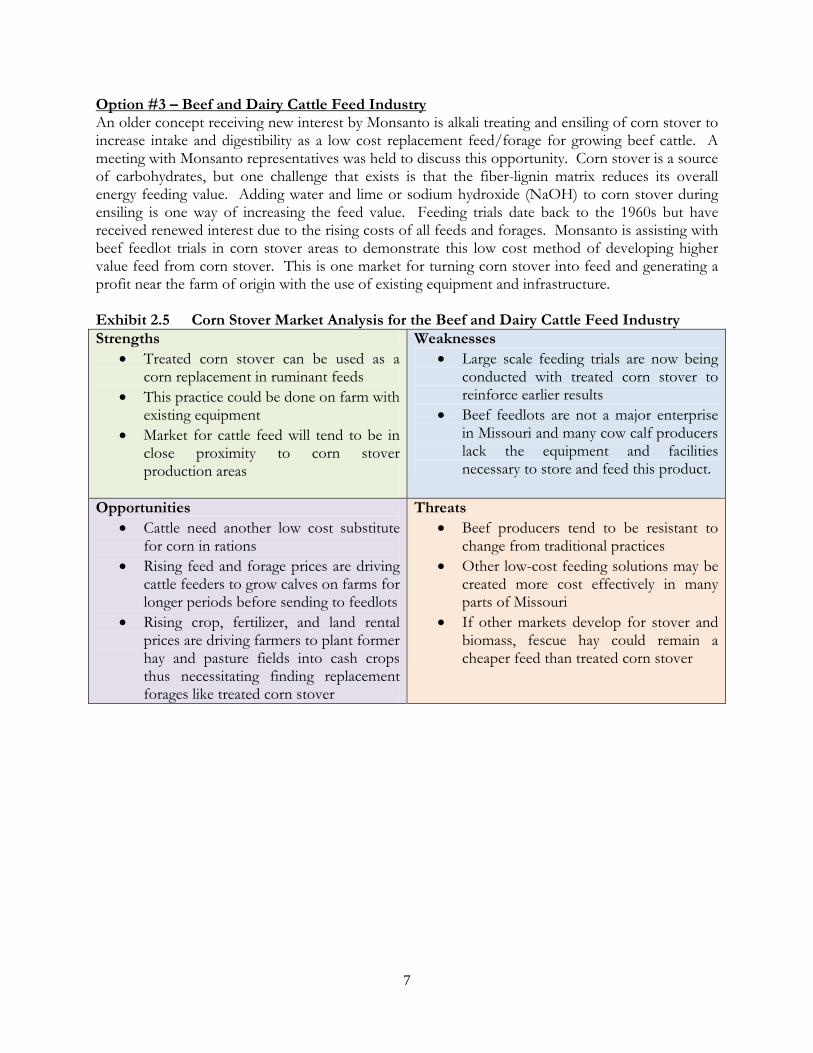
Option #3 – Beef and Dairy Cattle Feed Industry An older concept receiving new interest by Monsanto is alkali treating and ensiling of corn stover to increase intake and digestibility as a low cost replacement feed/forage for growing beef cattle. A meeting with Monsanto representatives was held to discuss this opportunity. Corn stover is a source of carbohydrates, but one challenge that exists is that the fiber-lignin matrix reduces its overall energy feeding value. Adding water and lime or sodium hydroxide (NaOH) to corn stover during ensiling is one way of increasing the feed value. Feeding trials date back to the 1960s but have received renewed interest due to the rising costs of all feeds and forages. Monsanto is assisting with beef feedlot trials in corn stover areas to demonstrate this low cost method of developing higher value feed from corn stover. This is one market for turning corn stover into feed and generating a profit near the farm of origin with the use of existing equipment and infrastructure. Exhibit 2.5 Corn Stover Market Analysis for the Beef and Dairy Cattle Feed Industry Strengths
Treated corn stover can be used as a corn replacement in ruminant feeds
This practice could be done on farm with existing equipment
Market for cattle feed will tend to be in close proximity to corn stover production areas
Weaknesses Large scale feeding trials are now being
conducted with treated corn stover to reinforce earlier results
Beef feedlots are not a major enterprise in Missouri and many cow calf producers lack the equipment and facilities necessary to store and feed this product.
Opportunities Cattle need another low cost substitute
for corn in rations Rising feed and forage prices are driving
cattle feeders to grow calves on farms for longer periods before sending to feedlots
Rising crop, fertilizer, and land rental prices are driving farmers to plant former hay and pasture fields into cash crops thus necessitating finding replacement forages like treated corn stover
Threats Beef producers tend to be resistant to
change from traditional practices Other low-cost feeding solutions may be
created more cost effectively in many parts of Missouri
If other markets develop for stover and biomass, fescue hay could remain a cheaper feed than treated corn stover
8
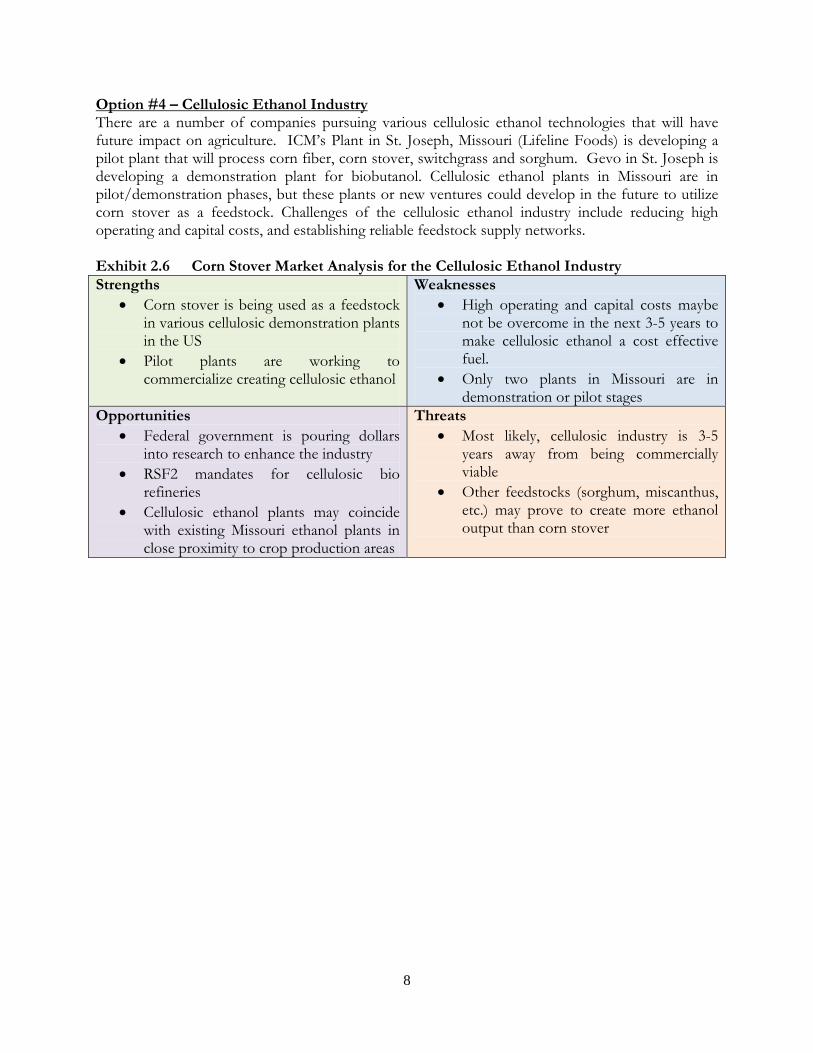
Option #4 – Cellulosic Ethanol Industry There are a number of companies pursuing various cellulosic ethanol technologies that will have future impact on agriculture. ICM’s Plant in St. Joseph, Missouri (Lifeline Foods) is developing a pilot plant that will process corn fiber, corn stover, switchgrass and sorghum. Gevo in St. Joseph is developing a demonstration plant for biobutanol. Cellulosic ethanol plants in Missouri are in pilot/demonstration phases, but these plants or new ventures could develop in the future to utilize corn stover as a feedstock. Challenges of the cellulosic ethanol industry include reducing high operating and capital costs, and establishing reliable feedstock supply networks. Exhibit 2.6 Corn Stover Market Analysis for the Cellulosic Ethanol Industry Strengths
Corn stover is being used as a feedstock in various cellulosic demonstration plants in the US
Pilot plants are working to commercialize creating cellulosic ethanol
Weaknesses High operating and capital costs maybe
not be overcome in the next 3-5 years to make cellulosic ethanol a cost effective fuel.
Only two plants in Missouri are in demonstration or pilot stages
Opportunities Federal government is pouring dollars
into research to enhance the industry RSF2 mandates for cellulosic bio
refineries Cellulosic ethanol plants may coincide
with existing Missouri ethanol plants in close proximity to crop production areas
Threats Most likely, cellulosic industry is 3-5
years away from being commercially viable
Other feedstocks (sorghum, miscanthus, etc.) may prove to create more ethanol output than corn stover
9
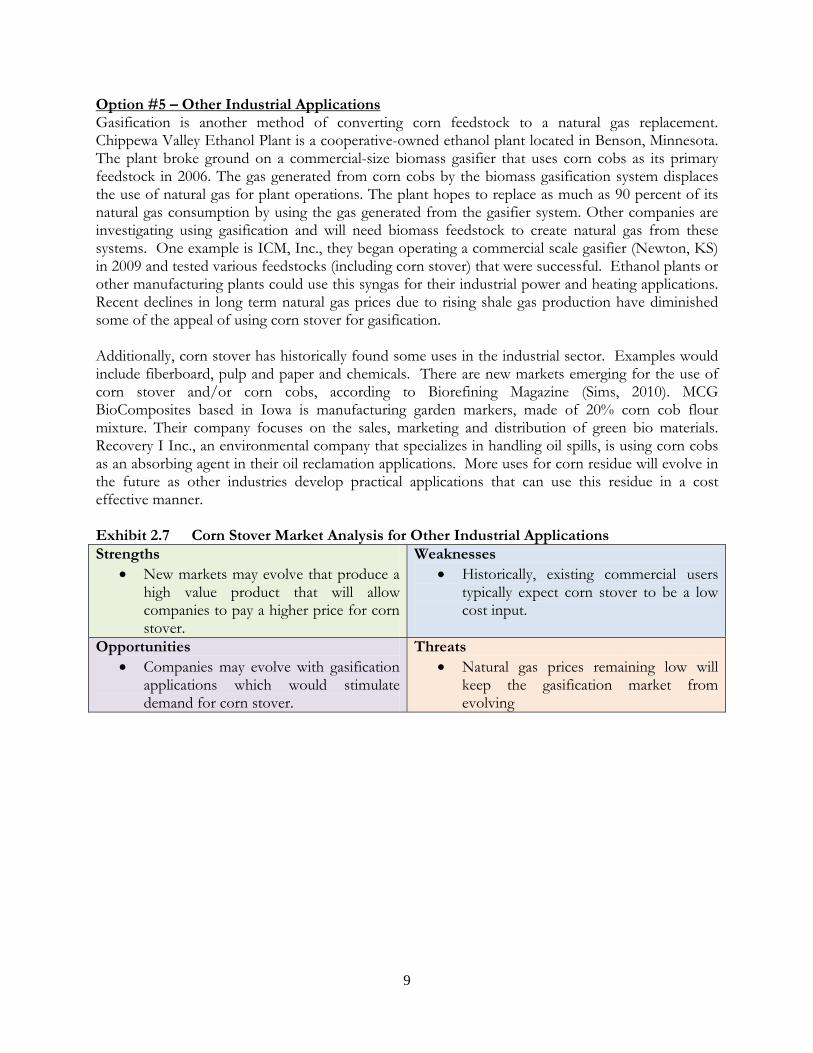
Option #5 – Other Industrial Applications Gasification is another method of converting corn feedstock to a natural gas replacement. Chippewa Valley Ethanol Plant is a cooperative-owned ethanol plant located in Benson, Minnesota. The plant broke ground on a commercial-size biomass gasifier that uses corn cobs as its primary feedstock in 2006. The gas generated from corn cobs by the biomass gasification system displaces the use of natural gas for plant operations. The plant hopes to replace as much as 90 percent of its natural gas consumption by using the gas generated from the gasifier system. Other companies are investigating using gasification and will need biomass feedstock to create natural gas from these systems. One example is ICM, Inc., they began operating a commercial scale gasifier (Newton, KS) in 2009 and tested various feedstocks (including corn stover) that were successful. Ethanol plants or other manufacturing plants could use this syngas for their industrial power and heating applications. Recent declines in long term natural gas prices due to rising shale gas production have diminished some of the appeal of using corn stover for gasification. Additionally, corn stover has historically found some uses in the industrial sector. Examples would include fiberboard, pulp and paper and chemicals. There are new markets emerging for the use of corn stover and/or corn cobs, according to Biorefining Magazine (Sims, 2010). MCG BioComposites based in Iowa is manufacturing garden markers, made of 20% corn cob flour mixture. Their company focuses on the sales, marketing and distribution of green bio materials. Recovery I Inc., an environmental company that specializes in handling oil spills, is using corn cobs as an absorbing agent in their oil reclamation applications. More uses for corn residue will evolve in the future as other industries develop practical applications that can use this residue in a cost effective manner. Exhibit 2.7 Corn Stover Market Analysis for Other Industrial Applications Strengths
New markets may evolve that produce a high value product that will allow companies to pay a higher price for corn stover.
Weaknesses Historically, existing commercial users
typically expect corn stover to be a low cost input.
Opportunities
Companies may evolve with gasification applications which would stimulate demand for corn stover.
Threats Natural gas prices remaining low will
keep the gasification market from evolving
10
Section 3 – Supply, Demand and Proximity to Markets The form of corn stover (bales, pellets) will play an important role in understanding the logistics. Markets that are located in close proximity to corn production regions will have a competitive advantage in sourcing lower cost biomass. For bales, it has been suggested by research that markets should exist within 50 miles to justify the transportation expense. The Center for Applied Research and Environmental Systems (CARES) at the University of Missouri conducted some analysis that approximated sustainable corn stover tonnage and location in the state of Missouri. These calculations were based on cropland data layers, slopes, corn acreage, and grain yields. Additionally, environmental constraints such as soil erosion, soil organic carbon, and soil organic matter are important when considering corn stover harvest. The following evaluation method based upon cropland slopes may be used to provide an initial estimate of sustainable corn stover removal rates in Missouri includes:
Fields with land slopes less than 2%, less than 50% of corn stover would be harvested Fields with land slopes of 2% to 5%, less than 25% removal would be harvested Fields with land slopes greater than 5%, 0% of the corn stover removed
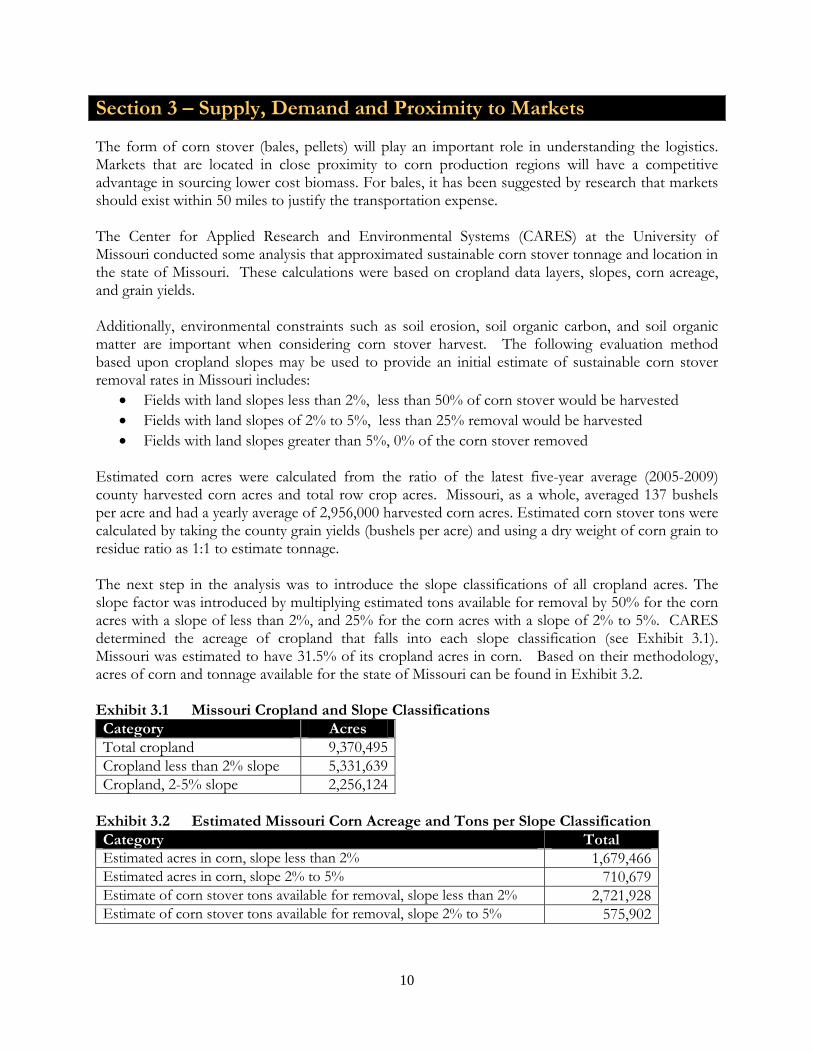
Estimated corn acres were calculated from the ratio of the latest five-year average (2005-2009) county harvested corn acres and total row crop acres. Missouri, as a whole, averaged 137 bushels per acre and had a yearly average of 2,956,000 harvested corn acres. Estimated corn stover tons were calculated by taking the county grain yields (bushels per acre) and using a dry weight of corn grain to residue ratio as 1:1 to estimate tonnage. The next step in the analysis was to introduce the slope classifications of all cropland acres. The slope factor was introduced by multiplying estimated tons available for removal by 50% for the corn acres with a slope of less than 2%, and 25% for the corn acres with a slope of 2% to 5%. CARES determined the acreage of cropland that falls into each slope classification (see Exhibit 3.1). Missouri was estimated to have 31.5% of its cropland acres in corn. Based on their methodology, acres of corn and tonnage available for the state of Missouri can be found in Exhibit 3.2. Exhibit 3.1 Missouri Cropland and Slope Classifications Category Acres Total cropland 9,370,495Cropland less than 2% slope 5,331,639Cropland, 2-5% slope 2,256,124
Exhibit 3.2 Estimated Missouri Corn Acreage and Tons per Slope Classification Category Total Estimated acres in corn, slope less than 2% 1,679,466 Estimated acres in corn, slope 2% to 5% 710,679 Estimate of corn stover tons available for removal, slope less than 2% 2,721,928 Estimate of corn stover tons available for removal, slope 2% to 5% 575,902
11
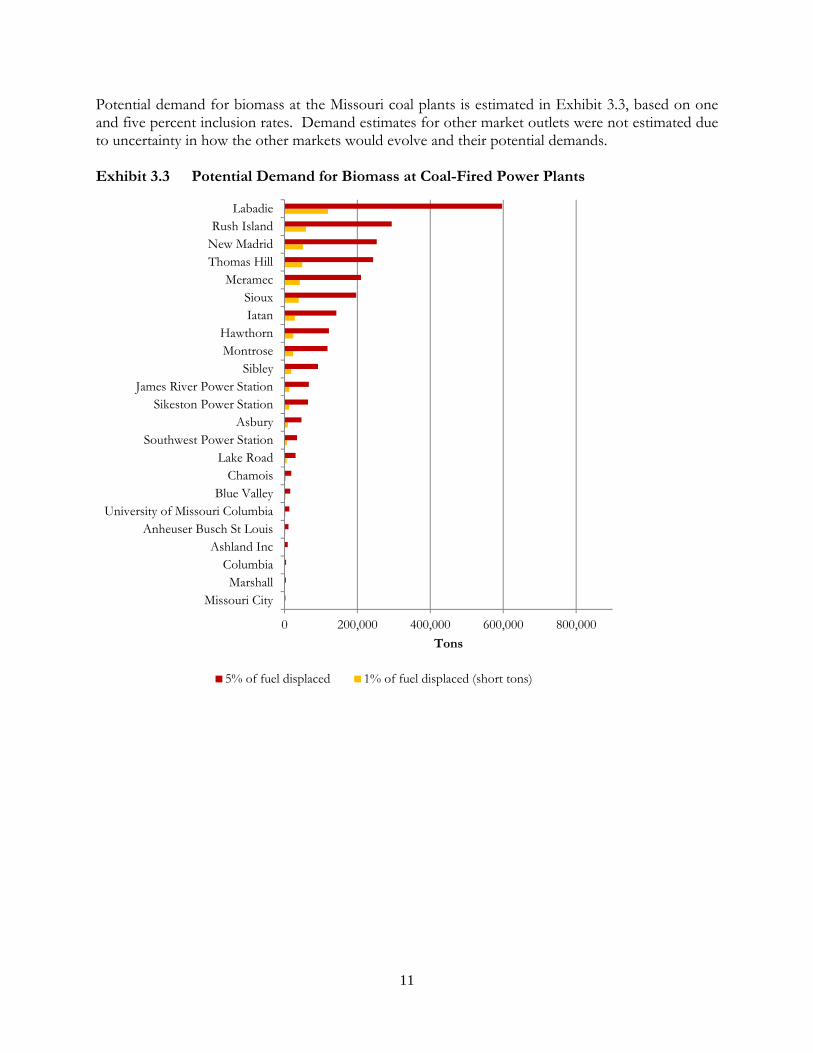
Potential demand for biomass at the Missouri coal plants is estimated in Exhibit 3.3, based on one and five percent inclusion rates. Demand estimates for other market outlets were not estimated due to uncertainty in how the other markets would evolve and their potential demands. Exhibit 3.3 Potential Demand for Biomass at Coal-Fired Power Plants
0 200,000 400,000 600,000 800,000
Missouri CityMarshall
ColumbiaAshland Inc
Anheuser Busch St LouisUniversity of Missouri Columbia
Blue ValleyChamois
Lake RoadSouthwest Power Station
AsburySikeston Power Station
James River Power StationSibley
MontroseHawthorn
IatanSioux
MeramecThomas HillNew MadridRush Island
Labadie
Tons
5% of fuel displaced 1% of fuel displaced (short tons)
12
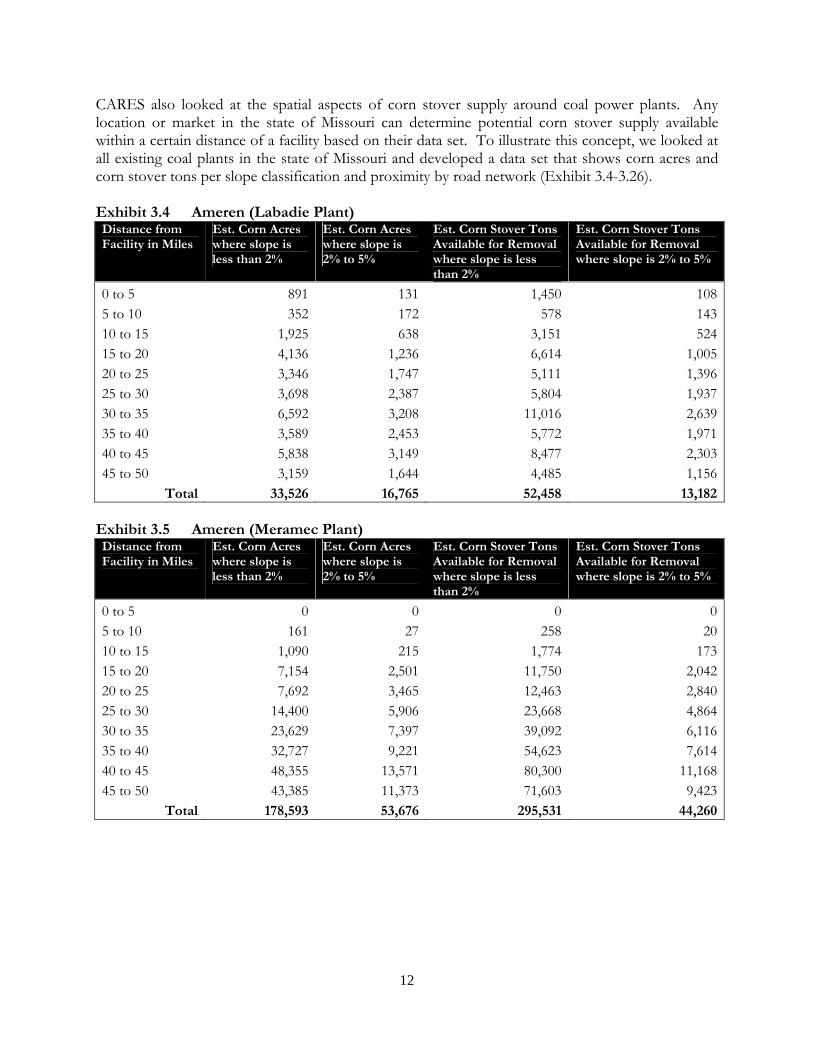
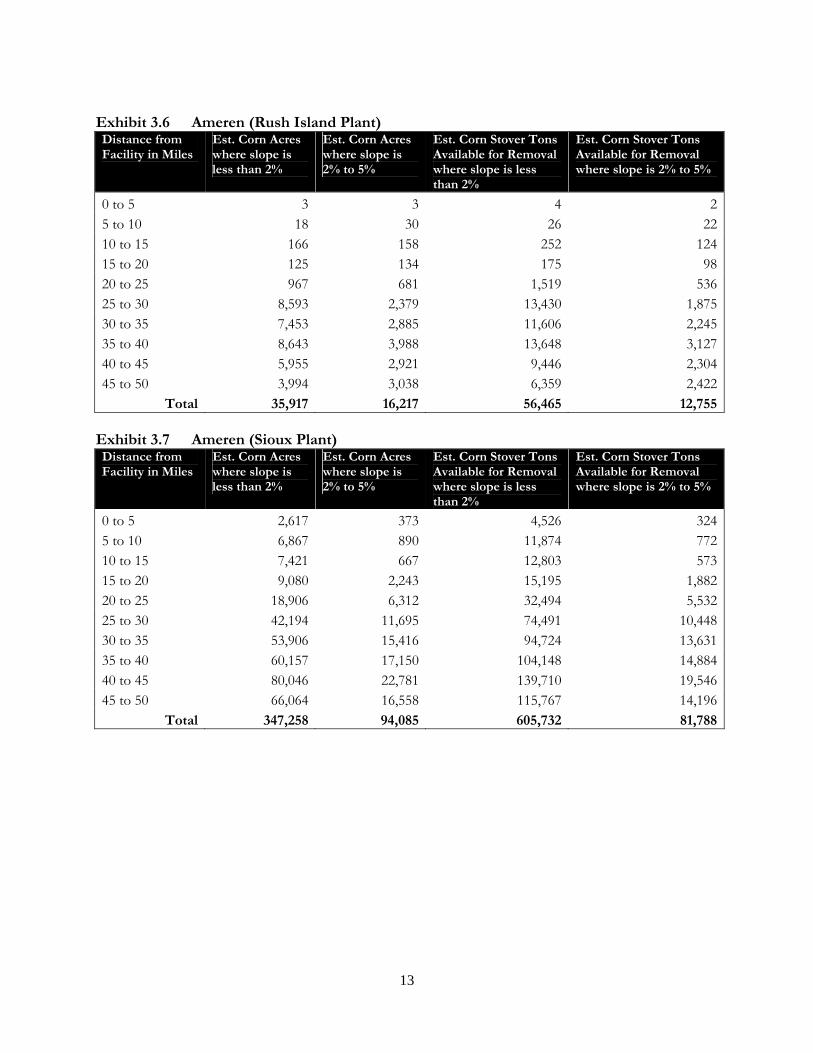
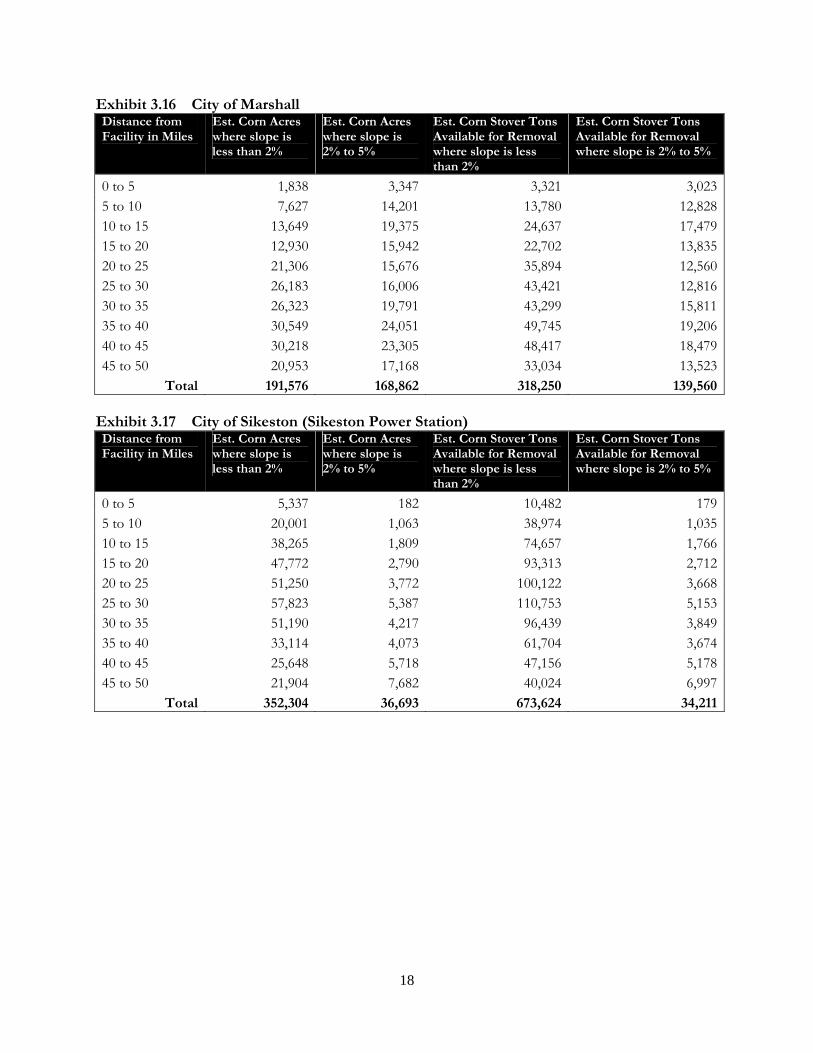
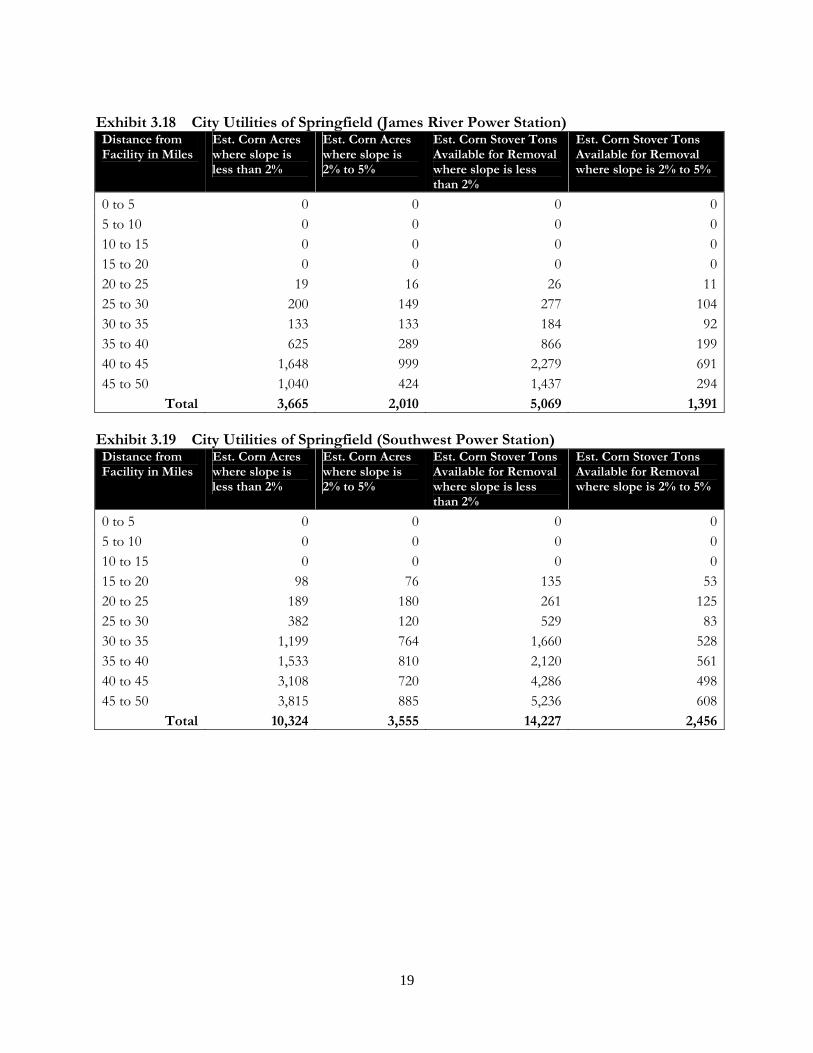
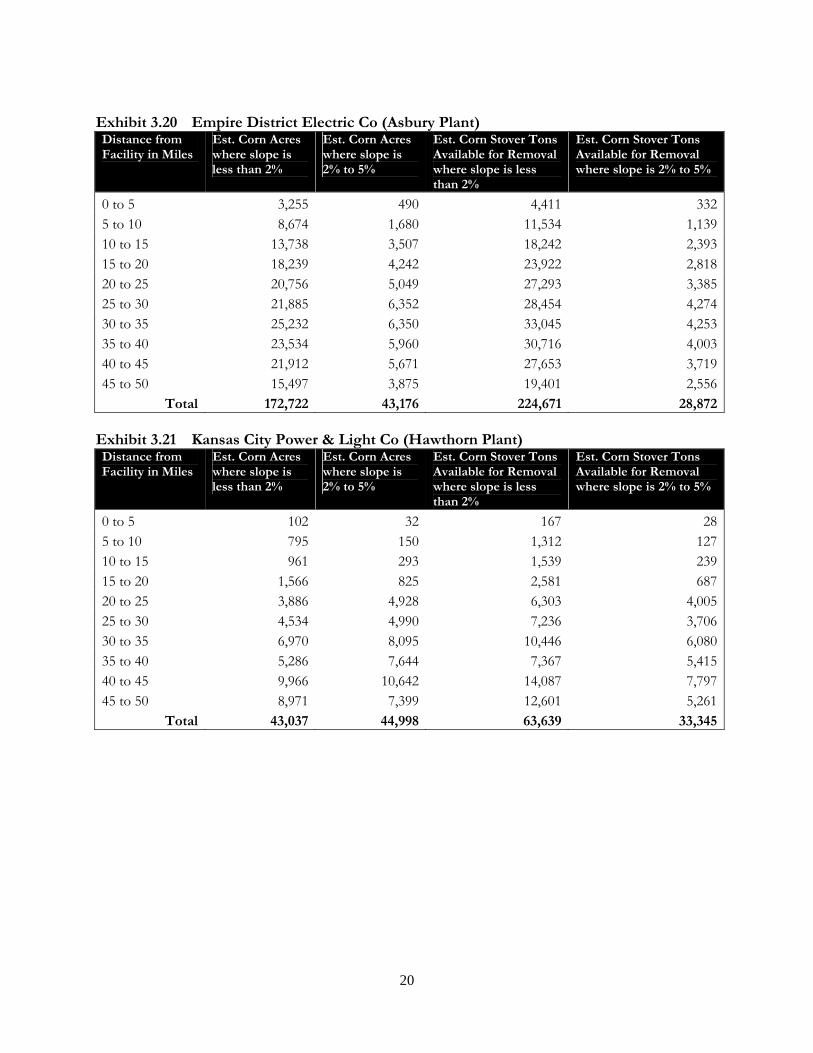
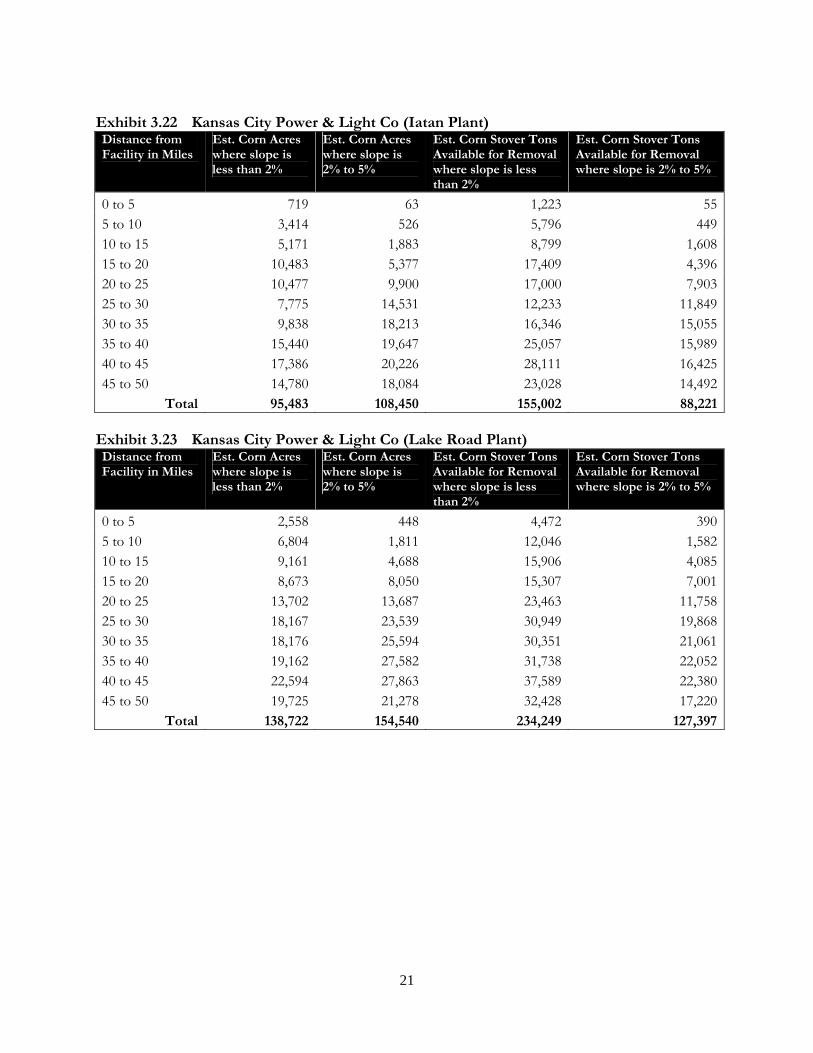
CARES also looked at the spatial aspects of corn stover supply around coal power plants. Any location or market in the state of Missouri can determine potential corn stover supply available within a certain distance of a facility based on their data set. To illustrate this concept, we looked at all existing coal plants in the state of Missouri and developed a data set that shows corn acres and corn stover tons per slope classification and proximity by road network (Exhibit 3.4-3.26). Exhibit 3.4 Ameren (Labadie Plant) Distance from Facility in Miles
Est. Corn Acres where slope is less than 2%
Est. Corn Acres where slope is 2% to 5%
Est. Corn Stover Tons Available for Removal where slope is less than 2%
Est. Corn Stover Tons Available for Removal where slope is 2% to 5%
0 to 5 891 131 1,450 1085 to 10 352 172 578 14310 to 15 1,925 638 3,151 52415 to 20 4,136 1,236 6,614 1,00520 to 25 3,346 1,747 5,111 1,39625 to 30 3,698 2,387 5,804 1,93730 to 35 6,592 3,208 11,016 2,63935 to 40 3,589 2,453 5,772 1,97140 to 45 5,838 3,149 8,477 2,30345 to 50 3,159 1,644 4,485 1,156
Total 33,526 16,765 52,458 13,182 Exhibit 3.5 Ameren (Meramec Plant) Distance from Facility in Miles
Est. Corn Acres where slope is less than 2%
Est. Corn Acres where slope is 2% to 5%
Est. Corn Stover Tons Available for Removal where slope is less than 2%
Est. Corn Stover Tons Available for Removal where slope is 2% to 5%
0 to 5 0 0 0 05 to 10 161 27 258 2010 to 15 1,090 215 1,774 17315 to 20 7,154 2,501 11,750 2,04220 to 25 7,692 3,465 12,463 2,84025 to 30 14,400 5,906 23,668 4,86430 to 35 23,629 7,397 39,092 6,11635 to 40 32,727 9,221 54,623 7,61440 to 45 48,355 13,571 80,300 11,16845 to 50 43,385 11,373 71,603 9,423
Total 178,593 53,676 295,531 44,260
13
Exhibit 3.6 Ameren (Rush Island Plant) Distance from Facility in Miles
Est. Corn Acres where slope is less than 2%
Est. Corn Acres where slope is 2% to 5%
Est. Corn Stover Tons Available for Removal where slope is less than 2%
Est. Corn Stover Tons Available for Removal where slope is 2% to 5%
0 to 5 3 3 4 25 to 10 18 30 26 2210 to 15 166 158 252 12415 to 20 125 134 175 9820 to 25 967 681 1,519 53625 to 30 8,593 2,379 13,430 1,87530 to 35 7,453 2,885 11,606 2,24535 to 40 8,643 3,988 13,648 3,12740 to 45 5,955 2,921 9,446 2,30445 to 50 3,994 3,038 6,359 2,422
Total 35,917 16,217 56,465 12,755 Exhibit 3.7 Ameren (Sioux Plant) Distance from Facility in Miles
Est. Corn Acres where slope is less than 2%
Est. Corn Acres where slope is 2% to 5%
Est. Corn Stover Tons Available for Removal where slope is less than 2%
Est. Corn Stover Tons Available for Removal where slope is 2% to 5%
0 to 5 2,617 373 4,526 3245 to 10 6,867 890 11,874 77210 to 15 7,421 667 12,803 57315 to 20 9,080 2,243 15,195 1,88220 to 25 18,906 6,312 32,494 5,53225 to 30 42,194 11,695 74,491 10,44830 to 35 53,906 15,416 94,724 13,63135 to 40 60,157 17,150 104,148 14,88440 to 45 80,046 22,781 139,710 19,54645 to 50 66,064 16,558 115,767 14,196
Total 347,258 94,085 605,732 81,788
14
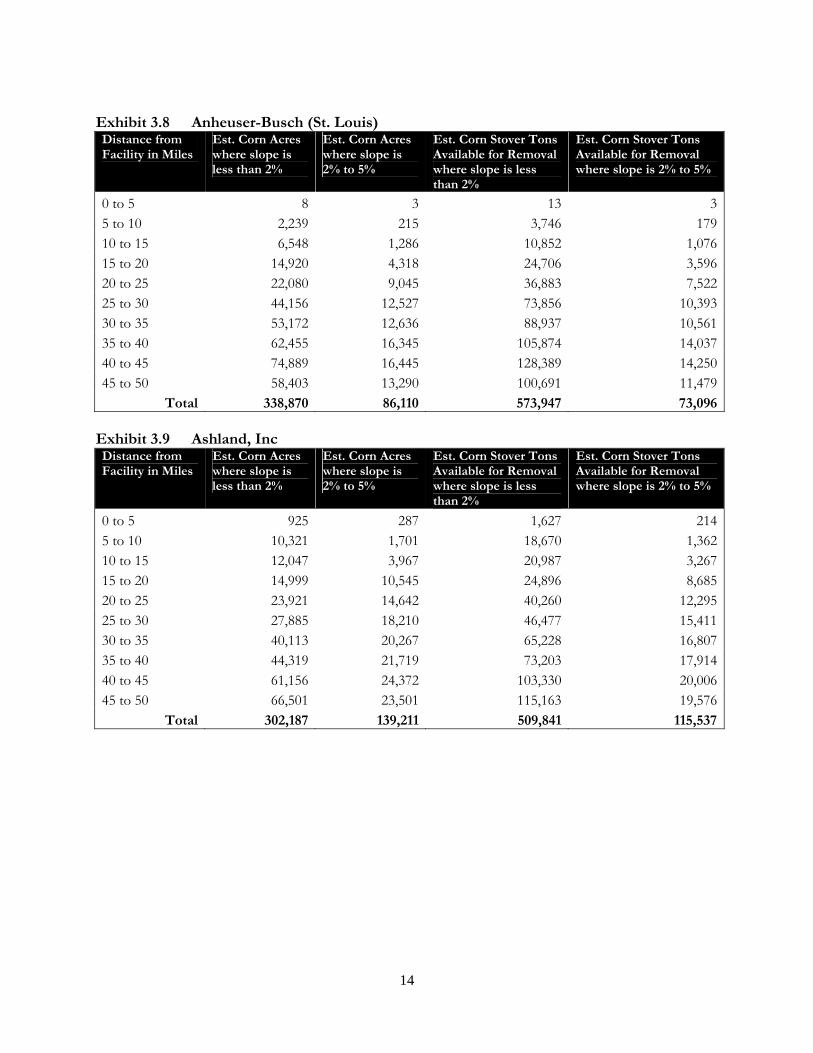
Exhibit 3.8 Anheuser-Busch (St. Louis) Distance from Facility in Miles
Est. Corn Acres where slope is less than 2%
Est. Corn Acres where slope is 2% to 5%
Est. Corn Stover Tons Available for Removal where slope is less than 2%
Est. Corn Stover Tons Available for Removal where slope is 2% to 5%
0 to 5 8 3 13 35 to 10 2,239 215 3,746 17910 to 15 6,548 1,286 10,852 1,07615 to 20 14,920 4,318 24,706 3,59620 to 25 22,080 9,045 36,883 7,52225 to 30 44,156 12,527 73,856 10,39330 to 35 53,172 12,636 88,937 10,56135 to 40 62,455 16,345 105,874 14,03740 to 45 74,889 16,445 128,389 14,25045 to 50 58,403 13,290 100,691 11,479
Total 338,870 86,110 573,947 73,096 Exhibit 3.9 Ashland, Inc Distance from Facility in Miles
Est. Corn Acres where slope is less than 2%
Est. Corn Acres where slope is 2% to 5%
Est. Corn Stover Tons Available for Removal where slope is less than 2%
Est. Corn Stover Tons Available for Removal where slope is 2% to 5%
0 to 5 925 287 1,627 2145 to 10 10,321 1,701 18,670 1,36210 to 15 12,047 3,967 20,987 3,26715 to 20 14,999 10,545 24,896 8,68520 to 25 23,921 14,642 40,260 12,29525 to 30 27,885 18,210 46,477 15,41130 to 35 40,113 20,267 65,228 16,80735 to 40 44,319 21,719 73,203 17,91440 to 45 61,156 24,372 103,330 20,00645 to 50 66,501 23,501 115,163 19,576
Total 302,187 139,211 509,841 115,537
15
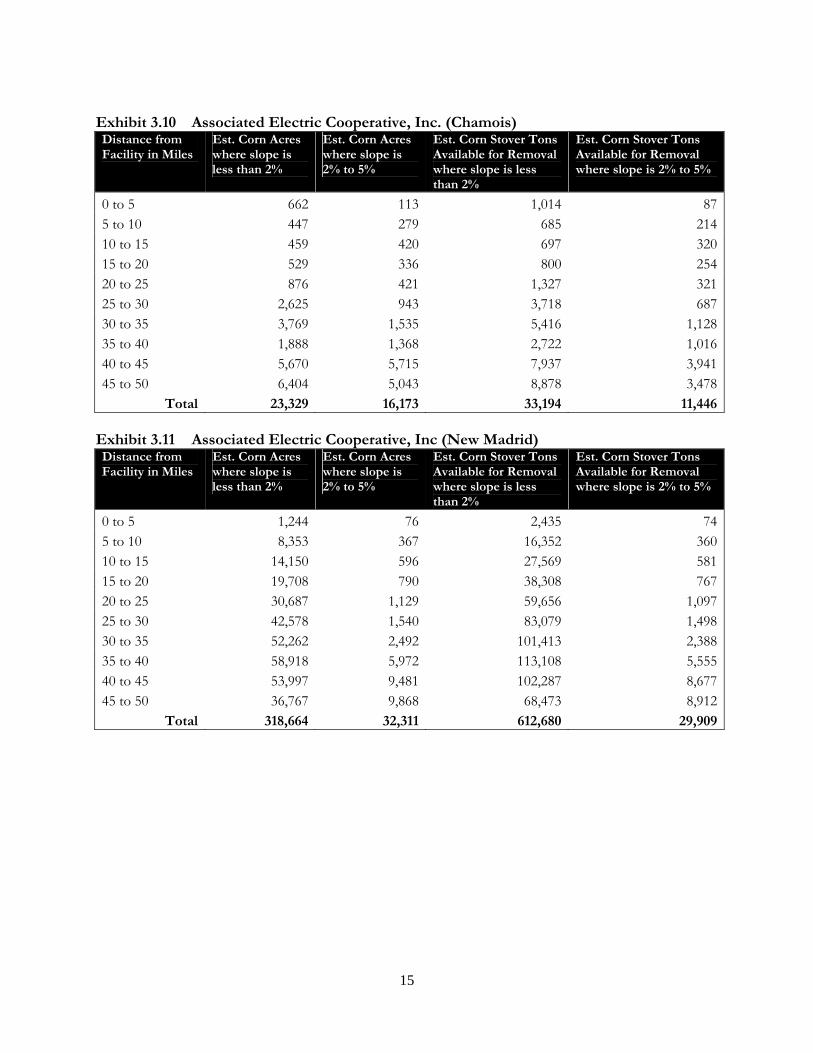
Exhibit 3.10 Associated Electric Cooperative, Inc. (Chamois) Distance from Facility in Miles
Est. Corn Acres where slope is less than 2%
Est. Corn Acres where slope is 2% to 5%
Est. Corn Stover Tons Available for Removal where slope is less than 2%
Est. Corn Stover Tons Available for Removal where slope is 2% to 5%
0 to 5 662 113 1,014 875 to 10 447 279 685 21410 to 15 459 420 697 32015 to 20 529 336 800 25420 to 25 876 421 1,327 32125 to 30 2,625 943 3,718 68730 to 35 3,769 1,535 5,416 1,12835 to 40 1,888 1,368 2,722 1,01640 to 45 5,670 5,715 7,937 3,94145 to 50 6,404 5,043 8,878 3,478
Total 23,329 16,173 33,194 11,446 Exhibit 3.11 Associated Electric Cooperative, Inc (New Madrid) Distance from Facility in Miles
Est. Corn Acres where slope is less than 2%
Est. Corn Acres where slope is 2% to 5%
Est. Corn Stover Tons Available for Removal where slope is less than 2%
Est. Corn Stover Tons Available for Removal where slope is 2% to 5%
0 to 5 1,244 76 2,435 745 to 10 8,353 367 16,352 36010 to 15 14,150 596 27,569 58115 to 20 19,708 790 38,308 76720 to 25 30,687 1,129 59,656 1,09725 to 30 42,578 1,540 83,079 1,49830 to 35 52,262 2,492 101,413 2,38835 to 40 58,918 5,972 113,108 5,55540 to 45 53,997 9,481 102,287 8,67745 to 50 36,767 9,868 68,473 8,912
Total 318,664 32,311 612,680 29,909

16
Exhibit 3.12 Associated Electric Cooperative, Inc (Thomas Hill) Distance from Facility in Miles
Est. Corn Acres where slope is less than 2%
Est. Corn Acres where slope is 2% to 5%
Est. Corn Stover Tons Available for Removal where slope is less than 2%
Est. Corn Stover Tons Available for Removal where slope is 2% to 5%
0 to 5 126 206 180 1475 to 10 1,988 1,325 3,106 1,01710 to 15 6,174 2,025 9,853 1,60915 to 20 8,243 3,798 13,186 3,01020 to 25 8,290 5,796 13,305 4,66325 to 30 11,325 6,656 17,681 5,27030 to 35 22,588 10,186 35,125 7,85535 to 40 27,344 11,906 42,348 9,12640 to 45 26,685 14,853 40,726 11,58345 to 50 21,517 16,003 33,044 12,866
Total 134,280 72,754 208,554 57,146 Exhibit 3.13 City of Columbia Distance from Facility in Miles
Est. Corn Acres where slope is less than 2%
Est. Corn Acres where slope is 2% to 5%
Est. Corn Stover Tons Available for Removal where slope is less than 2%
Est. Corn Stover Tons Available for Removal where slope is 2% to 5%
0 to 5 69 99 98 715 to 10 1,237 1,331 1,762 94810 to 15 3,883 2,749 5,581 1,97315 to 20 8,500 4,449 12,508 3,25020 to 25 14,424 6,462 21,085 4,75825 to 30 16,216 9,092 23,826 6,72530 to 35 19,091 11,256 27,796 8,29135 to 40 18,645 12,585 27,134 9,31240 to 45 23,119 15,429 34,395 11,61045 to 50 22,279 14,596 32,879 11,028
Total 127,463 78,048 187,064 57,966
17
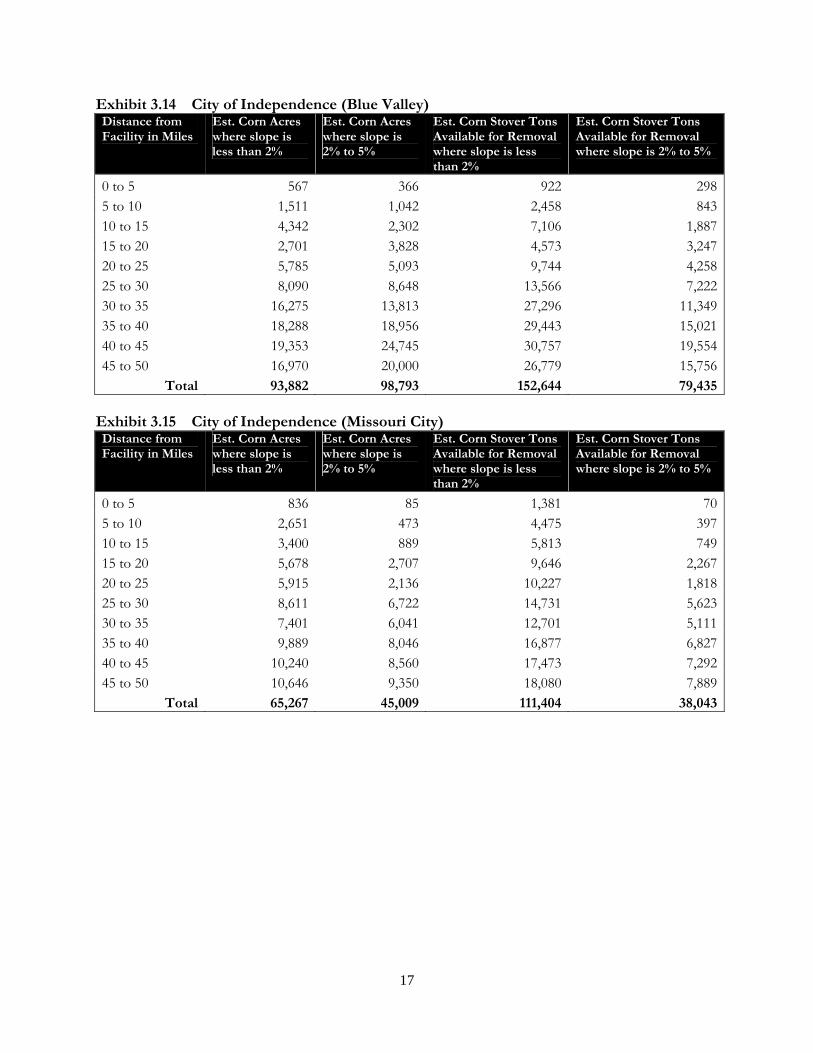
Exhibit 3.14 City of Independence (Blue Valley) Distance from Facility in Miles
Est. Corn Acres where slope is less than 2%
Est. Corn Acres where slope is 2% to 5%
Est. Corn Stover Tons Available for Removal where slope is less than 2%
Est. Corn Stover Tons Available for Removal where slope is 2% to 5%
0 to 5 567 366 922 2985 to 10 1,511 1,042 2,458 84310 to 15 4,342 2,302 7,106 1,88715 to 20 2,701 3,828 4,573 3,24720 to 25 5,785 5,093 9,744 4,25825 to 30 8,090 8,648 13,566 7,22230 to 35 16,275 13,813 27,296 11,34935 to 40 18,288 18,956 29,443 15,02140 to 45 19,353 24,745 30,757 19,55445 to 50 16,970 20,000 26,779 15,756
Total 93,882 98,793 152,644 79,435 Exhibit 3.15 City of Independence (Missouri City) Distance from Facility in Miles
Est. Corn Acres where slope is less than 2%
Est. Corn Acres where slope is 2% to 5%
Est. Corn Stover Tons Available for Removal where slope is less than 2%
Est. Corn Stover Tons Available for Removal where slope is 2% to 5%
0 to 5 836 85 1,381 705 to 10 2,651 473 4,475 39710 to 15 3,400 889 5,813 74915 to 20 5,678 2,707 9,646 2,26720 to 25 5,915 2,136 10,227 1,81825 to 30 8,611 6,722 14,731 5,62330 to 35 7,401 6,041 12,701 5,11135 to 40 9,889 8,046 16,877 6,82740 to 45 10,240 8,560 17,473 7,29245 to 50 10,646 9,350 18,080 7,889
Total 65,267 45,009 111,404 38,043
18
Exhibit 3.16 City of Marshall Distance from Facility in Miles
Est. Corn Acres where slope is less than 2%
Est. Corn Acres where slope is 2% to 5%
Est. Corn Stover Tons Available for Removal where slope is less than 2%
Est. Corn Stover Tons Available for Removal where slope is 2% to 5%
0 to 5 1,838 3,347 3,321 3,0235 to 10 7,627 14,201 13,780 12,82810 to 15 13,649 19,375 24,637 17,47915 to 20 12,930 15,942 22,702 13,83520 to 25 21,306 15,676 35,894 12,56025 to 30 26,183 16,006 43,421 12,81630 to 35 26,323 19,791 43,299 15,81135 to 40 30,549 24,051 49,745 19,20640 to 45 30,218 23,305 48,417 18,47945 to 50 20,953 17,168 33,034 13,523
Total 191,576 168,862 318,250 139,560 Exhibit 3.17 City of Sikeston (Sikeston Power Station) Distance from Facility in Miles
Est. Corn Acres where slope is less than 2%
Est. Corn Acres where slope is 2% to 5%
Est. Corn Stover Tons Available for Removal where slope is less than 2%
Est. Corn Stover Tons Available for Removal where slope is 2% to 5%
0 to 5 5,337 182 10,482 1795 to 10 20,001 1,063 38,974 1,03510 to 15 38,265 1,809 74,657 1,76615 to 20 47,772 2,790 93,313 2,71220 to 25 51,250 3,772 100,122 3,66825 to 30 57,823 5,387 110,753 5,15330 to 35 51,190 4,217 96,439 3,84935 to 40 33,114 4,073 61,704 3,67440 to 45 25,648 5,718 47,156 5,17845 to 50 21,904 7,682 40,024 6,997
Total 352,304 36,693 673,624 34,211
19
Exhibit 3.18 City Utilities of Springfield (James River Power Station) Distance from Facility in Miles
Est. Corn Acres where slope is less than 2%
Est. Corn Acres where slope is 2% to 5%
Est. Corn Stover Tons Available for Removal where slope is less than 2%
Est. Corn Stover Tons Available for Removal where slope is 2% to 5%
0 to 5 0 0 0 05 to 10 0 0 0 010 to 15 0 0 0 015 to 20 0 0 0 020 to 25 19 16 26 1125 to 30 200 149 277 10430 to 35 133 133 184 9235 to 40 625 289 866 19940 to 45 1,648 999 2,279 69145 to 50 1,040 424 1,437 294
Total 3,665 2,010 5,069 1,391 Exhibit 3.19 City Utilities of Springfield (Southwest Power Station) Distance from Facility in Miles
Est. Corn Acres where slope is less than 2%
Est. Corn Acres where slope is 2% to 5%
Est. Corn Stover Tons Available for Removal where slope is less than 2%
Est. Corn Stover Tons Available for Removal where slope is 2% to 5%
0 to 5 0 0 0 05 to 10 0 0 0 010 to 15 0 0 0 015 to 20 98 76 135 5320 to 25 189 180 261 12525 to 30 382 120 529 8330 to 35 1,199 764 1,660 52835 to 40 1,533 810 2,120 56140 to 45 3,108 720 4,286 49845 to 50 3,815 885 5,236 608
Total 10,324 3,555 14,227 2,456
20
Exhibit 3.20 Empire District Electric Co (Asbury Plant) Distance from Facility in Miles
Est. Corn Acres where slope is less than 2%
Est. Corn Acres where slope is 2% to 5%
Est. Corn Stover Tons Available for Removal where slope is less than 2%
Est. Corn Stover Tons Available for Removal where slope is 2% to 5%
0 to 5 3,255 490 4,411 3325 to 10 8,674 1,680 11,534 1,13910 to 15 13,738 3,507 18,242 2,39315 to 20 18,239 4,242 23,922 2,81820 to 25 20,756 5,049 27,293 3,38525 to 30 21,885 6,352 28,454 4,27430 to 35 25,232 6,350 33,045 4,25335 to 40 23,534 5,960 30,716 4,00340 to 45 21,912 5,671 27,653 3,71945 to 50 15,497 3,875 19,401 2,556
Total 172,722 43,176 224,671 28,872 Exhibit 3.21 Kansas City Power & Light Co (Hawthorn Plant) Distance from Facility in Miles
Est. Corn Acres where slope is less than 2%
Est. Corn Acres where slope is 2% to 5%
Est. Corn Stover Tons Available for Removal where slope is less than 2%
Est. Corn Stover Tons Available for Removal where slope is 2% to 5%
0 to 5 102 32 167 285 to 10 795 150 1,312 12710 to 15 961 293 1,539 23915 to 20 1,566 825 2,581 68720 to 25 3,886 4,928 6,303 4,00525 to 30 4,534 4,990 7,236 3,70630 to 35 6,970 8,095 10,446 6,08035 to 40 5,286 7,644 7,367 5,41540 to 45 9,966 10,642 14,087 7,79745 to 50 8,971 7,399 12,601 5,261
Total 43,037 44,998 63,639 33,345
21
Exhibit 3.22 Kansas City Power & Light Co (Iatan Plant) Distance from Facility in Miles
Est. Corn Acres where slope is less than 2%
Est. Corn Acres where slope is 2% to 5%
Est. Corn Stover Tons Available for Removal where slope is less than 2%
Est. Corn Stover Tons Available for Removal where slope is 2% to 5%
0 to 5 719 63 1,223 555 to 10 3,414 526 5,796 44910 to 15 5,171 1,883 8,799 1,60815 to 20 10,483 5,377 17,409 4,39620 to 25 10,477 9,900 17,000 7,90325 to 30 7,775 14,531 12,233 11,84930 to 35 9,838 18,213 16,346 15,05535 to 40 15,440 19,647 25,057 15,98940 to 45 17,386 20,226 28,111 16,42545 to 50 14,780 18,084 23,028 14,492
Total 95,483 108,450 155,002 88,221 Exhibit 3.23 Kansas City Power & Light Co (Lake Road Plant) Distance from Facility in Miles
Est. Corn Acres where slope is less than 2%
Est. Corn Acres where slope is 2% to 5%
Est. Corn Stover Tons Available for Removal where slope is less than 2%
Est. Corn Stover Tons Available for Removal where slope is 2% to 5%
0 to 5 2,558 448 4,472 3905 to 10 6,804 1,811 12,046 1,58210 to 15 9,161 4,688 15,906 4,08515 to 20 8,673 8,050 15,307 7,00120 to 25 13,702 13,687 23,463 11,75825 to 30 18,167 23,539 30,949 19,86830 to 35 18,176 25,594 30,351 21,06135 to 40 19,162 27,582 31,738 22,05240 to 45 22,594 27,863 37,589 22,38045 to 50 19,725 21,278 32,428 17,220
Total 138,722 154,540 234,249 127,397
22
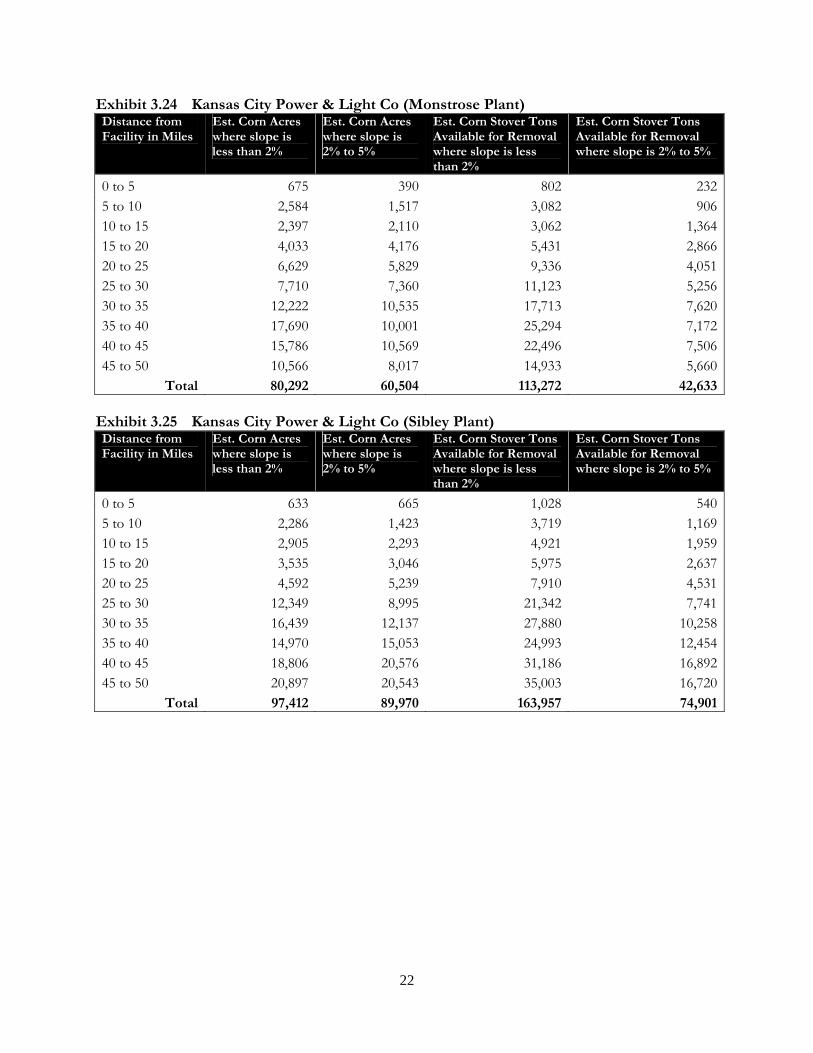
Exhibit 3.24 Kansas City Power & Light Co (Monstrose Plant) Distance from Facility in Miles
Est. Corn Acres where slope is less than 2%
Est. Corn Acres where slope is 2% to 5%
Est. Corn Stover Tons Available for Removal where slope is less than 2%
Est. Corn Stover Tons Available for Removal where slope is 2% to 5%
0 to 5 675 390 802 2325 to 10 2,584 1,517 3,082 90610 to 15 2,397 2,110 3,062 1,36415 to 20 4,033 4,176 5,431 2,86620 to 25 6,629 5,829 9,336 4,05125 to 30 7,710 7,360 11,123 5,25630 to 35 12,222 10,535 17,713 7,62035 to 40 17,690 10,001 25,294 7,17240 to 45 15,786 10,569 22,496 7,50645 to 50 10,566 8,017 14,933 5,660
Total 80,292 60,504 113,272 42,633 Exhibit 3.25 Kansas City Power & Light Co (Sibley Plant) Distance from Facility in Miles
Est. Corn Acres where slope is less than 2%
Est. Corn Acres where slope is 2% to 5%
Est. Corn Stover Tons Available for Removal where slope is less than 2%
Est. Corn Stover Tons Available for Removal where slope is 2% to 5%
0 to 5 633 665 1,028 5405 to 10 2,286 1,423 3,719 1,16910 to 15 2,905 2,293 4,921 1,95915 to 20 3,535 3,046 5,975 2,63720 to 25 4,592 5,239 7,910 4,53125 to 30 12,349 8,995 21,342 7,74130 to 35 16,439 12,137 27,880 10,25835 to 40 14,970 15,053 24,993 12,45440 to 45 18,806 20,576 31,186 16,89245 to 50 20,897 20,543 35,003 16,720
Total 97,412 89,970 163,957 74,901
23
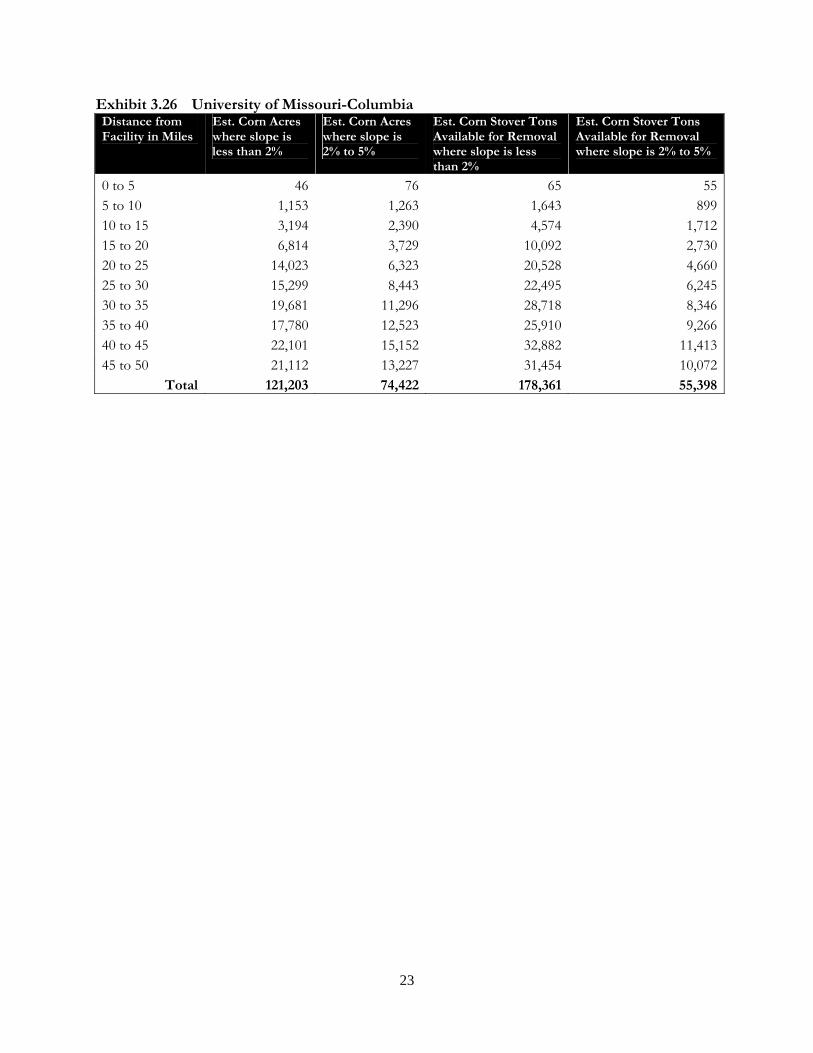
Exhibit 3.26 University of Missouri-Columbia Distance from Facility in Miles
Est. Corn Acres where slope is less than 2%
Est. Corn Acres where slope is 2% to 5%
Est. Corn Stover Tons Available for Removal where slope is less than 2%
Est. Corn Stover Tons Available for Removal where slope is 2% to 5%
0 to 5 46 76 65 555 to 10 1,153 1,263 1,643 89910 to 15 3,194 2,390 4,574 1,71215 to 20 6,814 3,729 10,092 2,73020 to 25 14,023 6,323 20,528 4,66025 to 30 15,299 8,443 22,495 6,24530 to 35 19,681 11,296 28,718 8,34635 to 40 17,780 12,523 25,910 9,26640 to 45 22,101 15,152 32,882 11,41345 to 50 21,112 13,227 31,454 10,072
Total 121,203 74,422 178,361 55,398
24
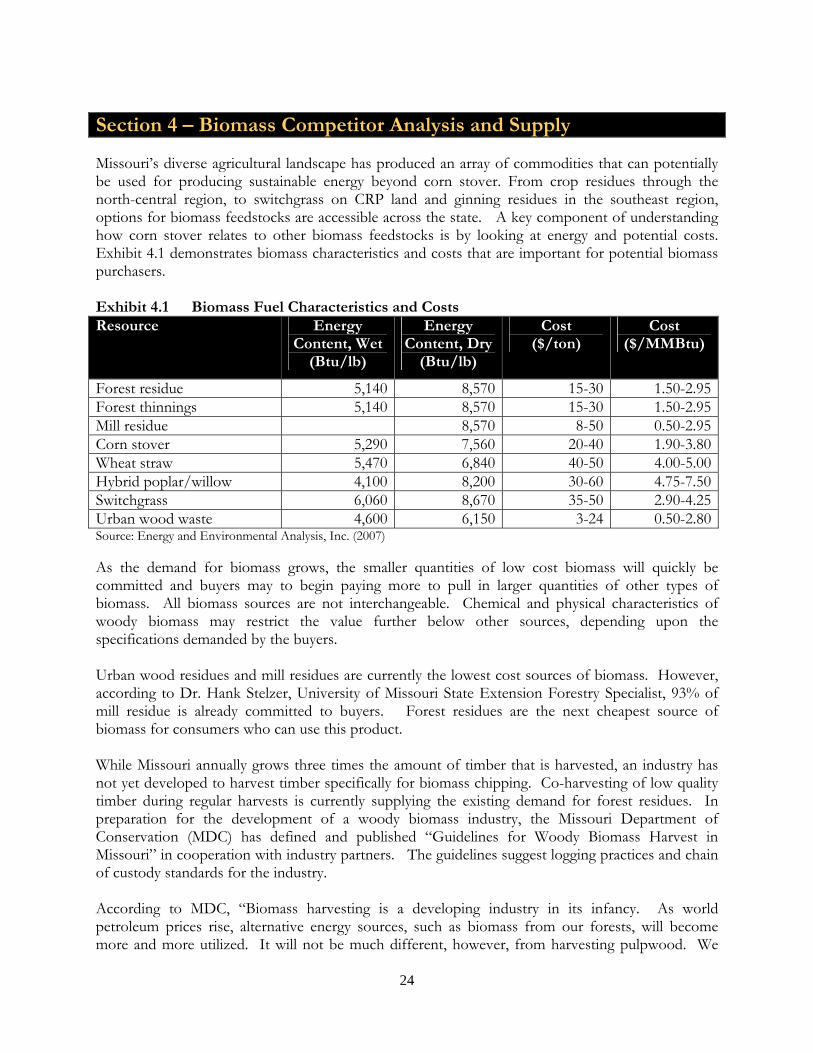
Section 4 – Biomass Competitor Analysis and Supply Missouri’s diverse agricultural landscape has produced an array of commodities that can potentially be used for producing sustainable energy beyond corn stover. From crop residues through the north-central region, to switchgrass on CRP land and ginning residues in the southeast region, options for biomass feedstocks are accessible across the state. A key component of understanding how corn stover relates to other biomass feedstocks is by looking at energy and potential costs. Exhibit 4.1 demonstrates biomass characteristics and costs that are important for potential biomass purchasers. Exhibit 4.1 Biomass Fuel Characteristics and Costs Resource Energy
Content, Wet (Btu/lb)
Energy Content, Dry
(Btu/lb)
Cost ($/ton)
Cost ($/MMBtu)
Forest residue 5,140 8,570 15-30 1.50-2.95Forest thinnings 5,140 8,570 15-30 1.50-2.95Mill residue 8,570 8-50 0.50-2.95Corn stover 5,290 7,560 20-40 1.90-3.80Wheat straw 5,470 6,840 40-50 4.00-5.00Hybrid poplar/willow 4,100 8,200 30-60 4.75-7.50Switchgrass 6,060 8,670 35-50 2.90-4.25Urban wood waste 4,600 6,150 3-24 0.50-2.80Source: Energy and Environmental Analysis, Inc. (2007) As the demand for biomass grows, the smaller quantities of low cost biomass will quickly be committed and buyers may to begin paying more to pull in larger quantities of other types of biomass. All biomass sources are not interchangeable. Chemical and physical characteristics of woody biomass may restrict the value further below other sources, depending upon the specifications demanded by the buyers. Urban wood residues and mill residues are currently the lowest cost sources of biomass. However, according to Dr. Hank Stelzer, University of Missouri State Extension Forestry Specialist, 93% of mill residue is already committed to buyers. Forest residues are the next cheapest source of biomass for consumers who can use this product. While Missouri annually grows three times the amount of timber that is harvested, an industry has not yet developed to harvest timber specifically for biomass chipping. Co-harvesting of low quality timber during regular harvests is currently supplying the existing demand for forest residues. In preparation for the development of a woody biomass industry, the Missouri Department of Conservation (MDC) has defined and published “Guidelines for Woody Biomass Harvest in Missouri” in cooperation with industry partners. The guidelines suggest logging practices and chain of custody standards for the industry. According to MDC, “Biomass harvesting is a developing industry in its infancy. As world petroleum prices rise, alternative energy sources, such as biomass from our forests, will become more and more utilized. It will not be much different, however, from harvesting pulpwood. We
25
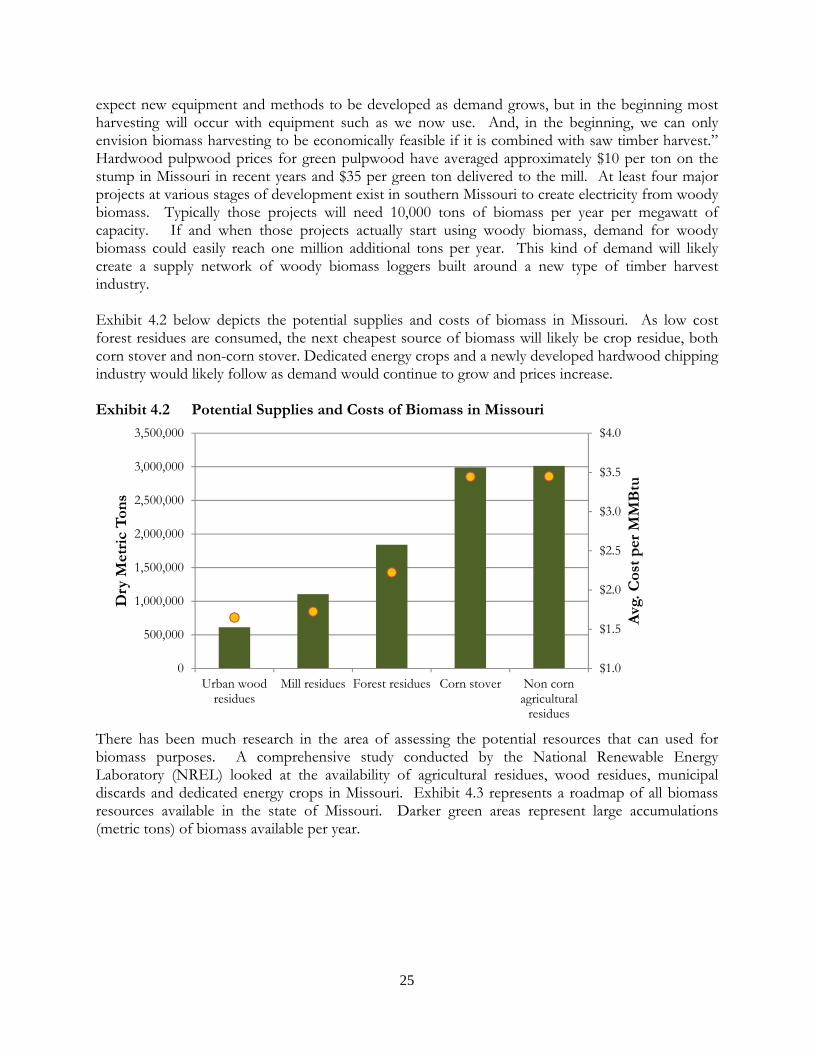
expect new equipment and methods to be developed as demand grows, but in the beginning most harvesting will occur with equipment such as we now use. And, in the beginning, we can only envision biomass harvesting to be economically feasible if it is combined with saw timber harvest.” Hardwood pulpwood prices for green pulpwood have averaged approximately $10 per ton on the stump in Missouri in recent years and $35 per green ton delivered to the mill. At least four major projects at various stages of development exist in southern Missouri to create electricity from woody biomass. Typically those projects will need 10,000 tons of biomass per year per megawatt of capacity. If and when those projects actually start using woody biomass, demand for woody biomass could easily reach one million additional tons per year. This kind of demand will likely create a supply network of woody biomass loggers built around a new type of timber harvest industry. Exhibit 4.2 below depicts the potential supplies and costs of biomass in Missouri. As low cost forest residues are consumed, the next cheapest source of biomass will likely be crop residue, both corn stover and non-corn stover. Dedicated energy crops and a newly developed hardwood chipping industry would likely follow as demand would continue to grow and prices increase. Exhibit 4.2 Potential Supplies and Costs of Biomass in Missouri
There has been much research in the area of assessing the potential resources that can used for biomass purposes. A comprehensive study conducted by the National Renewable Energy Laboratory (NREL) looked at the availability of agricultural residues, wood residues, municipal discards and dedicated energy crops in Missouri. Exhibit 4.3 represents a roadmap of all biomass resources available in the state of Missouri. Darker green areas represent large accumulations (metric tons) of biomass available per year.
$1.0
$1.5
$2.0
$2.5
$3.0
$3.5
$4.0
0
500,000
1,000,000
1,500,000
2,000,000
2,500,000
3,000,000
3,500,000
Urban woodresidues
Mill residues Forest residues Corn stover Non cornagricultural
residues
Avg
. Cos
t p
er M
MB
tu
Dry
Met
ric
Ton
s
26
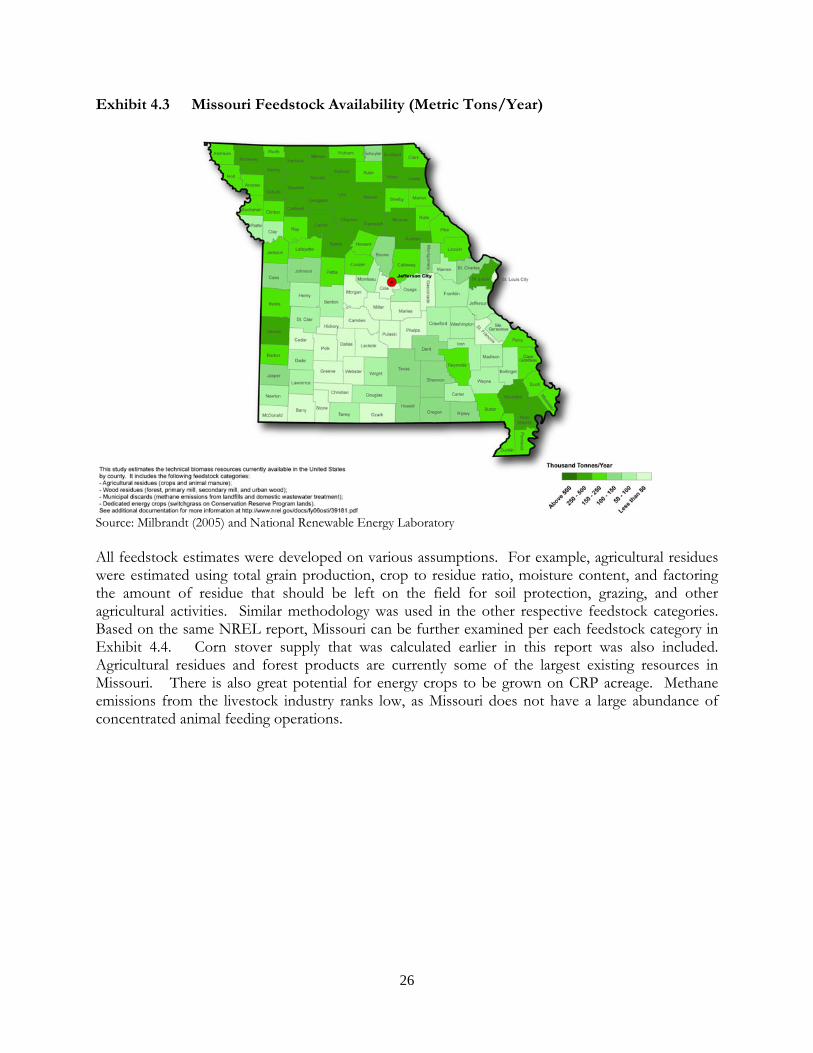
Exhibit 4.3 Missouri Feedstock Availability (Metric Tons/Year)
Source: Milbrandt (2005) and National Renewable Energy Laboratory All feedstock estimates were developed on various assumptions. For example, agricultural residues were estimated using total grain production, crop to residue ratio, moisture content, and factoring the amount of residue that should be left on the field for soil protection, grazing, and other agricultural activities. Similar methodology was used in the other respective feedstock categories. Based on the same NREL report, Missouri can be further examined per each feedstock category in Exhibit 4.4. Corn stover supply that was calculated earlier in this report was also included. Agricultural residues and forest products are currently some of the largest existing resources in Missouri. There is also great potential for energy crops to be grown on CRP acreage. Methane emissions from the livestock industry ranks low, as Missouri does not have a large abundance of concentrated animal feeding operations.
27
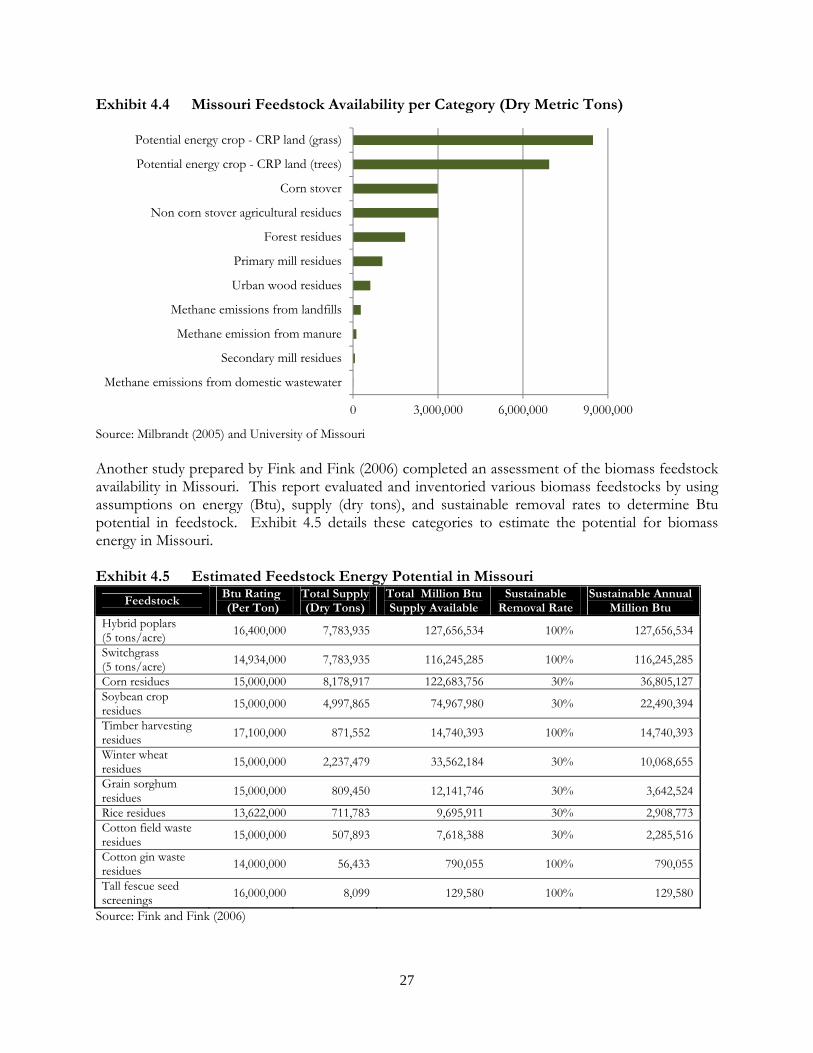
Exhibit 4.4 Missouri Feedstock Availability per Category (Dry Metric Tons)
Source: Milbrandt (2005) and University of Missouri Another study prepared by Fink and Fink (2006) completed an assessment of the biomass feedstock availability in Missouri. This report evaluated and inventoried various biomass feedstocks by using assumptions on energy (Btu), supply (dry tons), and sustainable removal rates to determine Btu potential in feedstock. Exhibit 4.5 details these categories to estimate the potential for biomass energy in Missouri. Exhibit 4.5 Estimated Feedstock Energy Potential in Missouri
Feedstock Btu Rating (Per Ton)
Total Supply (Dry Tons)
Total Million Btu Supply Available
Sustainable Removal Rate
Sustainable Annual Million Btu
Hybrid poplars (5 tons/acre)
16,400,000 7,783,935 127,656,534 100% 127,656,534
Switchgrass (5 tons/acre)
14,934,000 7,783,935 116,245,285 100% 116,245,285
Corn residues 15,000,000 8,178,917 122,683,756 30% 36,805,127 Soybean crop residues
15,000,000 4,997,865 74,967,980 30% 22,490,394
Timber harvesting residues
17,100,000 871,552 14,740,393 100% 14,740,393
Winter wheat residues
15,000,000 2,237,479 33,562,184 30% 10,068,655
Grain sorghum residues
15,000,000 809,450 12,141,746 30% 3,642,524
Rice residues 13,622,000 711,783 9,695,911 30% 2,908,773 Cotton field waste residues
15,000,000 507,893 7,618,388 30% 2,285,516
Cotton gin waste residues
14,000,000 56,433 790,055 100% 790,055
Tall fescue seed screenings
16,000,000 8,099 129,580 100% 129,580
Source: Fink and Fink (2006)
0 3,000,000 6,000,000 9,000,000
Methane emissions from domestic wastewater
Secondary mill residues
Methane emission from manure
Methane emissions from landfills
Urban wood residues
Primary mill residues
Forest residues
Non corn stover agricultural residues
Corn stover
Potential energy crop - CRP land (trees)
Potential energy crop - CRP land (grass)
28
The following sections provide a summarized analysis of Missouri biomass according to Finks’ study. Corn Residues Collection of corn residues as a potential feedstock has been shown to be feasible throughout most of Missouri. Areas of the state that have high corn production and relatively low erosion include much of the flood plains along the Missouri and Mississippi rivers, as well as in the southeast region of the state where erosion is of low environmental impact. In these areas, wind erosion may be an issue, prompting careful collection methods to preserve the integrity of the soil. Soybean Crop Residues Soybean crop residue is simply the bean stalks that are left after soybean harvest. The ratio of straw to grain used to calculate the residue available after harvest was 1:1 (straw to grain), leaving sixty pounds of residue per bushel. Soybean crop residue can potentially account for seven percent of the total sustainable feedstocks in Missouri. Winter Wheat Residues Winter wheat residues are produced similarly to soybean crop residues. One limiting factor in the use of winter wheat residues is the use of wheat straw as cattle feed and use by other industries such as landscaping and gardening as a weed deterrent. This study assumes that collection of winter wheat residues will be primarily used as a biomass feedstock, representing three percent of the annual supply available. Grain Sorghum Residues Grain sorghum residues are produced as a co-product of harvesting in the same fashion as soybean harvesting. The stalks produced by harvest have not been used as a commodity to be manufactured into a marketable product; however, sorghum has experienced a recent increase in use for ethanol production. The Btu rating of grain sorghum is calculated based on corn residue formulas and represents only one percent of the total biomass feedstocks available in Missouri. Rice Residues The rice residue calculation involved a 1.7:1 ratio for residue produced compared to yield. With sixty pounds per bushel and the residue ratio, rice producers in the southeast portion of the state produce approximately 700 thousand tons of residues each year. Cotton Field Waste Residues Traditionally, cotton gin field residues have not had any residual market value. Use of field waste as a biomass feedstock can add value for cotton farmers in the southeast region of Missouri. As with other crops, cotton field waste residues are a source of nutrients for the next season’s crop. Cotton Gin Waste Residues Cotton gin waste residues have been an operating cost for gins in the southeast region, not a source of additional income. Due to the residue being produced out of the field and at a gin, 100% of the residues would be available to be used for energy. Ginners have had to traditionally dispose of the waste themselves or pay to have the waste disposed of in the past. Using the waste as a feedstock has the potential to reduce costs for ginners and even provide a source of additional income.
29
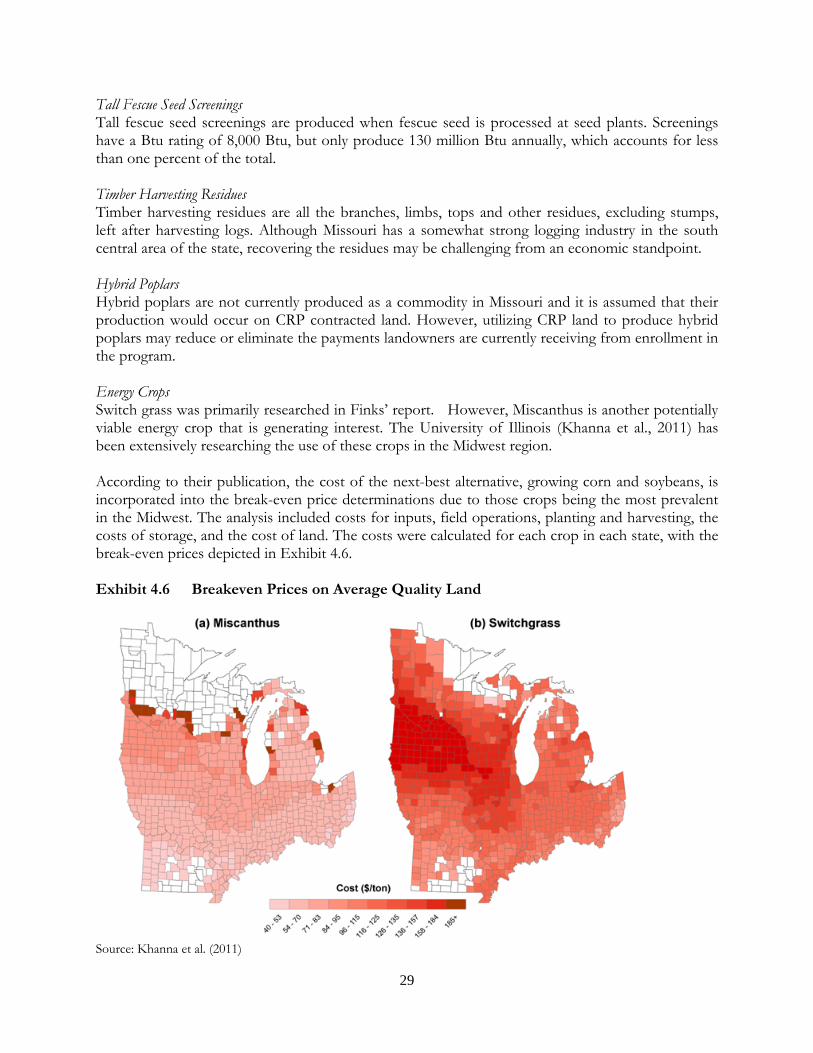
Tall Fescue Seed Screenings Tall fescue seed screenings are produced when fescue seed is processed at seed plants. Screenings have a Btu rating of 8,000 Btu, but only produce 130 million Btu annually, which accounts for less than one percent of the total. Timber Harvesting Residues Timber harvesting residues are all the branches, limbs, tops and other residues, excluding stumps, left after harvesting logs. Although Missouri has a somewhat strong logging industry in the south central area of the state, recovering the residues may be challenging from an economic standpoint. Hybrid Poplars Hybrid poplars are not currently produced as a commodity in Missouri and it is assumed that their production would occur on CRP contracted land. However, utilizing CRP land to produce hybrid poplars may reduce or eliminate the payments landowners are currently receiving from enrollment in the program. Energy Crops Switch grass was primarily researched in Finks’ report. However, Miscanthus is another potentially viable energy crop that is generating interest. The University of Illinois (Khanna et al., 2011) has been extensively researching the use of these crops in the Midwest region. According to their publication, the cost of the next-best alternative, growing corn and soybeans, is incorporated into the break-even price determinations due to those crops being the most prevalent in the Midwest. The analysis included costs for inputs, field operations, planting and harvesting, the costs of storage, and the cost of land. The costs were calculated for each crop in each state, with the break-even prices depicted in Exhibit 4.6. Exhibit 4.6 Breakeven Prices on Average Quality Land
Source: Khanna et al. (2011)
30
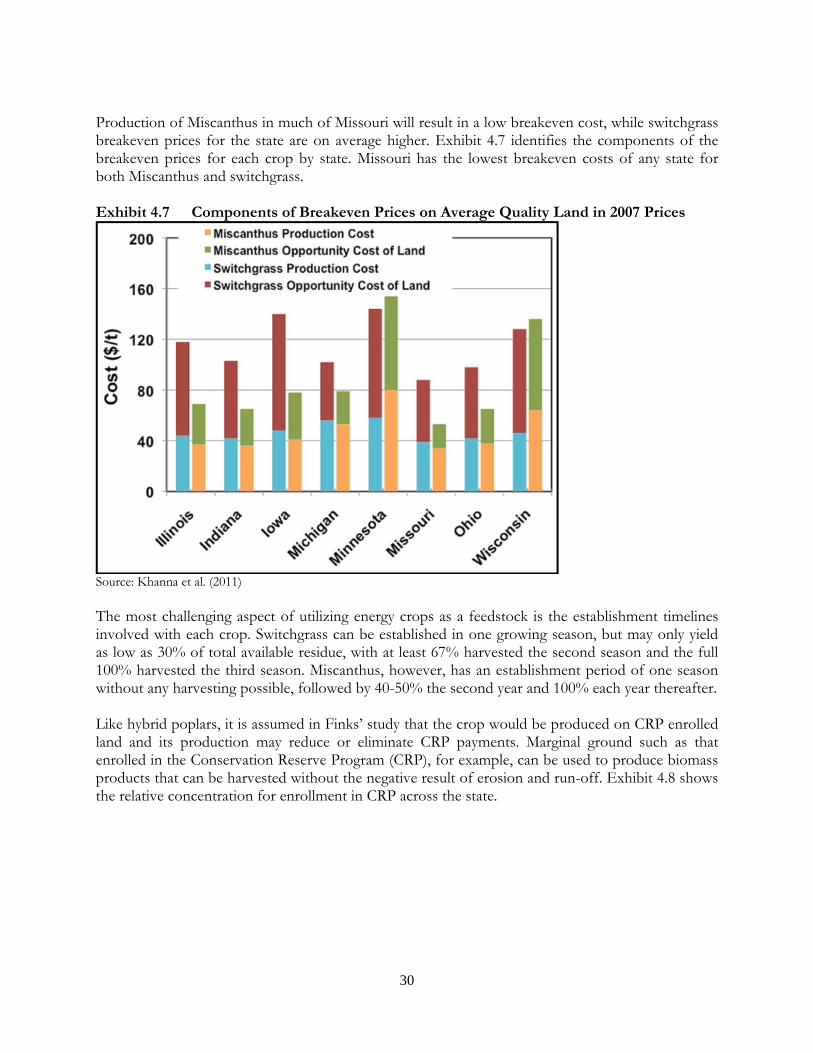
Production of Miscanthus in much of Missouri will result in a low breakeven cost, while switchgrass breakeven prices for the state are on average higher. Exhibit 4.7 identifies the components of the breakeven prices for each crop by state. Missouri has the lowest breakeven costs of any state for both Miscanthus and switchgrass. Exhibit 4.7 Components of Breakeven Prices on Average Quality Land in 2007 Prices
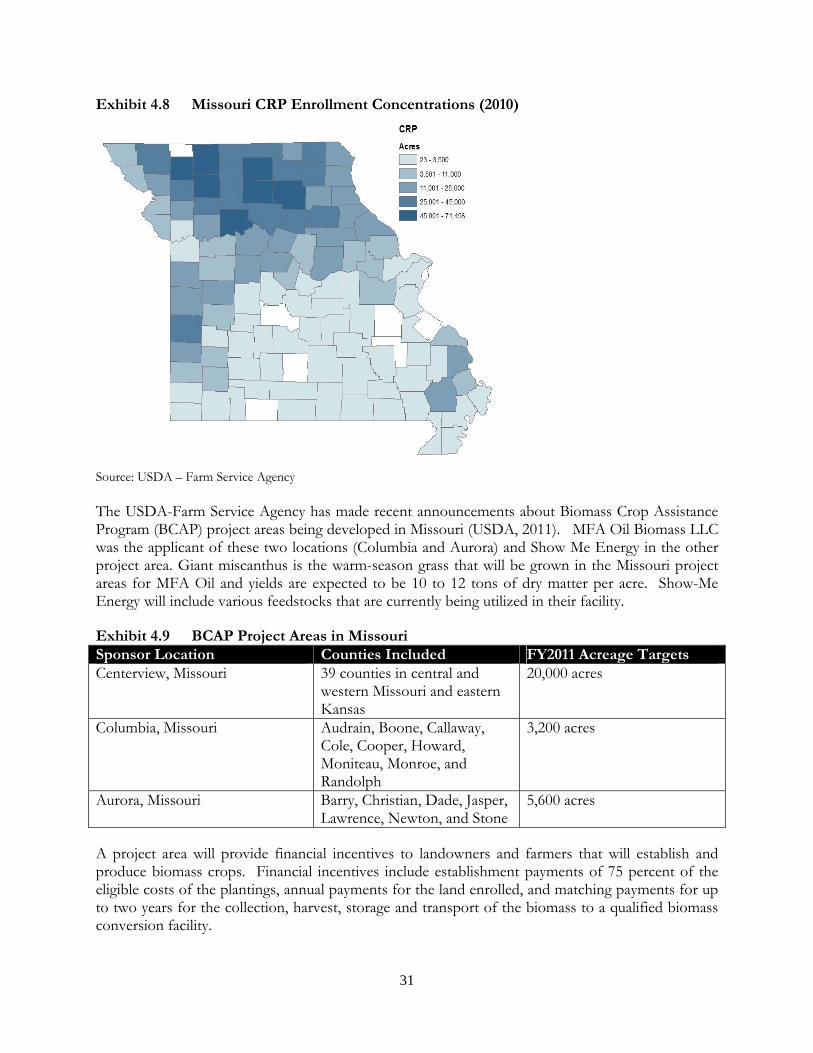
Source: Khanna et al. (2011) The most challenging aspect of utilizing energy crops as a feedstock is the establishment timelines involved with each crop. Switchgrass can be established in one growing season, but may only yield as low as 30% of total available residue, with at least 67% harvested the second season and the full 100% harvested the third season. Miscanthus, however, has an establishment period of one season without any harvesting possible, followed by 40-50% the second year and 100% each year thereafter. Like hybrid poplars, it is assumed in Finks’ study that the crop would be produced on CRP enrolled land and its production may reduce or eliminate CRP payments. Marginal ground such as that enrolled in the Conservation Reserve Program (CRP), for example, can be used to produce biomass products that can be harvested without the negative result of erosion and run-off. Exhibit 4.8 shows the relative concentration for enrollment in CRP across the state.
31
Exhibit 4.8 Missouri CRP Enrollment Concentrations (2010)
Source: USDA – Farm Service Agency The USDA-Farm Service Agency has made recent announcements about Biomass Crop Assistance Program (BCAP) project areas being developed in Missouri (USDA, 2011). MFA Oil Biomass LLC was the applicant of these two locations (Columbia and Aurora) and Show Me Energy in the other project area. Giant miscanthus is the warm-season grass that will be grown in the Missouri project areas for MFA Oil and yields are expected to be 10 to 12 tons of dry matter per acre. Show-Me Energy will include various feedstocks that are currently being utilized in their facility. Exhibit 4.9 BCAP Project Areas in Missouri Sponsor Location Counties Included FY2011 Acreage Targets Centerview, Missouri 39 counties in central and
western Missouri and eastern Kansas
20,000 acres
Columbia, Missouri Audrain, Boone, Callaway, Cole, Cooper, Howard, Moniteau, Monroe, and Randolph
3,200 acres
Aurora, Missouri Barry, Christian, Dade, Jasper, Lawrence, Newton, and Stone
5,600 acres
A project area will provide financial incentives to landowners and farmers that will establish and produce biomass crops. Financial incentives include establishment payments of 75 percent of the eligible costs of the plantings, annual payments for the land enrolled, and matching payments for up to two years for the collection, harvest, storage and transport of the biomass to a qualified biomass conversion facility.
32
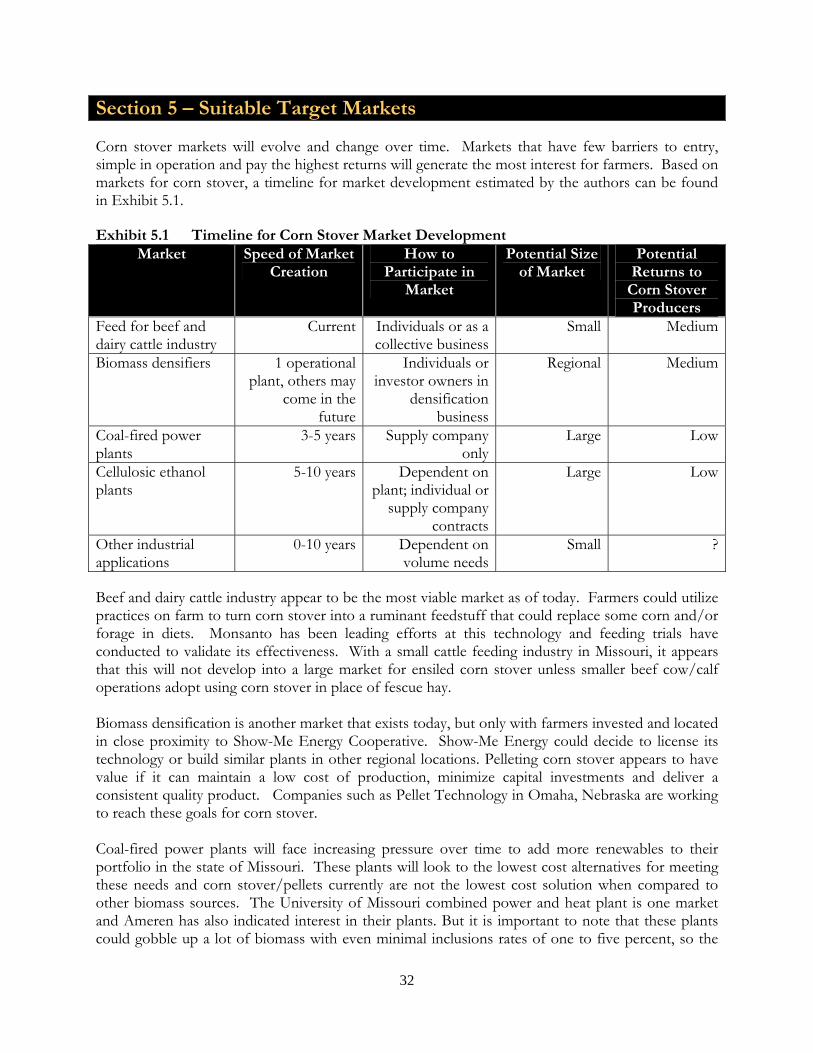
Section 5 – Suitable Target Markets Corn stover markets will evolve and change over time. Markets that have few barriers to entry, simple in operation and pay the highest returns will generate the most interest for farmers. Based on markets for corn stover, a timeline for market development estimated by the authors can be found in Exhibit 5.1. Exhibit 5.1 Timeline for Corn Stover Market Development
Market Speed of Market Creation
How to Participate in
Market
Potential Size of Market
Potential Returns to
Corn Stover Producers
Feed for beef and dairy cattle industry
Current Individuals or as a collective business
Small Medium
Biomass densifiers 1 operational plant, others may
come in the future
Individuals or investor owners in
densification business
Regional Medium
Coal-fired power plants
3-5 years Supply company only
Large Low
Cellulosic ethanol plants
5-10 years Dependent on plant; individual or
supply company contracts
Large Low
Other industrial applications
0-10 years Dependent on volume needs
Small ?
Beef and dairy cattle industry appear to be the most viable market as of today. Farmers could utilize practices on farm to turn corn stover into a ruminant feedstuff that could replace some corn and/or forage in diets. Monsanto has been leading efforts at this technology and feeding trials have conducted to validate its effectiveness. With a small cattle feeding industry in Missouri, it appears that this will not develop into a large market for ensiled corn stover unless smaller beef cow/calf operations adopt using corn stover in place of fescue hay. Biomass densification is another market that exists today, but only with farmers invested and located in close proximity to Show-Me Energy Cooperative. Show-Me Energy could decide to license its technology or build similar plants in other regional locations. Pelleting corn stover appears to have value if it can maintain a low cost of production, minimize capital investments and deliver a consistent quality product. Companies such as Pellet Technology in Omaha, Nebraska are working to reach these goals for corn stover. Coal-fired power plants will face increasing pressure over time to add more renewables to their portfolio in the state of Missouri. These plants will look to the lowest cost alternatives for meeting these needs and corn stover/pellets currently are not the lowest cost solution when compared to other biomass sources. The University of Missouri combined power and heat plant is one market and Ameren has also indicated interest in their plants. But it is important to note that these plants could gobble up a lot of biomass with even minimal inclusions rates of one to five percent, so the
33
corn stover market could develop quickly if prices reach a satisfactory point for farmers to sell. A key driver in this market evolving is that plants will want a credible market supplier to handle all of the procurement, storage, transportation and quality control of corn stover and other biomass feedstocks. To minimize risk, they will seek the establishment of a long term contract to mitigate any feed and handling investments that a plant will make for biomass feedstocks. Developing an integrated supply chain network is not an easy task and will take diligent work with farmers and strong businesses to create an efficient and credible one-stop shop for biomass. The cellulosic industry is evolving as many companies are investigating through demonstration and pilot plants. While two demonstration plants exist in Missouri today, no commercially viable plants are in operation in Missouri or planned in the near future. But there will come a date when a business will most likely decide to set up operations and look at various biomass feedstocks including corn stover to supply its needs. Other industrial applications for using corn stover could develop as well in the future, but it is impossible to predict at this point when, prices, and where they will develop.
34
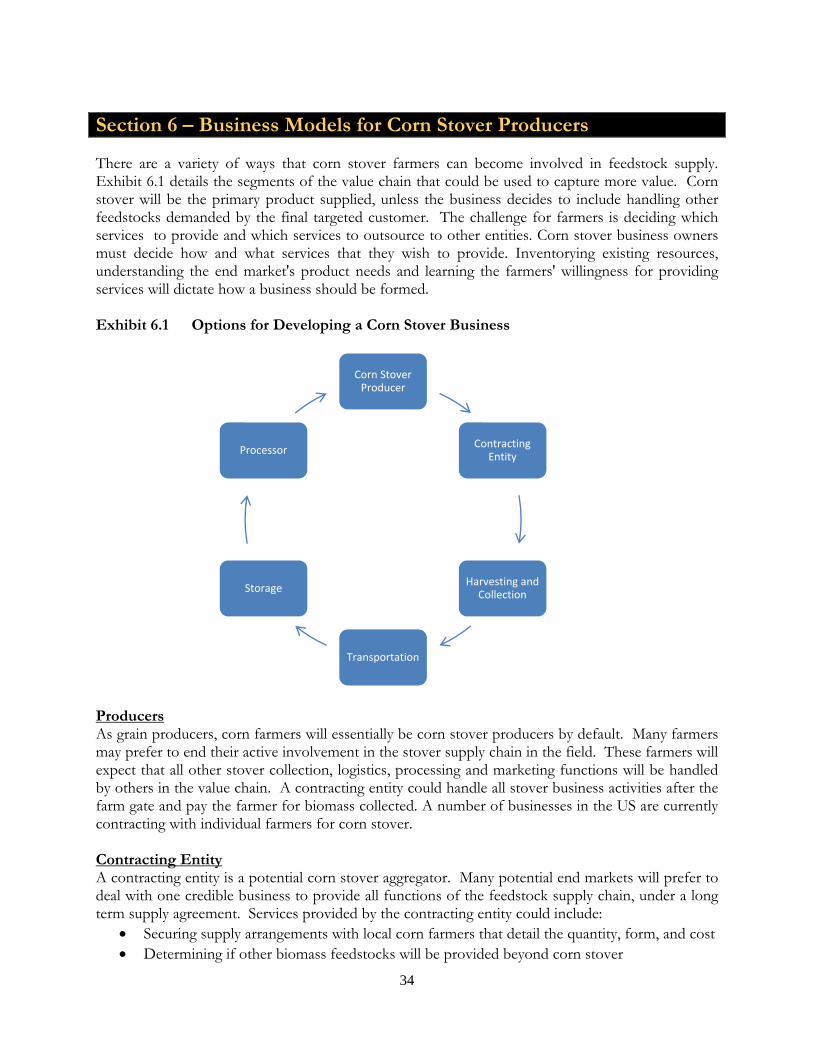
Section 6 – Business Models for Corn Stover Producers There are a variety of ways that corn stover farmers can become involved in feedstock supply. Exhibit 6.1 details the segments of the value chain that could be used to capture more value. Corn stover will be the primary product supplied, unless the business decides to include handling other feedstocks demanded by the final targeted customer. The challenge for farmers is deciding which services to provide and which services to outsource to other entities. Corn stover business owners must decide how and what services that they wish to provide. Inventorying existing resources, understanding the end market's product needs and learning the farmers' willingness for providing services will dictate how a business should be formed. Exhibit 6.1 Options for Developing a Corn Stover Business
Producers As grain producers, corn farmers will essentially be corn stover producers by default. Many farmers may prefer to end their active involvement in the stover supply chain in the field. These farmers will expect that all other stover collection, logistics, processing and marketing functions will be handled by others in the value chain. A contracting entity could handle all stover business activities after the farm gate and pay the farmer for biomass collected. A number of businesses in the US are currently contracting with individual farmers for corn stover. Contracting Entity A contracting entity is a potential corn stover aggregator. Many potential end markets will prefer to deal with one credible business to provide all functions of the feedstock supply chain, under a long term supply agreement. Services provided by the contracting entity could include:
Securing supply arrangements with local corn farmers that detail the quantity, form, and cost Determining if other biomass feedstocks will be provided beyond corn stover
Corn Stover Producer
Contracting Entity
Harvesting and Collection
Transportation
Storage
Processor
35
Arranging for collection and baling of all contracted corn stover Arranging storage- either through an off-field collection site or on-farm Ordering transportation and delivery to the processor or end facility Processing the product (either in house or outsourcing) according to buyer’s specifications
Harvesting and Collection If harvesting or collection is not provided by the supply company, decisions will be needed on whether these functions are provided by the farmer or a custom-hire operator. Existing hay collection equipment and/or trucking units owned by farmers may be suitable for collecting and hauling corn stover. This approach would not require additional purchases, but farmers would need compensation for providing these services. Some producers might decide to "share" some of the equipment and reduce ownership expenses. But the business could prefer to outsource all harvesting and collection to a certain vendor who will provide a consistent. Transportation Logistics are a critical key point in serving an end market. A corn stover business that provides baled corn stover to an end market or pellet facility would need to be within a certain radius of the end market due to the transportation and handling challenges of corn stover. Corn stover densification (i.e. ground/compacted or pelletized) would allow the final product to serve more distant end markets. Options for transportation would include farmers’ providing transportation, contracting entity owning equipment, or outsourcing to a local transportation company. Storage Unless an end market will handle all storage for product after collection, staging areas will be needed for corn stover or other biomass feedstocks. One option is to store the corn stover at the producer’s farm until it is needed by the plant. The producer must allocate space for corn stover storage and provide all-weather access to the stover storage area. The producer would also responsible for maintaining stover quality and be provided compensation for storage costs. Another stover storage solution is to transport the corn stover to a central or intermediate storage location. Increased costs are incurred when corn stover is stored at a central location because of the additional handling. However, these additional storage costs may be offset if transportation is more convenient for either or both the producer and the plant. Processor End markets will dictate the needs of processing corn stover. They may want a pelleted product, densified corn stover or baled corn stover. Once a market is designated to supply, decisions have to be made whether these processing functions are provided or outsourced to a local facility. Densification equipment represents a significant capital investment so careful analysis should be mandatory before agreeing to a long term agreement with an end market. Farmer Business Models (or combinations of each)
Corn Stover Producer Only Corn Stover Producer that Provides Collection, Handling, Storage and/or Transportation Producer-Owned Contracting Entity Producer-Owned Processing Entity
36
Sources Energy and Environmental Analysis, Inc. (2007). “Biomass Combined Heat and Power Catalog of Technologies”. ICF International Company, and Eastern Research Group, Inc. (ERG) for the U. S. Environmental Protection Agency, Combined Heat and Power Partnership. Fink, R. J. and R. L. Fink. (2006). “An Assessment of Biomass Feedstock Availability in Missouri.” Prepared for University of Missouri and Missouri Department of Natural Resources under Contract No. SEBSRP-SSEB-2004XX-KLP-001. Sponsored by Southern States Energy Board. Food and Agricultural Policy Research Institute (FAPRI). (2010). “2011 Dryland Corn Budget”. University of Misouri. Accessed at http://www.fapri.missouri.edu/farmers_corner/budgets/ July 12, 2011. Khanna, M., A. Jain, and A. Oliver. (2011). “Production of Bioenergy Crops in the Midwest”. Farm Economics: Facts and Opinions, Farm Business Management. Department of Agricultural and Consumer Economics, University of Illinois at Urbana-Champaign. Accessed at http://farmdoc.illinois.edu/manage/newsletters/fefo11_06/fefo11_06.html. July 12, 2011. Milbrandt, A. (2005). “A Geographic Perspective on the Current Biomass Resource Availability in the United States.” National Renewable Energy Laboratory, Golden, Colorado. Sims, B. (2010). “Rethinking Ag Residue.” Biorefining Magazine. Accessed at http://www.biorefiningmagazine.com/articles/150/rethinking-ag-residue November 14, 2010. United States Department of Agriculture (USDA). (2011). Biomass Crop Assistance Program (BCAP) Project Areas 2 through 5”. Farm Service Agency Fact Sheet. Accessed at http://www.fsa.usda.gov/Internet/FSA_File/bcap_areas2_5_2011.pdf. August 2, 2011.