Embed Size (px)
Citation preview

Marketing South Africa in India
May 2012
Slide no. 2 © South African Tourism 2012
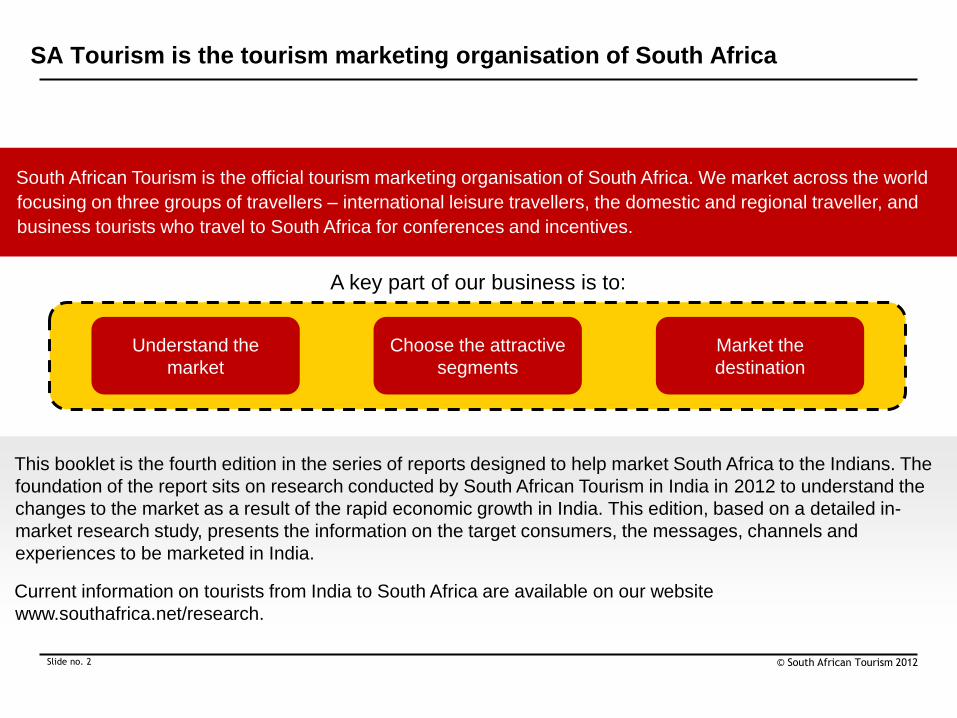
South African Tourism is the official tourism marketing organisation of South Africa. We market across the world
focusing on three groups of travellers – international leisure travellers, the domestic and regional traveller, and
business tourists who travel to South Africa for conferences and incentives.
SA Tourism is the tourism marketing organisation of South Africa
Understand the
market
Choose the attractive
segments
Market the
destination
This booklet is the fourth edition in the series of reports designed to help market South Africa to the Indians. The
foundation of the report sits on research conducted by South African Tourism in India in 2012 to understand the
changes to the market as a result of the rapid economic growth in India. This edition, based on a detailed in-
market research study, presents the information on the target consumers, the messages, channels and
experiences to be marketed in India.
Current information on tourists from India to South Africa are available on our website
www.southafrica.net/research.
A key part of our business is to:

3 | Copyright © 2012 SA Tourism
Table of Contents
Political and Economic Environment
Consumer Landscape
Travel and Tourism Landscape
Outbound Travel
Travel to South Africa
Consumer Segmentation
Messages, Channels and Experiences

4 | Copyright © 2012 SA Tourism
Political and Economic Environment
Country Overview
India is the second most populous country in the world, with a population of 1.19 billion people in 2010
Demographics (2010)
Area: 3,287,263 sq km
Capital: New Delhi
Population: 1.19 bn
Population CAGR (2001–2010): 1.51%
Population Birth Rate: 20.97 births per 1,000
Population Death rate: 7.48 deaths per 1,000
Life Expectancy at Birth (Male): 65.77 years
Life Expectancy at Birth (Female): 67.95 years
Languages: Hindi is the most widely spoken language and
primary tongue of ~40% of the population; English enjoys
the status of subsidiary official language but is the most
important language for national, political, and commercial
communication; there are 14 other official languages
Key Economic Indicators (2010)
Currency: Indian Rupee (INR)
GDP at Current Prices: USD 1,631.97 bn
GDP (PPP): Current International Dollar 3,408.40 bn
GDP per Capita (Current Prices): USD 1,370.8
Unemployment (2008 / 2009): 9.4% of the labour force
Delhi
Jammu
&
Kashmir
Himachal
Pradesh
Punjab Uttaranchal
Haryana
Rajasthan Uttar
Pradesh
Bihar
Arunachal
Pradesh
Assam
Meghalaya
Tripura
Nagaland
Manipur
Mizoram West
Bengal
Jharkand
Chhattisgarh
Orissa
Madhya Pradesh Gujarat
Maharashtra
Andhra
Pradesh
Tamil
Nadu
Karnataka
Kerala
Goa
Andaman &
Nicobar Islands Lakshadweep
Sikkim
Source: Monitor and Grail Research and Analysis; CIA-The World Factbook; IMF; ‘Report On Employment & Unemployment Survey (2009–10)’, Ministry
of Labour and Employment, Government of India
5 | Copyright © 2012 SA Tourism
Political and Economic Environment
Economic Overview
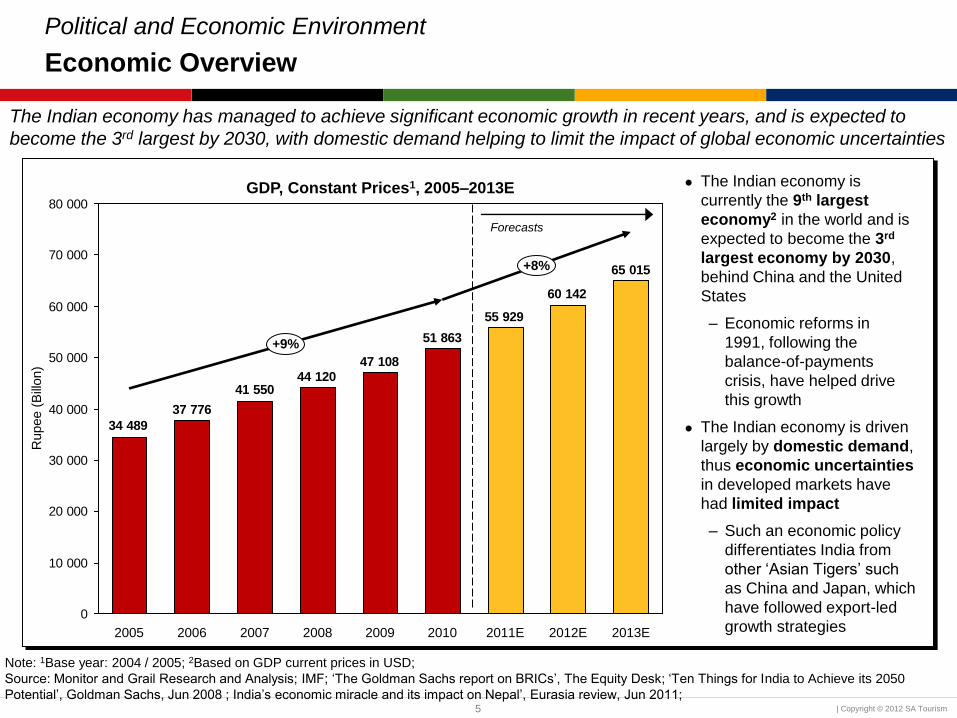
The Indian economy has managed to achieve significant economic growth in recent years, and is expected to
become the 3rd largest by 2030, with domestic demand helping to limit the impact of global economic uncertainties
65 015
60 142
55 929
51 863
47 10844 120
41 550
37 776
34 489
0
10 000
20 000
30 000
40 000
50 000
60 000
70 000
80 000
+8%
+9%
2013E 2012E 2011E 2010 2009 2008 2007 2006 2005
Forecasts
The Indian economy is
currently the 9th largest
economy2 in the world and is
expected to become the 3rd
largest economy by 2030,
behind China and the United
States
– Economic reforms in
1991, following the
balance-of-payments
crisis, have helped drive
this growth
The Indian economy is driven
largely by domestic demand,
thus economic uncertainties
in developed markets have
had limited impact
– Such an economic policy
differentiates India from
other ‘Asian Tigers’ such
as China and Japan, which
have followed export-led
growth strategies
Rupee (
Bill
on)
GDP, Constant Prices1, 2005–2013E
Note: 1Base year: 2004 / 2005; 2Based on GDP current prices in USD;
Source: Monitor and Grail Research and Analysis; IMF; ‘The Goldman Sachs report on BRICs’, The Equity Desk; ‘Ten Things for India to Achieve its 2050
Potential’, Goldman Sachs, Jun 2008 ; India’s economic miracle and its impact on Nepal’, Eurasia review, Jun 2011;

6 | Copyright © 2012 SA Tourism
Political and Economic Environment
Sector Contribution to GDP
The services sector, which contributes ~55% of total GDP output, has played a major role in driving this
economic growth
Key Sector Outlook
Agricultural
Sector
Sector Share of GDP Output1,
2001 vs. 2009
Perc
ent G
DP
Contr
ibution
15%17%
6%
8%
23%17%
Other
Activities2
Wholesale,
Retail Trade,
Restaurants,
Hotels
Transport,
Storage,
Communication
Mining,
Manufacturing,
Utilities
Construction
Agriculture,
Hunting,
Forestry,
Fishing
2009
30%
8%
20%
2001
29%
8%
20%
The contribution of agriculture to GDP has
been steadily declining, despite employing
~60% of the country’s workforce Agricultural
Sector
Industrial
Sector
Services
Sector
“Increasing agricultural growth is critical not
only for India to sustain high growth rates, but also to move millions out of poverty”
- Goldman Sachs, Jun 2008
Services
Sector
The contribution of the services sector is
extremely important to the Indian economy:
– Significant driver of the overall
economic growth
– Provides employment for ~25% of the
workforce
– Accounts for more than one-third of
total exports
India has managed to achieve a global
brand identity in the software service sector
Note: 1Sector share may be more than 100% due to rounding errors; 2Other activities include financing, insurance, real estate and business services
Source: Monitor and Grail Research and Analysis; United Nations Statistics Division; India Outlook 2011, Part 1: Agriculture, Industry and Services’,
Seeking Alpha, Jan 2011; ‘Economic Survey’ Indian Ministry of Finance, 2011; ‘Ten Things for India to Achieve its 2050 Potential’, Goldman Sachs, Jun 2008

7 | Copyright © 2012 SA Tourism
Table of Contents
Political and Economic Environment
Consumer Landscape
Travel and Tourism Landscape
Outbound Travel
Travel to South Africa
Consumer Segmentation
Messages, Channels and Experiences

8 | Copyright © 2012 SA Tourism
Consumer Background
Population Overview
India is the second most populous country in the world, with a population of 1.2 billion people
Male
Female
2010
52%
48%
Mill
ion P
ers
ons
Population, 2001–2010
Population by
Gender, 2010
1.5%
2010
1,191
2009
1,174
2008
1,158
1,142
2006
1,126
2005 2001
1,093
1,076
2007 2004
1,060
2002
1,110
2003
1,044
India, with a population of
1.2 bn, is currently the
2nd most populous country
in the world
– India is expected to
overtake China by 2025
to become the most
populous country in the
world
The two main religions in
India are Hinduism and
Islam
– Hinduism constitutes
80.5% of the population,
Islam constitutes 13.4%,
with other religions such
as Christianity and
Sikhism constituting the
remainder
– The Hindu population is
divided into different caste
groups practicing different
forms of Hinduism
Source: Monitor and Grail Research and Analysis; IMF; U.S. Census Bureau; Ministry of Home Affairs, Government of India; ‘We’re seven billion now’,
The Hindu, Oct 2011; ‘A political introduction to India’, ‘A Political Introduction to India’, House of Commons Library Research Paper, 2007

9 | Copyright © 2012 SA Tourism
0–19 group
transitioning to
economically
active groups
Consumer Background
Workforce
Demographic Distribution by Age, 2000 / 2010E / 2020E
Popula
tion, %
of T
ota
l
Economically Active
Labour Force
0–19
20–29
30–39
40–49
50–59
60+
43.5%
39.5%
35.1%
18.0%
17.3%
16.9%
14.2%
15.1%
15.0%
10.2%
11.7%
13.0%
7.1%
8.1%
9.8%
7.0%
8.2%
10.2%
“India’s powerful demographic
advantage drives a superior [economic] growth profile”
- Goldman Sachs Asset
Management, June 2010
India’s working-age population, as
a percentage of the total population,
is expected to continue to grow over
the coming decades and peak
significantly later (~2025) than in
other countries
– An increasing proportion of
working age population typically
means fewer younger and older
dependents and thus greater
disposable income
By 2030, the global labour force is
expected to grow by 300 million
people with India contributing
towards two-thirds of this growth
2000
2010
2020
India’s demographic profile will have economic implications, with the proportion of working age population
expected to increase significantly in the coming decades
Source: Monitor and Grail Research and Analysis; U.S. Census Bureau; ‘India Revisited’, Goldman Sachs Asset Management, Jun 2010

10 | Copyright © 2012 SA Tourism
Consumer Background
Size of Household
Indian households are significantly larger than households in other emerging markets, with extended families
typically either living together or in close proximity
Breakdown of Size of Household of India versus BRICS
Note: 1Nuclear families consist of a mother, father and their children
Source: Monitor and Grail Research and Analysis; India: Census 2001; South Africa: Community Survey 2007; China Yearbook 2000; China Yearbook 2001;
“Household size and demographic dividend in Brazilian housing market”, de Oliveira and Givisiez, 2009; “Families are changing”, OECD, 2011; UN Economic and
Social Development; National Family Health Survey, 2005/6; ‘Indian Society and Ways of Living’, Asia Society; ‘India’, Tourism New Zealand, 2011; ‘A Socio-
Demographic Analysis of the Size and Structure of the Family of India”, Niranjan, Nair and Roy, 2005
2 Persons
1 Person
3 Persons
19%
8%
12%
19%
6 Persons
or More 38%
5 Persons
4%
4 Persons 23%
17%
22%
14%
14%
9%
25%
15%
30%
13%
9%
6%
17%
28%
24%
6%
4%
22%
15%
18%
15%
11%
22%
19%
India (2001) Brazil (2000) China (1999) Russia (2002) South Africa (2002)
The average household size in India (5.3) is significantly greater than in South Africa (3.9),
Brazil (3.7), China (3.4) and Russia (2.8)
– In India, the average size differs by region, with states in the North typically displaying
larger average sizes than those in the South
The average household size of ‘Joint families’ is significantly greater than that of other
family types (e.g., nuclear families1)
– The ‘Joint family’ describes a family arrangement in India whereby the extended family
live together under one roof, with the males all typically blood relatives
– In 1999, joint families represented ~20% of urban households and ~25% of rural households
The proportion of nuclear families1 has increased over the past years, however clusters of
relatives typically remain living in close proximity and have a tradition of visiting frequently
“Indian tourists also
often travel as a family, quite often
either bringing
younger children and teenagers or older members of
the family”
– Tourism New Zealand,
2011

11 | Copyright © 2012 SA Tourism
Consumer Background
Vegetarianism in India
Source: Monitor and Grail Analysis; ‘The Hindu-CNN-IBN State of the Nation Survey’, The Hindu, CNN, IBN, Aug 2006; ‘The Elephant Is Jogging: New
Pressures for Agricultural Reform in India’, United States Department of Agriculture, Feb 2004; ‘Project on Livestock Industrialization,
Trade and Social-Health-Environment Impacts in Developing Countries’, Food and Agricultural Organisation, Jul 2003 ; ‘Passage to India’, United States
Department of Agriculture, 2001; ‘The New Indian Pariahs: Vegetarians’, NPR India, Feb 2012; ‘One man’s meat is simply another’s poisson’, Asian
Conversations Magazine, Jan 2011
42%
Vegetarian Population
Vegetarianism is widespread in India, however the proportion of the population that is vegetarian appears to be
declining
Estimation Range of Vegetarian
Population in India
Perc
enta
ge
20%
Range
Best Estimate
Emerging Trends in Vegetarianism
Vegetarianism in India appears to be
declining with meat consumption rising
on the back of improved income levels
– Consumer studies suggest that of the
non-vegetarian Indian population,
income is more of a limiting factor in
eating meat than personal preference
As income levels and meat consumption
levels continue to rise, more and more
exotic restaurants offering foreign meat
dishes are appearing in India
– These factors have resulted in meat
increasingly being seen as a status
symbol in India
India may well see a decline in its current
vegetarian population, however there will
always be a sizeable portion of the
population that is vegetarian due to
religious considerations
“... in the new
affluent urban India, meat has
become a status
symbol.”
- NPR India, Feb 2012
“Indian society will
have to adjust to the new eating habits, which the
elite are adopting.”
- Asian Conversations
Magazine, Jan 2011
The most recent data available
(2006) estimates the vegetarian
population at 40% of total population

12 | Copyright © 2012 SA Tourism
Consumer Background
Urbanisation
The majority of India’s population reside in rural areas, although the urban population is expected to increase
significantly in the coming decades; large socio-economic differences exist between urban and rural households
Population by Urban / Rural Locations
1995 / 2000 / 2005 / 2010
Popula
tion, %
of T
ota
l
27% 28% 29% 30%
2005
Rural
Urban
2010
70% 71%
2000
72%
1995
73%
Urban Rural
Per Capita Income (2004 / 5) USD 986 USD 364
Expected CAGR: Average
Household Disposable
Income (2005–2025)
5.8% 3.6%
Unemployment Rate (2010) 7.3% 10.1%
Literacy Rate (2001) 72.9% 46.1%
Access to Improved Water
Source (2008) 96% 84%
India’s urbanisation levels remain relatively low
compared to other nations
– Three of the four other BRICS have urbanisation
levels more than double that of India (Brazil 87%,
China 45%, Russia 73%, South Africa 62%)
The Indian government has estimated that the
India’s urban population will double to 611 million
people by 2031
Comparison of Socio-Economic
Factors between Urban and Rural India
Source: Monitor and Grail Research and Analysis; World Bank; ‘Employment and Unemployment Situation Among Social Groups in India, 2004–05’,
National Sample Survey, Ministry of Statistics and Program Implementation, Government of India, 2006; ‘The ‘Bird of Gold’: The Rise of India’s Consumer
Market’, McKinsey&Company, May 2007; ‘Per Capita Income During 2009–10 Rises by 14.5%’, Mar 8, 2011, Times Of India; Census 2001; ‘India in the
Super-Cycle’, Standard Chartered, 2011;
13 | Copyright © 2012 SA Tourism
Legend
Consumer Background
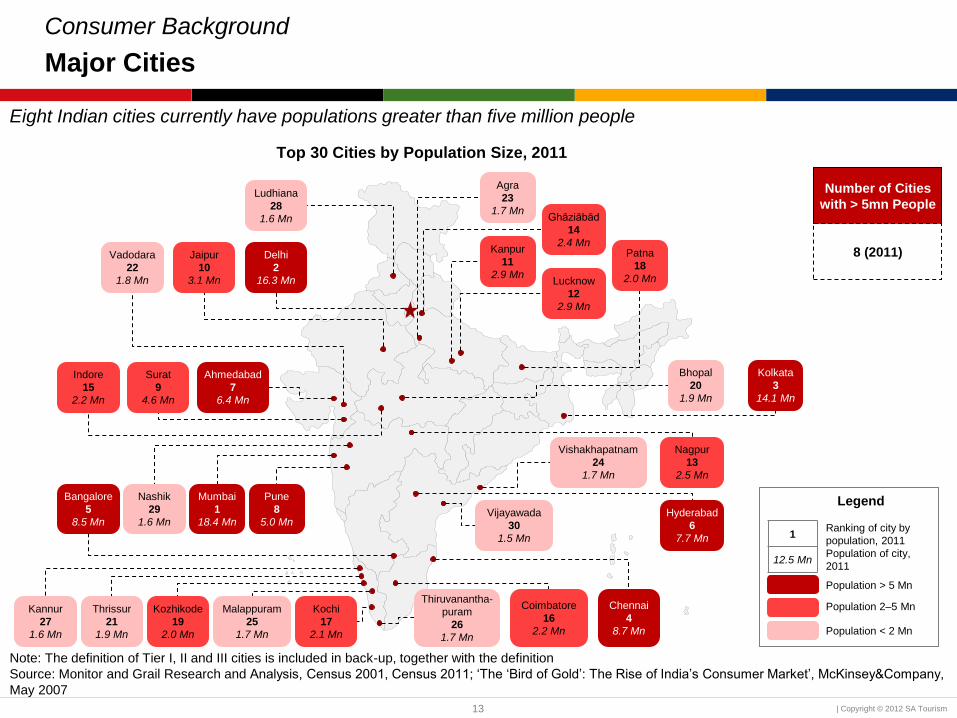
Major Cities
Eight Indian cities currently have populations greater than five million people
Note: The definition of Tier I, II and III cities is included in back-up, together with the definition
Source: Monitor and Grail Research and Analysis, Census 2001, Census 2011; ‘The ‘Bird of Gold’: The Rise of India’s Consumer Market’, McKinsey&Company,
May 2007
1
12.5 Mn
Ranking of city by
population, 2011
Population of city,
2011
Population > 5 Mn
Population 2–5 Mn
Population < 2 Mn
Mumbai
1
18.4 Mn
Delhi
2
16.3 Mn
Kolkata
3
14.1 Mn
Chennai
4
8.7 Mn
Bangalore
5
8.5 Mn Hyderabad
6
7.7 Mn
Ahmedabad
7
6.4 Mn
Pune
8
5.0 Mn
Jaipur
10
3.1 Mn Lucknow
12
2.9 Mn
Kanpur
11
2.9 Mn
Nagpur
13
2.5 Mn
Ghāziābād
14
2.4 Mn
Indore
15
2.2 Mn
Coimbatore
16
2.2 Mn
Kochi
17
2.1 Mn
Patna
18
2.0 Mn
Kozhikode
19
2.0 Mn
Bhopal
20
1.9 Mn
Thrissur
21
1.9 Mn
Vadodara
22
1.8 Mn
Agra
23
1.7 Mn
Vishakhapatnam
24
1.7 Mn
Malappuram
25
1.7 Mn
Thiruvanantha-
puram
26
1.7 Mn
Kannur
27
1.6 Mn
Ludhiana
28
1.6 Mn
Nashik
29
1.6 Mn Vijayawada
30
1.5 Mn
Surat
9
4.6 Mn
Top 30 Cities by Population Size, 2011
Number of Cities
with > 5mn People
8 (2011)

14 | Copyright © 2012 SA Tourism
Growth in Population of Top 30 Cities, 2001–2011
Consumer Background
Major Cities
Seventeen Indian cities are expected to have populations greater than five million people by 2031, with many
tier-two cities in the South and West currently experiencing significant growth
1
2.5%
Legend
Ranking of city by population,
2011
Annualised growth in
population of city, 2001–2011
Growth > 3.5% p.a.
Growth 2.5%–3.5% p.a.
Growth < 2.5% p.a.
Mumbai
1
1.1%
Delhi
2
2.4%
Kolkata
3
0.7%
Chennai
4
2.9%
Bangalore
5
4.1% Hyderabad
6
3.0%
Ahmedabad
7
3.5%
Pune
8
3.0%
Jaipur
10
2.8% Lucknow
12
2.6%
Kanpur
11
0.7%
Nagpur
13
1.6%
Ghaziabad
14
9.3%
Indore
15
3.7%
Coimbatore
16
3.9%
Kochi
17
4.3%1
Patna
18
1.9%
Kozhikode
19
2.5%1
Bhopal
20
2.6%
Thrissur
21
4.2%1
Vadodara
22
2.0%
Agra
23
2.8%
Vishakhapatnam
24
2.5%
Malappuram
25
2.2%1
Thiruvanantha-
puram
26
3.5%1
Kannur
27
5.4%1
Ludhiana
28
1.4%
Nashik
29
3.1% Vijayawada
30
3.7%
Surat
9
5.0%
Number of Cities
with > 5mn People
17 (2031)
Note: 1The definition of urban agglomeration for cities in Kerala was revised for Census 2011, thus the growth rate was calculated for these cities using the population if the
definition had not been revised
Source: Monitor and Grail Research and Analysis; Census 2001; Census 2011; ‘Mumbai is the largest city’ Moneylife, Nov 2011; ‘India’s urbanisation: emerging opportunities’,
Goldman Sachs, Jul 2007

15 | Copyright © 2012 SA Tourism
Consumer Background
Regional Differences
Legend
0.5
1,000
Human Development
Index (2007)
Per Capita Income,
USD (2011)
HDI > 0.5 and Per Capita
Income > USD 1,300
Note: 1Per capita income not available for Delhi; 2Weighted average across the seven federal states
Source: Monitor and Grail Research and Analysis; ‘India Human Development Report 2011: Towards Social Inclusion’, Institute of Applied Manpower
Research, Planning Commission, Government of India; Unidow Financial Intelligence Services
Kerala
0.79
1,279
Goa
0.62
2,868
Punjab
0.61
1,458
Maharashtra
0.57
1,804
Karnataka
0.52
1,292
Gujarat
0.53
1,382
Jammu & Kashmir
0.53
714
Haryana
0.55
1,995
Madhya Pradesh
0.38
589
Rajasthan
0.43
864
Delhi
0.75
N / A1
Himachal Pradesh
0.65
1,264
Uttarkhand
0.49
1,476
Orissa
0.36
798
Tamil Nadu
0.57
1,578
Andhra Pradesh
0.47
1,307
Chhattisgarh
0.36
953
West Bengal
0.49
896
Jharkhand
0.38
644
North East (excl Assam)
0.57
8292
Assam
0.44
657
Bihar
0.37
434 Uttar Pradesh
0.38
563
Regional differences also exist, with Southern and Western states experiencing greater per capita income levels
and displaying higher levels of human development
Human Development Index and Per Capita Income by Federal State, 2007 / 2011
HDI > 0.5 or Per Capita
Income > USD 1,300
HDI < 0.5 and Per Capita
Income < USD 1,300

16 | Copyright © 2012 SA Tourism
Consumer Background
Income
The size of the Indian middle class has increased significantly over the past decade . . .
Proportion of Households by Income Bracket,
2000 / 2005 / 2010
Perc
enta
ge o
f T
ota
l H
ousehold
s
18%
31%
9%
2%
71%
2005
1%
8%
1% 1% 4%
87%
2000
25%
36%
2010
8% USD 25,000-34,999 NA
USD 10,000-24,999
USD 5,000-9,999
CAGR
2000–2010
31.4%
23.4%
USD 3,000-4,999 15.6%
< USD 3,000 -2.6%
# of HH,
2010 (Million)
1.6
18
54.8
68.4
79.5
Annual Income Levels
Note: 1Gini co-efficient data is for 2005
Source: Monitor and Grail Research and Analysis; EIU; World Bank; "Development Indicators 2009”, The Presidency, Republic of South Africa
India displays far lower levels of income inequality than other emerging economies – India’s gini co-efficient1 of 0.37 is lower than that of Brazil (0.56), China (0.42), Russia (0.38) and South Africa (0.68)
> USD 35,000 NA 1.0
17 | Copyright © 2012 SA Tourism
Consumer Background
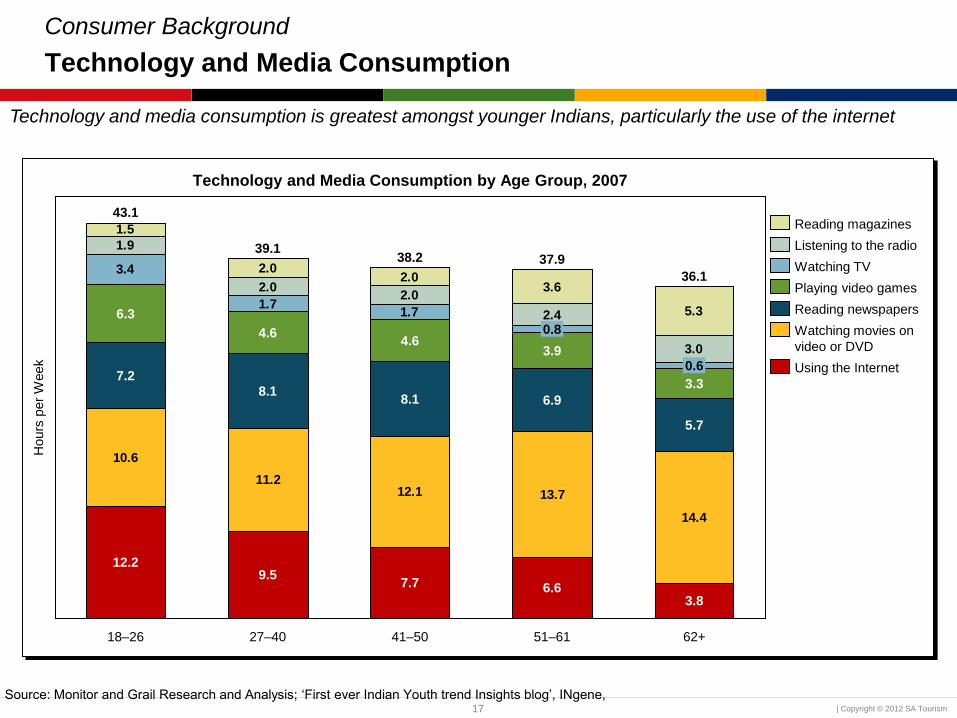
Technology and Media Consumption
Technology and media consumption is greatest amongst younger Indians, particularly the use of the internet
Technology and Media Consumption by Age Group, 2007
10.6
11.212.1 13.7
14.4
3.4
1.71.7
1.9
2.02.0
2.4
3.0
1.5
2.02.0
3.6
5.3
6.9
62+
36.1
3.8
0.6
51–61
37.9
6.6
7.2
0.8
41–50
38.2
7.7
8.1
27–40
39.1
9.5
8.1
18–26
43.1
12.2
5.7
4.6 4.6
3.9
3.3
6.3
Using the Internet
Watching movies on
video or DVD
Playing video games
Watching TV
Listening to the radio
Reading magazines
Reading newspapers
Hours
per
Week
Source: Monitor and Grail Research and Analysis; ‘First ever Indian Youth trend Insights blog’, INgene,
18 | Copyright © 2012 SA Tourism
Consumer Background
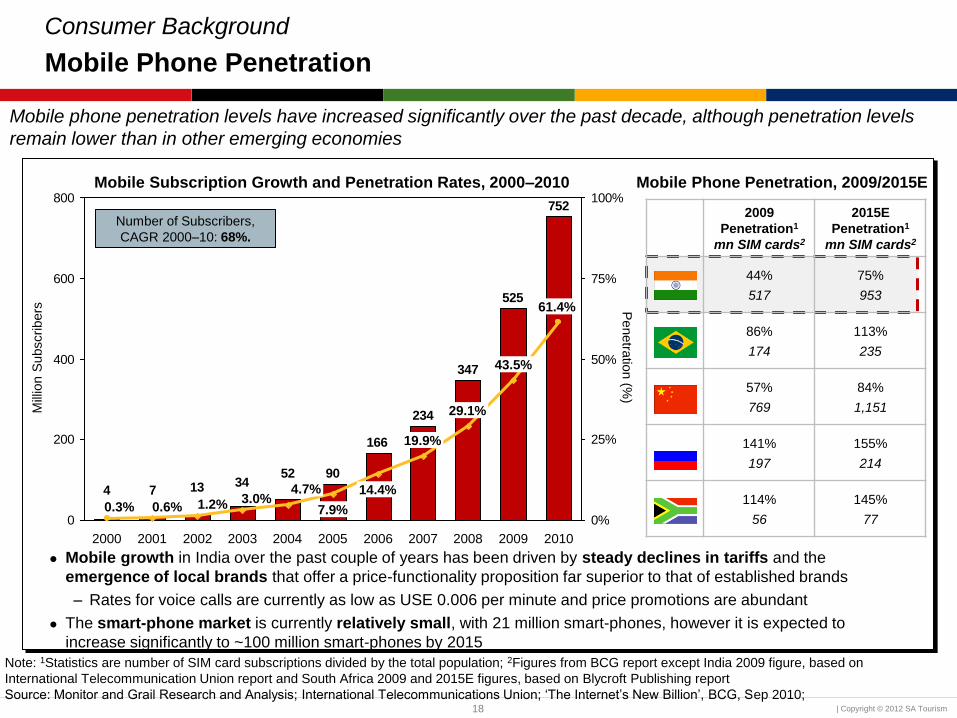
Mobile Phone Penetration
Mobile phone penetration levels have increased significantly over the past decade, although penetration levels
remain lower than in other emerging economies
Mobile Subscription Growth and Penetration Rates, 2000–2010
Mill
ion S
ubscribers
Penetra
tion (%
)
752
525
347
234
166
9052341374
0
200
400
600
800
0%
25%
50%
75%
100%
3.0%
2002
1.2%
2001
0.6%
2000
0.3%
2010
61.4%
2009
43.5%
2008
29.1%
2007
19.9%
2006
14.4%
2005
7.9%
2004
4.7%
2003
Number of Subscribers,
CAGR 2000–10: 68%.
2009
Penetration1
mn SIM cards2
2015E
Penetration1
mn SIM cards2
44%
517
75%
953
86%
174
113%
235
57%
769
84%
1,151
141%
197
155%
214
114%
56
145%
77
Mobile Phone Penetration, 2009/2015E
Mobile growth in India over the past couple of years has been driven by steady declines in tariffs and the
emergence of local brands that offer a price-functionality proposition far superior to that of established brands
– Rates for voice calls are currently as low as USE 0.006 per minute and price promotions are abundant
The smart-phone market is currently relatively small, with 21 million smart-phones, however it is expected to
increase significantly to ~100 million smart-phones by 2015
Note: 1Statistics are number of SIM card subscriptions divided by the total population; 2Figures from BCG report except India 2009 figure, based on
International Telecommunication Union report and South Africa 2009 and 2015E figures, based on Blycroft Publishing report
Source: Monitor and Grail Research and Analysis; International Telecommunications Union; ‘The Internet’s New Billion’, BCG, Sep 2010;

19 | Copyright © 2012 SA Tourism
Consumer Background
Internet Penetration and Usage
Internet penetration levels remain well below those of other emerging economies; internet users are engaging
primarily in email with lesser involvement in social networking and e-commerce sites
Internet Penetration Rates, 2005-2010 Percentage of Internet Users Engaging
in Online Activities1, 2009
2010
7.5%
2009
5.1%
2008
4.4%
2007
4.0%
2006
2.8%
2005
2.4%
Comparison with BRIC2
Internet Penetration, 2009
Internet Users (mn), 2009
5%
59
33%
68
28%
384
31%
44
Internet Penetration, 2015E
Internet Users (mn), 2015E
19%
237
74%
155
47%
650
55%
76
60%
23%
17%
50%
51%
53%
54%
57%
57%
61%
62%
73%
95%
E-Commerce
Social Networking
Search Engines
Dating and
Friendship
Online Video
Online Gaming
E-Greetings
Sports
Online Music
Reading News
Instant Messaging
Job Hunting
Note:1Based on Comscore survey of internet users aged 15 and above, accessing internet from home or work; 2Figures from BCG report except India
2009 figure, based on International Telecommunication Union report
Source: Monitor and Grail Research and Analysis; European Travel Commission; International Telecommunication Union; ‘State of the Internet in India –
Jun 2011 – A Report by comScore’, India Social, Jun 2011; ‘The Internet’s New Billion’, BCG, Sep 2010; “Market Insights: India”, European Travel
Commission, March 2010
Perc
enta
ge
~80 million internet users 0.5% broadband
internet penetration

20 | Copyright © 2012 SA Tourism
Consumer Background
e-Commerce
India’s e-Commerce market has increased by ~287% since 2007, with the online travel industry accounting for
~80% of transactions; the majority of online travel transactions are for domestic air tickets and rail tickets
Note: 1Converted from INR to USD using average exchange rates for each year; 2Only 28% of ‘affluent Indians’ have credit cards according to Visa
Source: Monitor and Grail Research and Analysis; ‘Digital Commerce’, IAMAI, March 2011;‘Online Travel Trends In India, Travel Distribution Summit – India
2010’, Comscore, 2010; ‘An outlook on Asia Pacific’s e-Commerce statistics, ecommerce zen, June, 2010’; ‘Indian netizens world’s third biggest online
shoppers’, expressindia.com, Jan 2008; ‘Lack of trust hindering e-commerce in India’, SME Times, Nov 2011; “Market Insights: India”, European Travel
Commission, March 2010;
India’s e-Commerce Market1, 2007 – 2011E
2011E
80%
+50%
20%
76%
24%
75%
10.1
2010E 2007
3.2
2008
2.0
19%
81%
6.9
23%
25%
77%
2009
4.1
US
D (
bn)
India is the world’s third largest e-Commerce market
and has seen significant growth (~287%) since 2007
– The total size of the Indian market is expected to
reach ~USD 10 billion by the end of 2011
Online travel bookings are expected to contribute 80%
of online transactions in 2010
– The majority of these transactions are domestic air
tickets (~63%) and rail tickets (~28%); international
air tickets, hotel bookings, bus tickets, tour packages
and tour insurance account for the remaining ~9%
Many internet users continue to search for information
online before physically purchasing the item
– In 2009, 12.6 million internet users looked for
information online; of these, only 7.5 million users
actually purchased a product online
– Lack of trust remains the primary reasons for such
users purchasing the item physically rather than online
– Only 25 million Indians had credit cards2 in 2009;
another potential reason explaining the trend of using
the internet for ‘looking’ rather than buying
Online Non-Travel Industry
Online Travel Industry

21 | Copyright © 2012 SA Tourism
Table of Contents
Political and Economic Environment
Consumer Landscape
Travel and Tourism Landscape
Outbound Travel
Travel to South Africa
Consumer Segmentation
Messages, Channels and Experiences

22 | Copyright © 2012 SA Tourism
Travel and Tourism Landscape
Trade Overview
The trade industry is highly fragmented with more than 20,000 retail agents; online travel sites are increasingly
being used to research trips however the majority of outbound travel still goes through conventional travel agents
Note: 1Unique visitors (Apr 2011) do not include visitation from public computers such as Internet cafes or access from mobile phones or PDAs
Source: Monitor and Grail Analysis; ‘Digital Commerce’, IAMAI, March 2011; “Market Insights: India”, European Travel Commission, March 2010; ‘The Indian
Outbound Travel Market’, World Tourism Organisation, 2009
TRAVEL AGENCIES AND TOUR OPERATORS
The Indian trade industry is highly fragmented with over 20,000 retail agents
spread across the country,
– The majority of retail agents are ticketing agents focusing on the domestic
travel market and on selling tickets and pre-packaged tours
The trade industry can be categorised as follows:
– Large tour operators
E.g., Cox & Kings, Thomas Cook and SOTC / Kuoni
– Medium sized operators
Wholesalers or retailers catering for FIT or group travel
Operate regionally with moderate marketing budgets and specialise in
~ 8-10 destinations
– Small operators
Retailers catering predominantly for FIT customers, though they
usually copy the itineraries of the large tour operators
Operate in a single city with miniscule budgets
– Niche operators (e.g., Fans on Stands, Beyond Boundaries, IndjaPink)
– Ticketing agents
There is strong competition between large and medium sized travel agencies
with aggressive marketing and tactical promotions
– E.g., ‘buy now, pay later’ promotions
ONLINE TRAVEL MARKET
There has been an increasing trend
for Indian travellers to research their
trips online, however the vast
majority of outbound travel
bookings still go through
conventional travel agents
– Internet was the 2nd most
popular source of information
(60% of respondents), just behind
friends and family (70%),
according to a 2008 survey of
Indian leisure travellers
Make my Trip 20.9%
Yatra Online 19.0%
ClearTrip.com 11.6%
Expedia Inc 9.9%
HolidayIQ.com 3.9%
Top Online Travel Agencies
(OTA), by Percentage of Unique
Visitors to Travel Sites1, Apr 2011

23 | Copyright © 2012 SA Tourism
Booking Channel used for Accommodation at Long-
Haul Destinations, 2012
Booking Channel used for Long-Haul Flights, 20121
Travel and Tourism Landscape
Booking Channels
Travel agents are the primary channel for booking both long-haul flights and accommodation, with consumers
booking in person, online or through a call centre
11%
Others2
27%
10%
14%
3%
Airlines Travel Agents /
Tour Operators
7%
8%
20%
48%
3%
33%
Online
Personal Visit
Telephone
24%
Airlines
11% 11%
4%
Others3
10%
6%
Hotels
19% 7%
Travel Agents /
Tour Operators
47%
4%
17%
14%
5%
15%
4%
Telephone
Online
Personal Visit
Note: 1Respondents who noted that they booked flights through hotels were thus not included in the graph, hence the percentages do not add up 10 100%; 2Others include Booking directly, Booking at promotion events, and Other channels; 3Others include Travel Booking Websites (as Online), and Direct Bookings,
at promotion events, or other channels (as Personal Visit)
Source: Monitor and Grail Analysis; India Quantitative Survey, Dec 2011
24 | Copyright © 2012 SA Tourism
Travel and Tourism Landscape
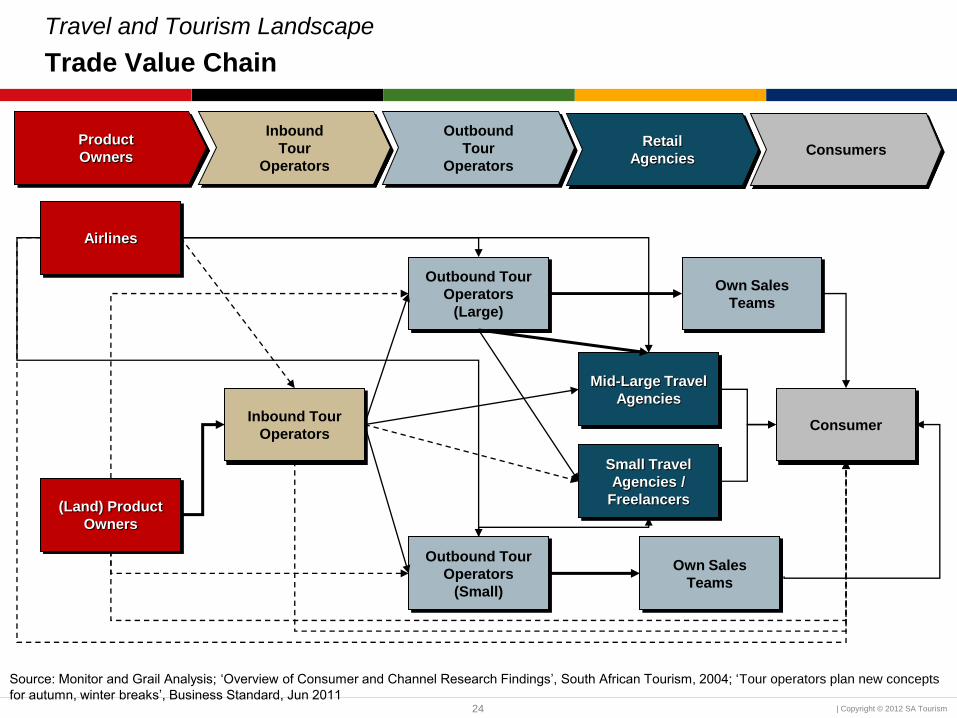
Trade Value Chain
Source: Monitor and Grail Analysis; ‘Overview of Consumer and Channel Research Findings’, South African Tourism, 2004; ‘Tour operators plan new concepts
for autumn, winter breaks’, Business Standard, Jun 2011
Airlines
(Land) Product
Owners
Inbound Tour
Operators
Outbound Tour
Operators
(Large)
Outbound Tour
Operators
(Small)
Mid-Large Travel
Agencies
Small Travel
Agencies /
Freelancers
Own Sales
Teams
Consumer
Own Sales
Teams
Product
Owners
Inbound
Tour
Operators
Outbound
Tour
Operators
Retail
Agencies Consumers
25 | Copyright © 2012 SA Tourism
Travel and Tourism Landscape
Evolution of the Trade Environment (1 of 2)
Source: Monitor and Grail Analysis; ‘Travel and Tourism – India’, Euromonitor, Apr 2011; ‘Travel Retail – India’, Euromonitor, Apr 2011; Thomas Cook Website;
India Digital Review Website; SOTC Website; India Outbound 2011- MICE travel, Today’s Traveller Newswire, 2011; Business Standard Website; M-Travel
Website; VCCircle Website;
Online
Websites
Branching Out
into Non-Air
Business
Consolidation
of the Industry
International
Players
Entering the
Indian Market
2
3
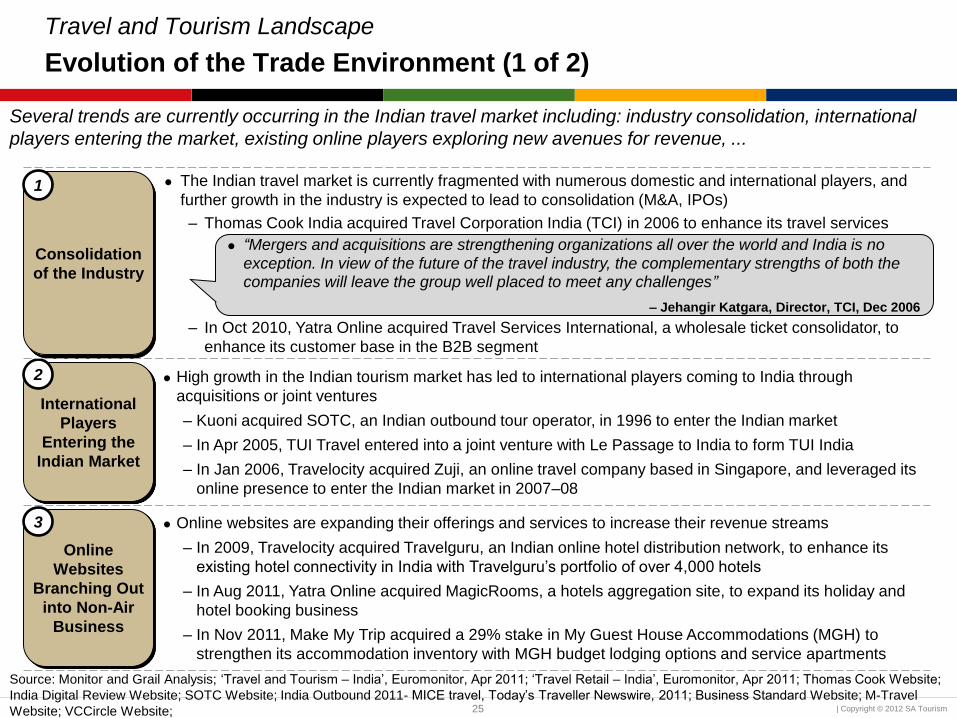
Several trends are currently occurring in the Indian travel market including: industry consolidation, international
players entering the market, existing online players exploring new avenues for revenue, ...
The Indian travel market is currently fragmented with numerous domestic and international players, and
further growth in the industry is expected to lead to consolidation (M&A, IPOs)
– Thomas Cook India acquired Travel Corporation India (TCI) in 2006 to enhance its travel services
– In Oct 2010, Yatra Online acquired Travel Services International, a wholesale ticket consolidator, to
enhance its customer base in the B2B segment
High growth in the Indian tourism market has led to international players coming to India through
acquisitions or joint ventures
– Kuoni acquired SOTC, an Indian outbound tour operator, in 1996 to enter the Indian market
– In Apr 2005, TUI Travel entered into a joint venture with Le Passage to India to form TUI India
– In Jan 2006, Travelocity acquired Zuji, an online travel company based in Singapore, and leveraged its
online presence to enter the Indian market in 2007–08
Online websites are expanding their offerings and services to increase their revenue streams
– In 2009, Travelocity acquired Travelguru, an Indian online hotel distribution network, to enhance its
existing hotel connectivity in India with Travelguru’s portfolio of over 4,000 hotels
– In Aug 2011, Yatra Online acquired MagicRooms, a hotels aggregation site, to expand its holiday and
hotel booking business
– In Nov 2011, Make My Trip acquired a 29% stake in My Guest House Accommodations (MGH) to
strengthen its accommodation inventory with MGH budget lodging options and service apartments
1
“Mergers and acquisitions are strengthening organizations all over the world and India is no
exception. In view of the future of the travel industry, the complementary strengths of both the companies will leave the group well placed to meet any challenges”
– Jehangir Katgara, Director, TCI, Dec 2006
26 | Copyright © 2012 SA Tourism
Travel and Tourism Landscape
Evolution of the Trade Environment (2 of 2)
Expansion
into South-
East Asia
Emergence
of Niche
Travel
Forms
(e.g., Sports
Tourism,
Adventure
Tourism,
and Cruises)
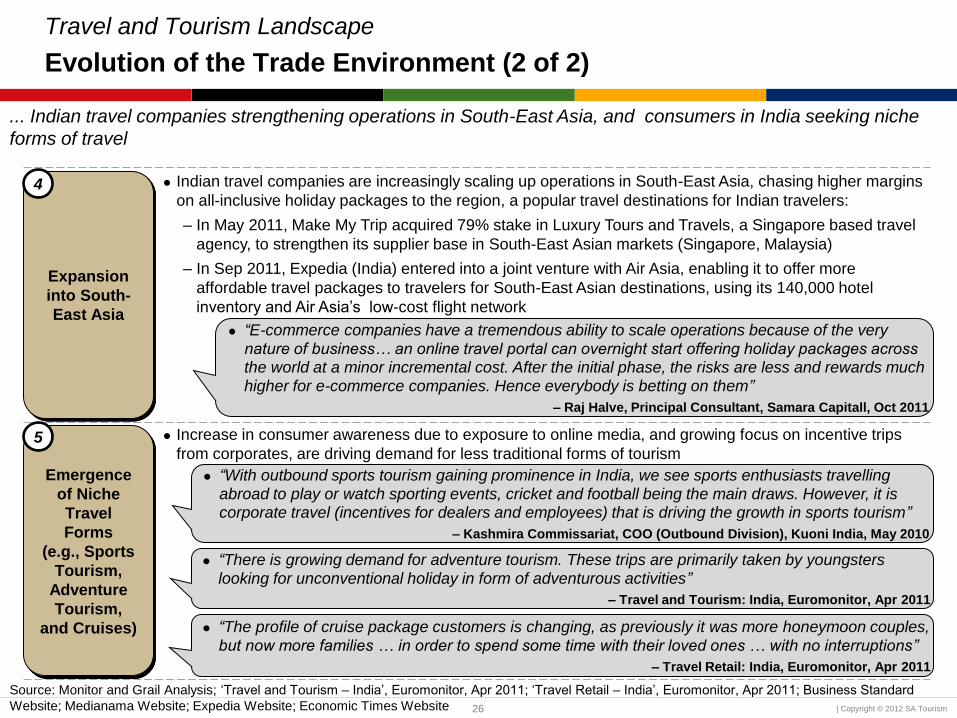
... Indian travel companies strengthening operations in South-East Asia, and consumers in India seeking niche
forms of travel
Indian travel companies are increasingly scaling up operations in South-East Asia, chasing higher margins
on all-inclusive holiday packages to the region, a popular travel destinations for Indian travelers:
– In May 2011, Make My Trip acquired 79% stake in Luxury Tours and Travels, a Singapore based travel
agency, to strengthen its supplier base in South-East Asian markets (Singapore, Malaysia)
– In Sep 2011, Expedia (India) entered into a joint venture with Air Asia, enabling it to offer more
affordable travel packages to travelers for South-East Asian destinations, using its 140,000 hotel
inventory and Air Asia’s low-cost flight network
Increase in consumer awareness due to exposure to online media, and growing focus on incentive trips
from corporates, are driving demand for less traditional forms of tourism
Source: Monitor and Grail Analysis; ‘Travel and Tourism – India’, Euromonitor, Apr 2011; ‘Travel Retail – India’, Euromonitor, Apr 2011; Business Standard
Website; Medianama Website; Expedia Website; Economic Times Website
“E-commerce companies have a tremendous ability to scale operations because of the very nature of business… an online travel portal can overnight start offering holiday packages across the world at a minor incremental cost. After the initial phase, the risks are less and rewards much higher for e-commerce companies. Hence everybody is betting on them”
– Raj Halve, Principal Consultant, Samara Capitall, Oct 2011
5
4
“With outbound sports tourism gaining prominence in India, we see sports enthusiasts travelling abroad to play or watch sporting events, cricket and football being the main draws. However, it is corporate travel (incentives for dealers and employees) that is driving the growth in sports tourism”
– Kashmira Commissariat, COO (Outbound Division), Kuoni India, May 2010
“There is growing demand for adventure tourism. These trips are primarily taken by youngsters
looking for unconventional holiday in form of adventurous activities”
– Travel and Tourism: India, Euromonitor, Apr 2011
“The profile of cruise package customers is changing, as previously it was more honeymoon couples,
but now more families … in order to spend some time with their loved ones … with no interruptions”
– Travel Retail: India, Euromonitor, Apr 2011

27 | Copyright © 2012 SA Tourism
Table of Contents
Political and Economic Environment
Consumer Landscape
Travel and Tourism Landscape
Outbound Travel
Travel to South Africa
Consumer Segmentation
Messages, Channels and Experiences

28 | Copyright © 2012 SA Tourism
Travel and Tourism Landscape
Travel Overview
Travel has increased significantly over the past five years with ~755 million trips taken in 2010; domestic travel
accounts for the majority of these trips (~98%)
13.6%
Domestic Trips
Outbound Trips
2010
753.5
98.3%
1.7%
2009
661.1
98.3%
1.7%
2008
573.8
98.1%
1.9%
2007
536.4
98.2%
1.8%
2006
451.7
98.2%
1.8%
Mill
ion T
rips
Number of Trips by Domestic versus Outbound, 2006–2010
Domestic trips continue to account for the majority of travel by Indians, and have increased at a greater rate
(13.7% p.a.) than outbound travel (10.8%) since 2006
This growth in domestic travel is expected to continue in the short-term
– Domestic trips are significantly cheaper than international trips, with the recent depreciation of the Rupee
against major currencies compounding this factor
– The Ministry of Tourism will continue to run its ‘Incredible India’ tourism campaign, which was extended in 2009
to target the domestic sector
Bus remains the primary form of transport for domestic travel, representing ~70% of all trips, with train (~20% of
all trips) the second most popular form of transport
Source: Monitor and Grail Research and Analysis; ‘Travel and Tourism – India’, Euromonitor International, Apr 2011; ‘India Tourism Outbound Nepal
Perspective 2010’, Nepal Tourism Board, 2010; ‘Domestic tourism grew at 15%’, The Times of India, Apr 2011;

29 | Copyright © 2012 SA Tourism
Travel and Tourism Landscape
Outbound Travel Overview
Outbound travel has increased by ~11% per annum since 2006, with 22.5 million outbound trips expected in 2015;
leisure remains the primary purpose, accounting for 68% of trips, with business representing 32% of trips
10.8%
12.4%
Leisure
Business1
2015E
22.5
67%
33%
2014E
19.9
67%
33%
2013E
17.6
67%
33%
2012E
15.6
67%
33%
2011E
14.0
67%
33%
2010
12.6
68%
32%
2009
11.1
68%
32%
2008
10.9
68%
32%
2007
9.8
68%
32%
2006
8.3
67%
33%
Mill
ion T
rips
Number of Outbound Trips by Purpose of Travel, 2006–2015E
Forecasts
Departures from India have increased significantly since 2006, with India recognised as one of the fastest growing
countries for outbound travel
– Business trips and leisure trips have increased at a similar rate
– This trend is expected to accelerate over the coming years, with the number of outbound trips increasing to
22.5 million by 2015
Over the past year, departures increased by ~13% with the recovering economy, improved consumer confidence and
attractive tourist packages drivers of this growth
– The introduction of low-cost carriers such as Air Asia have helped decrease the cost of tourist packages
Notes: 1Slide in back-up profiling business travellers
Source: Monitor and Grail Research and Analysis; ‘Tourism Flows Outbound – India’, Euromonitor International, Apr 2011

30 | Copyright © 2012 SA Tourism
Travel and Tourism Landscape
Outbound MICE Travel
Outbound MICE travel is part of business travel and is estimated to represent between 3% and 9% of the total
outbound travel market
Note:1Includes leisure and business travel; 2Slides in back-up describing the MICE-travel market and the decision making process
Source: Monitor and Grail Analysis; Interviews with travel agents and tour operators, Mar 2012; “Germany tops the charts amongst Indians for meetings &
incentives”, eTravel Blackboard, Feb 2012; “India Outbound 2011 MICE Travel”, Newswire, 2011; ‘Tourism Flows Outbound – India’, Euromonitor International,
Apr 2011
Outbound Travel Market
by Purpose of Travel, 2010
Million Trips
MICE
Long-
Haul
Travel
MICE
Short-
Haul
Travel
~30%
of Trips
~70%
of Trips
MICE
Travel2
Other
Travel1
12.6
10%-30%
of Trips
70%-90%
of Trips
“The size of the Indian outbound MICE market is estimated to be
~USD 500 million”
– Head of MICE
division, major
outbound tour
operator, 2012
Outbound MICE Travel
Market by Category of
Destination
The estimated
market size of the
long-haul outbound
MICE travel market
is between 3% and
9% of all outbound
trips, i.e., between
400,000 and
1,200,000 trips per
annum

31 | Copyright © 2012 SA Tourism
39.7% 40.3% 40.6% 40.6% 40.7%
7.6%
51.8%
12.5
2010
0– 3 days
4–7 days
Over 7 days
2009
11.1
51.8%
7.6%
2008
10.9
51.9%
7.5%
2007
9.8
51.2%
8.5%
2006
8.3
51.8%
8.5%
Travel and Tourism Landscape
Length of Stay
The length of outbound travel has not changed markedly over the past five years, with the majority of trips greater
than seven days long
Perc
enta
ge o
f T
ota
l D
epart
ure
s
Length of Outbound Departures, 2006–2010 Total Number
of Trips
(million)
The length of stay of
Indian outbound
travellers has not
changed significantly
over the past 5 years
– The majority of
trips (~52%) are
longer than seven
days
Globally the trend
since the global
recession in 2008 and
2009 has been for
international travellers
to decrease the
length of their stay
Source: Monitor and Grail Research and Analysis; ‘Travel and Tourism – India’, Euromonitor International, Apr 2011; ‘ITB World Travel Trends Report
2010 / 2011’, IPK International, 2010
32 | Copyright © 2012 SA Tourism
Travel and Tourism Landscape
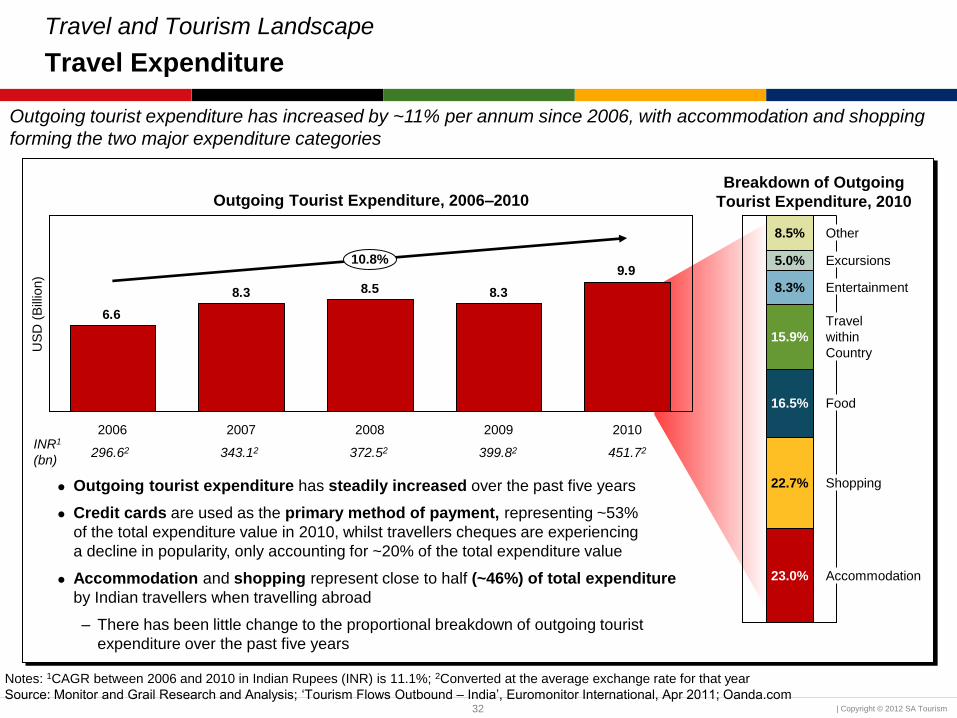
Travel Expenditure
Outgoing tourist expenditure has increased by ~11% per annum since 2006, with accommodation and shopping
forming the two major expenditure categories
US
D (
Bill
ion)
Outgoing Tourist Expenditure, 2006–2010
9.9
8.38.58.3
6.6
10.8%
2010 2009 2008 2007 2006
Accommodation
Shopping
Food
Travel
within
Country
Entertainment
Excursions
Other
23.0%
22.7%
16.5%
15.9%
8.3%
5.0%
8.5%
Breakdown of Outgoing
Tourist Expenditure, 2010
Outgoing tourist expenditure has steadily increased over the past five years
Credit cards are used as the primary method of payment, representing ~53%
of the total expenditure value in 2010, whilst travellers cheques are experiencing
a decline in popularity, only accounting for ~20% of the total expenditure value
Accommodation and shopping represent close to half (~46%) of total expenditure
by Indian travellers when travelling abroad
– There has been little change to the proportional breakdown of outgoing tourist
expenditure over the past five years
Notes: 1CAGR between 2006 and 2010 in Indian Rupees (INR) is 11.1%; 2Converted at the average exchange rate for that year
Source: Monitor and Grail Research and Analysis; ‘Tourism Flows Outbound – India’, Euromonitor International, Apr 2011; Oanda.com
INR1
(bn) 296.62 343.12 372.52 399.82 451.72

33 | Copyright © 2012 SA Tourism
Travel and Tourism Landscape
Top Destinations in 2010
Major outbound destinations for Indian travellers in 2010 include Singapore, UAE, Thailand, Malaysia and the
United States
Note: 1Destinations ranked 1–5 by total number of trips in 2010; 2Destinations ranked 6–10 by total number of trips in 2010; 3Based on SAT Departure Survey:
Traveller’s Weight (Weight 1) has been used
Source: Monitor and Grail Research and Analysis; ‘Tourism Flows Outbound – India’, Euromonitor, Apr 2011; SAT Departure Survey 2003–2008, 2009, 2010
Total Air
Departures from
India (2010)
12.5 million
India
UAE
763.3
United States
572.5
Singapore
875.9 Malaysia
655.7
Thailand
665
China
421.3
Hong Kong
410.9
UK
363.3
France
304.4
Indonesia
193.8
8.9%
-0.2%
11.7%
23.8% 7.4%
19.8%
11.5%
8.7%
6.7%
1.0%
Major Destinations1
Less Frequent Destinations2
Legend
%
Number of trips, 2010
(‘000 trips)1
CAGR (2006–2010)
# South Africa
72,234 Indian arrivals in
20103
34 | Copyright © 2012 SA Tourism
Table of Contents
Political and Economic Environment
Consumer Landscape
Travel and Tourism Landscape
Outbound Travel
Travel to South Africa
Consumer Segmentation
Messages, Channels and Experiences

35 | Copyright © 2012 SA Tourism
Travel and Tourism Landscape
Indian Travellers to South Africa – Overview
The number of outbound travellers to South Africa has increased considerably over the past five years, with net
inbound tourism spend growing at a slightly slower rate
15.6%
2010
72.2
2009
57.6
2008
49.7
2007
49.1
2006
40.4
Thousand T
ravelle
rs
Number of Arrivals, 2006–20102
1.61.6
1.4
1.01.0
12.4%
2010 2009 2008 2007 2006
Bill
ion R
and
Total Net Inbound Tourism Spend (NITS), 2006–20102
Note: 1Outgoing travel expenditure for Indian travellers to any destination converted from Rupees into Rands at the average exchange rate for that year; 2 Traveller’s Weight (Weight 1) has been used for the years 2006-2010; 3CAGR between 2006 and 2010 in Indian Rupees (INR) is 10.4%
Source: Monitor and Grail Research and Analysis; SAT Departure Survey 2003–2008, 2009, 2010; SAT Arrivals Data, 2011; Oanda.com
INR3
(bn) 6.7 5.8 7.2 9.4 9.9
According to SAT’s Arrivals data, there were 101.5 thousand
arrivals from India in 2011, an increase of 27.2% from 2010

36 | Copyright © 2012 SA Tourism
Travel and Tourism Landscape
Traveller Profile – Overview
Indian travellers to South Africa in 2010 were typically male, aged 25 to 34 and residing in Mumbai and visiting for
the first time; they stayed, on average, 25 nights and spent just under R1,000 per day
24.521.4
25.522.123.2
2010 2009 2008 2007 2006
Average Nights per Trip, 2006–20102
896
1 311
1 075913
1 062
2010 2009 2008 2007 2006
Rand
Nig
hts
Average Expenditure (NITS) per Day, 2006–20102
10%
90%
Profile of Indian Travellers, 20101
Gender Age
Female Male
8%
40%
30%
15%
4% 2%
18–24
25–34
35–44
45–54
55–64
65+
Note: 1Tourist Weight (Weight 2) has been used for the year 2010; 2 Traveller’s Weight (Weight 1) has been used for the years 2006-2010
Source: Monitor and Grail Research and Analysis; SAT Departure Survey 2003-2008, 2009, 2010
City of Residence1:
Delhi: 14%
Chennai: 6%
Mumbai: 49%
Bangalore: 9%
Pune: 6%
INR 7,113 5,341 5,701 7,595 5,583
40%
60%
Repeat Visitors
First-Time Visitors
First-Time Visitors2:

37 | Copyright © 2012 SA Tourism
Indian travellers to South Africa are typically either staying between 4 and 6 nights, or for a significantly longer
period (20+ nights)
Perc
enta
ge
0%
10%
20%
30%
40%
>20 Nights 16-20 Nights 10-15 Nights 7-9 Nights 4-6 Nights 1-3 Nights
2006 2007 2008 2009 2010
Note: 1Traveller’s Weight (Weight 1) has been used for the years 2006-2010; QANights has been used to analyze length of stay
Source: Monitor and Grail Research and Analysis; SAT Departure Survey 2003-2008, 2009, 2010
Travel and Tourism Landscape
Length of Stay – Overview
Breakdown of Travellers Length of Stay, 2006-20101
38 | Copyright © 2012 SA Tourism
Travel and Tourism Landscape
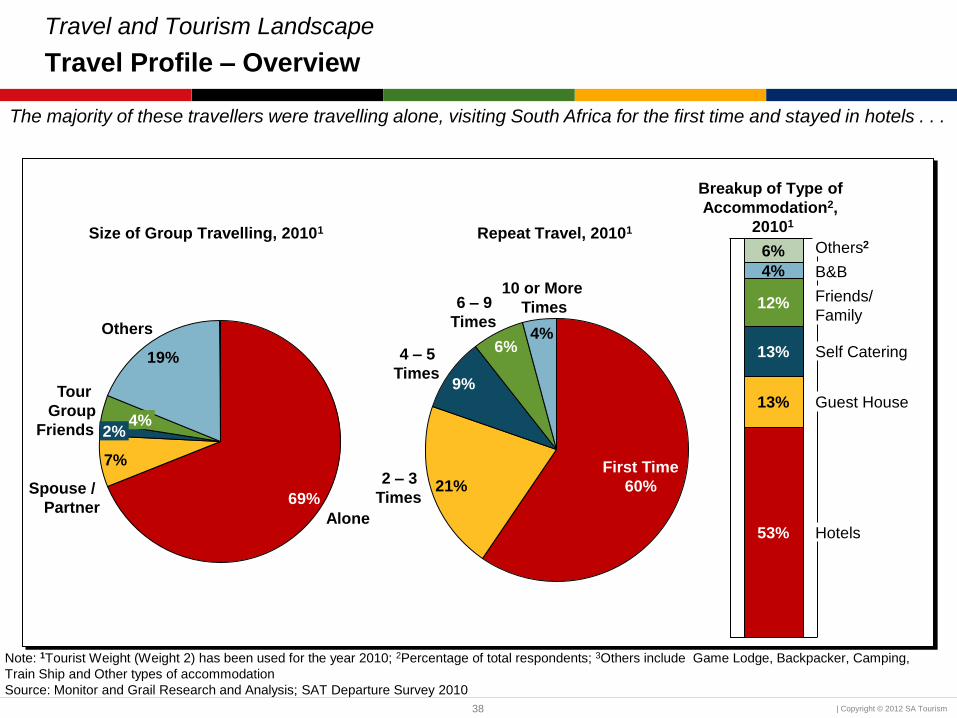
Travel Profile – Overview
The majority of these travellers were travelling alone, visiting South Africa for the first time and stayed in hotels . . .
Size of Group Travelling, 20101
Others
19%
Tour
Group 4%
Friends 2%
Spouse /
Partner
7%
Alone
69%
Repeat Travel, 20101
10 or More
Times
4%
6 – 9
Times
6%
21%
4 – 5
Times
First Time
60%
9%
2 – 3
Times
Breakup of Type of
Accommodation2,
20101
Hotels
Guest House
Self Catering
Friends/
Family
B&B
Others
13%
12%
53%
4%
6%
13%
Note: 1Tourist Weight (Weight 2) has been used for the year 2010; 2Percentage of total respondents; 3Others include Game Lodge, Backpacker, Camping,
Train Ship and Other types of accommodation
Source: Monitor and Grail Research and Analysis; SAT Departure Survey 2010
2
39 | Copyright © 2012 SA Tourism
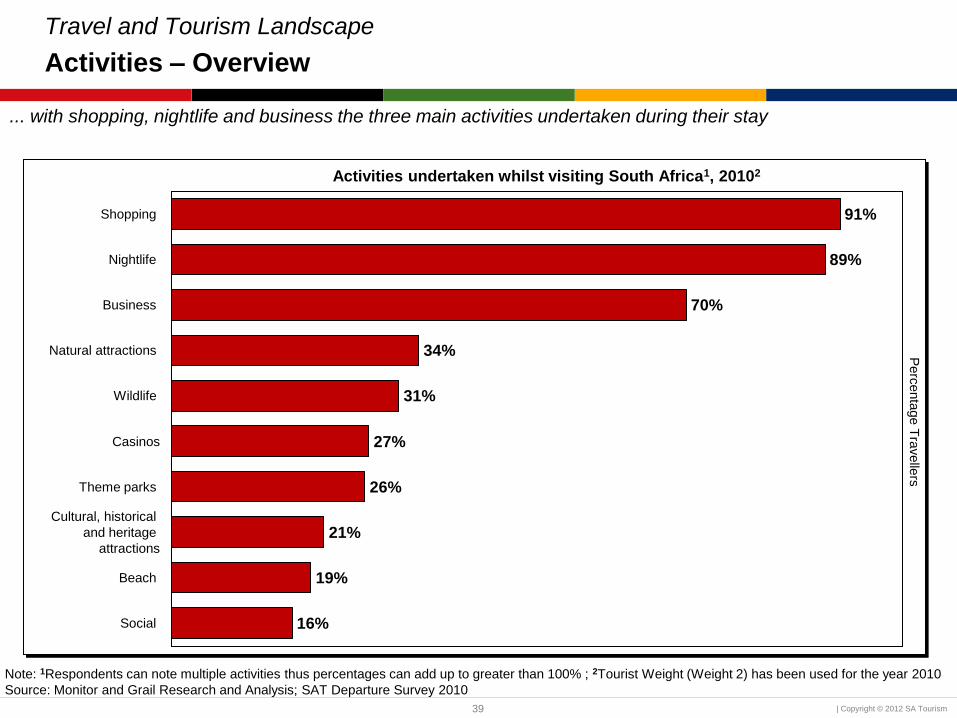
Travel and Tourism Landscape
Activities – Overview
... with shopping, nightlife and business the three main activities undertaken during their stay
Activities undertaken whilst visiting South Africa1, 20102
89%
26%
Wildlife
Natural attractions
27% Casinos
34%
Beach
70%
Cultural, historical
and heritage
attractions
Social
31%
19%
21%
Theme parks
Nightlife
91%
Business
16%
Shopping
Note: 1Respondents can note multiple activities thus percentages can add up to greater than 100% ; 2Tourist Weight (Weight 2) has been used for the year 2010
Source: Monitor and Grail Research and Analysis; SAT Departure Survey 2010
Perc
enta
ge T
ravelle
rs
40 | Copyright © 2012 SA Tourism
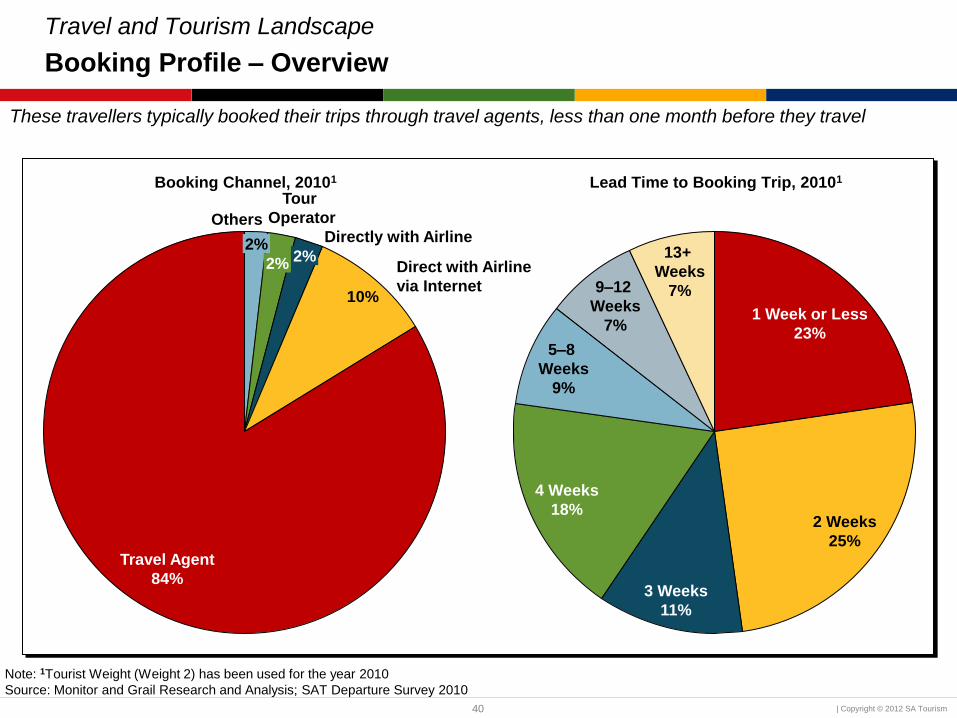
Travel and Tourism Landscape
Booking Profile – Overview
These travellers typically booked their trips through travel agents, less than one month before they travel
Booking Channel, 20101
10%
Travel Agent
84%
Direct with Airline
via Internet
Directly with Airline
2%
Tour
Operator
2%
Others
2%
Lead Time to Booking Trip, 20101
13+
Weeks
7% 9–12
Weeks
7%
5–8
Weeks
9%
4 Weeks
18%
3 Weeks
11%
2 Weeks
25%
1 Week or Less
23%
Note: 1Tourist Weight (Weight 2) has been used for the year 2010
Source: Monitor and Grail Research and Analysis; SAT Departure Survey 2010
41 | Copyright © 2012 SA Tourism
16%
12% 11%15% 16%
4% 5% 4% 4%
2010
66%
8%
6%
2009
66%
6%
2%
65%
10%
8% 8%
66%
11%
2006 2007
57%
7%
2008
9% 18%
Travel and Tourism Landscape
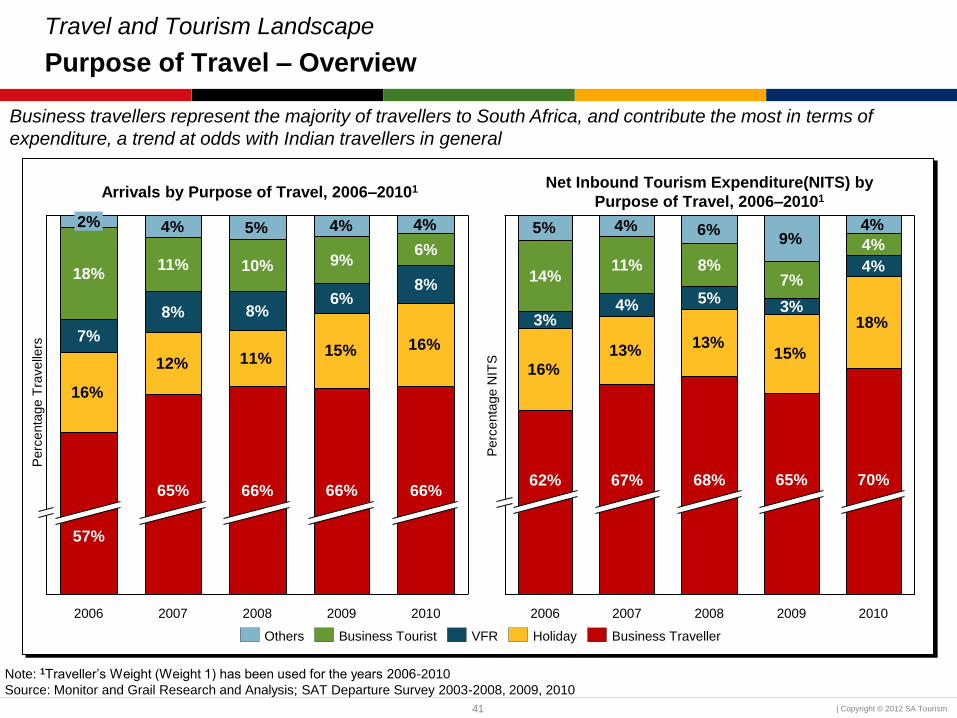
Purpose of Travel – Overview
Business travellers represent the majority of travellers to South Africa, and contribute the most in terms of
expenditure, a trend at odds with Indian travellers in general
Perc
enta
ge T
ravelle
rs
Arrivals by Purpose of Travel, 2006–20101
Perc
enta
ge N
ITS
Net Inbound Tourism Expenditure(NITS) by
Purpose of Travel, 2006–20101
16%
13%13%
15%
18%
5% 4% 6%9%
4%
2010
70%
4%
4%
2009
65%
3%
7%
2008
68%
5%
8%
2007
67%
4%
11%
2006
62%
3%
14%
Note: 1Traveller’s Weight (Weight 1) has been used for the years 2006-2010
Source: Monitor and Grail Research and Analysis; SAT Departure Survey 2003-2008, 2009, 2010
Business Traveller Holiday VFR Business Tourist Others

42 | Copyright © 2012 SA Tourism
2 0962 0262 089
1 4771 418
2009 2010 2008 2007 2006
Travel and Tourism Landscape
Traveller Profile – Holiday Traveller
Holiday travellers to South Africa in 2010 were typically male, aged 25 to 34 and residing in Mumbai and visiting
for the first time; they spent just over R2,000 per day and stayed, on average, 12 nights ...
Profile of Holiday Travellers, 20101
11.6
14.415.115.0
17.7
2010 2009 2008 2007 2006
Average Nights per Trip, 2006–20102
Average Expenditure (NITS) per Day, 2006–20102
Rand
Avera
ge N
ights
Note: 1Tourist Weight (Weight 2) has been used for the year 2010; 2 Traveller’s Weight (Weight 1) has been used for the years 2006-2010
Source: Monitor and Grail Research and Analysis; SAT Departure Survey 2003-2008, 2009, 2010; Oanda.com
INR 9,494 8,639 11,079 11,733 13,065
14%
86%
Gender Age
Female Male
16%
32%
20%
18%
9% 5%
18–24
25–34
35–44
45–54
55–64
65+
City of Residence1:
Delhi: 14%
Chennai: 4%
Mumbai: 61%
Bangalore: 5%
Pune: 1%
18%
82%
Repeat Visitors
First-Time Visitors
First-Time Visitors2:

43 | Copyright © 2012 SA Tourism
... with the most common length of stay between 4 and 15 nights
Perc
enta
ge
0%
10%
20%
30%
40%
50%
>20 Nights 16-20 Nights 10-15 Nights 7-9 Nights 4-6 Nights 1-3 Nights
2006 2007 2008 2009 2010
Travel and Tourism Landscape
Length of Stay – Holiday Traveller
Breakdown of Holiday Travellers Length of Stay, 2006-20101
Note: 1Traveller’s Weight (Weight 1) has been used for the years 2006-2010
Source: Monitor and Grail Research and Analysis; SAT Departure Survey 2003-2008, 2009, 2010

44 | Copyright © 2012 SA Tourism
Travel and Tourism Landscape
Seasonality – Holiday Traveller
Holiday travellers typically visit between May and July, during summer school holidays in India...
Seasonality of Holiday Travellers, 2006-20101
Perc
enta
ge
0%
5%
10%
15%
20%
25%
30%
35%
40%
Dec Nov Sep Aug Jul Jun Oct Apr Mar Feb Jan May
2007 2008 2009 2010 2006
Note: 1Traveller’s Weight (Weight 1) has been used for the years 2006-2010
Source: Monitor and Grail Research and Analysis; SAT Departure Survey 2003-2008, 2009, 2010
Indian Premier League cricket
tournament moved to South Africa

45 | Copyright © 2012 SA Tourism
Travel and Tourism Landscape
Destination – Holiday Traveller
... and spend the majority of their time in Gauteng and the Western Cape
33%
35%31%
29%
33%
5%
4%4% 5%6%1%1% 1%
2009
34%
18%
9%
2%
1% 1%
2008
36%
12%
7%
3%
2007
37%
14%
5%
1% 1%
2010
42%
9%
8%
4%
2006
32%
25%
5% 3%
1%
Province Market Shares as a Percentage of Total Nights Spent, 2006–20101
Gauteng
Western Cape
Kwa-Zulu Natal
North West
Mpumalanga
Eastern Cape
Limpopo
Free State
Northern Cape
Note: 1Traveller’s Weight (Weight 1) has been used for the years 2006-2010
Source: Monitor and Grail Research and Analysis; SAT Departure Survey 2003-2008, 2009, 2010
Perc
enta
ge o
f T
ota
l N
ights

46 | Copyright © 2012 SA Tourism
Travel and Tourism Landscape
Reasons for Visiting SA – Holiday Traveller
The majority of Indian holiday travellers chose South Africa to experience a different country or to go on a safari or
wildlife experience ...
Primary Driver for Visiting South Africa, 2008-20101
4% 1%
Business/investment
interests 2%
1%
South Africa’s
uniqueness 1%
3%
To visit friends/relatives 7% 5%
To be able to relax
and escape 8%
6%
To see the natural
scenery 6% 6%
FIFA 2010 World Cup /
Sport 13%
17%
To go on safari / wildlife
experience 27%
19%
To experience a
different country 24%
31%
To experience South
Africa’s different cultures 3%
2%
1%
11%
4%
12%
40%
23%
Note: 1Traveller’s weight (Weight 1) has been used for the years 2008-2010
Source: Monitor and Grail Research and Analysis; SAT Departure Survey 2008-2010
Perc
enta
ge T
ravelle
rs
2009
2010
2008

47 | Copyright © 2012 SA Tourism
Travel and Tourism Landscape
Worst Experience in SA – Holiday Traveller
... whilst most of these travellers (~80%) did not have a bad experience during their stay although poor transport
facilities was noted as the primary reason for those with a bad experience in 2010
Worst Experience whilst visiting South Africa, 2008-20101
Personal experience 1.0%
Expensive
3.8%
The service was
below my expectations
2.1%
Poor airport service
5.9%
1.7%
Personal safety 3.3%
1.6%
Safety and security
2.6%
1.3%
3.2%
1.0%
Poor transport facilities
2.2%
5.2%
1.2%
1.2%
2.0%
5.7%
1.5%
3.0%
~80% of the respondents in 2008 - 2010 answered ‘I had no bad experience’
Perc
enta
ge T
ravelle
rs
2010
2009
2008
Note: 1Traveller’s weight (Weight 1) has been used for the years 2008-2010
Source: Monitor and Grail Research and Analysis; SAT Departure Survey 2008-2010
48 | Copyright © 2012 SA Tourism
Table of Contents
Political and Economic Environment
Consumer Landscape
Travel and Tourism Landscape
Outbound Travel
Travel to South Africa
Consumer Segmentation
Messages, Channels and Experiences

49 | Copyright © 2012 SA Tourism
Note: 1The prioritised cities are: Ahmedabad, Amritsar, Bagalore, Chandigarh, Chennai, Delhi, Hyderabad, Kolkata, Ludhiana, Mumbai, Pune, Surat, Vadodara
Source: Monitor and Grail Research and Analysis; IMF; Indian Census, 2011, 2001; Oanda.com; EIU; United Nations, Department of Economic and Social Affairs
‘The Great Indian Middle Class’, National Council of Applied Economic Research, 2004
Total
Population
Population in
Prioritised1
Cities
Capable of
Long Haul
Travel
Adults
1,206.9 mn
(100% of total)
7.2 mn
(0.6% of total)
3.6 mn
(0.3% of total)
2.3 mn
(0.2% of total)
The segmentation frame represents 2.3 million Indians, all over the age of 18, living in one of
the prioritised cities, with a household income greater than INR 1,600,000
The segmentation frame represents 2.3 million Indians; i.e., people aged 18 or above, residing in the thirteen
focus cities and with a household income greater than INR 1,600,000
Prioritisation of Consumer Segments
Total Size of the Frame
The greatest opportunity lies in the largest
cities, as well as those cities which display
strong socio-economic factors
Household income of INR 1,600,000 million
was found to be the threshold for Indians who
regularly participate in long-haul leisure travel
Adults (aged 18 or above) are the key
participants in the travel buying process

50 | Copyright © 2012 SA Tourism
Developing the Segmentation Frame
Creating the Segments – Frame
Age <= 30 Age 31-39 Age > 39
Kids No Kids No Kids Kids Kids No Kids
High
Income
Very
High
Income
High
Income
Very
High
Income
High
Income
Very
High
Income
High
Income
Very
High
Income
Very
High
Income
High
Income
High
Income
Very
High
Income
Traditional
Traveller
Other
Metros
and Cities
Super
Metros
Exotic
Traveller
Other
Metros
and Cities
Super
Metros
Worldly
Traveller
Other
Metros
and Cities
Super
Metros
The frame consists of 15 segments
A
5.3% D
13.8%
F
8.0%
E
5.5%
B
6.5%
C
3.7%
M
6.8%
I
11.3% I
K
K
5.2% I
J
8.3%
N
3.4%
L
7.2%
O
3.4%
G
6.4%
H
5.0%
G
H
Note: Percentages represent the number of consumers in the segment as a proportion of the total market size
Source: Monitor and Grail Research and Analysis; ‘Quantitative Research Survey – India’, SAT, Jan 2012

51 | Copyright © 2012 SA Tourism
Developing the Segmentation Frame
Creating the Segments
Younger, Traditional, Couples
Couples, with young children, the majority of
whom live in other metros and prefer to stay
with friends and family or in guesthouses and
B&Bs when on holiday
Volume = 5.3% of total market
Value = INR 0.87 mn per person p.a.
Younger, Exotic and Worldly, Couples
Couples, with young children, who mainly
live in super metros, travel fairly frequently
and typically seek a romantic holiday
Volume = 6.5% of total market
Value = INR 0.89 mn per person p.a.
Younger, Worldly, Very High Income
Families
Couples, with dependent children, who travel
very frequently and stay in B&Bs and
guesthouses
Volume = 3.7% of total market
Value = INR 2.39 mn per person p.a.
Younger, Traditional, Singles and Couples
Singles and couples with no children who
travel fairly regularly and look to have
romantic holidays when they travel
Volume = 13.8% of total market
Value = INR 0.48 mn per person p.a.
Middle-Aged, Traditional, Couples
Couples, with grownup children that have left
home, who typically travel to visit friends and
family
Volume = 6.4% of total market
Value = INR 0.53 mn per person p.a.
Older, Traditional and Exotic, High-Very
High Income Couples
Couples with no children who predominantly
live in super metros and travel fairly
frequently
Volume = 5.0% of total market
Value = INR 0.85 mn per person p.a.
B
C
Younger, Worldly, Singles and Couples
Singles and couples with no children, who
travel very frequently and seek adventure or
romantic holidays
Volume = 8.0% of total market
Value = INR 1.27 mn per person p.a.
F
Younger to Middle-Aged, Exotic and Worldly
Couples
Couples with no children who travel
infrequently but enjoy exploring new cultures
and destinations while on holiday
Volume = 5.5% of total market
Value = INR 0.53 mn per person p.a.
E A
H D
G

52 | Copyright © 2012 SA Tourism
Developing the Segmentation Frame
Creating the Segments
Older, Exotic and Worldly, High Income
Families
Couples, with dependent children, who travel
frequently, usually going on family holidays
Volume = 3.4% of total market
Value = INR 0.45 mn per person p.a.
Middle-Aged to Older, Traditional and Exotic,
Very High Income Couples
Couples, with dependent children, who
predominantly reside in super metros and
travel infrequently
Volume = 6.8% of total market
Value = INR 0.48 mn per person p.a.
Older, Traditional, High Income Couples
Couples, with dependent children, who mainly
stay in other metros and travel infrequently,
visiting friends and family during holidays
Volume = 3.4% of total market
Value = INR 0.62 mn per person p.a.
Middle-Aged to Older, Traditional, Very High
Income
Couples, with dependent children, who travel
fairly frequently and tend to visit friends and
family during holidays
Volume = 7.2% of total market
Value = INR 0.55 mn per person p.a.
Middle-Aged, Worldly, Very High Income
Couples
Couples, some with children, who travel very
frequently and stay in five star hotels fairly
regularly
Volume = 11.3% of total market
Value = INR 2.02 mn per person p.a.
Middle-Aged, Traditional and Exotic, High
Income Couples
Couples, with dependent children, the majority
of whom reside in other metros and travel
infrequently
Volume = 8.3% of total market
Value = INR 0.36 mn per person p.a.
Middle-Aged, Worldly, High Income Couples
Couples, with dependent children, who live
mainly in super and other metros, travel very
frequently
Volume = 5.2% of total market
Value = INR 1.04 mn per person p.a.
I
L
J
K
M
N
O

53 | Copyright © 2012 SA Tourism
Prioritisation of Consumer Segments
Criteria for Prioritisation
Identifying priority segments will likely involve considering current volume and value, as well as the segment’s
propensity to visit South Africa
ABILITY TO WIN
MARKET ATTRACTIVENESS High Low
High
Prioritisation Matrix
Propensity to come to South
Africa by segment:
– Recently considered visiting
South Africa again
– Recently visited South Africa,
would visit again (not
necessarily soon)
– Visited South Africa,
would visit again but not
recently considered
– Never visited South Africa, not
considered visiting recently
– Visited South Africa, but would
not visit again
Total Revenue by
segment:
– Existing volume
contribution
– Existing value
contribution
Frequency of Long-
hauls per annum
Expenditure per
Trip

54 | Copyright © 2012 SA Tourism
Source: Monitor and Grail Research and Analysis; ‘Quantitative Research Survey – India’, SAT, Jan 2012
Prioritisation of Consumer Segments
Prioritised Segments
I, F and C
~528,000 adults
K, B and D
~585,000 adults
High
Medium
Low
High Medium Low
Segments I, F and C are the three segments which will be prioritised, whilst segment D will also be analysed to
better understand the ability to win over the short-term within this segment
AB
ILIT
Y T
O W
IN
MARKET ATTRACTIVENESS
H
A
I
G
F
O
L
N
K
M
J
E
C
D
B
Higher ability to
win, can be
reached by spill-
over
Demands
higher effort
for potentially
higher
volumes
Legend
Bubble size
represents
volume of
segment
Prioritisation Matrix

55 | Copyright © 2012 SA Tourism
Table of Contents
Political and Economic Environment
Consumer Landscape
Travel and Tourism Landscape
Outbound Travel
Travel to South Africa
Consumer Segmentation
Seasoned Leisure Seekers

56 | Copyright © 2012 SA Tourism
Seasoned Leisure Seekers
General Overview
Seasoned Leisure Seekers are predominantly middle-aged couples with kids, residing in the super metros; they
have very high incomes, are well-educated and occupy mostly senior management positions in the workplace
8%
9%3%
11%
13%
13%
17%
26%
75% Male
25% Female
Other
5%
Grad /
Post-Grad
(Specialist)
72%
Grad /
Post-Grad
(General)
21%
Some
College
2%
Other
6%
Director
/ Upper
Mgmt
41%
Other
Mgmt
18%
Specialist
/ Pro-
fessional
30%
Self-
Employed
(Formal)
5%
11% Single
89% Married / Living Together
INR > 8.0 mn
32%
INR 6.0–8.0 mn
30%
INR 4.0–6.0 mn
38%
INR 2.5–4.0 mn INR 1.6–2.5 mn
Average Age: 36 years
Annual Household Income (INR)
16% Do Not Have Kids
69% Have Dependent Kids
11% Have Independent Kids
Current Role
City of Primary Residence
Highest Level of Education
96% Working Full Time
2% Working Part Time1
Other Cities
Ahmedabad
Chennai
Bangalore
Kolkata
Hyderabad
Mumbai
Delhi
Note: 1 Of the remaining percentage, 1% are unemployed, 1% are retired and 1% are housewives; Percentages may not add to 100% due to rounding; 2 Visited
both traditional destinations (e.g., Europe, United States, Australia) and exotic destinations (e.g., Africa, Mauritius, South America, North Asia)
Source: Monitor and Grail Analysis; “Quantitative Research Survey — India”, SAT, Jan 2012
Very high income,
thus none of
Seasoned Leisure
Seekers fall into
these brackets
Worldly2 Travellers
Perc
enta
ge
Perc
enta
ge
57 | Copyright © 2012 SA Tourism
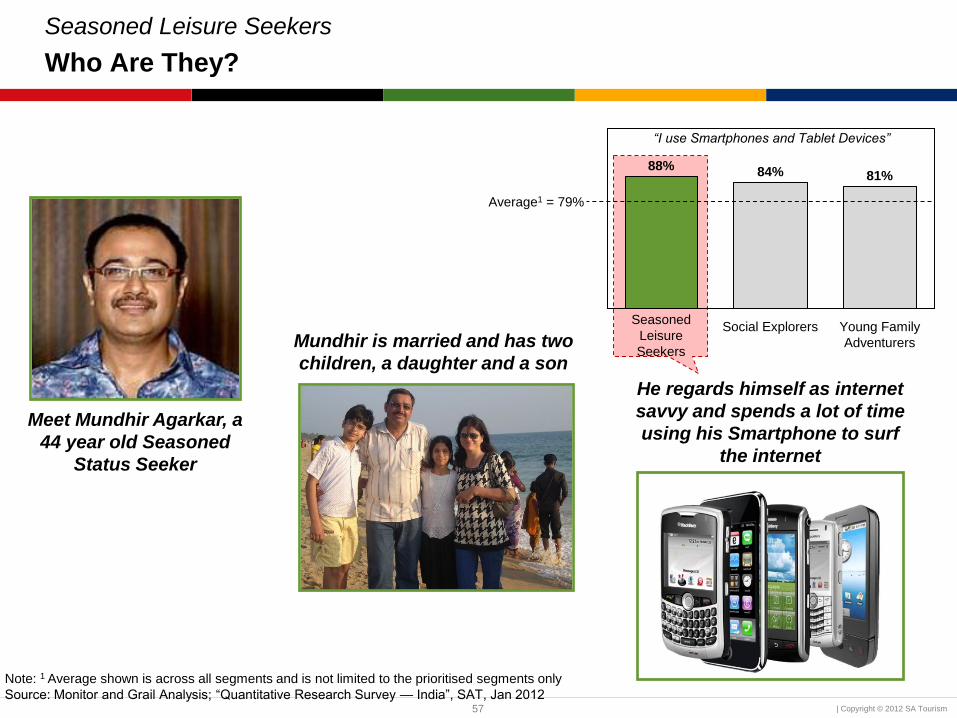
Seasoned Leisure Seekers
Who Are They?
Mundhir is married and has two
children, a daughter and a son
Meet Mundhir Agarkar, a
44 year old Seasoned
Status Seeker
He regards himself as internet
savvy and spends a lot of time
using his Smartphone to surf
the internet
Note: 1 Average shown is across all segments and is not limited to the prioritised segments only
Source: Monitor and Grail Analysis; “Quantitative Research Survey — India”, SAT, Jan 2012
Young Family
Adventurers
81%
Social Explorers
84%
Seasoned
Leisure
Seekers
88%
“I use Smartphones and Tablet Devices”
Average1 = 79%

58 | Copyright © 2012 SA Tourism
Seasoned Leisure Seekers
Typical Day
His job is very demanding
and his typical day is
stressful and frenetic
Mundhir works as a vice
president for a software
company
In the evening after work,
Mundhir enjoys watching
TV with his family,
specifically travel programs
Note: 1 Average shown is across all segments and is not limited to the prioritised segments only
Source: Monitor and Grail Analysis; “Quantitative Research Survey — India”, SAT, Jan 2012
Social Explorers
76%
Young Family
Adventurers
77%
Seasoned
Leisure
Seekers
91%
“I regularly watch TV travel programs or
documentaries”
Average1 = 82%
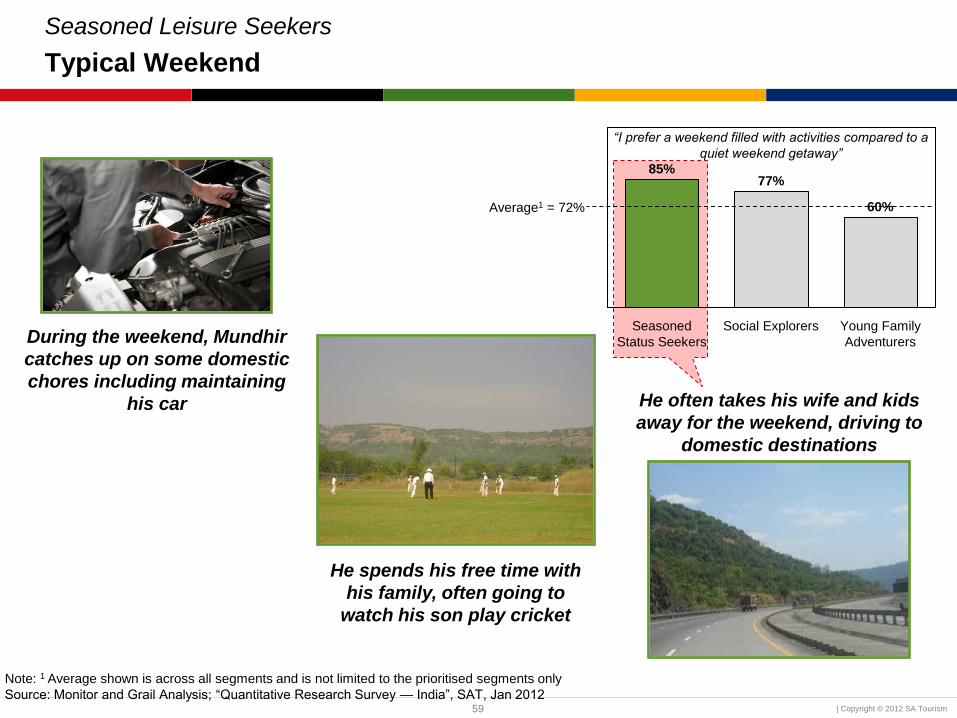
59 | Copyright © 2012 SA Tourism
Seasoned Leisure Seekers
Typical Weekend
He often takes his wife and kids
away for the weekend, driving to
domestic destinations
During the weekend, Mundhir
catches up on some domestic
chores including maintaining
his car
Note: 1 Average shown is across all segments and is not limited to the prioritised segments only
Source: Monitor and Grail Analysis; “Quantitative Research Survey — India”, SAT, Jan 2012
Young Family
Adventurers
60%
Social Explorers
77%
Seasoned
Status Seekers
85%
“I prefer a weekend filled with activities compared to a
quiet weekend getaway”
Average1 = 72%
He spends his free time with
his family, often going to
watch his son play cricket

60 | Copyright © 2012 SA Tourism
Seasoned Leisure Seekers are experienced travellers and thus look to derive the most out of their trips to new
destinations. They prefer having a full itinerary consisting of a wide range of activities that allow them to explore new
places while still enjoying some family time away from their usual busy lives.
Seasoned Leisure Seekers
Travel Mindset
Travelling allows Seasoned Leisure Seekers to spend time with their family, treating them to a memorable time;
when taking a leisure trip, they look for a wide range of activities including shopping and visiting natural attractions
I typically travel with my spouse and children, although on some trips my parents will
also join us. My family enjoys exploring a new destination where the experience is
different from what we have done before. When I return home I can impress my
friends with details of these new experiences. My spouse and I usually plan the
trip, although my children may influence the choice of destination.
I like to visit places that have many natural attractions and a wide range of
activities. At a destination, I look to explore its culture and heritage as I find it an
enriching experience that teaches me new things. Shopping is an important part of
the trip that everyone in the family enjoys. Indian cuisine is relatively important to me
Source: Monitor and Grail Analysis
I think South Africa has amazing
wildlife and natural beauty. Its
beaches and culture are also
great. I would be interested in
visiting the traditional villages in
South Africa; whilst in Kenya, I
visited the Masai Mara villages
and loved the experience. I do,
however, have some concerns
over safety.
Many of my friends have also
travelled to South Africa in the
past, visiting Cape Town,
Johannesburg and Durban.
They loved the wildlife and
shopping. They also enjoyed the
theme parks. Almost all of them
said that they would visit again if
they had the chance.
Motivators South Africa
Activities
I usually travel internationally two or three times a year. I enjoy going to places like
the United States, Australia and South Africa. The duration of my trip, usually two
weeks long, is determined by my travel budget and how much leave I have
available. I may also spend slightly shorter at a destination if it has a limited number
of activities. I tend to travel in May and June when my children are on holiday and
the weather in India is unbearably hot.
Travel Behaviour
and my family. Lastly, the destination should offer some
kind of adventure that the whole family can enjoy; things
like scuba diving, or mountain trail hiking are ideal.

61 | Copyright © 2012 SA Tourism
Seasoned Leisure Seekers
Products: What the Segment Looks For
These consumers seek well-located, good-quality accommodation; their trip should be filled with activities, the
majority of which are suitable for the whole family
WHAT KIND OF PRODUCTS DOES THIS SEGMENT LOOK FOR?
Length of Stay and Expenditure:
Seasoned Leisure Seekers would expect to stay ten to twelve
days in South Africa and spend between INR 175,000–225,000
per person (~USD 3,500–4,500)
Accommodation:
Seasoned Leisure Seekers look to stay in four-to-five star hotels
– Accommodation should be well-located and provide important
facilities such as internet access in your room, swimming
pool, gym, and preferably a spa
Type of Package:
Partial packages (flights, accommodation, airport transfer, limited
activities) are preferred as they allow the traveller an opportunity to
also do their own activities
– Tour guides should be included to provide local knowledge
Other:
The product should emphasise South Africa is a safe destination
The availability of Indian and vegetarian food in South Africa
should be noted
WHAT KIND OF ACTIVITIES WOULD THIS
SEGMENT LOOK FOR?
Seasoned Leisure Seekers like to have their trip
filled with activities. The activities need to be
suitable for the whole family. Potential activities
include:
– Exploring the country’s natural attractions,
including the Table Mountain, Cape Point,
Drakensberg mountains and game reserves
– Visiting historical sites and museums and
learning about local cultures and traditions
– Having fun with the entire family by taking part
in adventure activities such as water sports,
scuba diving or hiking
– Visiting theme parks and water parks such
as Gold Reef City and Ushaka Marine World
– Dining out or exploring the nightlife at the
V&A Waterfront or Sun City
– Shopping to purchase the latest designer
brands or local curios and souvenirs
Source: Monitor and Grail Analysis; Consumer Interviews and Focus Group Discussions, India, Feb 2012

62 | Copyright © 2012 SA Tourism
Seasoned Leisure Seekers
Source of Awareness and Booking Channels
Online media and social networking websites play an important role in the lives of Seasoned Leisure Seekers,
including in gathering travel-related information and as a booking channel
Source: Monitor and Grail Analysis
Media Consumption Travel-Related Information Booking Channels
Online media and social
networking websites plays
an important role in the
everyday lives of these
consumers
– In their leisure time, almost
half of this segment (49%
vs. 44% avg) spend the
most time on online
media compared to other
more traditional sources of
media, whilst ~19% (vs.
16% avg) spend the most
time on social networking
websites
Such a trend is expected,
given that nearly everyone in
this segment owns a smart-
phone (91% vs. 81% avg) and
almost half of the segment
own tablet devices (40% vs.
22% avg)
In terms of gathering travel-related
information, online media and
social networking websites play a
relatively more important role for this
segment than for other segments
– Online media is the primary
source of travel-related
information
– Social networking websites
play a relatively more
important role (10% vs. 3% avg)
Such travellers are interested in
exploring the destination, thus the
primary topic which they gather
information on is major tourist
attractions
– Gathering information on local
people and culture is relatively
more important for this segment
than for other segment (55% vs.
41% avg)
Online channels, including
travel websites, are viewed by
~45% of Seasoned Leisure
Seekers as the primary
channel for booking airfare
and accommodation
– Many of the consumers
prefer to book directly on
the airline’s or hotel’s
website rather than on the
travel agent’s website
Travel agents are treated
with scepticism as many
consumers find them to have
limited knowledge about a
destination
– Travel agents are however
preferred when Seasoned
Leisure Seekers are
visiting a destination for
the first time

63 | Copyright © 2012 SA Tourism
Table of Contents
Political and Economic Environment
Consumer Landscape
Travel and Tourism Landscape
Outbound Travel
Travel to South Africa
Consumer Segmentation
Social Explorers
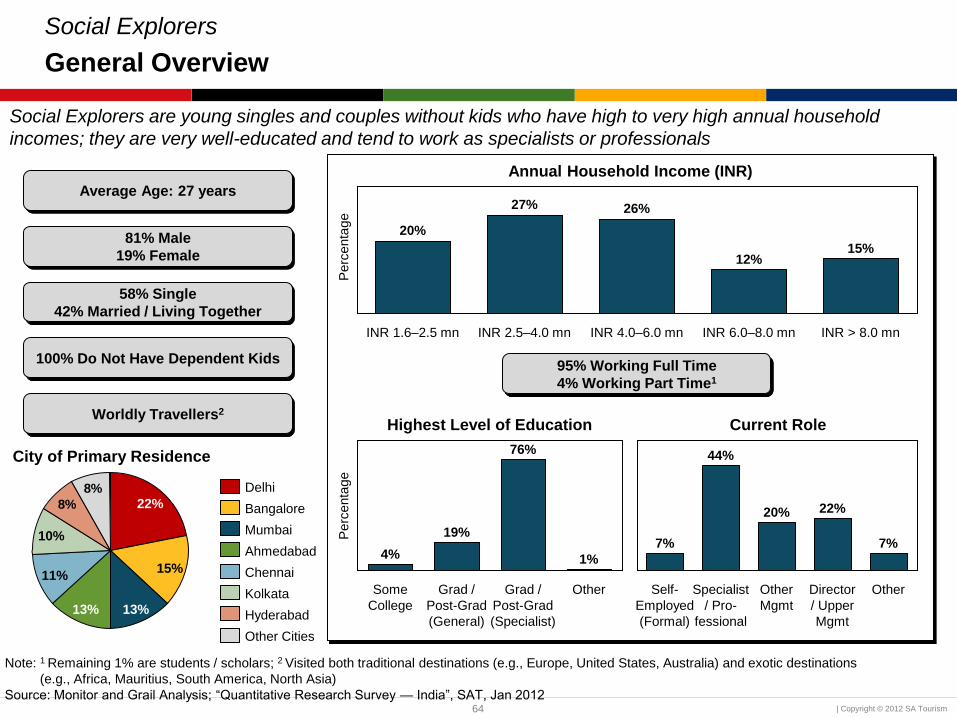
64 | Copyright © 2012 SA Tourism
Social Explorers
General Overview
Social Explorers are young singles and couples without kids who have high to very high annual household
incomes; they are very well-educated and tend to work as specialists or professionals
8%
8%
10%
11%
13% 13%
15%
22%
81% Male
19% Female
Other
1%
Grad /
Post-Grad
(Specialist)
76%
Grad /
Post-Grad
(General)
19%
Some
College
4%
Other
7%
Director
/ Upper
Mgmt
22%
Other
Mgmt
20%
Specialist
/ Pro-
fessional
44%
Self-
Employed
(Formal)
7%
58% Single
42% Married / Living Together
INR > 8.0 mn
15%
INR 6.0–8.0 mn
12%
INR 4.0–6.0 mn
26%
INR 2.5–4.0 mn
27%
INR 1.6–2.5 mn
20%
Average Age: 27 years
Annual Household Income (INR)
100% Do Not Have Dependent Kids
Current Role
City of Primary Residence
Highest Level of Education
95% Working Full Time
4% Working Part Time1
Other Cities
Hyderabad
Kolkata
Chennai
Ahmedabad
Mumbai
Bangalore
Delhi
Note: 1 Remaining 1% are students / scholars; 2 Visited both traditional destinations (e.g., Europe, United States, Australia) and exotic destinations
(e.g., Africa, Mauritius, South America, North Asia)
Source: Monitor and Grail Analysis; “Quantitative Research Survey — India”, SAT, Jan 2012
Worldly Travellers2
Perc
enta
ge
Perc
enta
ge

65 | Copyright © 2012 SA Tourism
Social Explorers
Who Are They?
Parthiv recently completed his
MBA and has been working for a
year at a bank. Parthiv is
unmarried
Meet Parthiv Jhonsa, a
24 year old Social
Explorer
Parthiv considers himself as
trendy and tends to keep up
with the latest fashion styles
Note: 1 Average shown is across all segments and is not limited to the prioritised segments only
Source: Monitor and Grail Analysis; “Quantitative Research Survey — India”, SAT, Jan 2012
77%
Young Family
Adventurers
Social
Explorers
80%
Seasoned
Status Seekers
82%
“I keep up with fashion trends”
Average1 = 73%
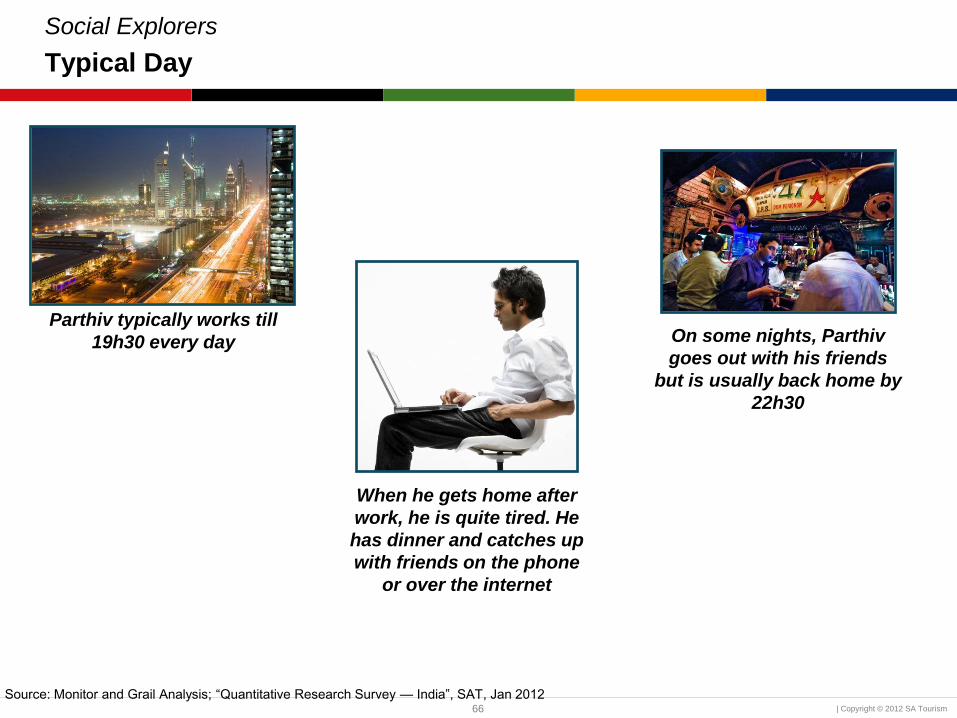
66 | Copyright © 2012 SA Tourism
Social Explorers
Typical Day
When he gets home after
work, he is quite tired. He
has dinner and catches up
with friends on the phone
or over the internet
Parthiv typically works till
19h30 every day On some nights, Parthiv
goes out with his friends
but is usually back home by
22h30
Source: Monitor and Grail Analysis; “Quantitative Research Survey — India”, SAT, Jan 2012

67 | Copyright © 2012 SA Tourism
Social Explorers
Typical Weekend
Sundays are spent catching
up with his family at home
He spends the rest of
Saturdays with his friends,
going to the movies or out for
drinks
Saturdays are half work days
for Parthiv, where he usually
works until 14h00
Source: Monitor and Grail Analysis; “Quantitative Research Survey — India”, SAT, Jan 2012
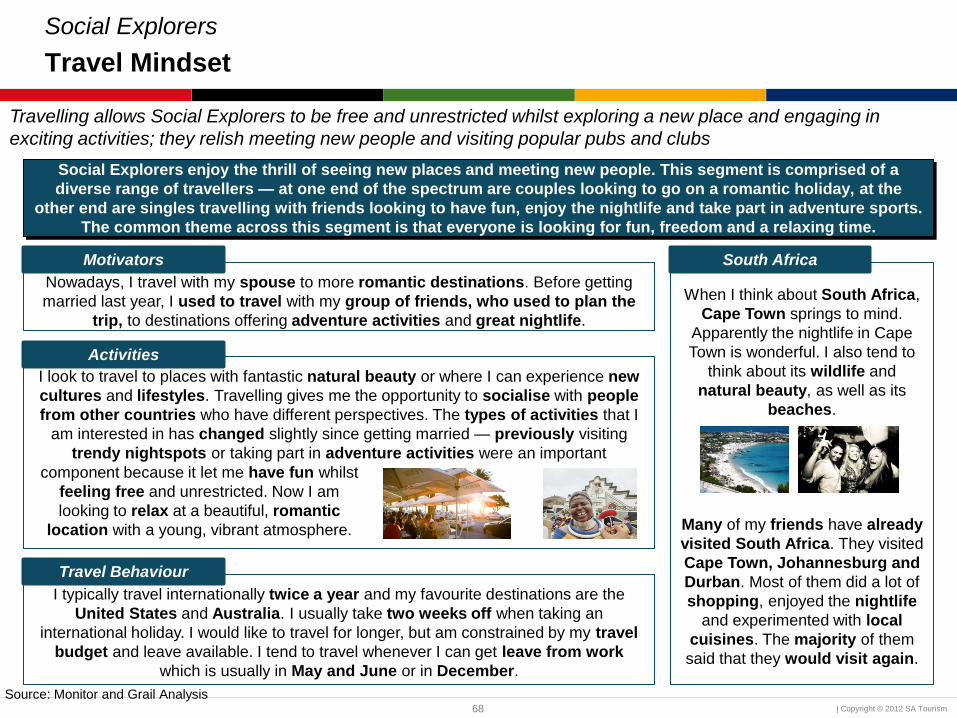
68 | Copyright © 2012 SA Tourism
Social Explorers
Travel Mindset
Travelling allows Social Explorers to be free and unrestricted whilst exploring a new place and engaging in
exciting activities; they relish meeting new people and visiting popular pubs and clubs
Nowadays, I travel with my spouse to more romantic destinations. Before getting
married last year, I used to travel with my group of friends, who used to plan the
trip, to destinations offering adventure activities and great nightlife.
I look to travel to places with fantastic natural beauty or where I can experience new
cultures and lifestyles. Travelling gives me the opportunity to socialise with people
from other countries who have different perspectives. The types of activities that I
am interested in has changed slightly since getting married — previously visiting
trendy nightspots or taking part in adventure activities were an important
Source: Monitor and Grail Analysis
When I think about South Africa,
Cape Town springs to mind.
Apparently the nightlife in Cape
Town is wonderful. I also tend to
think about its wildlife and
natural beauty, as well as its
beaches.
Many of my friends have already
visited South Africa. They visited
Cape Town, Johannesburg and
Durban. Most of them did a lot of
shopping, enjoyed the nightlife
and experimented with local
cuisines. The majority of them
said that they would visit again.
Motivators South Africa
Activities
I typically travel internationally twice a year and my favourite destinations are the
United States and Australia. I usually take two weeks off when taking an
international holiday. I would like to travel for longer, but am constrained by my travel
budget and leave available. I tend to travel whenever I can get leave from work
which is usually in May and June or in December.
Travel Behaviour
component because it let me have fun whilst
feeling free and unrestricted. Now I am
looking to relax at a beautiful, romantic
location with a young, vibrant atmosphere.
Social Explorers enjoy the thrill of seeing new places and meeting new people. This segment is comprised of a
diverse range of travellers — at one end of the spectrum are couples looking to go on a romantic holiday, at the
other end are singles travelling with friends looking to have fun, enjoy the nightlife and take part in adventure sports.
The common theme across this segment is that everyone is looking for fun, freedom and a relaxing time.
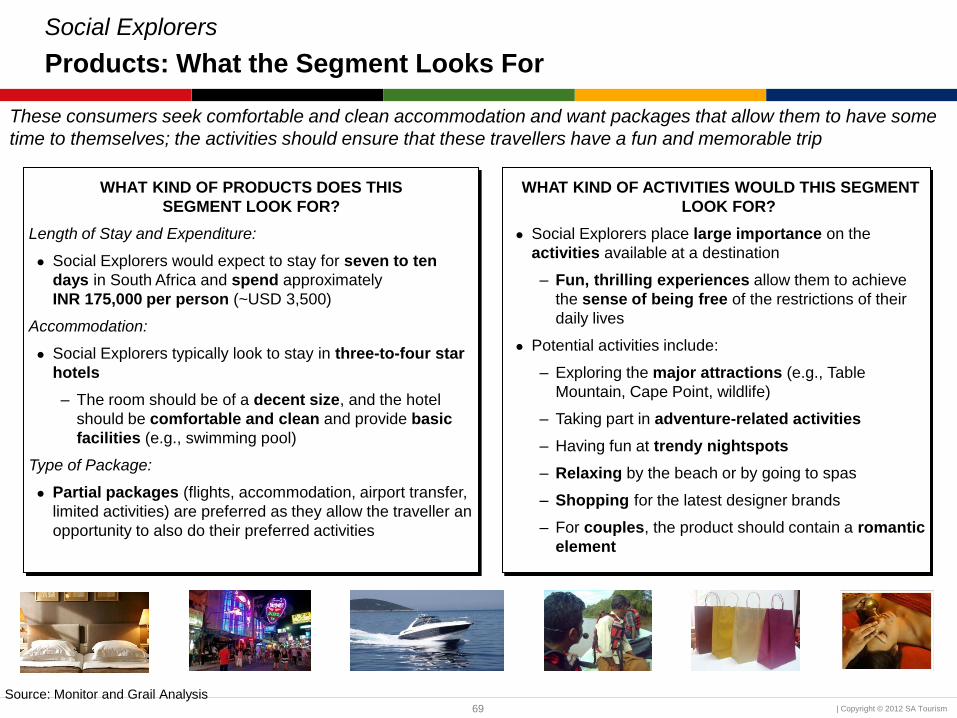
69 | Copyright © 2012 SA Tourism
Social Explorers
Products: What the Segment Looks For
These consumers seek comfortable and clean accommodation and want packages that allow them to have some
time to themselves; the activities should ensure that these travellers have a fun and memorable trip
Source: Monitor and Grail Analysis
WHAT KIND OF PRODUCTS DOES THIS
SEGMENT LOOK FOR?
Length of Stay and Expenditure:
Social Explorers would expect to stay for seven to ten
days in South Africa and spend approximately
INR 175,000 per person (~USD 3,500)
Accommodation:
Social Explorers typically look to stay in three-to-four star
hotels
– The room should be of a decent size, and the hotel
should be comfortable and clean and provide basic
facilities (e.g., swimming pool)
Type of Package:
Partial packages (flights, accommodation, airport transfer,
limited activities) are preferred as they allow the traveller an
opportunity to also do their preferred activities
WHAT KIND OF ACTIVITIES WOULD THIS SEGMENT
LOOK FOR?
Social Explorers place large importance on the
activities available at a destination
– Fun, thrilling experiences allow them to achieve
the sense of being free of the restrictions of their
daily lives
Potential activities include:
– Exploring the major attractions (e.g., Table
Mountain, Cape Point, wildlife)
– Taking part in adventure-related activities
– Having fun at trendy nightspots
– Relaxing by the beach or by going to spas
– Shopping for the latest designer brands
– For couples, the product should contain a romantic
element

70 | Copyright © 2012 SA Tourism
Social Explorers
Source of Awareness and Booking Channels
Travel agents are an important source of travel-related information for Social Explorers, with these consumers
typically comparing deals across different providers in order to find the best value-for-money offer
Source: Monitor and Grail Analysis
Media Consumption Travel-Related Information Booking Channels
Social Explorers are fairly
representative of wealthy,
Indian long-haul traveller
in terms of the media
channels which they use
the most during their
leisure time
– The majority of Social
Explorers spend the
most time on online
media (46% vs. 44%
avg), television (19%
vs. 23% avg) and
social networking
websites (14% vs. 16%
avg)
The majority of this
segment own a smart-
phone (92% vs. 81% avg)
however not many Social
Explorers own a tablet
(29% vs. 22% avg)
“Word of mouth” and online media
are the primary sources used to
gather travel-related information
– Travel agents are regularly used
to gain a basic understanding of
potential destinations, thus they
are regarded as a relatively more
important source (12% vs. 9%
avg) for Social Explorers than for
other segments
Social Explorers are interested in
having fun at the destination, rather
than gaining a deep understanding of
the country’s cultural or historical side,
thus topics which they gather
information on include the essentials,
such as accommodation and
weather at the destination
– Understanding the cost of
activities is relatively more
important for this segment than for
other segment (59% vs. 50% avg)
Social Explorers look for
the deal offering the best
value-for-money and will
typically compare
websites and quotes of
various airlines, hotels and
travel agents before
deciding on the best option
Online channels, including
travel websites, are viewed
by ~45% of Social
Explorers as the primary
channel for booking
airfare and
accommodation
– Booking directly on
the airline’s or hotel’s
website is the preferred
option when booking
airfare or
accommodation
respectively
71 | Copyright © 2012 SA Tourism
Table of Contents
Political and Economic Environment
Consumer Landscape
Travel and Tourism Landscape
Outbound Travel
Travel to South Africa
Consumer Segmentation
Young Family Adventurers
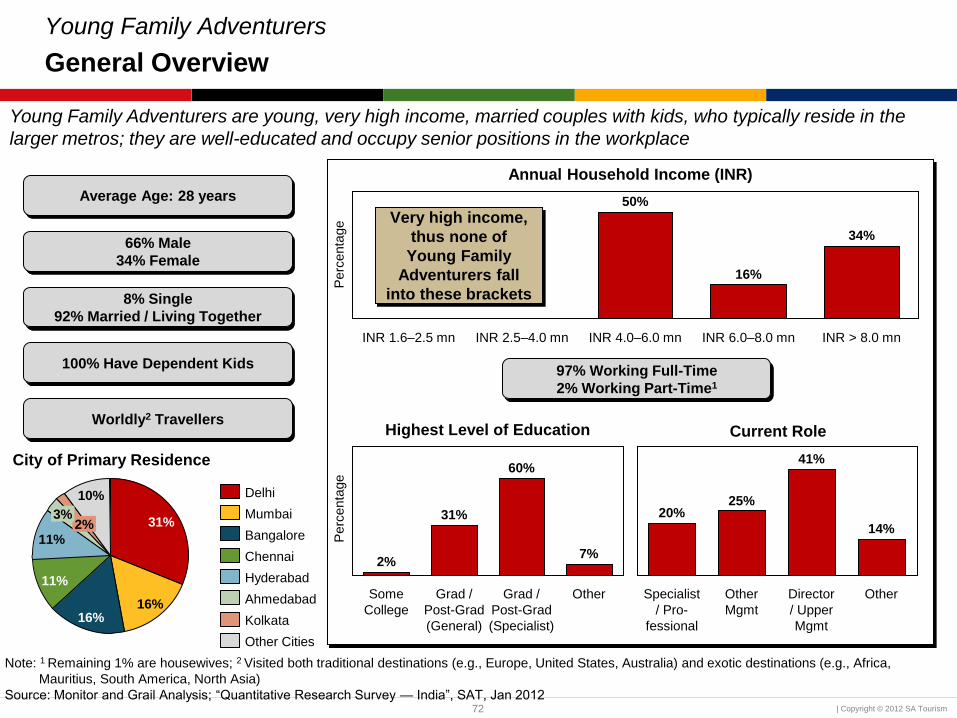
72 | Copyright © 2012 SA Tourism
Young Family Adventurers
General Overview
Young Family Adventurers are young, very high income, married couples with kids, who typically reside in the
larger metros; they are well-educated and occupy senior positions in the workplace
10%
2% 3%
11%
11%
16% 16%
31%
66% Male
34% Female
Other
7%
Grad /
Post-Grad
(Specialist)
60%
Grad /
Post-Grad
(General)
31%
Some
College
2%
Other
14%
Director
/ Upper
Mgmt
41%
Other
Mgmt
25%
Specialist
/ Pro-
fessional
20%
8% Single
92% Married / Living Together
INR > 8.0 mn
34%
INR 6.0–8.0 mn
16%
INR 4.0–6.0 mn
50%
INR 2.5–4.0 mn INR 1.6–2.5 mn
Average Age: 28 years
Annual Household Income (INR)
100% Have Dependent Kids
Current Role
City of Primary Residence
Highest Level of Education
97% Working Full-Time
2% Working Part-Time1
Other Cities
Kolkata
Ahmedabad
Hyderabad
Chennai
Bangalore
Mumbai
Delhi
Note: 1 Remaining 1% are housewives; 2 Visited both traditional destinations (e.g., Europe, United States, Australia) and exotic destinations (e.g., Africa,
Mauritius, South America, North Asia)
Source: Monitor and Grail Analysis; “Quantitative Research Survey — India”, SAT, Jan 2012
Very high income,
thus none of
Young Family
Adventurers fall
into these brackets
Worldly2 Travellers
Perc
enta
ge
Perc
enta
ge

73 | Copyright © 2012 SA Tourism
Young Family Adventurers
Who Are They?
Ravi has been married for five
years and has a three year old
son
Meet Ravi Shehri, a 30
year old Young Family
Adventurer
Every morning Ravi reads the
newspaper for 30 minutes with
particular interest in world news
Note: 1 Average shown is across all segments and is not limited to the prioritised segments only
Source: Monitor and Grail Analysis; “Quantitative Research Survey — India”, SAT, Jan 2012
Social
Explorers
100%
Young Family
Adventurers
95%
Seasoned
Status Seekers
93%
“I keep abreast of recent happenings across the globe
through TV / Radio / Newspapers / Magazines”
Average1 = 91%

74 | Copyright © 2012 SA Tourism
Young Family Adventurers
Typical Day
His day revolves around his
work hours which depend
on the country in which his
project is based
Ravi is an IT manager who
must meet constant
deadlines at work
Most of his projects are
based out of the United
States, thus his days start
later. By the time he comes
home, his son is already
asleep
Source: Monitor and Grail Analysis; “Quantitative Research Survey — India”, SAT, Jan 2012

75 | Copyright © 2012 SA Tourism
Young Family Adventurers
Typical Weekend
Ravi also enjoys eating out
with his wife and friends and
does so regularly on
weekends
The family often spends
Saturday afternoon at the
local mall, shopping or
watching a movie
Weekends provide an
opportunity for Ravi to spend
quality time with his family
Note: 1 Average shown is across all segments and is not limited to the prioritised segments only
Source: Monitor and Grail Analysis; “Quantitative Research Survey — India”, SAT, Jan 2012
Young Family
Adventurers
Social
Explorers
79% 77% 77%
Seasoned
Status Seekers
“I eat out at least three times a week”
Average1 = 65%

76 | Copyright © 2012 SA Tourism
With the increased responsibility of a young family, Young Family Adventurers are interested in broadening their
horizons and exploring new cultures and traditions, whilst having fun and spending some quality time with their
family. Finally, travelling relaxes and rejuvenates them, providing new impetus when they return to work.
Young Family Adventurers
Travel Mindset
Travel is a way for Young Family Adventurers to bond with their families while exploring new cultures and places; it
also offers a chance to spend time away from their busy and stressful daily lives, relaxing and rejuvenating
When I travel, I look for a place that will let me spend quality time with my young
family, exploring the destination. My spouse and I plan the trip, although my child may
influence the destination. I like to increase my knowledge about the destination, thus,
when I return home I have a sense of achievement because I have learnt new things.
The activities at the destination should be suitable for the whole family. Once at a
destination, I love to explore the country, see the beautiful scenery and be close to
nature. In addition, relaxing and shopping are a must whilst adventure activities,
Source: Monitor and Grail Analysis
South Africa strikes me as a
beautiful place with great
wildlife and safaris. I also think it
has rich culture and heritage,
which is appealing to me. My one
concern is the safety and
security of my family.
Friends who have visited South
Africa went to Cape Town,
Johannesburg, Durban and Sun
City. They did a lot of shopping,
visited some theme parks, and
relaxed on the beach. Most of
them said it was a good
experience and that they would
visit again.
Motivators South Africa
Activities
such as water-skiing or snorkelling, are always fun for my
husband and myself. My children love to visit theme
parks, which my spouse and I also enjoy. When travelling
I like to visit monuments and cultural attractions.
I typically travel internationally four to five times a year and my favourite
destinations are Australia, the United States and Switzerland. My international trips
are typically two weeks long. I would like to travel for longer, but am constrained by
my leave available and my travel budget. The best time of the year for international
trips is between April and June because India is hot during these months and it is a
good time to be away.
Travel Behaviour

77 | Copyright © 2012 SA Tourism
Young Family Adventurers
Products: What the Segment Looks For
These consumers seek decent, clean accommodation which is not necessarily lavish but should be child-friendly;
activities should be structured to provide a relaxing time with many family-orientated activities
WHAT KIND OF PRODUCTS DOES THIS SEGMENT LOOK FOR?
Length of Stay and Expenditure:
Young Family Adventurers would expect to stay for seven to ten
days in South Africa and spend between INR 150,000–200,000
per person (~USD 3,000–4,000)
Accommodation:
Young Family Adventurers look to stay in 3-star hotels
– Accommodation should be comfortable and clean and
provide basic facilities (e.g., swimming pool)
– Such travellers also regularly stay in guesthouses and BnBs
Type of Package:
The trip should not be a whirlwind tour of South Africa as such
travellers prefer to take their time to fully explore the destination
– Partial packages should be offered (flights, accommodation,
airport transfer, limited activities)
Other:
A major concern may be safety and security — the product
should emphasise South Africa is a safe destination
Source: Monitor and Grail Analysis; Consumer Interviews and Focus Group Discussions, India, Feb 2012
WHAT KIND OF ACTIVITIES WOULD THIS
SEGMENT LOOK FOR?
Young Family Adventurers seek a wide variety
of activities, with the majority of these activities
appealing to the entire family
Potential activities include:
– Visiting South Africa’s major attractions
whilst learning about the country’s culture
and heritage
– Exploring the country’s scenic beauty,
including the Table Mountain, Cape Point
and game reserves
– Relaxing by the beach
– Having fun with the entire family at theme
parks and water worlds
– Participating with your spouse in adventure
activities such as scuba diving, hot-air
ballooning and water sports

78 | Copyright © 2012 SA Tourism
Young Family Adventurers
Source of Awareness and Booking Channels
More traditional media channels are relatively more important for Young Family Adventurers than for other
segments, including to gather travel-related information, with travel agents often used as a booking channel
Source: Monitor and Grail Analysis
Media Consumption Travel-Related Information Booking Channels
Young Family Adventurers keep
up-to-date with the latest
technology, with the majority of
this segment owning a smart-
phone (94% vs. 81% avg) and
47% of the segment (vs. 22% avg)
owning a tablet device
Online media plays an important
role in the everyday lives of these
consumers, but not as important
as for other consumers, with
traditional media channels
featuring more prominently than
for other segments
– In their leisure time, 39% of
this segment (vs. 44% avg)
spend the most time on online
media, whilst 18% (vs. 12%
avg) spend the most time
reading newspapers or
magazines and 6% (vs. 1%
avg) spend the most time
listening to the radio
In terms of gathering travel-
related information, “word of
mouth” is the primary source
however more traditional media
play a relatively more important
role than for other segments
– Newspapers and magazines
and radio are each regarded
as the primary source by 8%
of this segment (vs. 5% avg
and 2% avg respectively)
Such travellers are interested in
exploring and learning about
the destination, thus they seek
information about its major
tourist attractions and activities
– Gathering information on
major tourist attractions
(76% vs. 70% avg) and on
activities to do (53% vs. 44%
avg) are relatively more
important for this segment
than for other segments
Travel agents are frequently
used due to the convenience
factor which they provide,
even though travel agents may
be more expensive
– Young Family Adventurers
lead busy lives thus some
of these consumers are
willing to pay a premium for
someone else to handle
their travel-related issues
– Flights are usually booked
during personal visits to
the travel agent with
accommodation booked
over the telephone (either
through the travel agent, or
directly with the hotel)
Online channels, including
travel websites, are used by
only ~30% of Young Family
Adventurers

79 | Copyright © 2012 SA Tourism
Table of Contents
Political and Economic Environment
Consumer Landscape
Travel and Tourism Landscape
Outbound Travel
Travel to South Africa
Consumer Segmentation
Messages, Channels and Experiences

80 | Copyright © 2012 SA Tourism
Centre of Gravity
Recommended Messaging: Centre of Gravity
Source: Monitor and Grail Analysis
The Centre of Gravity will ensure that a message is communicated that Indian travellers from the three priority
segments are able to identify with
SAT’s Centre of Gravity in India
The Centre of Gravity (CoG) is the area in which the
travel behaviour of Indian consumers from different
segments intersect
By positioning South Africa as a destination within this
CoG, ensures that a message that resonates in some
way with Indian travellers from priority segments is
communicated
Messaging is based on …
…the key drivers of one’s travel behaviour:
Seasoned Status
Seekers
Young
Family
Adventurers
Social
Explorers
CoG
CoG
…and targeted towards:
Purpose of Travel
Travel Planners Travel
Companions
Experience
Sought
Activities
Undertaken

81 | Copyright © 2012 SA Tourism
Shopping
Beach Eating at
Restaurants Exploring Wildlife / Safari
Alone Tour Group Colleagues Kids
Aged 10–18
Alone Business Tour Groups
Travel Agent /
Tour Operator Colleagues
Company Travel
Desk
Travel Agent Business
Kids
Aged< 18 Family Parents
Shopping —
Personal
Exploration
Holiday VFR
Online — Travel
Agent / Operator Personal Visit — Travel
Agent / Operator
Personal Visit —
Airline / Hotel
Travel Booking
Websites
Telephone —
Airline / Hotel
Telephone — Travel
Agent / Operator Online – Airline /
Hotel
Centre of Gravity
Recommended Messaging: Buying Process
Word of Mouth
Online
News, Articles,
Webpages, Blogs Radio
Television Travel Magazines
and Booklets Newspapers /
Magazines
Social Networking
Websites
Travel Agents /
Tour Operators
Travel Booking /
Review Websites
Sport
Spectator
Special
Event Backpacking Religious Other
Experience
Sought
Activities
Undertaken
Travel
Companions
Purchase
Channel
Primary
Information
Source
Travel
Planners
Online Personal Visit Telephone
Word of Mouth Mass Media Internet Travel Agent
Multipurpose Driven by Personal Need
Legend: Young Family Adventurers Social Explorers Seasoned Leisure Seekers
Adventure
Holiday
Romantic
Holiday
Family
Holiday
Purpose of
Travel —
Primary
Leisure
Family
Self Spouse Friends
Friends Self
Spouse Kids Aged< 10 Family Friends Parents
Friends Family
Explore New Places,
People and Different
Cultures / Traditions Adventure
Natural / Scenic
Beauty Fun Family Time
Escapism /
Relaxation
Cultural,
Historical and
Heritage Adventure Theme Parks
Natural
Attractions Shopping Nightlife
Source: Monitor and Grail Analysis; “Quantitative Research Survey — India”, SAT, Jan 2012

82 | Copyright © 2012 SA Tourism
Centre of Gravity
Recommended Messaging: Common Themes
Source: Monitor and Grail Analysis
The priority segments share a desire to explore a unique destination that has a diverse range of activities,
providing an entertaining as well as relaxing holiday; quality family time is important for two of the segments
Seasoned Leisure Seekers
Communications to Seasoned
Leisure Seekers must position South
Africa as an aspirational destination
that sets travellers apart from their
friends and colleagues; and as a
family-friendly destination that is
unique and distinctive and thus
provides families with the opportunity
to explore somewhere new whilst
having fun
Social Explorers
Communications to Social Explorers
must position South Africa as a fun
and vibrant destination which offers
something for everyone; an ideal
destination for those wishing to
explore somewhere new. It
provides the opportunity for these
young travellers seeking relaxation
to escape their daily lives
Young Family Adventurers
Communications to Young Family
Adventurers should position South
Africa as a destination where
families can spend quality time
together, having fun, escaping their
stressful daily lives, and broadening
their horizons by exploring this
unique destination
South Africa has a diversity of
offerings, including amazing
natural beauty and wildlife,
ensuring that Seasoned Leisure
Seekers are entertained
throughout their trip
It provides an opportunity to
explore somewhere new and
experience a destination that is
far-removed from India
South Africa, with its wide array
of activities, caters for diverse
needs of Social Explorers
The country’s unique natural
attractions and vibrant culture
provide an opportunity for new
experiences
South Africa allows Social
Explorers to escape their daily
lives and have a fun and relaxing
time
South Africa is an ideal destination
for families to spend quality
family time together, escaping
their frantic lifestyles, and
providing much-needed rest,
relaxation and rejuvenation
The country’s unique culture and
heritage allow parents to broaden
their horizons and learn about a
new country and its culture whilst
ensuring their family is
entertained

83 | Copyright © 2012 SA Tourism
Centre of Gravity
Recommended Messaging: Experience (1 of 2)
Source: Monitor and Grail Analysis
Common themes in the communication messages include quality family time, escapism and relaxation . . .
Quality family time is important to
Indians — travelling provides an
opportunity to spend time together
bonding as a family, away from the
hustle and bustle of everyday lives
Escapism and relaxation is a
priority for Indians — travelling
provides a much-needed break from
work with the traveller returning home
rested and rejuvenated
Seasoned Leisure Seekers and
Young Family Adventurers seek
family holidays with their spouse
and children
– Their time on holiday provides
an opportunity to bond
together in an environment far
removed from their frantic lives
back home
– Such travellers seek a
destination which has activities
for the whole family
Family plays an important role in
the everyday lives of Social
Explorers however these
consumers are looking for a fun
and exciting holiday with their
spouse, partner or friends and
thus do not necessarily always
travel with their family
Relaxation and escaping their
busy lives is key for travellers from
each of these three segments
– Such travellers are looking for
rest and relaxation, enabling
them to return from their
holiday rejuvenated and ready
for another stint of hard work
Relaxation for many of these
consumers means removing
oneself from one’s busy life, and
travelling to a destination where
one is not bothered with work-
related phone calls and emails,
and is able to enjoy the peace and
quiet in a beautiful setting
Social Explorers are also looking
to escape the restrictions and
limitations of their daily lives, and
enjoy themselves whilst on holiday
1 2
Seasoned Status
Seekers
Young
Family
Adventurers
Social
Explorers
CoG
Experience
Sought
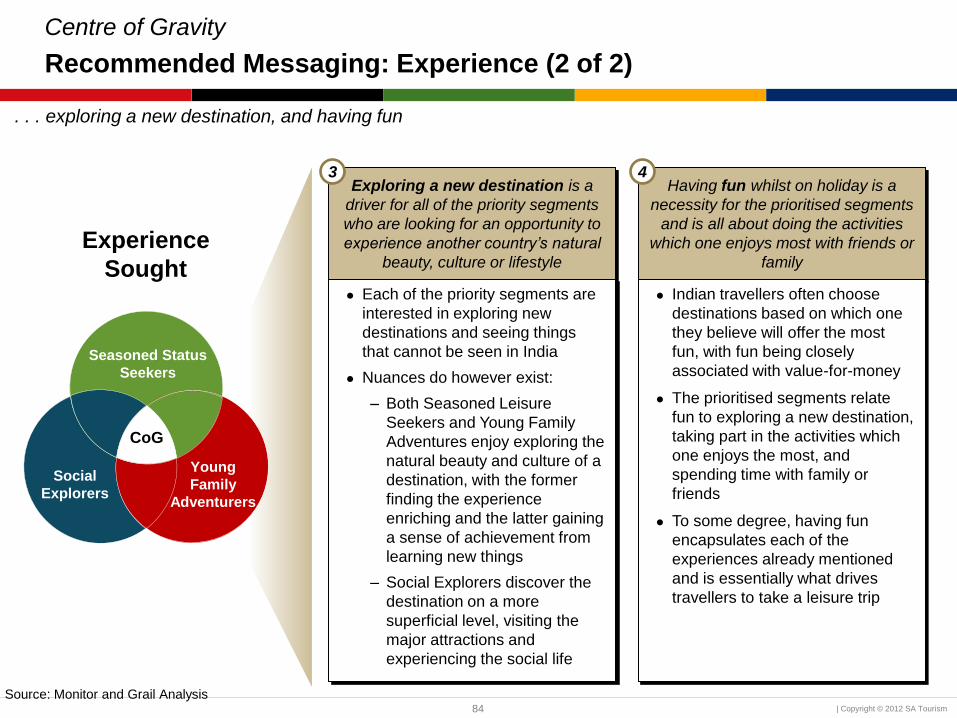
84 | Copyright © 2012 SA Tourism
Centre of Gravity
Recommended Messaging: Experience (2 of 2)
. . . exploring a new destination, and having fun
Source: Monitor and Grail Analysis
Exploring a new destination is a
driver for all of the priority segments
who are looking for an opportunity to
experience another country’s natural
beauty, culture or lifestyle
Having fun whilst on holiday is a
necessity for the prioritised segments
and is all about doing the activities
which one enjoys most with friends or
family
Each of the priority segments are
interested in exploring new
destinations and seeing things
that cannot be seen in India
Nuances do however exist:
– Both Seasoned Leisure
Seekers and Young Family
Adventures enjoy exploring the
natural beauty and culture of a
destination, with the former
finding the experience
enriching and the latter gaining
a sense of achievement from
learning new things
– Social Explorers discover the
destination on a more
superficial level, visiting the
major attractions and
experiencing the social life
Indian travellers often choose
destinations based on which one
they believe will offer the most
fun, with fun being closely
associated with value-for-money
The prioritised segments relate
fun to exploring a new destination,
taking part in the activities which
one enjoys the most, and
spending time with family or
friends
To some degree, having fun
encapsulates each of the
experiences already mentioned
and is essentially what drives
travellers to take a leisure trip
3 4
Seasoned Status
Seekers
Young
Family
Adventurers
Social
Explorers
CoG
Experience
Sought

85 | Copyright © 2012 SA Tourism
Centre of Gravity
Summary of Experience Sought
Thus the communication message needs to capture the essence of each of these four key experiences sought
Quality family time
1
Escapism and relaxation Exploring a new
destination Fun
2 3 4
… the opportunity to bond
uninterrupted with your
spouse and children
… being able to get away
from your daily
schedule and your
busy life, and not
having to think about
work
… seeing things you
cannot see in India
such as unique natural
attractions, and
different cultures and
lifestyles
… exploring a new
destination and doing
activities which you
enjoy the most, with the
people most important
in your life
Source: Monitor and Grail Analysis
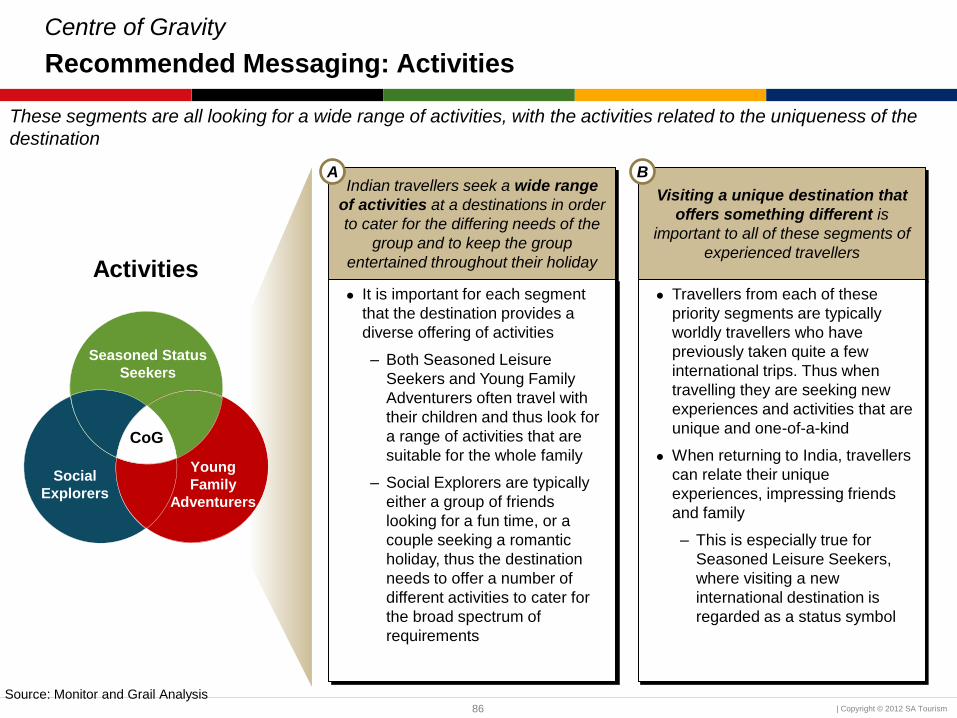
86 | Copyright © 2012 SA Tourism
Centre of Gravity
Recommended Messaging: Activities
These segments are all looking for a wide range of activities, with the activities related to the uniqueness of the
destination
Source: Monitor and Grail Analysis
Indian travellers seek a wide range
of activities at a destinations in order
to cater for the differing needs of the
group and to keep the group
entertained throughout their holiday
Visiting a unique destination that
offers something different is
important to all of these segments of
experienced travellers
It is important for each segment
that the destination provides a
diverse offering of activities
– Both Seasoned Leisure
Seekers and Young Family
Adventurers often travel with
their children and thus look for
a range of activities that are
suitable for the whole family
– Social Explorers are typically
either a group of friends
looking for a fun time, or a
couple seeking a romantic
holiday, thus the destination
needs to offer a number of
different activities to cater for
the broad spectrum of
requirements
Travellers from each of these
priority segments are typically
worldly travellers who have
previously taken quite a few
international trips. Thus when
travelling they are seeking new
experiences and activities that are
unique and one-of-a-kind
When returning to India, travellers
can relate their unique
experiences, impressing friends
and family
– This is especially true for
Seasoned Leisure Seekers,
where visiting a new
international destination is
regarded as a status symbol
A B
Seasoned Status
Seekers
Young
Family
Adventurers
Social
Explorers
CoG
Activities
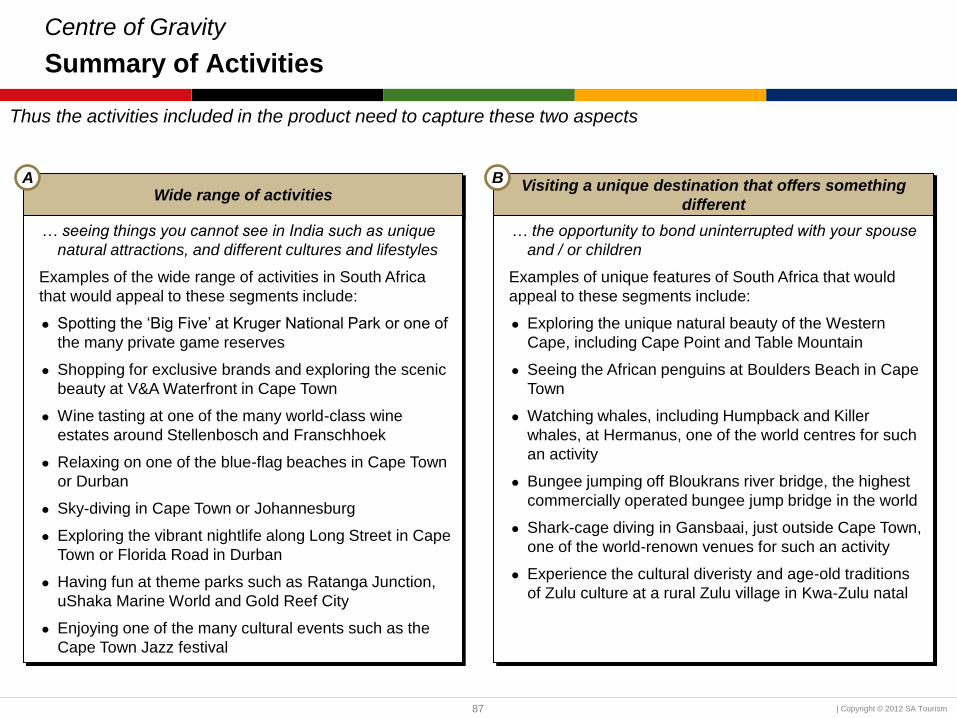
87 | Copyright © 2012 SA Tourism
Centre of Gravity
Summary of Activities
Thus the activities included in the product need to capture these two aspects
Wide range of activities A
Visiting a unique destination that offers something
different
B
… seeing things you cannot see in India such as unique
natural attractions, and different cultures and lifestyles
Examples of the wide range of activities in South Africa
that would appeal to these segments include:
Spotting the ‘Big Five’ at Kruger National Park or one of
the many private game reserves
Shopping for exclusive brands and exploring the scenic
beauty at V&A Waterfront in Cape Town
Wine tasting at one of the many world-class wine
estates around Stellenbosch and Franschhoek
Relaxing on one of the blue-flag beaches in Cape Town
or Durban
Sky-diving in Cape Town or Johannesburg
Exploring the vibrant nightlife along Long Street in Cape
Town or Florida Road in Durban
Having fun at theme parks such as Ratanga Junction,
uShaka Marine World and Gold Reef City
Enjoying one of the many cultural events such as the
Cape Town Jazz festival
… the opportunity to bond uninterrupted with your spouse
and / or children
Examples of unique features of South Africa that would
appeal to these segments include:
Exploring the unique natural beauty of the Western
Cape, including Cape Point and Table Mountain
Seeing the African penguins at Boulders Beach in Cape
Town
Watching whales, including Humpback and Killer
whales, at Hermanus, one of the world centres for such
an activity
Bungee jumping off Bloukrans river bridge, the highest
commercially operated bungee jump bridge in the world
Shark-cage diving in Gansbaai, just outside Cape Town,
one of the world-renown venues for such an activity
Experience the cultural diveristy and age-old traditions
of Zulu culture at a rural Zulu village in Kwa-Zulu natal

88 | Copyright © 2012 SA Tourism
Centre of Gravity
Recommended Messaging

89 | Copyright © 2012 SA Tourism
Young Family Adventurers Social Explorers Seasoned Leisure Seekers
Centre of Gravity
Products and Activities (1 of 3)
Source: Monitor and Grail Analysis
These travellers are looking for partial packages with a trip length of between seven and twelve days, a spend of
~INR 175,000 per person and three to five star hotels. Safety and cuisine are priorities for the family segments
Pro
du
cts
A
cti
vit
ies
Enjoy having a full itinerary filled
with a wide variety of activities
suitable for the whole family
Key activities include:
– Natural attractions including
wildlife
– Cultural attractions
– Theme parks
– Adventure activities
Look to stay for ten to twelve days
Spend of ~INR 200,000
(~USD 4,000) per person
Seek well-located, four to five star
hotels
Prefer partial packages including
tour guides
Concerns over safety and
security, and availability of Indian
and vegetarian food
Typically travel to Cape Town,
Johannesburg and Durban
Look for fun, thrilling activities
that give the sense of being free
and unrestricted
Key activities include:
– Visiting major attractions
– Adventure activities
– Nightlife
– Relaxing
– Shopping
Look to stay for seven to ten days
Spend of ~INR 175,000
(~USD 3,500) per person
Seek comfortable and clean three
to four star hotels
Prefer partial packages
Typically travel to Cape Town,
Johannesburg and Durban
Seek a wide variety of fun,
family-orientated activities
Key activities include:
– Visiting major attractions
– Natural attractions including
wildlife
– Relaxing
– Shopping
– Adventure activities
Look to stay for seven to ten days
Spend of ~INR 175,000
(~USD 3,500)
Seek three star hotels,
guesthouses and BnBs
Prefer partial packages with
special rates for young kids
Concerns over safety and
security, and availability of Indian
and vegetarian food
Typically travel to Cape Town,
Durban, Sun City and Jo’burg

90 | Copyright © 2012 SA Tourism
Centre of Gravity
Products and Activities (2 of 3)
Note: 1 International Indian Film Awards
Source: Monitor and Grail Analysis
Partial packages would appeal to travellers from all segments as it leaves some time for travellers to explore on
their own or simply relax; trips to South Africa should comprise visits to the major cities and locations
Type of Package
Partial packages (flights, accommodation, airport
transfers and limited activities) are preferred as they
allow travellers the chance to explore a destination at
their own pace
– For example, a ten day package could consist of six
days of pre-arranged activities and four days for
travellers to explore by themselves or simply relax
Indian travellers would look to stay between seven and
twelve days in South Africa and spend between INR
150,000 and INR 225,000 (USD 3,000–4,500)
These consumers seek accommodation that is clean,
comfortable and well-located; there are, however,
subtle differences in what each segment looks for
– Seasoned Leisure Seekers prefer luxury while
Social Explorers and Young Family Adventurers
seek a decent standard of accommodation
Special rates for children would appeal to the family
segments and should be incorporated into packages for
these segments
– E.g., entry fees for visits to theme parks could
possibly be incorporated into packages for Young
Family Adventures or Seasoned Leisure Seekers
Destinations
Packages to South Africa should several of the major
cities and locations, ensuring that Indian travellers fully
appreciate the diverse range of activities and
experiences on offer
– Major cities such as Cape Town, Durban and
Johannesburg provide Indian travellers with the
chance to explore urban life in South Africa, visit
major tourist attractions, relax on beaches where
possible and engage in a wide variety of activities
– Kruger National Park offers Indian travellers the
opportunity to view South Africa’s amazing wildlife
and natural scenic beauty
– Sun City and the “Valley of the Waves” provides a
family experience and is regarded as a status symbol
due to its previous hosting of the IIFA1
– For example, a ten day trip to South Africa could
include four nights in Cape Town, two nights in
Durban, two nights at the Kruger National Park and
one night apiece at Sun City and in Johannesburg

91 | Copyright © 2012 SA Tourism
Centre of Gravity
Products and Activities (3 of 3)
Source: Monitor and Grail Analysis
Activities involving adventure, exploring and sightseeing are popular across all segment although some subtle
differences exist between segments; Indian and vegetarian food is a significant consideration for Indian travellers
Activities
Each of the priority segments seek holidays where they
can explore the destination and participate in a wide-
range of activities, where the activities offer something
different from what they can experience back in India
Typical activities include exploring the natural scenic
beauty and culture, visiting the major tourist
attractions, nightlife, shopping and adventure
– In terms of nightlife, Social Explorers are looking to
visit popular bars and clubs whereas Seasoned
Leisure Seekers are looking to dine-out and
explore the local culture at night
– Each segment’s definition of adventure activities
differs slightly
Seasoned Leisure Seekers and Young Family
Adventurers look for “safe adventure”, e.g.,
snorkelling or water-skiing
Social Explorers seek out more thrilling
activities that provide them with the adrenaline
rush and feeling of escape
Both Seasoned Leisure Seekers and Young Family
Adventurers look for family-orientated activities that
appeal to both young children as well as adults (e.g.,
theme parks, water parks, shopping or shows)
Cuisine
Indian travellers have specific food requirements with the
availability of Indian or vegetarian cuisine at a
destination influencing their choice of destination
While some Indian travellers do like to explore the
local cuisine at a new destination, having the option to
have either Indian food or pure vegetarian food is
extremely important across all segments
– Most Indian travellers prefer to have Indian food
during their trip although they would be willing to have
local cuisines on some nights
SAT is currently producing a guide to the Top
100 Indian restaurants in South Africa
– Many Indian travellers are vegetarian. Although they
can bring along ready-to-mix packets, destinations
which cater for them are preferred
The vegetarian options need not necessarily be
Indian in style
SAT is currently producing a guide to the
vegetarian restaurants in South Africa’s major
cities. This guide should be made available on the
SAT website and shared with the major tour
operators to emphasise that South Africa does
cater for vegetarians

92 | Copyright © 2012 SA Tourism
Centre of Gravity
Channels: Centre of Gravity
Source: Monitor and Grail Analysis
The Centre of Gravity will ensure that channels that Indian travellers from the three priority segments are typically
use are targeted
SAT’s Centre of Gravity in India
The Centre of Gravity (CoG) is the area in which the
travel behaviour of Indian consumers from different
segments intersect
By positioning South Africa as a destination within this
CoG, ensures that a message that resonates in some
way with Indian travellers from priority segments is
communicated
Channels are based on …
Seasoned Status
Seekers
Young
Family
Adventurers
Social
Explorers
CoG
CoG
…the key drivers of one’s travel behaviour:
Primary
Information
Sought
Booking Channel

93 | Copyright © 2012 SA Tourism
Online — Travel
Agent / Operator
Personal Visit —
Airline / Hotel
Travel Booking
Websites
Telephone —
Airline / Hotel
Telephone — Travel
Agent / Operator
Telephone
Television Travel Magazines
and Booklets
Travel Booking /
Review Websites
Shopping
Beach Eating at
Restaurants Exploring Wildlife / Safari
Alone Tour Group Colleagues Kids
Aged 10–18
Alone Business Tour Groups
Travel Agent /
Tour Operator Colleagues
Company Travel
Desk
Travel Agent Business
Kids
Aged< 18 Family Parents
Shopping —
Personal
Exploration
Holiday VFR
Centre of Gravity
Recommended Messaging: Buying Process
Sport
Spectator
Special
Event Backpacking Religious Other
Experience
Sought
Activities
Undertaken
Travel
Companions
Primary
Information
Source
Travel
Planners
Multipurpose Driven by Personal Need
Legend: Young Family Adventurers Social Explorers Seasoned Leisure Seekers
Adventure
Holiday
Romantic
Holiday
Family
Holiday
Purpose of
Travel —
Primary
Leisure
Family
Self Spouse Friends
Friends Self
Spouse Kids Aged< 10 Family Friends Parents
Friends Family
Explore New Places,
People and Different
Cultures / Traditions Adventure
Natural / Scenic
Beauty Fun Family Time
Escapism /
Relaxation
Cultural,
Historical and
Heritage Adventure Theme Parks
Natural
Attractions Shopping Nightlife
Word of Mouth
Online
News, Articles,
Webpages, Blogs Radio
Newspapers /
Magazines
Social Networking
Websites
Travel Agents /
Tour Operators
Word of Mouth Mass Media Internet Travel Agent
Personal Visit — Travel
Agent / Operator
Online – Airline /
Hotel
Purchase
Channel
Online Personal Visit
Source: Monitor and Grail Analysis; “Quantitative Research Survey — India”, SAT, Jan 2012
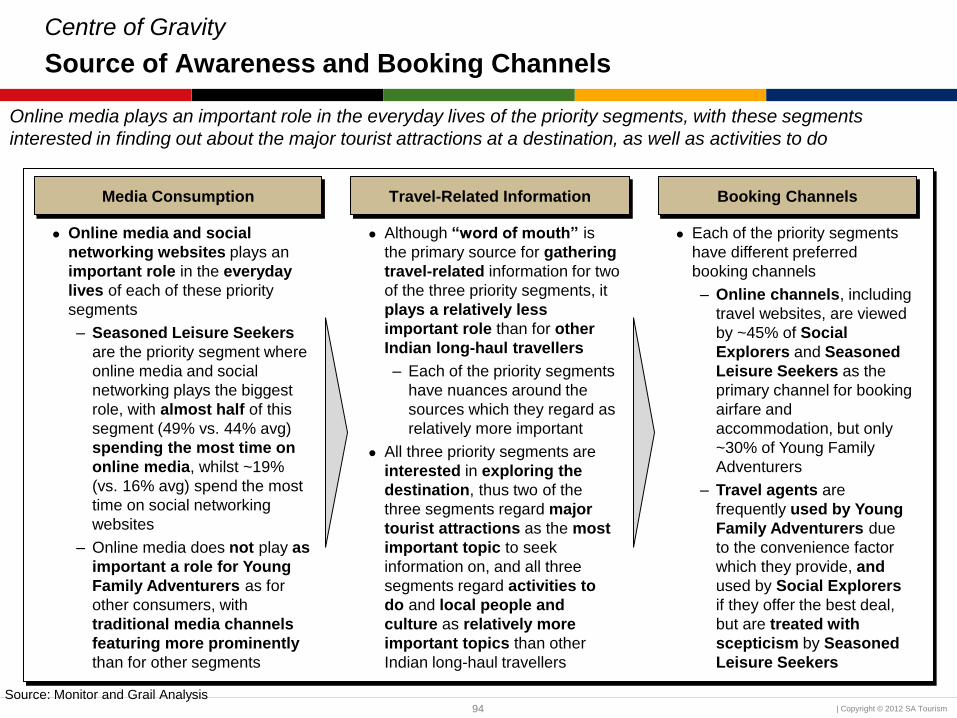
94 | Copyright © 2012 SA Tourism
Centre of Gravity
Source of Awareness and Booking Channels
Online media plays an important role in the everyday lives of the priority segments, with these segments
interested in finding out about the major tourist attractions at a destination, as well as activities to do
Source: Monitor and Grail Analysis
Media Consumption Travel-Related Information Booking Channels
Online media and social
networking websites plays an
important role in the everyday
lives of each of these priority
segments
– Seasoned Leisure Seekers
are the priority segment where
online media and social
networking plays the biggest
role, with almost half of this
segment (49% vs. 44% avg)
spending the most time on
online media, whilst ~19%
(vs. 16% avg) spend the most
time on social networking
websites
– Online media does not play as
important a role for Young
Family Adventurers as for
other consumers, with
traditional media channels
featuring more prominently
than for other segments
Although “word of mouth” is
the primary source for gathering
travel-related information for two
of the three priority segments, it
plays a relatively less
important role than for other
Indian long-haul travellers
– Each of the priority segments
have nuances around the
sources which they regard as
relatively more important
All three priority segments are
interested in exploring the
destination, thus two of the
three segments regard major
tourist attractions as the most
important topic to seek
information on, and all three
segments regard activities to
do and local people and
culture as relatively more
important topics than other
Indian long-haul travellers
Each of the priority segments
have different preferred
booking channels
– Online channels, including
travel websites, are viewed
by ~45% of Social
Explorers and Seasoned
Leisure Seekers as the
primary channel for booking
airfare and
accommodation, but only
~30% of Young Family
Adventurers
– Travel agents are
frequently used by Young
Family Adventurers due
to the convenience factor
which they provide, and
used by Social Explorers
if they offer the best deal,
but are treated with
scepticism by Seasoned
Leisure Seekers
95 | Copyright © 2012 SA Tourism
For more information contact our India office: 95, 9th floor
Maker Chambers – VI
Nariman Point, Mumbai - 400021, India
Telephone: +91 22 2285 0409
Email address: [email protected]
Website: www.southafrica.net