Embed Size (px)
Citation preview
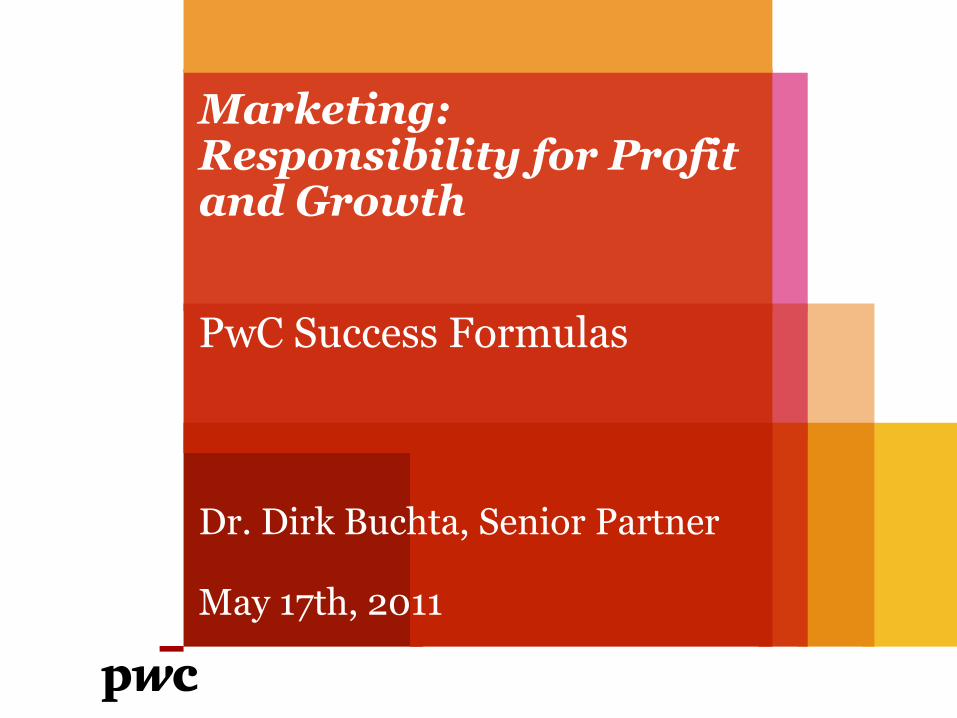
Marketing: Responsibility for Profit and Growth
Dr. Dirk Buchta, Senior Partner May 17th, 2011
PwC Success Formulas

PwC
Agenda
PwC Engagement in Strategy & Marketing Consulting
Marketing – The Top Issue on the CEO Agenda
PwC Success Formulas
Seven Key Levers of Marketing for Profit and Growth
Marketing Roadmap
2

PwC
PwC Engagement in Strategy & Marketing Consulting
3

PwC
We are a global consulting leader
Global
PwC People: 161,718
PwC Advisory: 32. 344
Countries: 154
Locations: 766
4
PwC Advisory Services generate $6,1 billion revenues with 32.344 consultants .
PwC
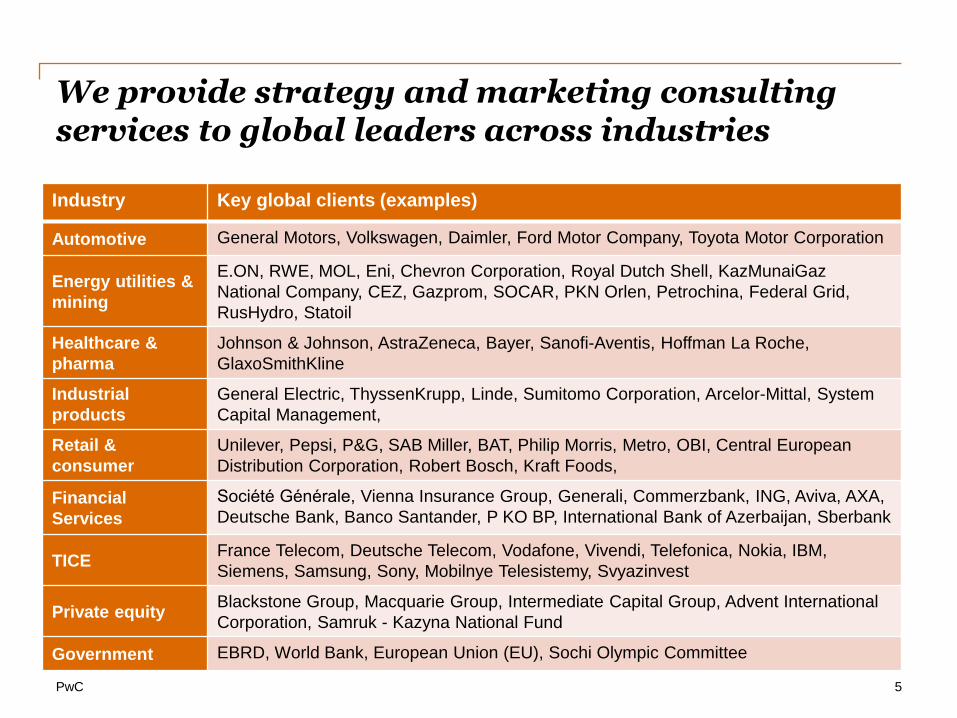
We provide strategy and marketing consulting services to global leaders across industries
5
Industry Key global clients (examples)
Automotive General Motors, Volkswagen, Daimler, Ford Motor Company, Toyota Motor Corporation
Energy utilities &
mining
E.ON, RWE, MOL, Eni, Chevron Corporation, Royal Dutch Shell, KazMunaiGaz
National Company, CEZ, Gazprom, SOCAR, PKN Orlen, Petrochina, Federal Grid,
RusHydro, Statoil
Healthcare &
pharma Johnson & Johnson, AstraZeneca, Bayer, Sanofi-Aventis, Hoffman La Roche,
GlaxoSmithKline
Industrial
products General Electric, ThyssenKrupp, Linde, Sumitomo Corporation, Arcelor-Mittal, System
Capital Management,
Retail &
consumer Unilever, Pepsi, P&G, SAB Miller, BAT, Philip Morris, Metro, OBI, Central European
Distribution Corporation, Robert Bosch, Kraft Foods,
Financial
Services
Société Générale, Vienna Insurance Group, Generali, Commerzbank, ING, Aviva, AXA,
Deutsche Bank, Banco Santander, P KO BP, International Bank of Azerbaijan, Sberbank
TICE France Telecom, Deutsche Telecom, Vodafone, Vivendi, Telefonica, Nokia, IBM,
Siemens, Samsung, Sony, Mobilnye Telesistemy, Svyazinvest
Private equity Blackstone Group, Macquarie Group, Intermediate Capital Group, Advent International
Corporation, Samruk - Kazyna National Fund
Government EBRD, World Bank, European Union (EU), Sochi Olympic Committee

PwC
We have a strong presence in Central & Eastern Europe
Geography Revenues ($ mil) Asia 2,935
Australasia and Pacific 1,293
Central & Eastern Europe 726
Western Europe 11,062
Middle East & Africa 823
North America & Caribbean 8,952
South & Central America 778
Total 26,569
No. of employees in 2010 32,225
6,850
6,837
57,702
10,033
37,643
10,428
161,718
6
PwC
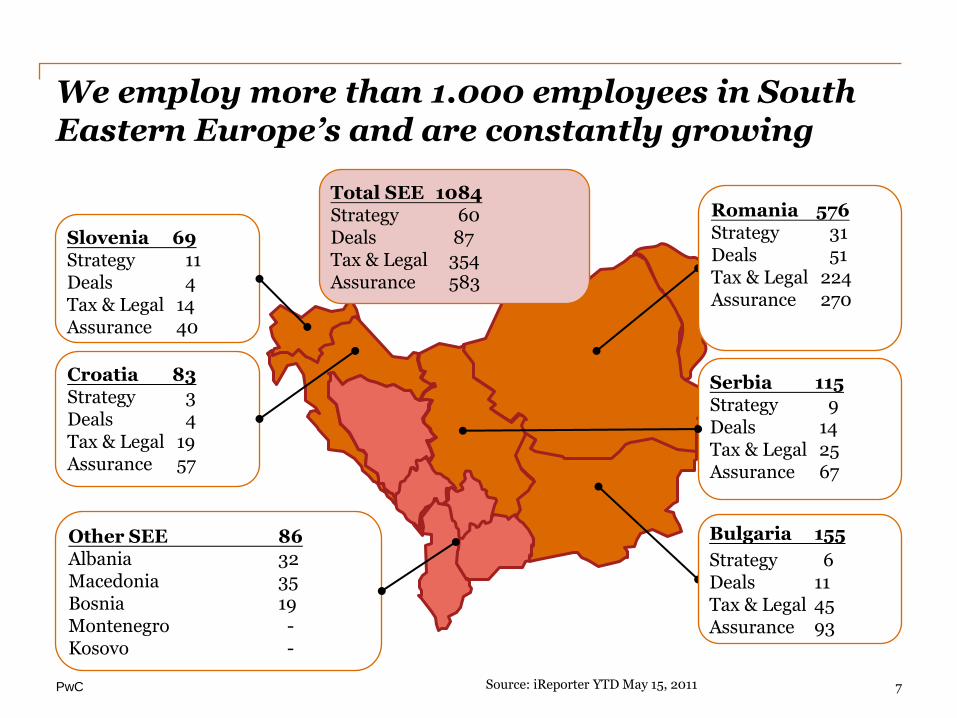
We employ more than 1.000 employees in South Eastern Europe’s and are constantly growing
Slovenia 69 Strategy 11 Deals 4 Tax & Legal 14 Assurance 40
Total SEE 1084 Strategy 60 Deals 87 Tax & Legal 354 Assurance 583
Croatia 83 Strategy 3 Deals 4 Tax & Legal 19 Assurance 57
Serbia 115 Strategy 9 Deals 14 Tax & Legal 25 Assurance 67
Bulgaria 155
Strategy 6 Deals 11 Tax & Legal 45 Assurance 93
Other SEE 86 Albania 32 Macedonia 35 Bosnia 19 Montenegro - Kosovo -
Romania 576 Strategy 31 Deals 51 Tax & Legal 224 Assurance 270
Source: iReporter YTD May 15, 2011 7

PwC
Marketing – The Top Issue on the CEO Agenda
The environment in which you have spent most, if not all of your careers, has changed.
8

PwC
Recently we have published our 14th Annual Global CEO Survey on company growth
• 1,201 global interviews were conducted between September and November 2010
• 70 countries
• Industry cuts for 15 sectors
• Quantitative research supplemented with face-to-face CEOs interviews
• You can find more insights on: http://www.pwc.com/gx/en/ceo-survey
1.201 CEOs
9
Source: PwC14th Annual Global CEO Survey
PwC
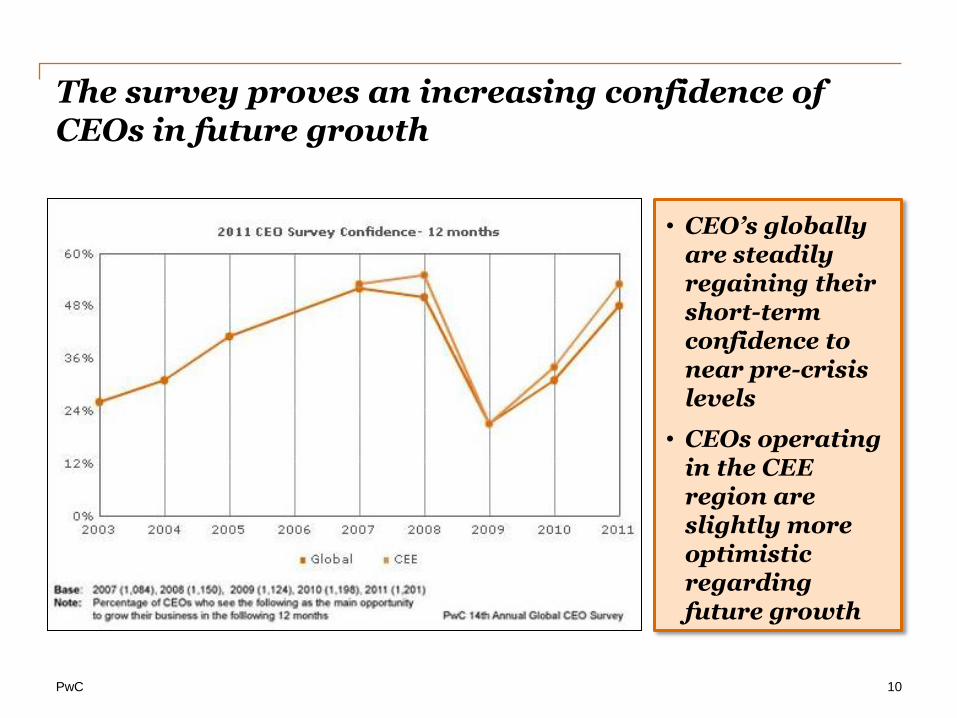
The survey proves an increasing confidence of CEOs in future growth
10
• CEO’s globally are steadily regaining their short-term confidence to near pre-crisis levels
• CEOs operating in the CEE region are slightly more optimistic regarding future growth

PwC
Most global CEOs expect Marketing to drive this growth by customer focus and innovation
78% CEOs expect their development efforts to generate ‘significant’ new revenue opportunities
11
39% CEOs expect the majority of their innovation to be co-developed with partners outside their organisation
64% CEOs view the development of environmentally friendly products and services as important part of their innovation strategy
Source: PwC14th Annual Global CEO Survey
PwC
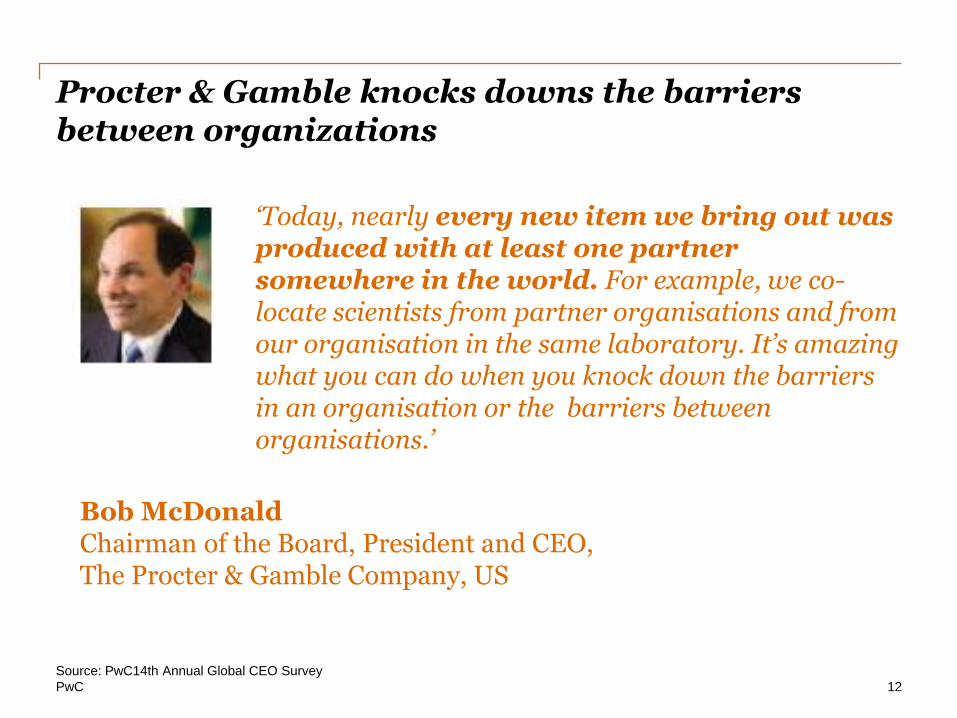
Procter & Gamble knocks downs the barriers between organizations
Source: PwC14th Annual Global CEO Survey
‘Today, nearly every new item we bring out was produced with at least one partner somewhere in the world. For example, we co-locate scientists from partner organisations and from our organisation in the same laboratory. It’s amazing what you can do when you knock down the barriers in an organisation or the barriers between organisations.’
Bob McDonald Chairman of the Board, President and CEO, The Procter & Gamble Company, US
12
PwC
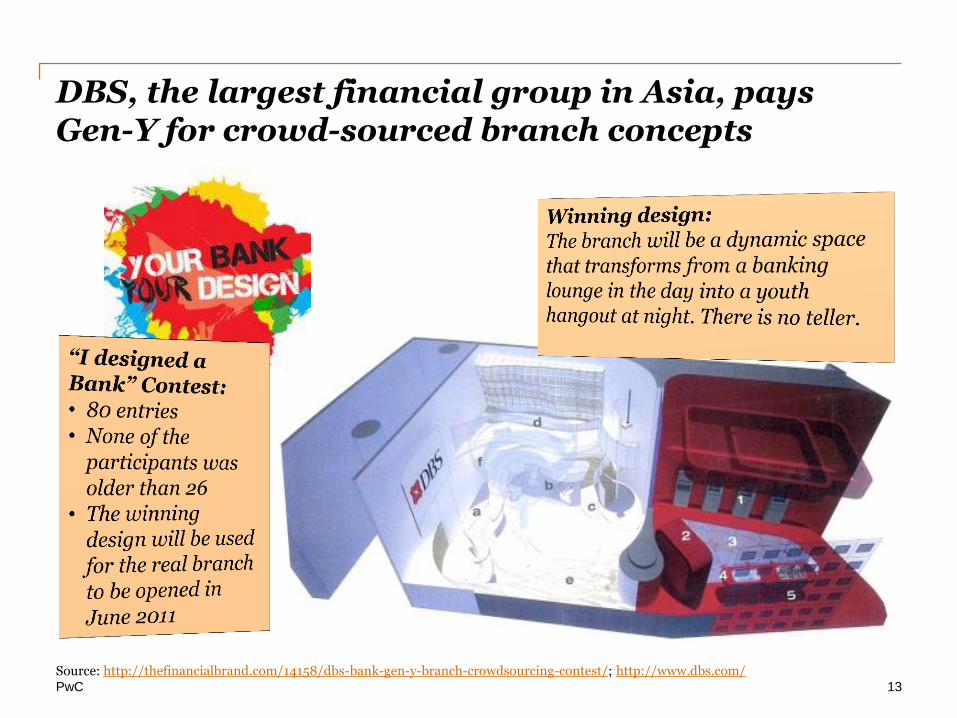
DBS, the largest financial group in Asia, pays Gen-Y for crowd-sourced branch concepts
13
Source: http://thefinancialbrand.com/14158/dbs-bank-gen-y-branch-crowdsourcing-contest/; http://www.dbs.com/

PwC
PwC Success Formulas
What are the Top Performers’ success formulas for profit and growth?
14
PwC
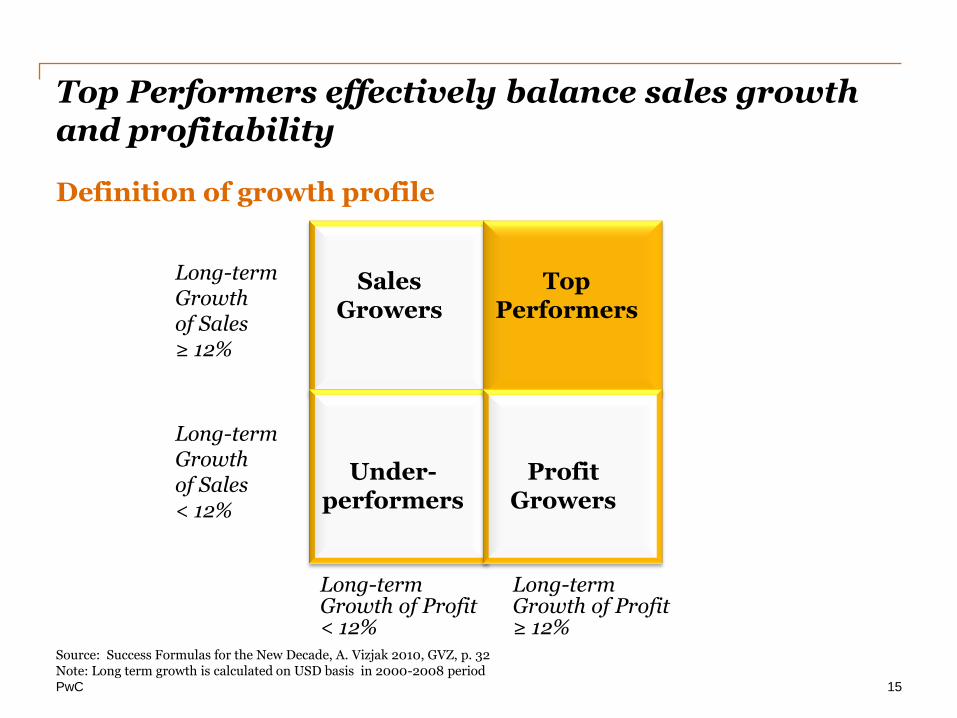
Top Performers effectively balance sales growth and profitability
15
Sales Growers
Top Performers
Profit Growers
Under- performers
Long-term Growth of Sales ≥ 12%
Long-term Growth of Sales < 12%
Long-term Growth of Profit ≥ 12%
Long-term Growth of Profit < 12%
Source: Success Formulas for the New Decade, A. Vizjak 2010, GVZ, p. 32 Note: Long term growth is calculated on USD basis in 2000-2008 period
Definition of growth profile

PwC
Among the top performers we have identified four success formulas
16
Sales Growers
Profit Growers
Under- performers
Source: Success Formulas for the New Decade, A. Vizjak 2010, GVZ
Pr
od
uc
t D
ive
rs
ific
ati
on
Internationalisation
Regional Hero
Industry Shark
Local Specialist
International Champion
Top Performers
PwC
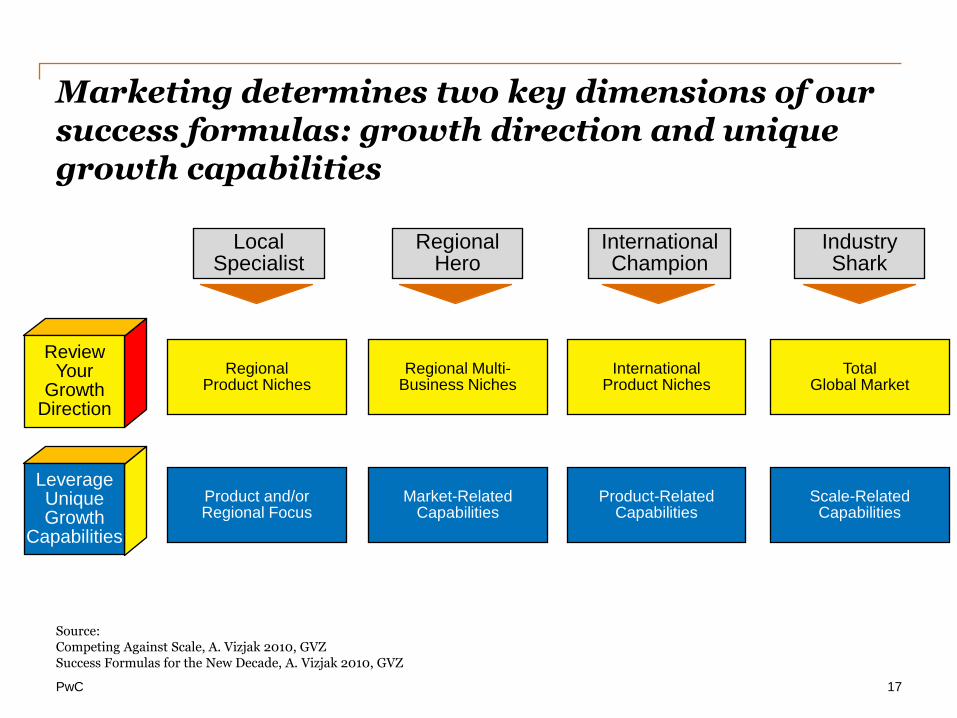
Marketing determines two key dimensions of our success formulas: growth direction and unique growth capabilities
17
Source: Competing Against Scale, A. Vizjak 2010, GVZ Success Formulas for the New Decade, A. Vizjak 2010, GVZ
Industry Shark
Local Specialist
Regional Hero
International Champion
Review Your
Growth Direction
Leverage Unique Growth
Capabilities
Regional Product Niches
Regional Multi- Business Niches
International Product Niches
Total Global Market
Product and/or Regional Focus
Market-Related Capabilities
Product-Related Capabilities
Scale-Related Capabilities

PwC
The excellent financial results of the analysed sample prove the success of all four formulas
18
Regional Heroes
Local Specialists
Industry Sharks
International Champions
Revenue growth: 10 percent
Profit growth:
11 percent
Profitability: 10 percent
Revenue growth: 19 percent
Profit growth:
22 percent
Profitability: 9 percent
Revenue growth: 18 percent
Profit growth:
17 percent
Profitability: 9 percent
Revenue growth: 16 percent
Profit growth:
19 percent
Profitability: 11 percent
KPI’s: Median values of the formula clusters Revenue growth = Sales CAGR 2000 – 2008 Profit growth =EBIT CAGR 2000 – 2008 Profitability = EBIT on Assets 2008
Source: Success Formulas for the New Decade, A. Vizjak 2010, GVZ

PwC
Seven Key Levers of Marketing for Profit & Growth
What are the marketing success drivers we learned from success formula examples?
19

PwC
Seven key levers operationalize the responsibility of Marketing for profit and growth
20 Full impact on profit drivers
Brand Management
Category Management
Customer Centricity
Product Complexity
Value Innovation
Channel Management
Cross Selling
Profit Price Volume Costs = * -
7
6
5
4
3
2
1
Partial impact on profit drivers
PwC
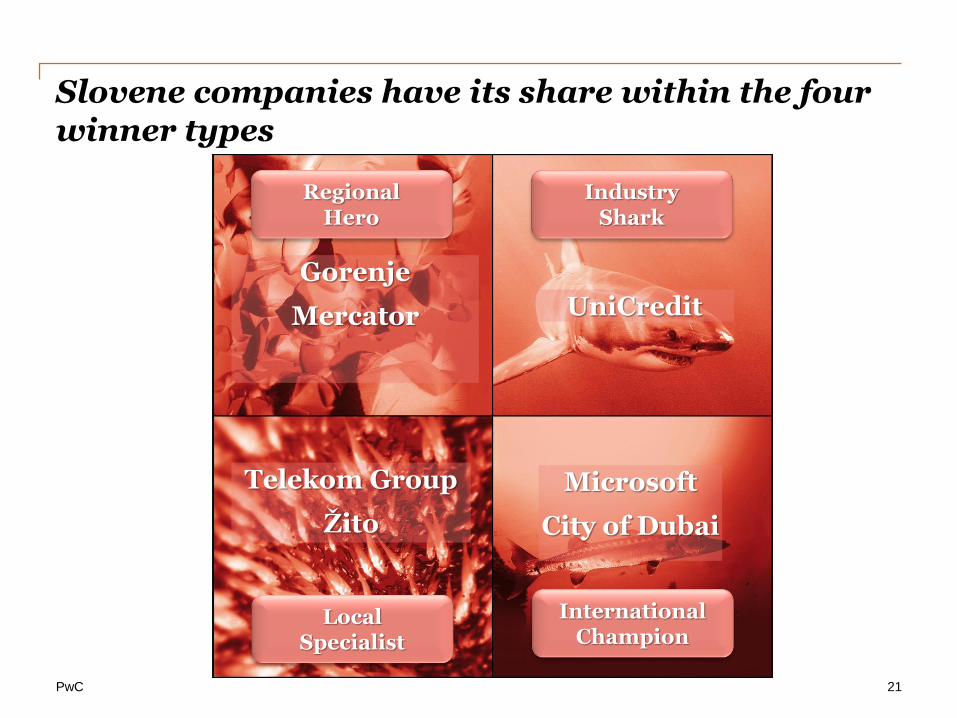
Slovene companies have its share within the four winner types
21
Regional Hero
Industry Shark
Local Specialist
International Champion
Microsoft
City of Dubai
UniCredit
Telekom Group
Žito
Gorenje
Mercator
PwC
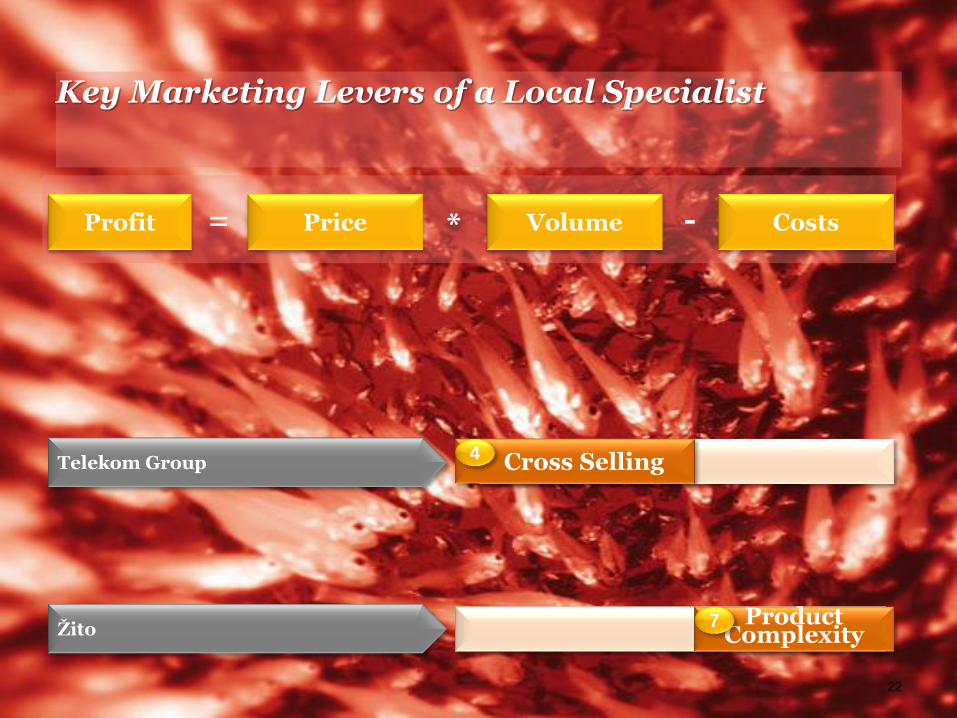
Key Marketing Levers of a Local Specialist
22
Product Complexity
Cross Selling
Profit Price Volume Costs = * -
7
4 Telekom Group
Žito

PwC
Market segment Fixed
Telephony
Company
Market share
Market position in Slovenija
Mobile System
Solutions Internet
Marketing
Telekom Mobitel Najdi
Planet9
56 % of active users
S76 % in fixed telephony
46 % in broadband
#1
Avtenta
#1 #1
Pay TV
TS/Planet9
26 %
#2 #5
45 % 11 %
Telekom Group has a leading position in Slovenia
23
Source: APEK, Annual Report Skupine TS 2009
Cross Selling

PwC
Žito reduced the product complexity with direct impact on manufacturing and overhead costs
24
Brands/ Products
Understand Complexity
Drivers
Set Complexity
Rules
Calculate Impact
Product revenues per channel
Product revenues
Profitability targets
# channels per product
Manufacturing costs
Labour costs
Product features
Channels
Manufacturing
# SKU
# SKU
# SKU
# SKU
Product Complexity
Grajske pekarne
Zlato polje
Maestro
Gorenjka
Source: Žito

PwC
Key Marketing Levers of a Regional Hero
25
Category Management
Channel Management
Profit Price Volume Costs = * -
6
5 Gorenje
Mercator

PwC
Final Consumers
Gorenje offers home appliances & furniture: Large Household appliances, Small household appliances & kitchenwear, consumer electronics,
other home appliances (water heaters, radiators, heathing systems), furniture
Retail Shops
& E-Com- merce
of Producer
Sales to
OEMs
(original equip- ment
manu- facturers)
Independent electrical
goods specialist
retail shops
Whole- Sale
Kitchen specialist
retail shops
Kitchen manufac-
turers
Mail order
retailers
Sales force & key account managers of Producers
Hyper- markets, Depart-
ment stores
Building construc-
tion / architects
Sales agents of
Producers
Electrical goods spe- cialist re- tail chains
Do-it- yourself
Retail chains
Gorenje developed the entire range of sales channels by customizing products to individual retailers’ requirements
Channel Management
26
Source: Success Formulas for the New Decade, A. Vizjak 2010, GVZ

PwC
Source: Gorenje Annual Report 2010
Gorenje is a Regional Hero and remains a sales and profit grower even in a stagnating market
Channel Management
27
EUR million
2009 2010
Consolidated revenues
1.185,9 1.382,2
EBIT 12,1 56,4
PwC
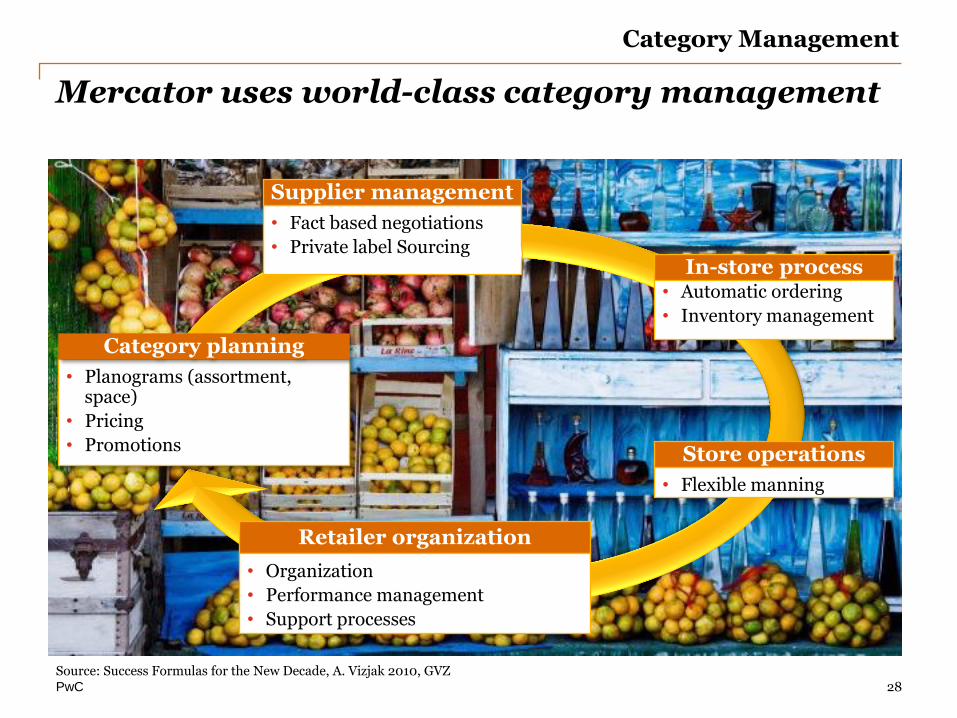
Mercator uses world-class category management
28
Retailer organization
• Fact based negotiations
• Private label Sourcing
Supplier management
• Planograms (assortment, space)
• Pricing
• Promotions
Category planning
• Organization
• Performance management
• Support processes
• Automatic ordering
• Inventory management
In-store process
• Flexible manning
Store operations
Category Management
Source: Success Formulas for the New Decade, A. Vizjak 2010, GVZ
PwC
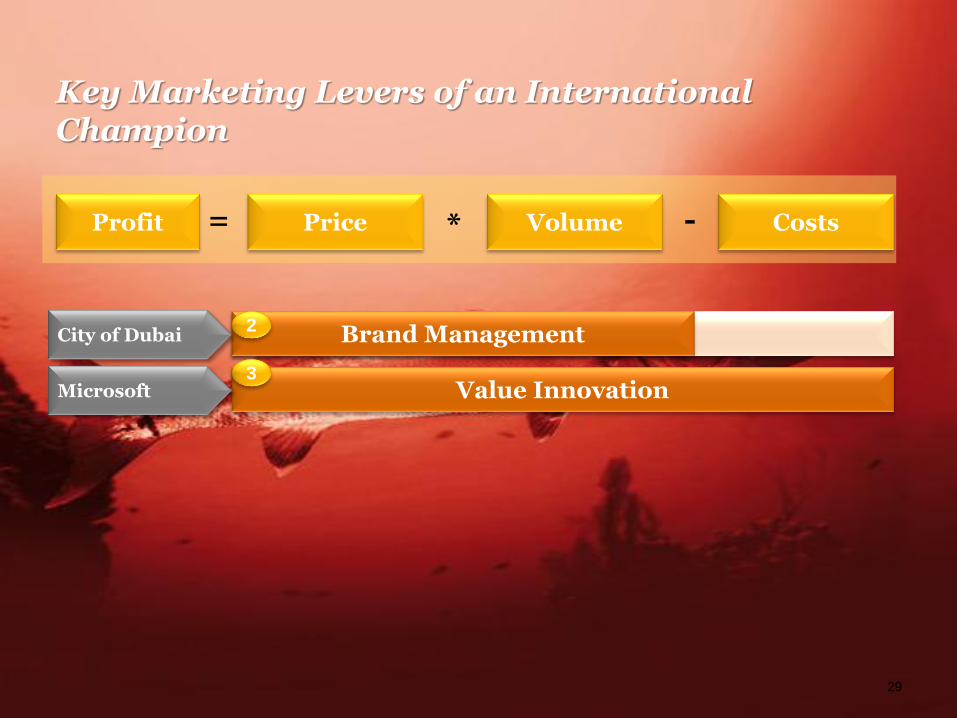
Key Marketing Levers of an International Champion
29
Brand Management
Value Innovation
Profit Price Volume Costs = * -
3
2 City of Dubai
Microsoft

PwC
Microsoft has always been an innovation pioneer in the IT industry
Social networks, cloud computing Products > Solutions > Services
Browsers, e-mail, eCommerce, Hosting, Wi-Fi, Web 2.0
Distributed Computing
Text editor, spreadsheets DOS, graphical user interface, Windows
early 80’s mid 80’s mid 90’s 2000+
Value Innovation
30
Source: Microsoft
PwC
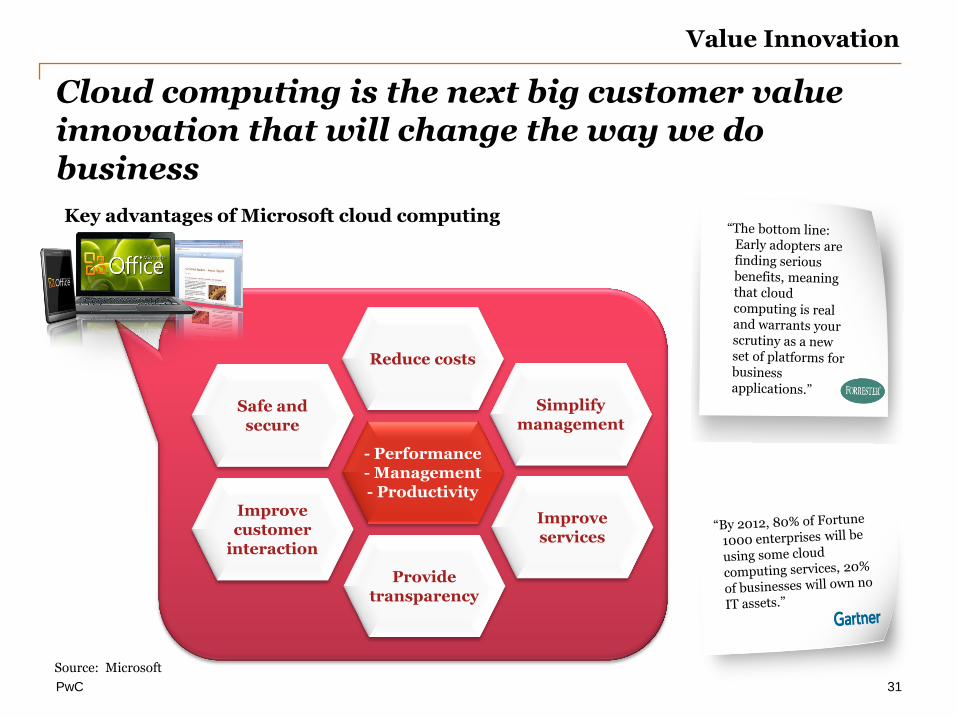
Cloud computing is the next big customer value innovation that will change the way we do business
Reduce costs
Simplify management
Safe and secure
- Performance - Management - Productivity
Improve customer
interaction
Improve services
Provide transparency
Key advantages of Microsoft cloud computing
Value Innovation
31
Source: Microsoft

PwC
Dubai established the leading global lifestyle brand of the Arab world
32
Elements of Dubai’s premier lifestyle brand
• Fun & Entertainment
• Broad variety of hotels
• Best airline (Emirates Airlines)
• Iconic buildings (Burj Al Arab, Burj Khalifa)
• Innovative approaches (e.g. Palm Island)
• Best infrastructure (e.g. Dubai Metro, electronic border control)
Brand Management
Source: Dubai Statistics Department; Gulfnews
PwC
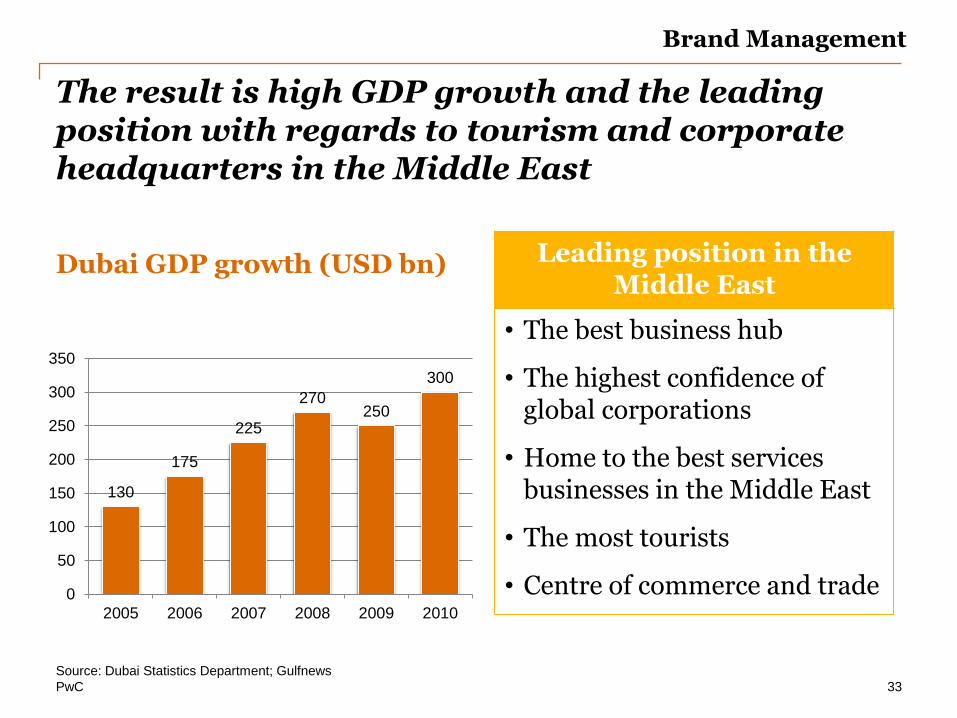
The result is high GDP growth and the leading position with regards to tourism and corporate headquarters in the Middle East
Leading position in the Middle East
• The best business hub
• The highest confidence of global corporations
• Home to the best services businesses in the Middle East
• The most tourists
• Centre of commerce and trade
Source: Dubai Statistics Department; Gulfnews
33
130
175
225
270 250
300
0
50
100
150
200
250
300
350
2005 2006 2007 2008 2009 2010
Dubai GDP growth (USD bn)
Brand Management
PwC
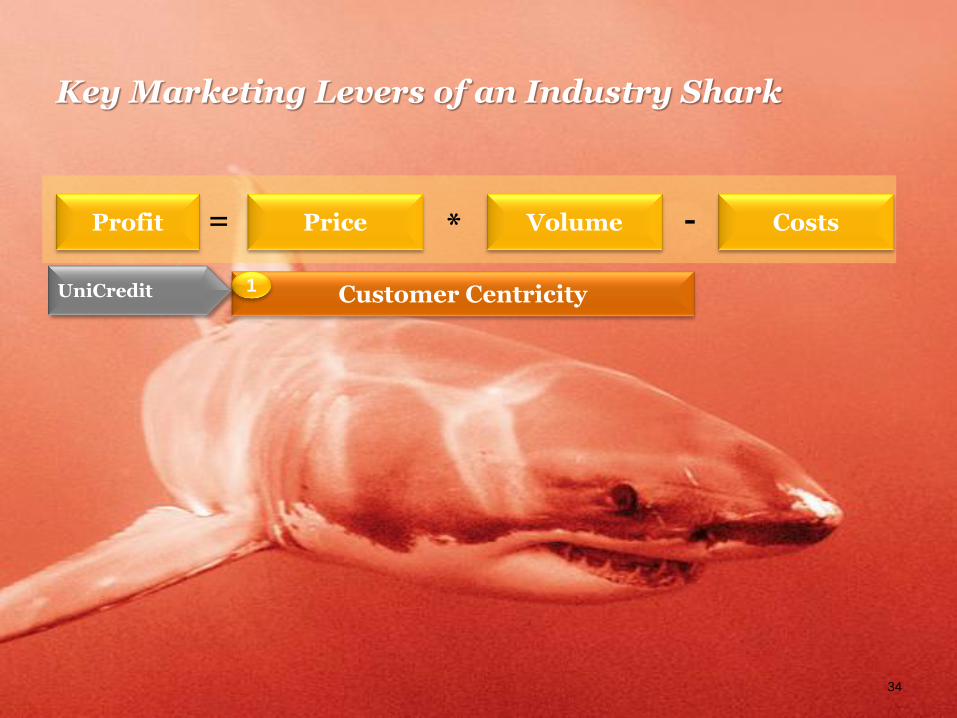
Key Marketing Levers of an Industry Shark
34
Customer Centricity
Profit Price Volume Costs = * -
1 UniCredit
PwC
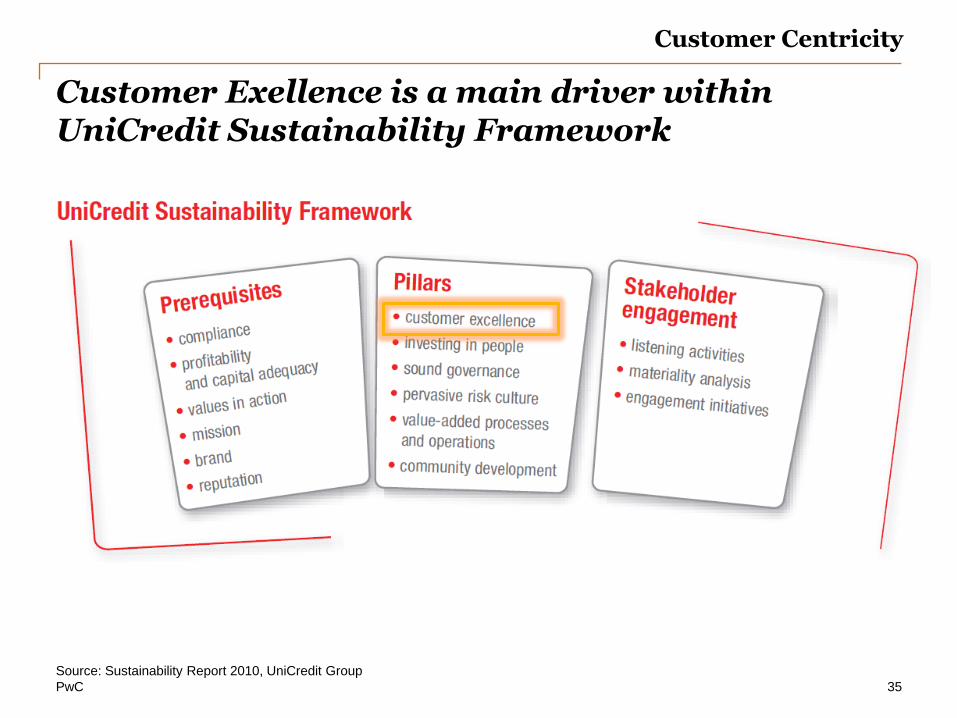
Customer Exellence is a main driver within UniCredit Sustainability Framework
Source: Sustainability Report 2010, UniCredit Group
35
Customer Centricity

PwC
UniCredit established the leading position in the region also due to its focus on customer centricity
Source: Sustainability Report 2010, UniCredit Group; Presentation to Investors, London 2010
36
Customer Centricity
UniCredit Approach to Customer Centricity
• Measured with Customer Satisfaction Index, directly linked to the incentive system for relationship managers
• Roughly 461,000 Customers interviewed in 2010
• Almost all countries in CEE scored above 70 points which is considered Excellent

PwC
Marketing Road Map
By focusing on success drivers and deploying the right capabilities, marketers can position their companies for profitable growth.
37

PwC
Regional Hero
Industry Shark
Local Specialist
International Champion
CROSS SELING
CATEGORY MANAGEMENT
CHANNEL MANAGEMENT
PRODUCT COMPLEXITY MANAGEMENT
CUSTOMER CENTRICITY
VALUE INNOVATON
BRAND MANAGEMENT
1
7
4
5
6
3
2
PwC
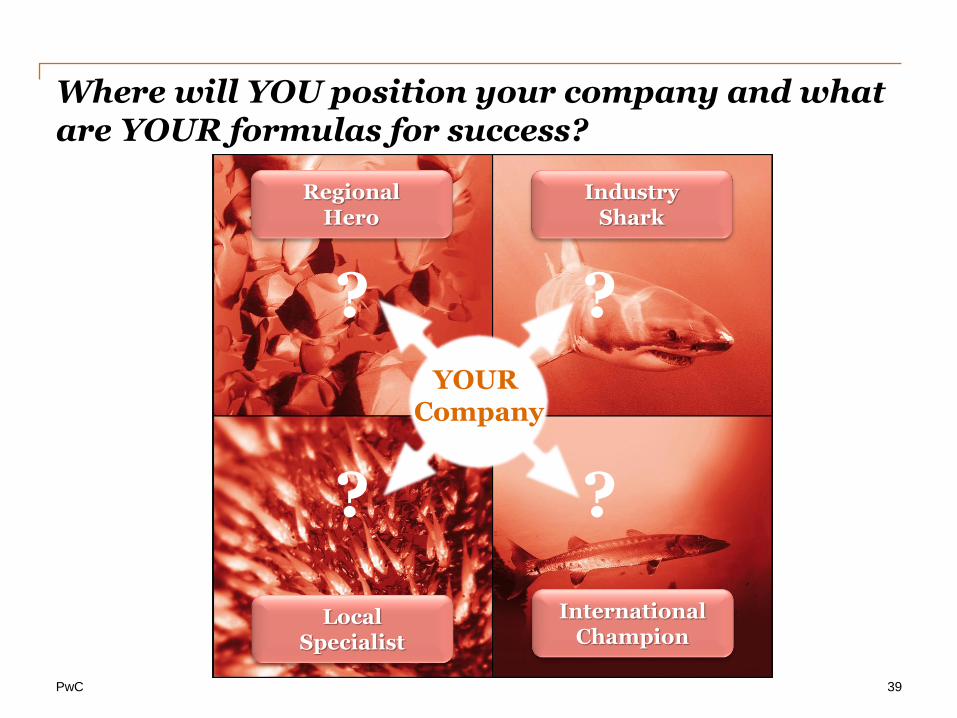
Where will YOU position your company and what are YOUR formulas for success?
39
Regional Hero
Industry Shark
Local Specialist
International Champion
YOUR Company
? ?
? ?

Thank you! Feel free to contact me at: [email protected]
This presentation has been prepared for general guidance on matters of interest only, and
does not constitute professional advice. You should not act upon the information contained in
this publication without obtaining specific professional advice. No representation or warranty
(express or implied) is given as to the accuracy or completeness of the information contained
in this publication, and, to the extent permitted by law, PricewaterhouseCoopers d.o.o., its
members, employees and agents do not accept or assume any liability, responsibility or duty of
care for any consequences of you or anyone else acting, or refraining to act, in reliance on the
information contained in this publication or for any decision based on it.
© 2011 PricewaterhouseCoopers d.o.o.. All rights reserved. In this document, “PwC” refers to
PricewaterhouseCoopers d.o.o., which is a member firm of PricewaterhouseCoopers
International Limited, each member firm of which is a separate legal entity.