Embed Size (px)
Citation preview

MARKETING RESEARCH AND MARKET INTELLIGENCE
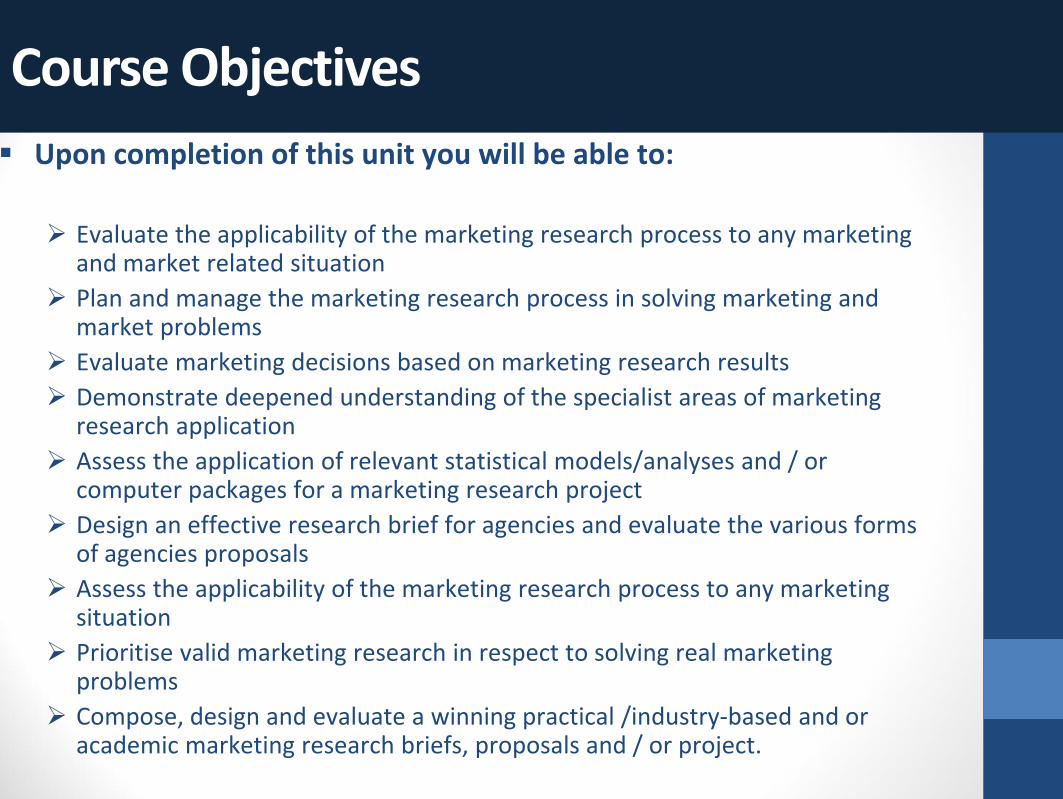
Course Objectives Upon completion of this unit you will be able to:
Evaluate the applicability of the marketing research process to any marketing
and market related situation Plan and manage the marketing research process in solving marketing and
market problems Evaluate marketing decisions based on marketing research results Demonstrate deepened understanding of the specialist areas of marketing
research application Assess the application of relevant statistical models/analyses and / or
computer packages for a marketing research project Design an effective research brief for agencies and evaluate the various forms
of agencies proposals Assess the applicability of the marketing research process to any marketing
situation Prioritise valid marketing research in respect to solving real marketing
problems Compose, design and evaluate a winning practical /industry-based and or
academic marketing research briefs, proposals and / or project.

Introduction to Market(ing) Research
• Market research: the “systematic gathering, recording, and analysing of data with respect to a particular market, where ‘market’ refers to a specific group in a specific geographic area.”
• Marketing research is the process of designing, gathering, analysing, and reporting information that may be used to solve a specific marketing problem.
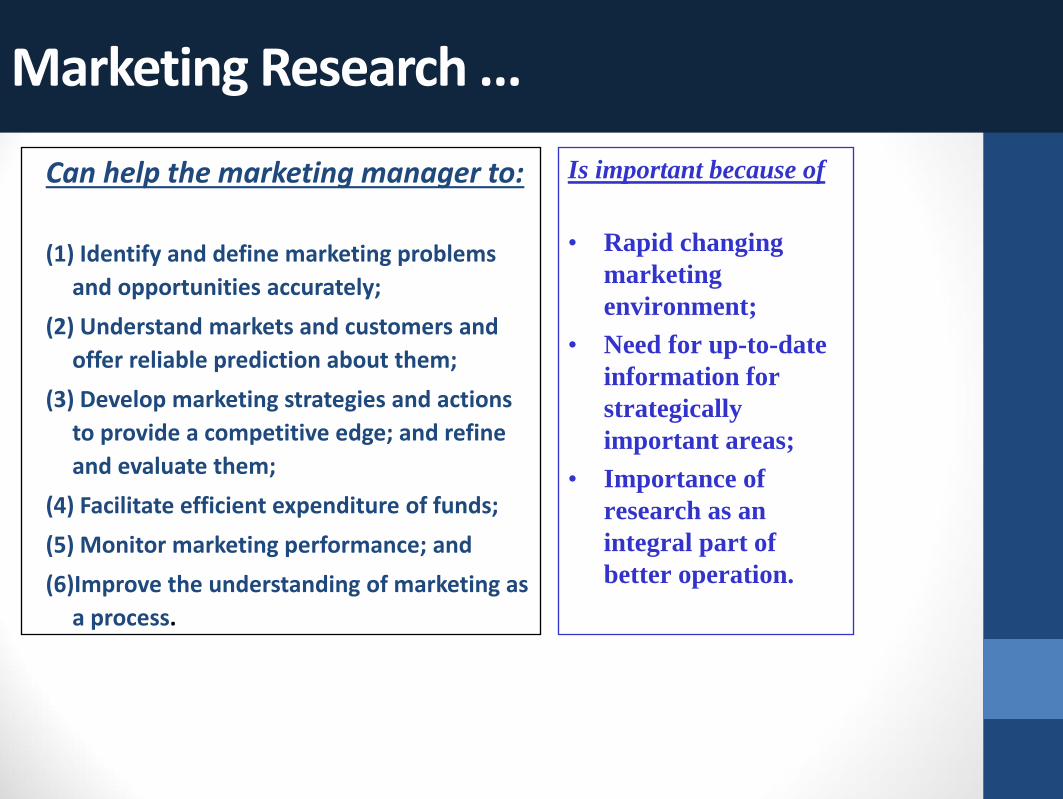
Marketing Research ...
Can help the marketing manager to: (1) Identify and define marketing problems
and opportunities accurately; (2) Understand markets and customers and
offer reliable prediction about them; (3) Develop marketing strategies and actions
to provide a competitive edge; and refine and evaluate them;
(4) Facilitate efficient expenditure of funds; (5) Monitor marketing performance; and (6)Improve the understanding of marketing as
a process.
Is important because of
• Rapid changing marketing environment;
• Need for up-to-date information for strategically important areas;
• Importance of research as an integral part of better operation.
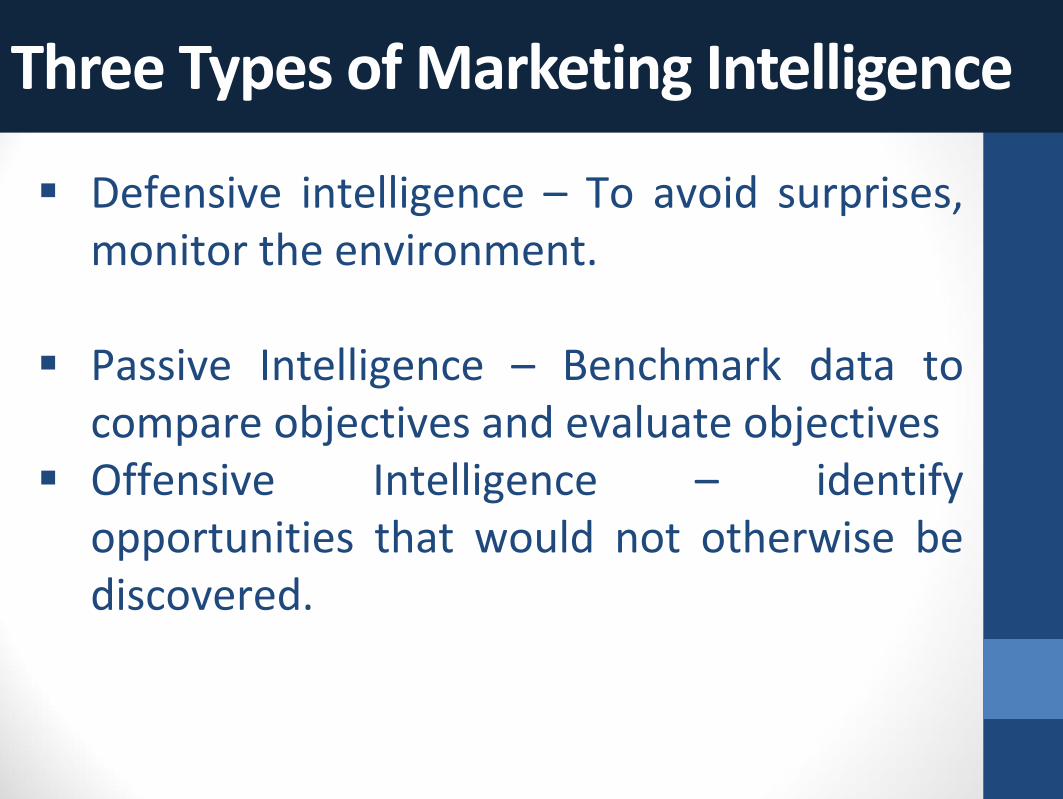
Three Types of Marketing Intelligence
Defensive intelligence – To avoid surprises, monitor the environment.
Passive Intelligence – Benchmark data to compare objectives and evaluate objectives
Offensive Intelligence – identify opportunities that would not otherwise be discovered.
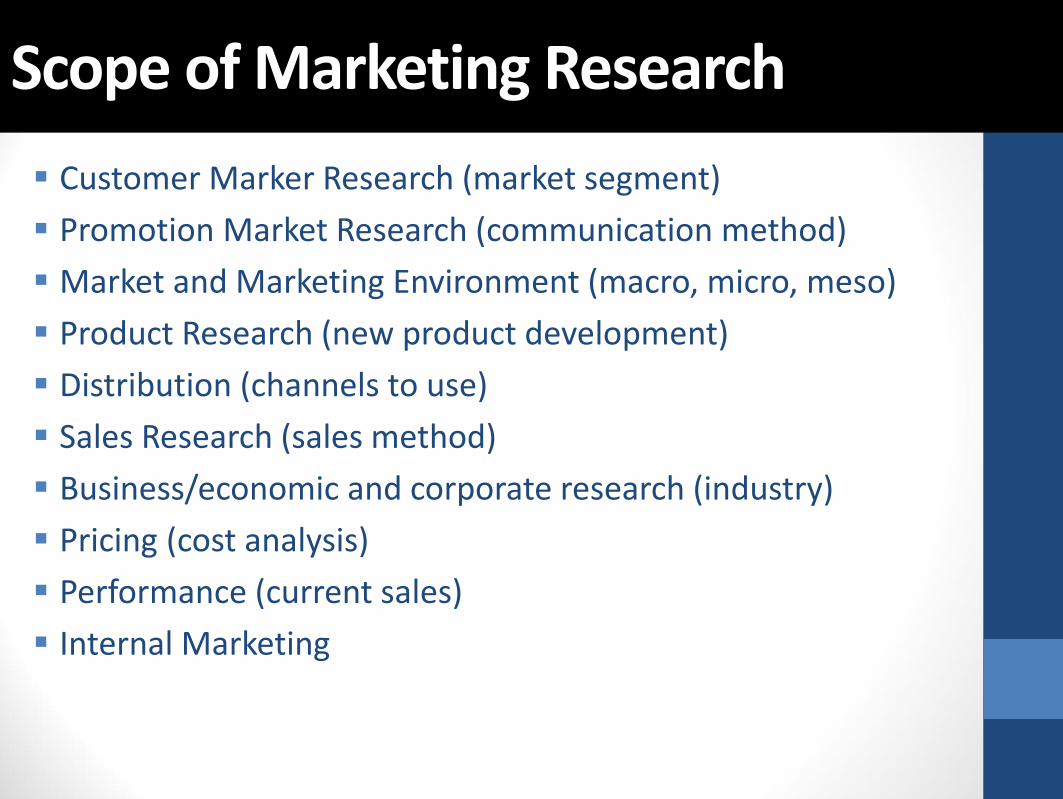
Scope of Marketing Research Customer Marker Research (market segment) Promotion Market Research (communication method) Market and Marketing Environment (macro, micro, meso) Product Research (new product development) Distribution (channels to use) Sales Research (sales method) Business/economic and corporate research (industry) Pricing (cost analysis) Performance (current sales) Internal Marketing
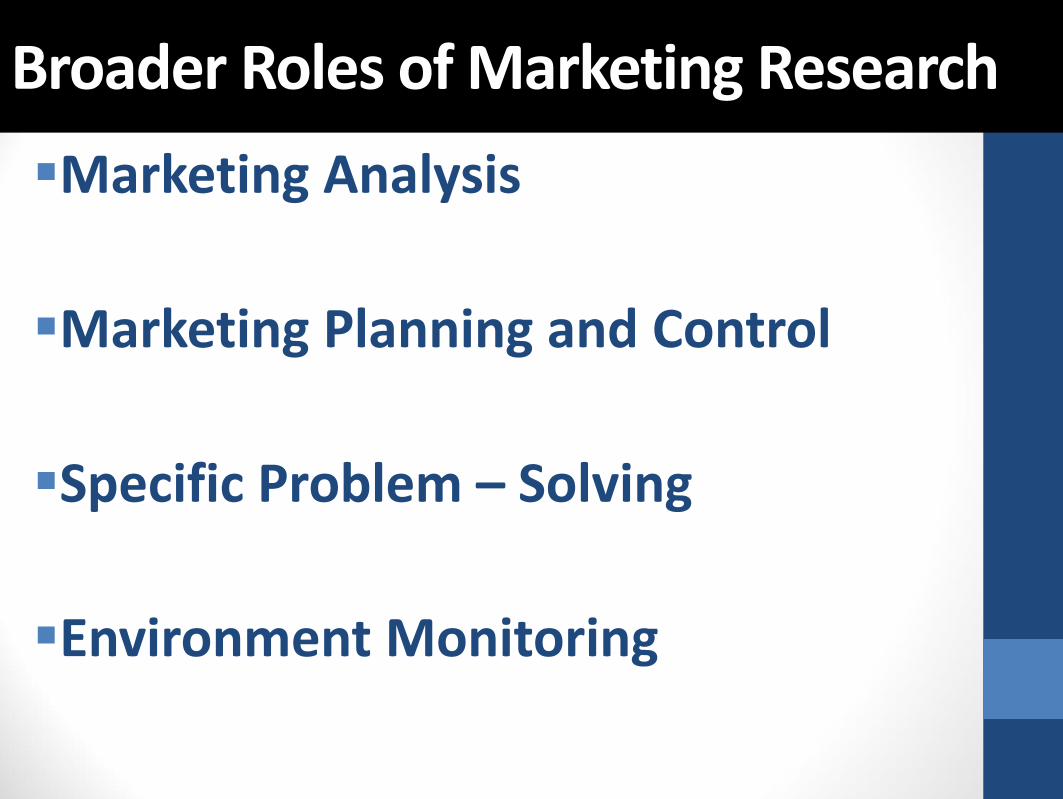
Broader Roles of Marketing Research Marketing Analysis
Marketing Planning and Control
Specific Problem – Solving
Environment Monitoring

“It ain’t the things we don’t know that gets us in trouble. It’s the things we know that ain’t so.”
Artemus Ward

Marketing Research Types Basic research
Applied research
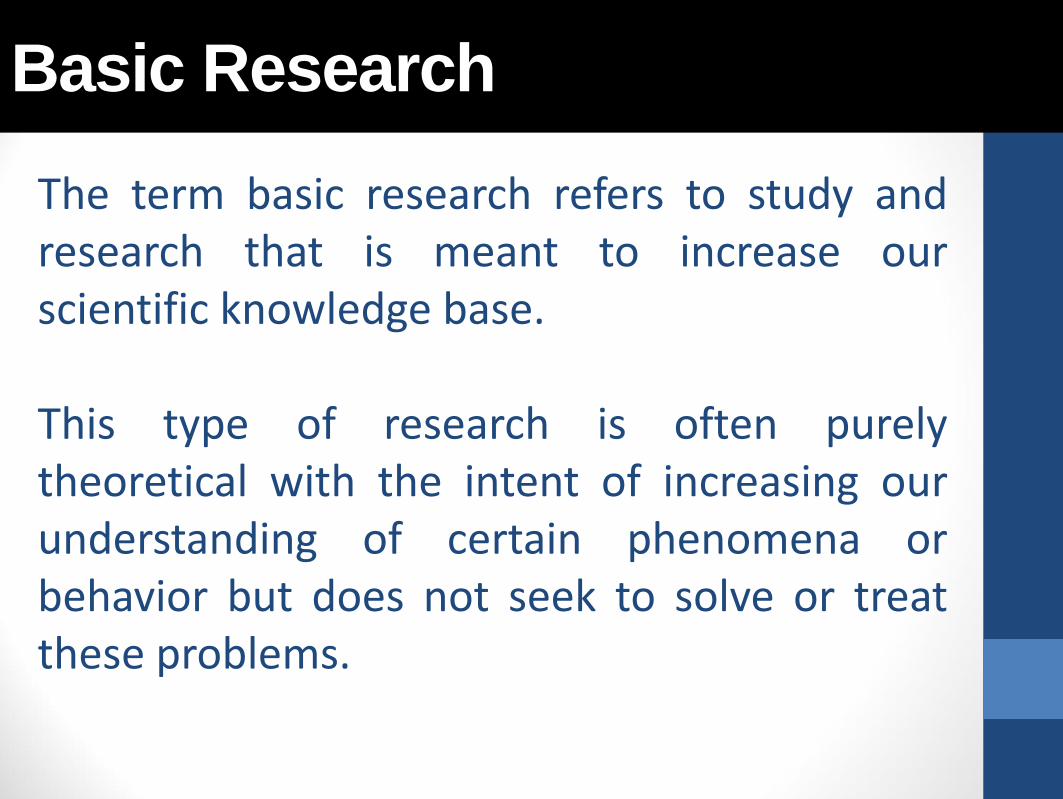
Basic Research The term basic research refers to study and research that is meant to increase our scientific knowledge base. This type of research is often purely theoretical with the intent of increasing our understanding of certain phenomena or behavior but does not seek to solve or treat these problems.
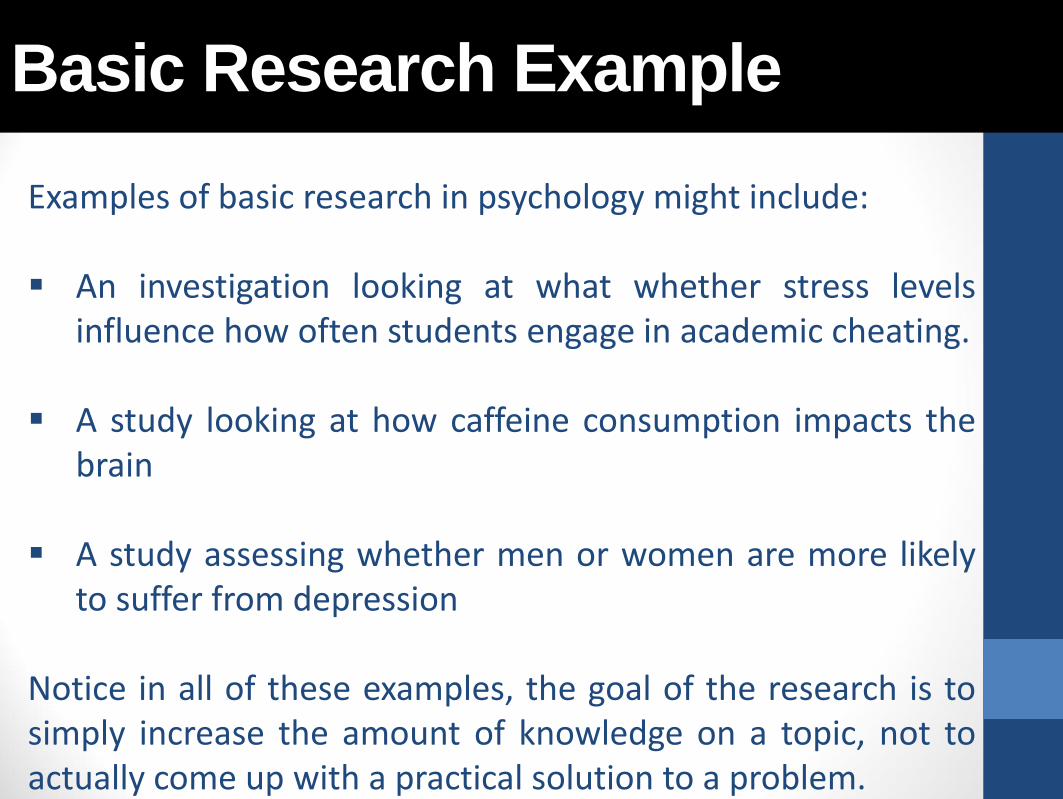
Basic Research Example Examples of basic research in psychology might include: An investigation looking at what whether stress levels
influence how often students engage in academic cheating.
A study looking at how caffeine consumption impacts the brain
A study assessing whether men or women are more likely to suffer from depression
Notice in all of these examples, the goal of the research is to simply increase the amount of knowledge on a topic, not to actually come up with a practical solution to a problem.

Applied Research • Conducted when a decision must be
made about a specific real-life problem Applied research refers to scientific study and research that seeks to solve practical problems. Applied research is used to find solutions to everyday problems, cure illness, and develop innovative technologies. Psychologists working in human factors or industrial/organizational fields often do this type of research.

Applied Research Example A few examples of applied research in psychology include:
Investigating which treatment approach is the most effective
for reducing anxiety Researching which strategies work best to motivate workers
Studying different keyboard designs to determine which is
the most efficient and ergonomic Analysing what type of prompts will inspire people to
volunteer their time to charities
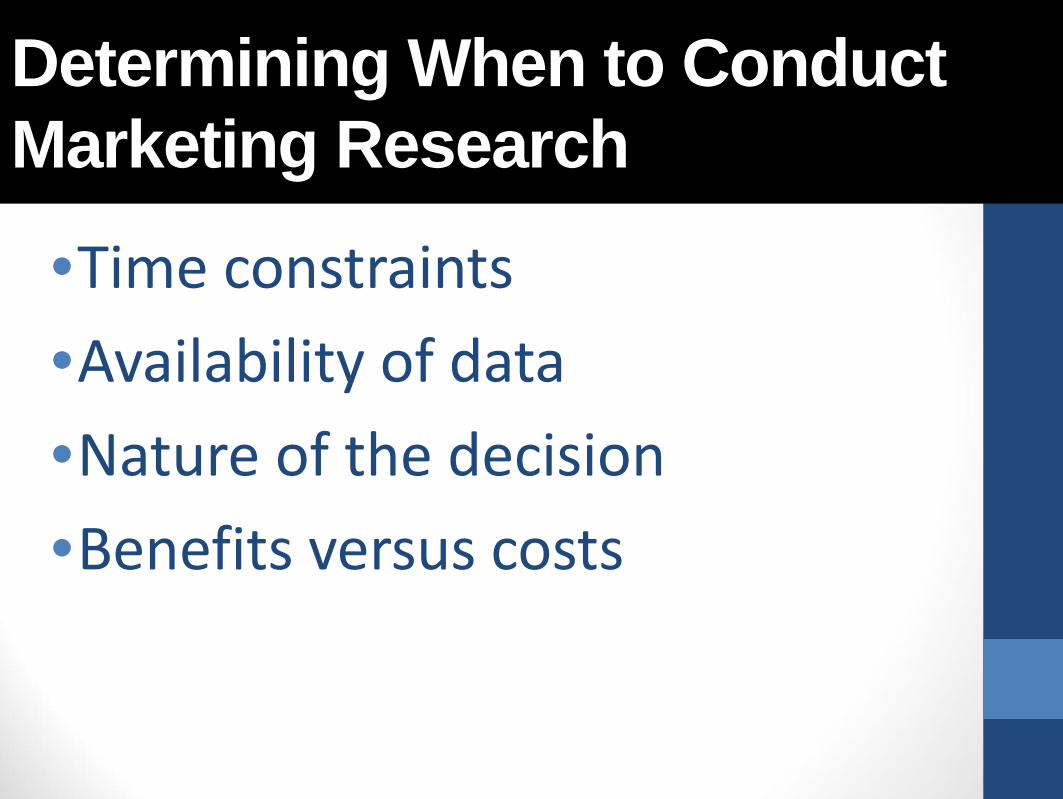
Determining When to Conduct Marketing Research
•Time constraints •Availability of data •Nature of the decision •Benefits versus costs

Types of Market Research Designs / Methods / Approaches
Primary
• New research carried out on a particular topic
Secondary
• Research using existing published sources of relevant information.
Qualitative
• Research that seeks customer opinions and views. For example, a Market Researcher may stop a consumer who has purchased a particular type of bread and ask him or her why that type of bread was chosen.
Quantitative
• Research where results can be expressed in numbers. For example, a bank might ask its customers to rate its overall service as either excellent, good, poor or very poor. This will provide quantitative information that can be analysed statistically.
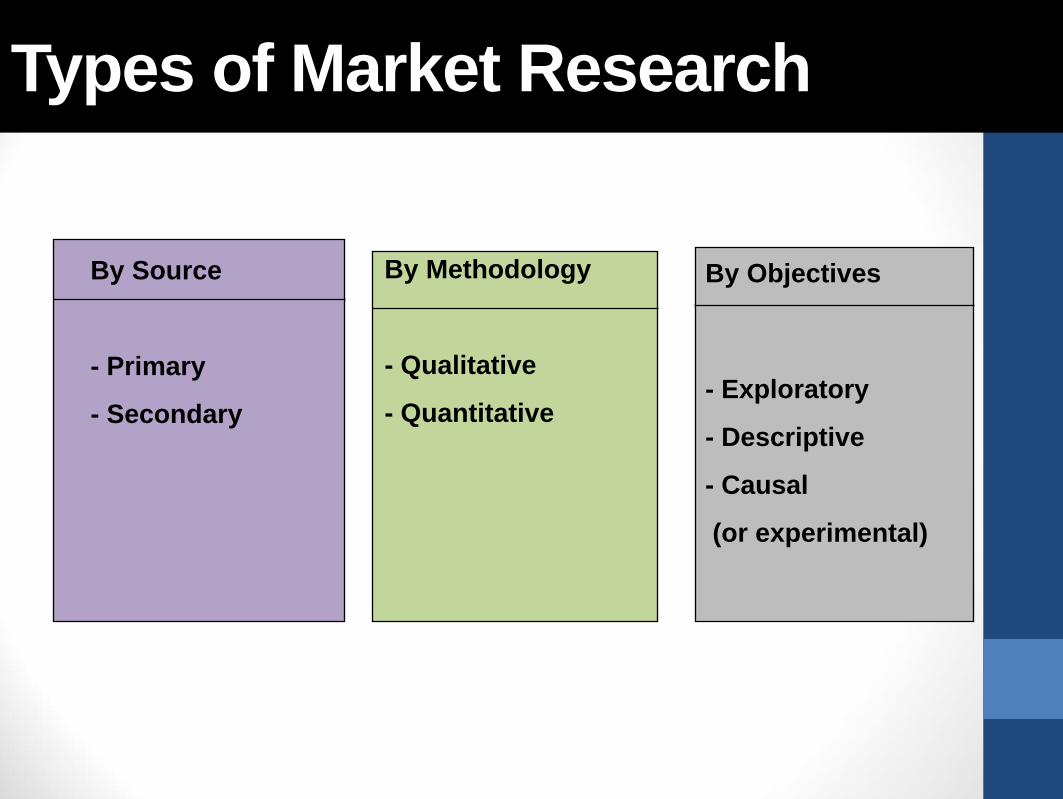
Types of Market Research
By Source
- Primary
- Secondary
By Methodology
- Qualitative
- Quantitative
- Exploratory
- Descriptive
- Causal
(or experimental)
By Objectives
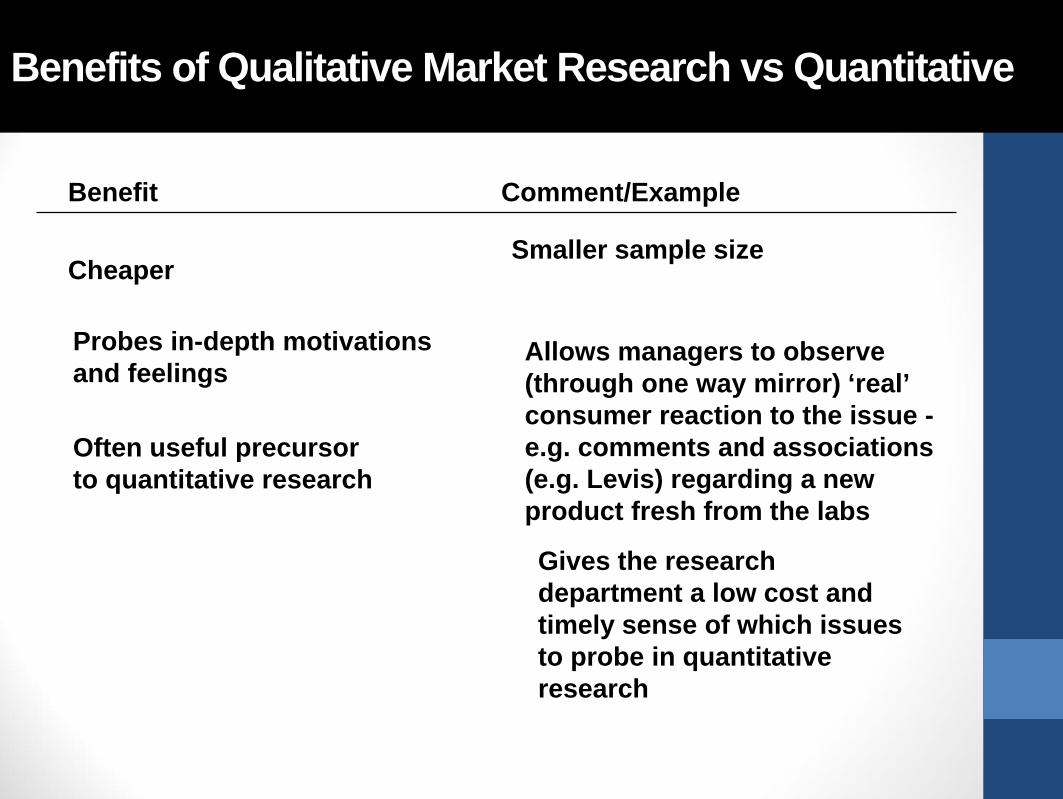
Benefits of Qualitative Market Research vs Quantitative
Benefit Comment/Example
Cheaper
Probes in-depth motivations and feelings
Often useful precursor to quantitative research
Smaller sample size
Allows managers to observe (through one way mirror) ‘real’ consumer reaction to the issue - e.g. comments and associations (e.g. Levis) regarding a new product fresh from the labs
Gives the research department a low cost and timely sense of which issues to probe in quantitative research
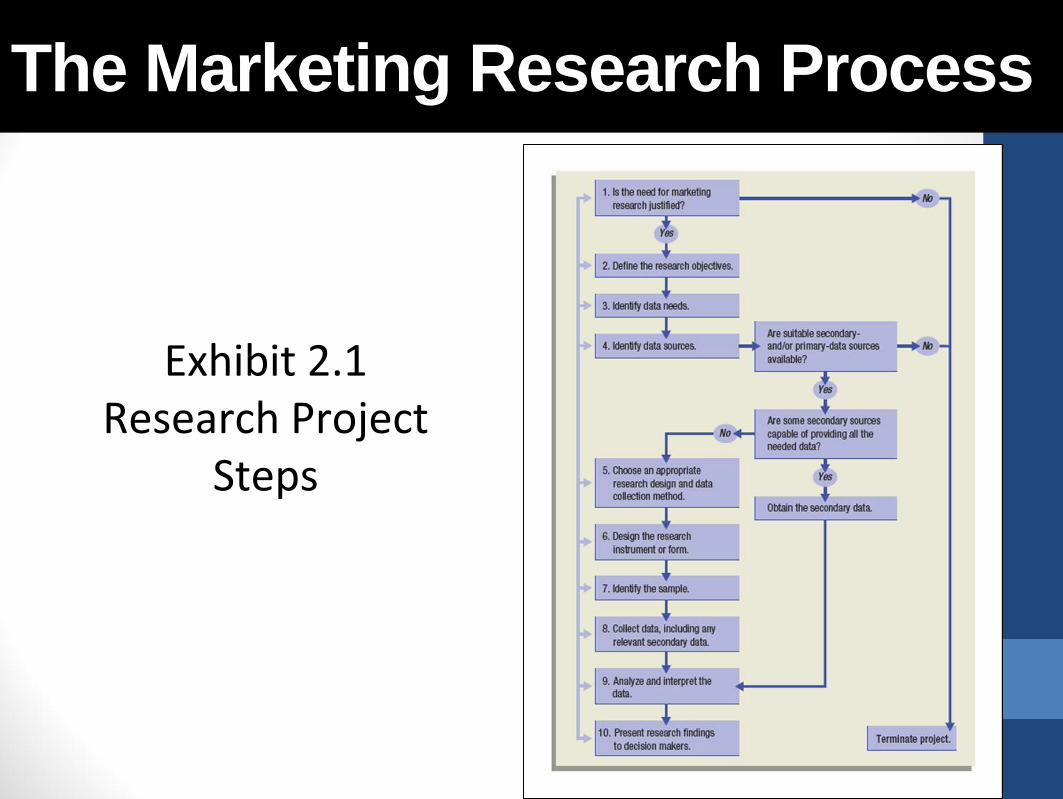
The Marketing Research Process Exhibit 2.1
Research Project Steps
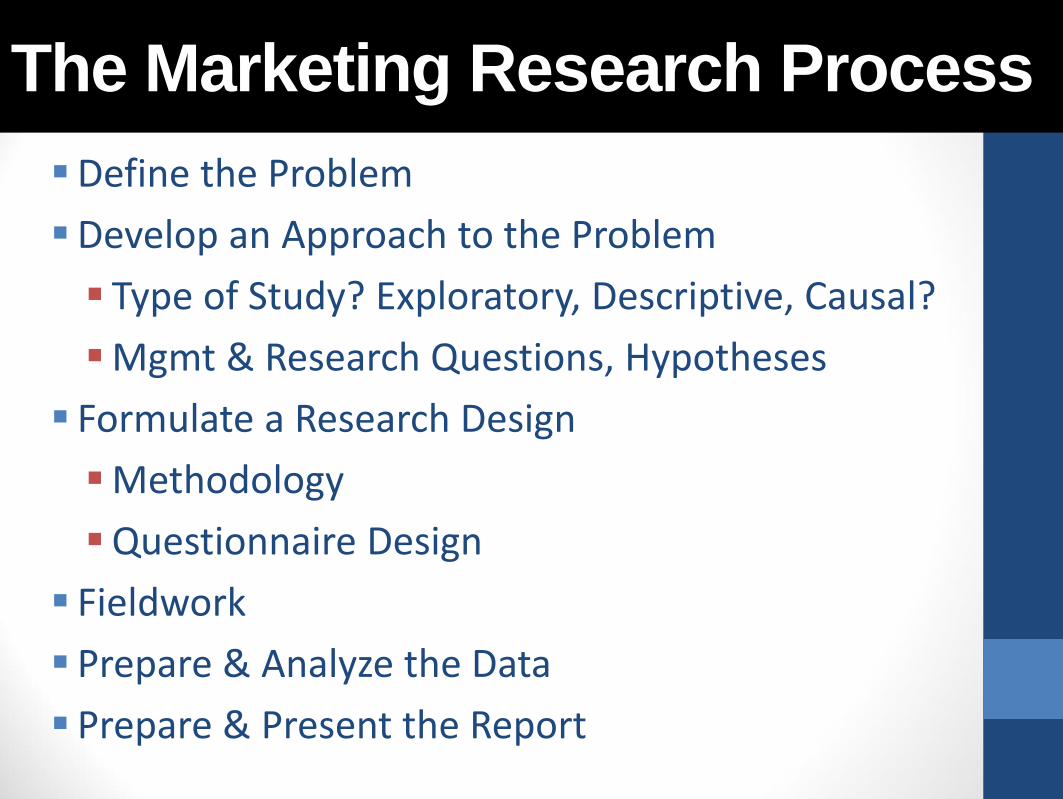
The Marketing Research Process Define the Problem Develop an Approach to the Problem Type of Study? Exploratory, Descriptive, Causal? Mgmt & Research Questions, Hypotheses Formulate a Research Design Methodology Questionnaire Design Fieldwork Prepare & Analyze the Data Prepare & Present the Report

Is sufficient time
available?
Information already on
hand inadequate?
Is the decision of
strategic or tactical
importance?
Does the information
value exceed the
research cost?
Conduct Marketing Research
Do Not Conduct Marketing Research
Time Constraints Availability of Data Nature of the Decision Benefits vs. Costs
Yes Yes Yes Yes
No No No No
Determining When to Conduct Marketing Research
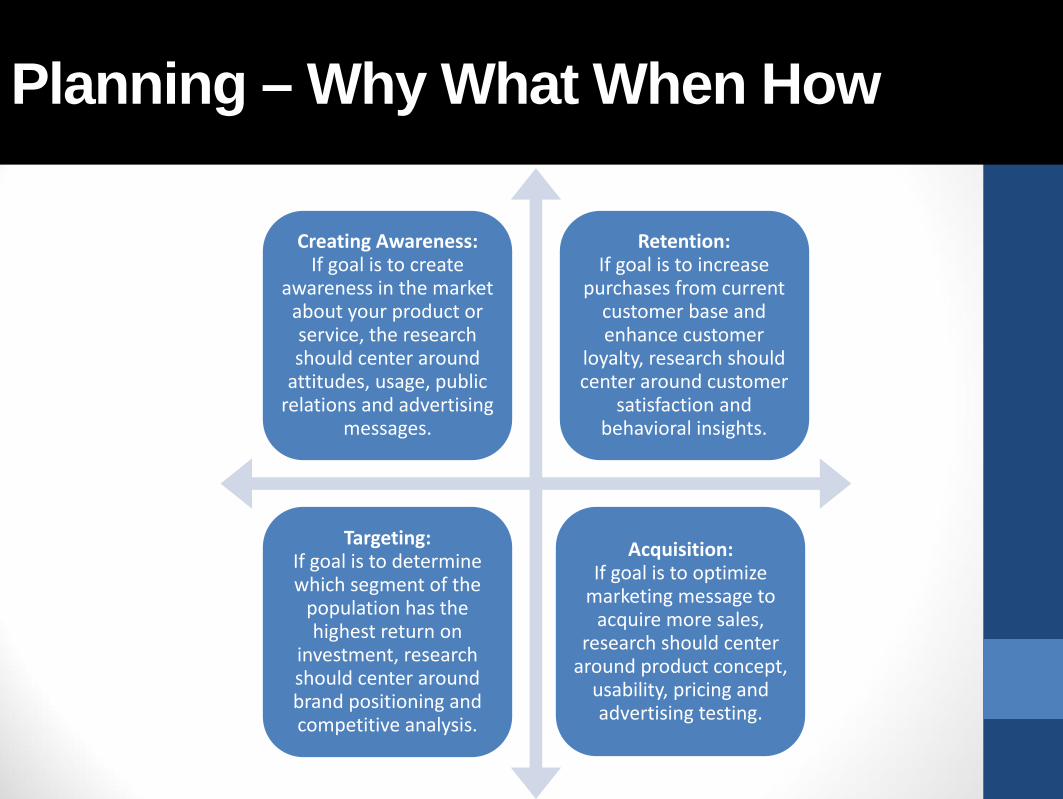
Planning – Why What When How
Planning – Why What When How
Creating Awareness: If goal is to create
awareness in the market about your product or service, the research should center around
attitudes, usage, public relations and advertising
messages.
Retention: If goal is to increase
purchases from current customer base and enhance customer
loyalty, research should center around customer
satisfaction and behavioral insights.
Acquisition: If goal is to optimize
marketing message to acquire more sales,
research should center around product concept,
usability, pricing and advertising testing.
Targeting: If goal is to determine which segment of the
population has the highest return on
investment, research should center around brand positioning and competitive analysis.

Sampling = Population
Planning – Why What When How
Any Complete Group
People Sales Territories Stores
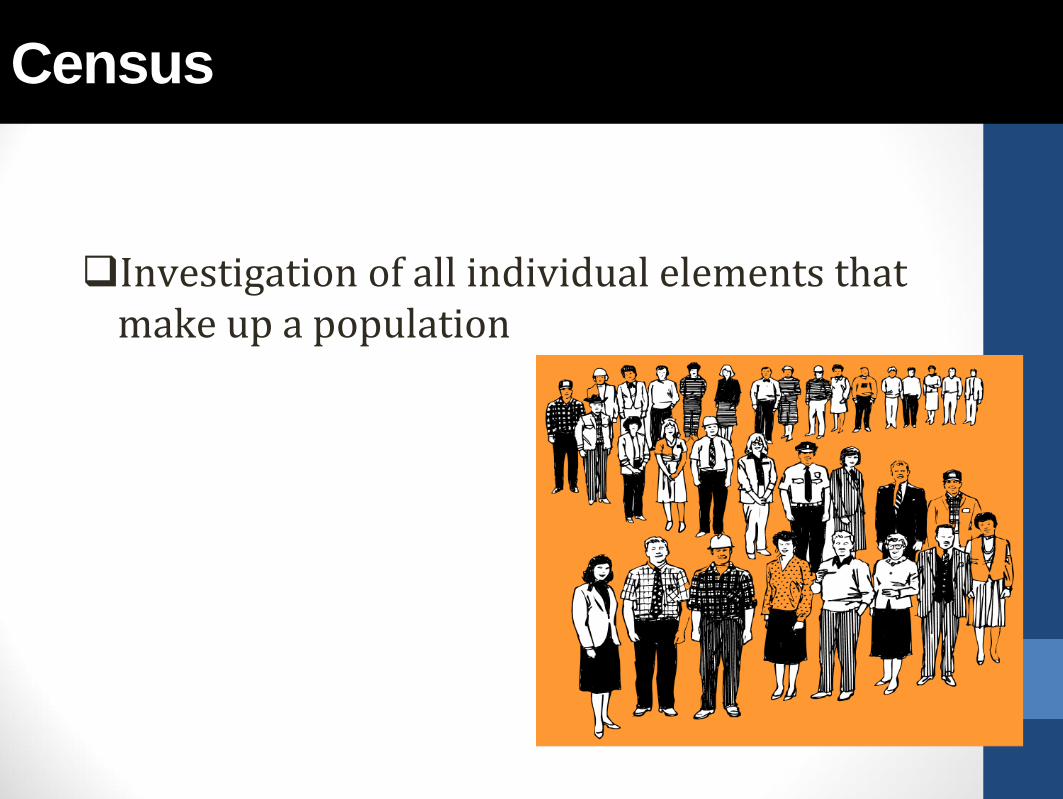
Census
Planning – Why What When How
Investigation of all individual elements that make up a population

Census
Stages in the Selection of a Sample
Define the target population
Select a sampling frame
Conduct fieldwork
Determine if a probability or nonprobability sampling method will be chosen
Plan procedure for selecting sampling units
Determine sample size
Select actual sampling units

Target Population
Planning – Why What When How
Relevant Population Operationally Define Comic Book Reader?

Sampling Frame
Planning – Why What When How
A list of elements from which the sample may be drawn Working Population Mailing Lists - Data Base Marketers Sampling Frame Error
Sampling Unit
Planning – Why What When How
Group selected for the sample Primary Sampling Units (PSU) Secondary Sampling Units Tertiary Sampling Units
Random Sampling Error
Planning – Why What When How
• The difference between the sample results and the result of a census conducted using identical procedures
• Statistical fluctuation due to chance variations
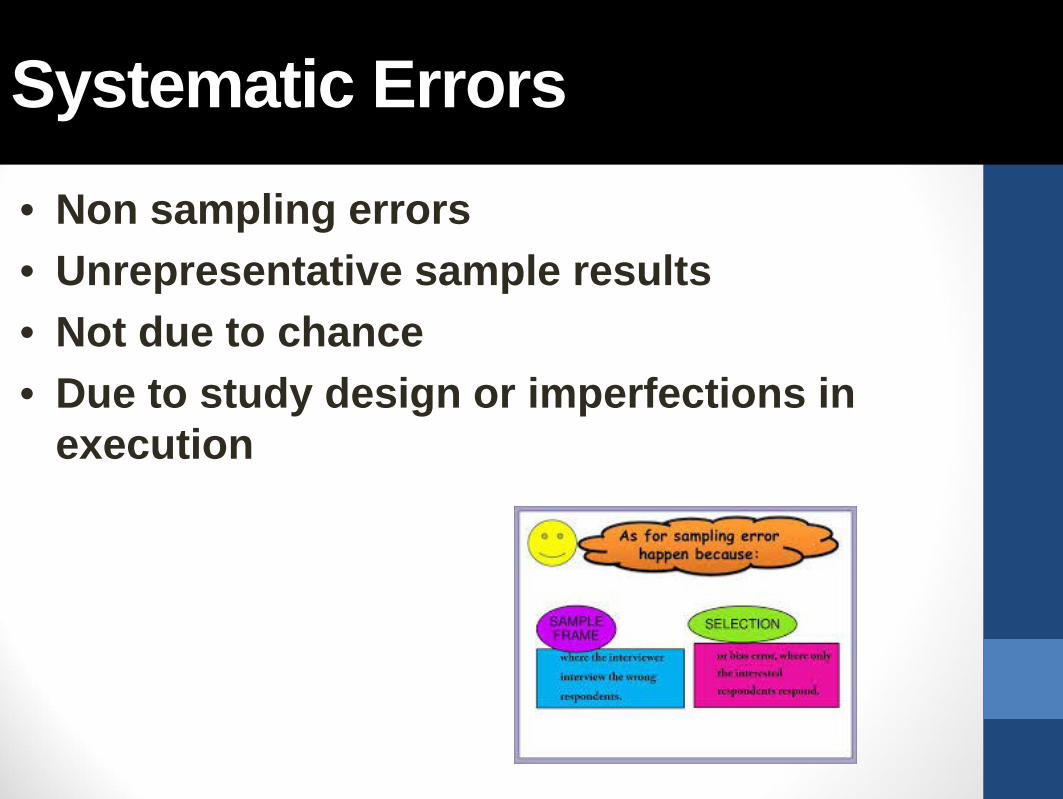
Systematic Errors
Planning – Why What When How
• Non sampling errors • Unrepresentative sample results • Not due to chance • Due to study design or imperfections in
execution

Errors Associated with Sampling
Planning – Why What When How
• Sampling Frame Error • Random Sampling Error • Nonresponse Error

Probability Sampling
Planning – Why What When How
Simple Random Sample Systematic Sample Stratified Sample Cluster Sample Multistage Area Sample

Convenience Sampling
Planning – Why What When How
Also called haphazard or accidental sampling The sampling procedure of obtaining the
people or units that are most conveniently available

Judgment Sampling
Planning – Why What When How
Also called purposive sampling An experienced individual selects the
sample based on his or her judgment about some appropriate characteristics required of the sample member
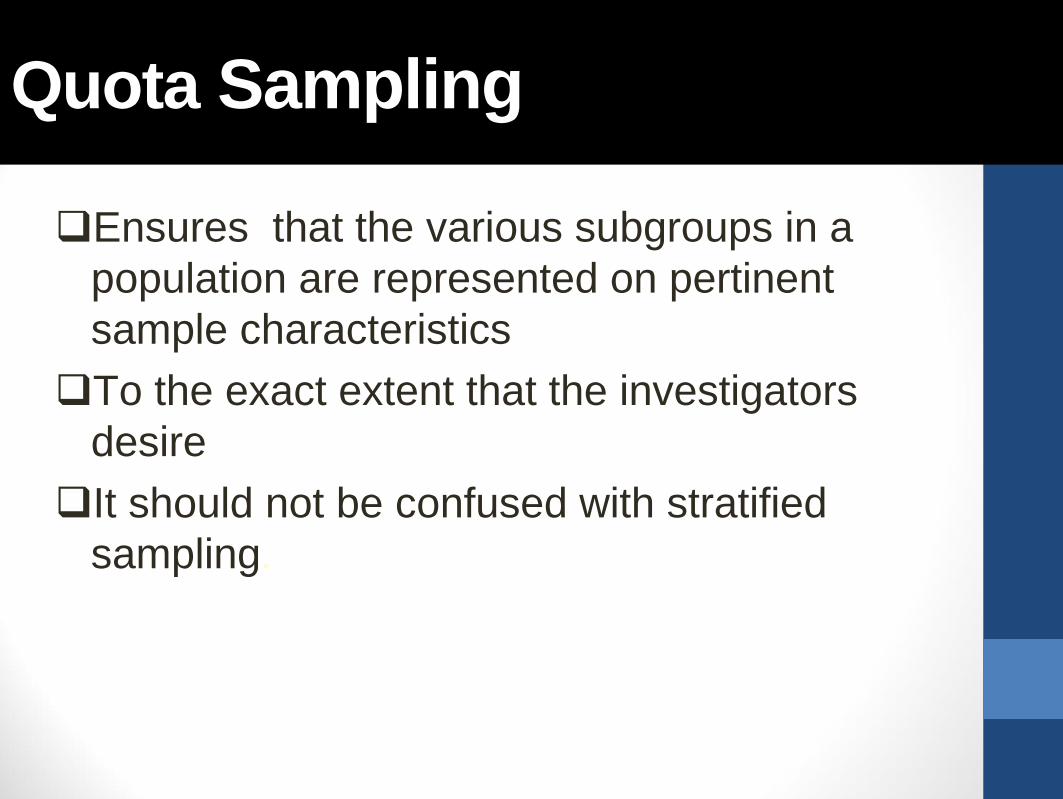
Quota Sampling
Planning – Why What When How
Ensures that the various subgroups in a
population are represented on pertinent sample characteristics To the exact extent that the investigators
desire It should not be confused with stratified
sampling.
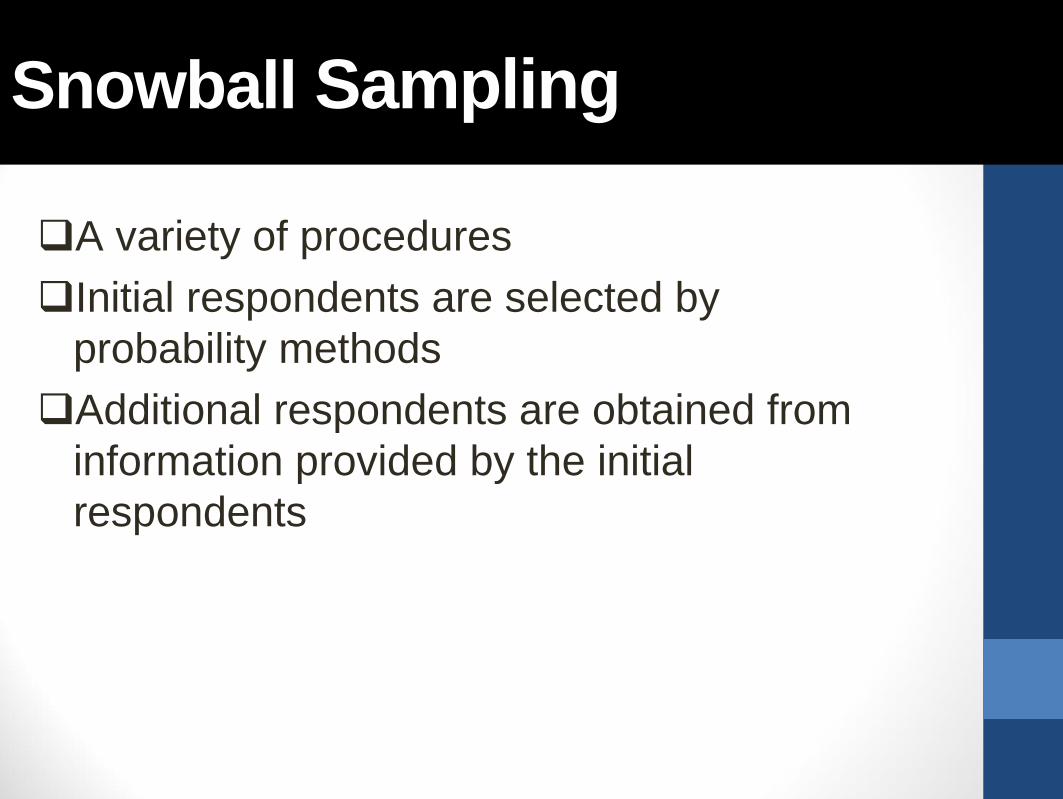
Snowball Sampling
Planning – Why What When How
A variety of procedures Initial respondents are selected by
probability methods Additional respondents are obtained from
information provided by the initial respondents

Simple Random Sampling
Planning – Why What When How
• A sampling procedure that ensures that each element in the population will have an equal chance of being included in the sample

Systematic Sampling
Planning – Why What When How
A simple process Every nth name from the list will be drawn
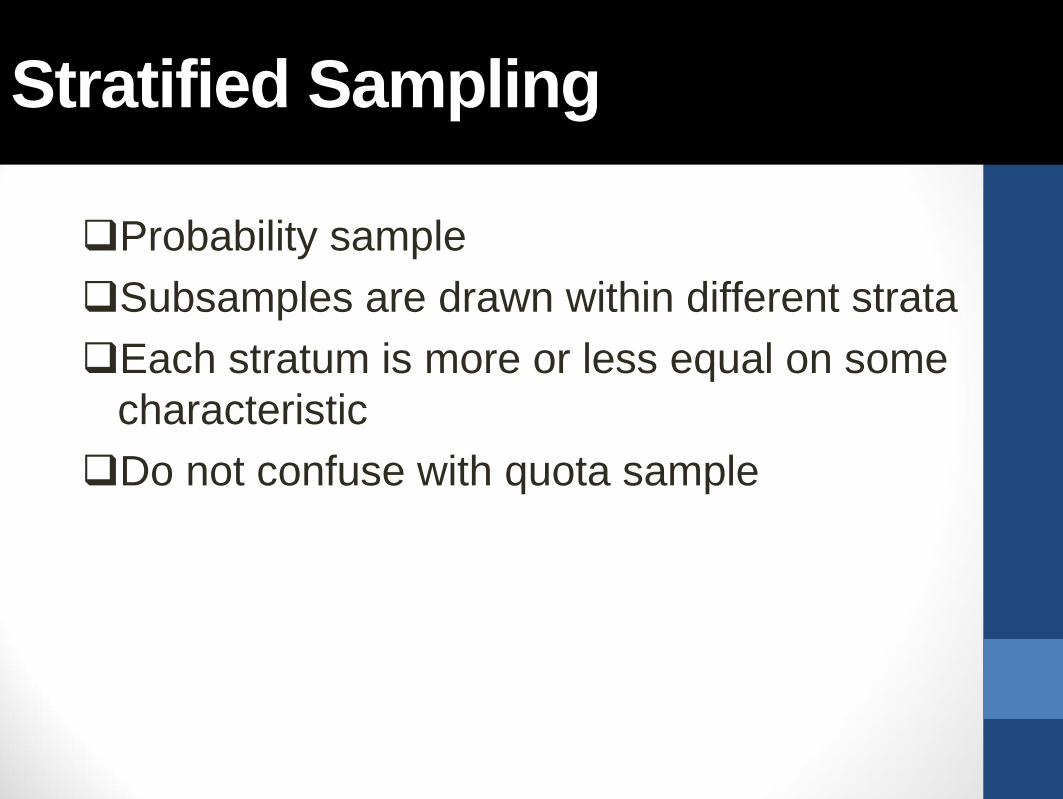
Stratified Sampling
Planning – Why What When How
Probability sample Subsamples are drawn within different strata Each stratum is more or less equal on some
characteristic Do not confuse with quota sample
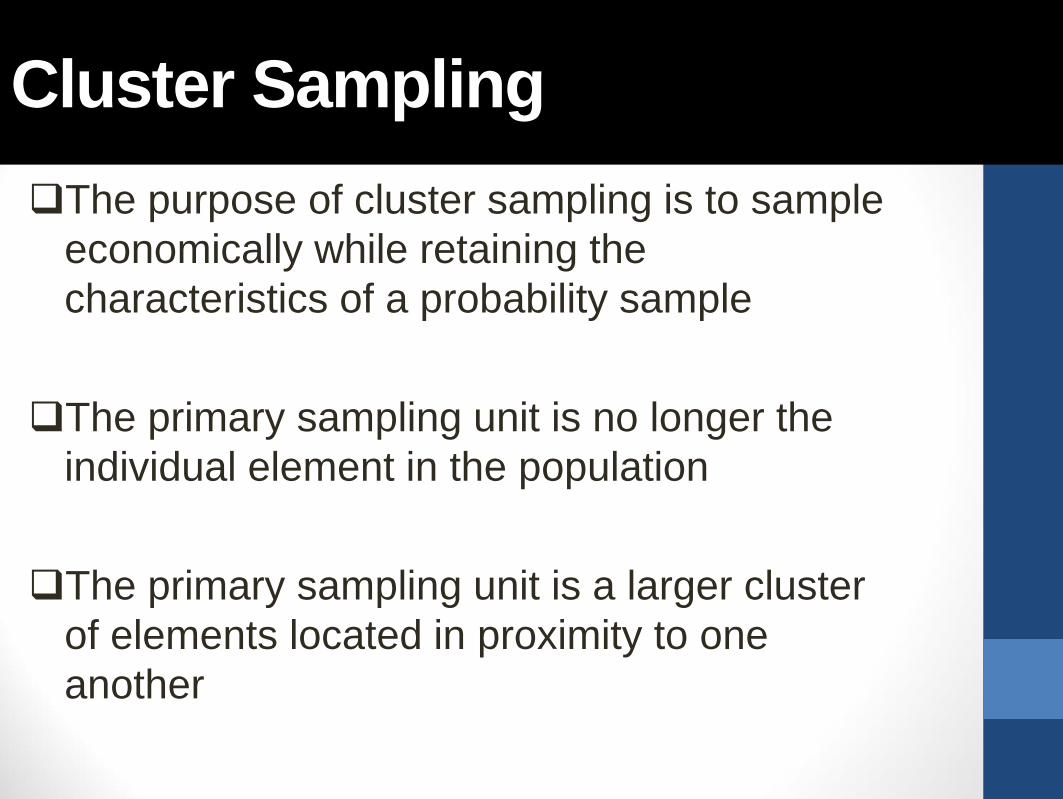
Cluster Sampling
Planning – Why What When How
The purpose of cluster sampling is to sample economically while retaining the characteristics of a probability sample The primary sampling unit is no longer the
individual element in the population The primary sampling unit is a larger cluster
of elements located in proximity to one another
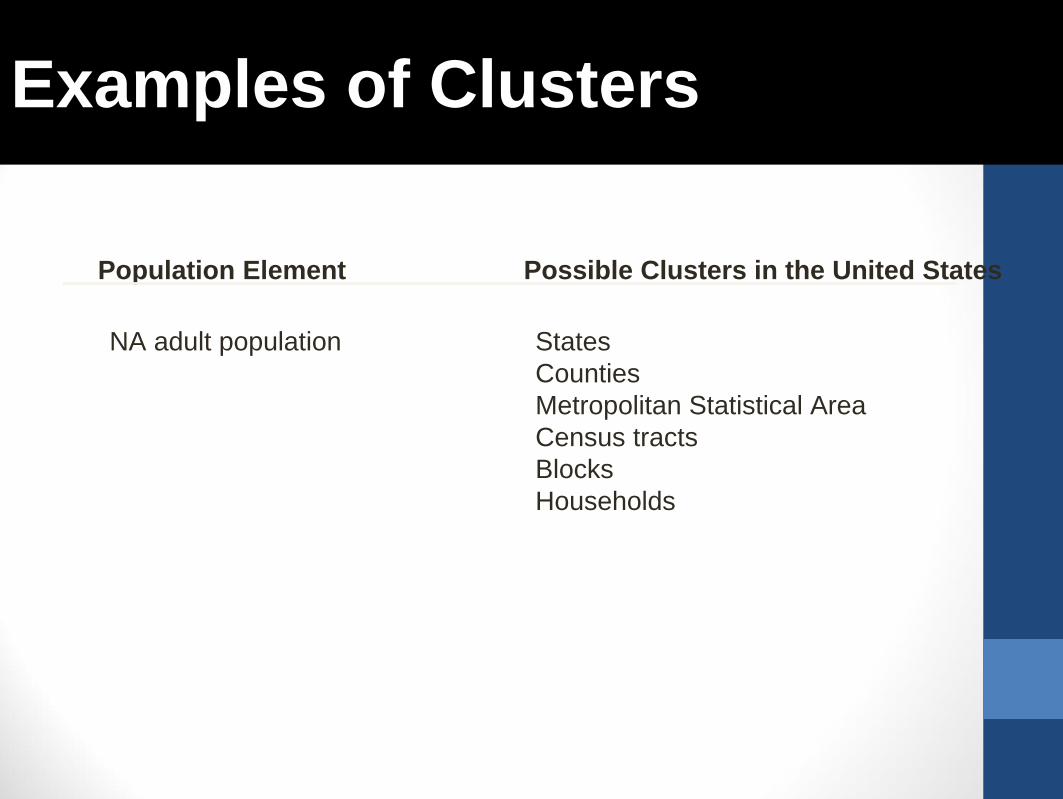
Examples of Clusters
Planning – Why What When How
Population Element Possible Clusters in the United States
NA adult population States Counties Metropolitan Statistical Area Census tracts Blocks Households

What is the Appropriate Sample Design?
Planning – Why What When How
Degree of Accuracy Resources Time Advanced Knowledge of the Population National versus Local Need for Statistical Analysis

After the Sample Design is Selected
Planning – Why What When How
Determine sample size Select actual sample units Conduct fieldwork

Univariate Analysis
Planning – Why What When How
Univariate Analysis – The analysis of a single variable, for purposes of description (examples: frequency distribution, averages, and measures of dispersion). Example: Gender The number of men in a sample/population and
the number of women in a sample/population.

.
How many responses do you really need? This simple question is a never-ending quandary for researchers. A larger sample can yield more accurate results — but excessive responses can be pricey. Consequential research requires an understanding of the statistics that drive sample size decisions. A simple equation will help you put the migraine pills away and sample confidently. Before you can calculate a sample size, you need to determine a few things about the target population and the sample you need: 1.Population Size — How many total people fit your demographic? For instance, if you want to know about mothers living in Namibia, your population size would be the total number of mothers living in Namibia. Don’t worry if you are unsure about this number. It is common for the population to be unknown or approximated.
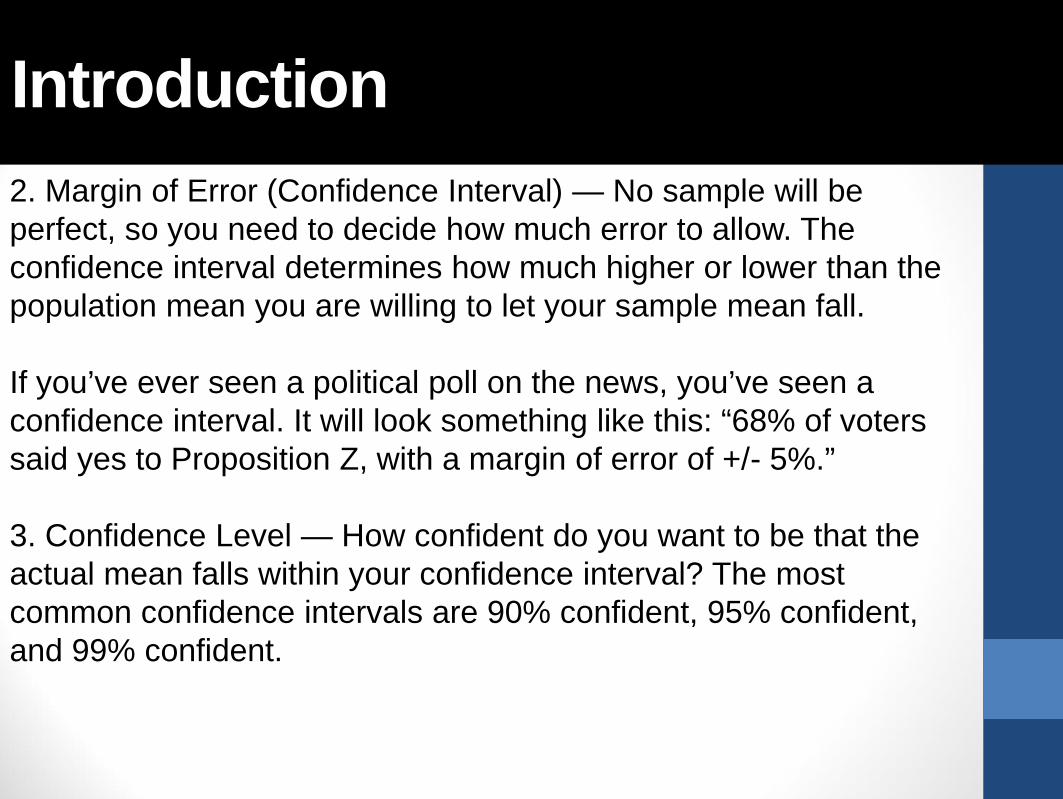
Introduction
.
Introduction 2. Margin of Error (Confidence Interval) — No sample will be perfect, so you need to decide how much error to allow. The confidence interval determines how much higher or lower than the population mean you are willing to let your sample mean fall. If you’ve ever seen a political poll on the news, you’ve seen a confidence interval. It will look something like this: “68% of voters said yes to Proposition Z, with a margin of error of +/- 5%.” 3. Confidence Level — How confident do you want to be that the actual mean falls within your confidence interval? The most common confidence intervals are 90% confident, 95% confident, and 99% confident.

.
Introduction Standard of Deviation — How much variance do you expect in your responses? Since we haven’t actually administered our survey yet, the safe decision is to use .5 – this is the most forgiving number and ensures that your sample will be large enough. Okay, now that we have these values defined, we can calculate our needed sample size. Your confidence level corresponds to a Z-score. This is a constant value needed for this equation. Here are the z-scores for the most common confidence levels: 90% – Z Score = 1.645 95% – Z Score = 1.96 99% – Z Score = 2.576

Univariate Analysis
Planning – Why What When How
Distributions Frequency Distributions – A description of the
number of times the various attributes of a variable are observed in a sample.
Central Tendency Average – An ambiguous term generally
suggesting typical or normal – a central tendency (examples: mean, median, mode).

Univariate Analysis
Planning – Why What When How
Mean – an average computed by summing the values of several observations and dividing by the number of observations.
Mode- an average representing the most frequently observed value or attribute.
Median – an average representing the value of the “middle” case in a rank-ordered set of observations.

Univariate Analysis
Planning – Why What When How
Practice: The following list represents the scores on a mid-term exam. 100, 94, 88, 91, 75, 61, 93, 82, 70, 88, 71, 88
Determine the mean.
Determine the mode.
Determine the median.
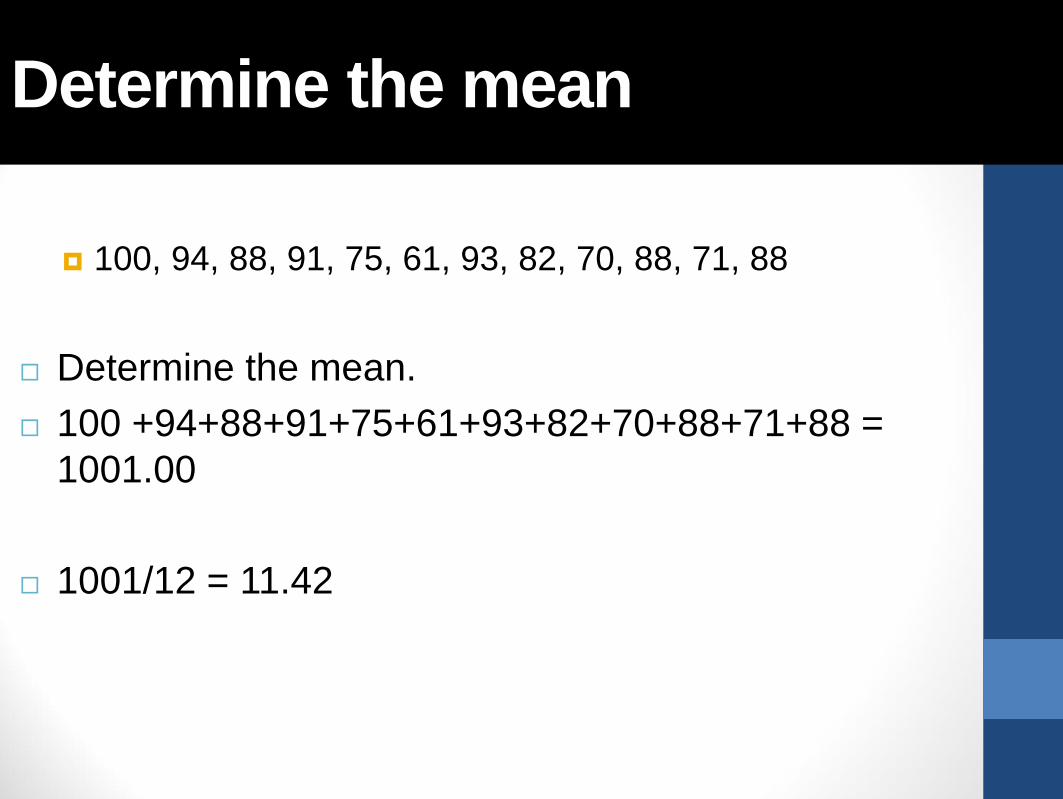
Determine the mean
Planning – Why What When How
100, 94, 88, 91, 75, 61, 93, 82, 70, 88, 71, 88
Determine the mean. 100 +94+88+91+75+61+93+82+70+88+71+88 =
1001.00
1001/12 = 11.42

Determine the mode
Planning – Why What When How
100, 94, 88, 91, 75, 61, 93, 82, 70, 88, 71, 88
Determine the mode.
Arrange them in order: 61, 70, 71, 75, 82, 88, 88, 88, 91, 93, 94, 100
This makes it easy to see which numbers appear
most often.
In this case the mode is 88.

Determine the median.
Planning – Why What When How
100, 94, 88, 91, 75, 61, 93, 82, 70, 88, 71, 88
Determine the median. When we put those numbers in order we have:
61, 70, 71, 75, 82, 88, 88, 88, 91, 93, 94, 100 88 + 88 = 176 then 176 ÷ 2 = 88 So the Median in this example is 88
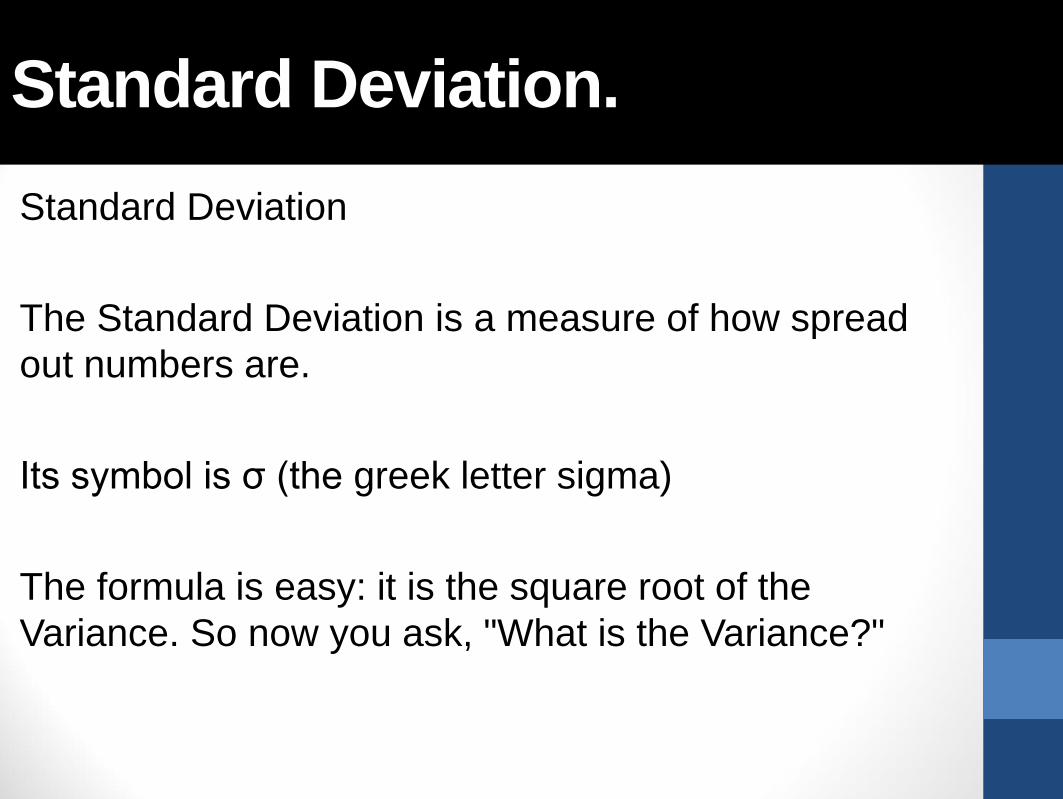
Standard Deviation.
Planning – Why What When How
Standard Deviation The Standard Deviation is a measure of how spread out numbers are. Its symbol is σ (the greek letter sigma) The formula is easy: it is the square root of the Variance. So now you ask, "What is the Variance?"

Variance
Planning – Why What When How
The Variance is defined as: The average of the squared differences from the Mean To calculate the variance follow these steps: Work out the Mean (the simple average of the numbers) Then for each number: subtract the Mean and square the result (the squared difference). Then work out the average of those squared differences. (Why Square?)Deviation The Standard Deviation is a measure of how spread out numbers are. Its symbol is σ (the greek letter sigma) The formula is easy: it is the square root of the Variance.

Standard Deviation.
Planning – Why What When How
Here is the formula for z-score : z is the "z-score" (Standard Score) x is the value to be standardized μ is the mean σ is the standard deviation

Example.
Planning – Why What When How
The heights (at the shoulders) are: 600mm, 470mm, 170mm, 430mm and 300mm. Find out the Mean, the Variance, and the Standard Deviation. Your first step is to find the Mean: Answer: Mean = 600 + 470 + 170 + 430 + 3005 = 19705 = 394

Example.
Planning – Why What When How
Now we calculate each dog's difference from the Mean: Now we calculate each dog's difference from the Mean:
Example.
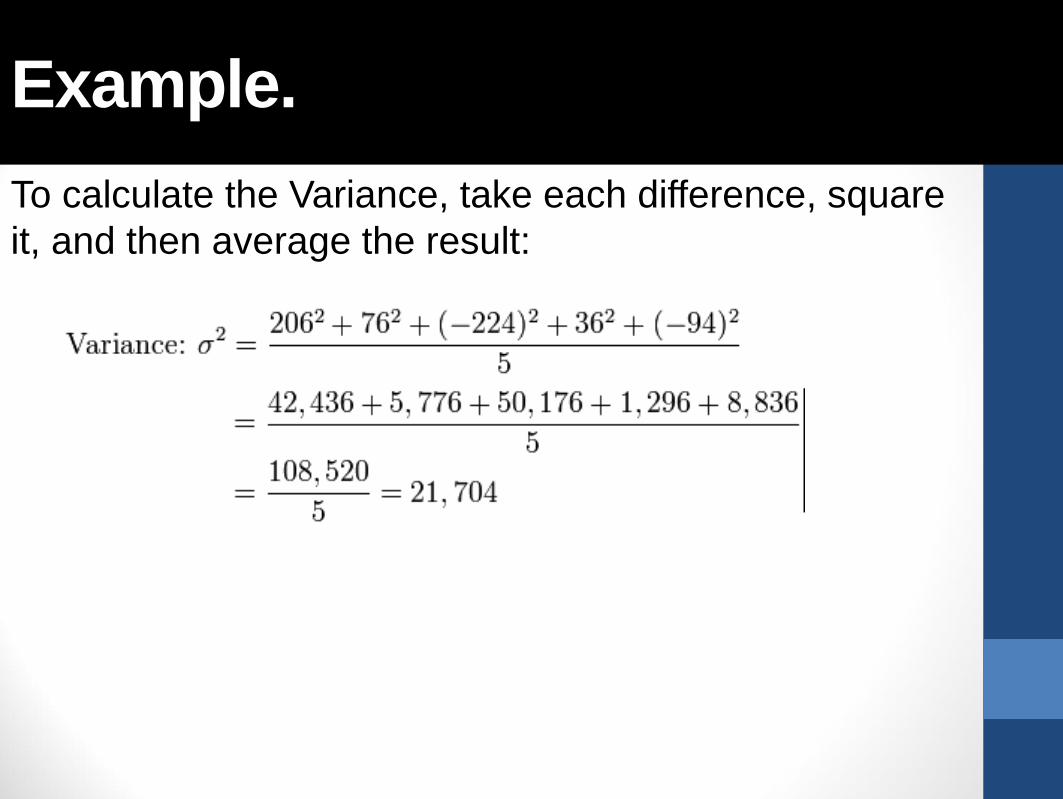
Planning – Why What When How
To calculate the Variance, take each difference, square it, and then average the result:

Example.
Planning – Why What When How
So the Variance is 21,704 And the Standard Deviation is just the square root of Variance, so: Standard Deviation σ = √21,704 = 147.32... = 147 (to the nearest mm)
Example.
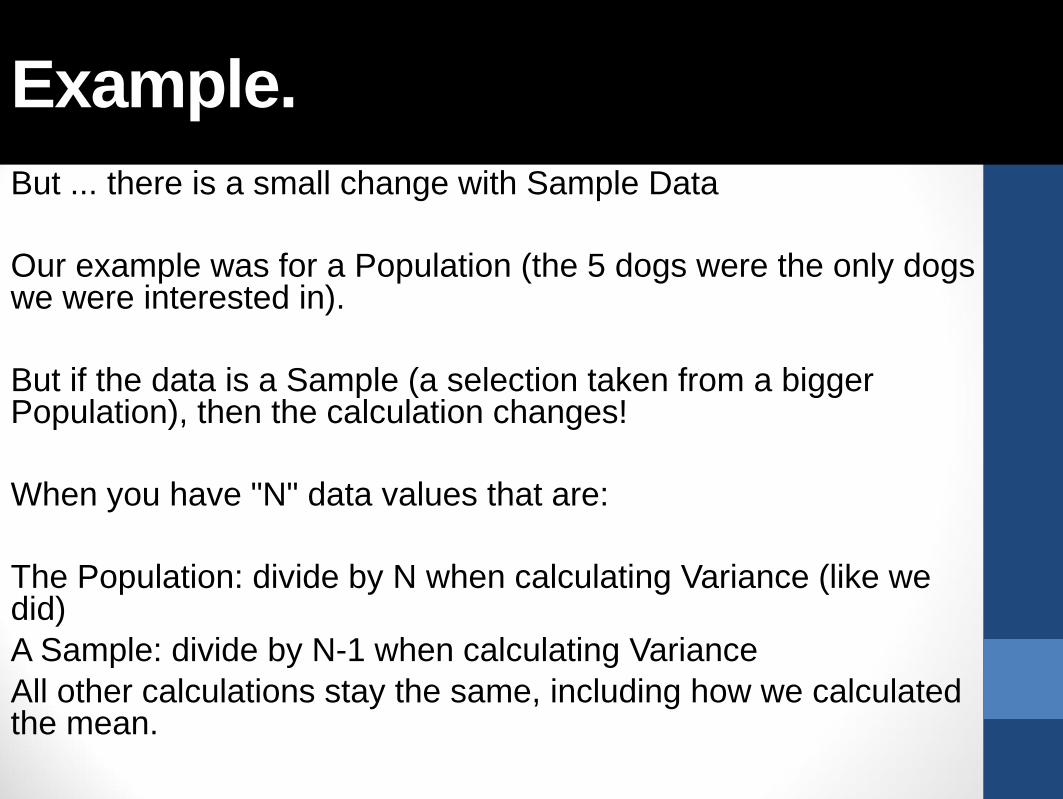
Planning – Why What When How
But ... there is a small change with Sample Data Our example was for a Population (the 5 dogs were the only dogs we were interested in). But if the data is a Sample (a selection taken from a bigger Population), then the calculation changes! When you have "N" data values that are: The Population: divide by N when calculating Variance (like we did) A Sample: divide by N-1 when calculating Variance All other calculations stay the same, including how we calculated the mean.

Example.
Planning – Why What When How
Example: if our 5 dogs were just a sample of a bigger population of dogs, we would divide by 4 instead of 5 like this: Sample Variance = 108,520 / 4 = 27,130 Sample Standard Deviation = √27,130 = 164 (to the nearest mm)
Example.
Planning – Why What When How
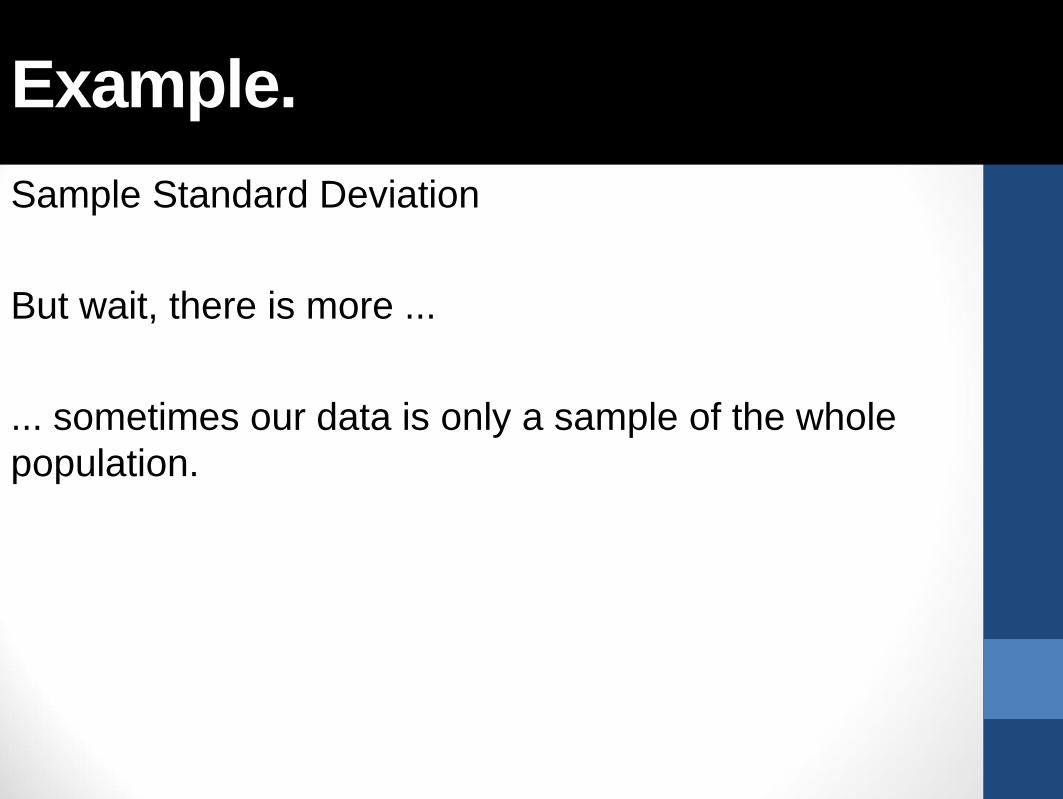
Sample Standard Deviation But wait, there is more ... ... sometimes our data is only a sample of the whole population.

Example.
Planning – Why What When How
Example: Sam has 20 rose bushes, but only counted the flowers on 6 of them! The "population" is all 20 rose bushes, and the "sample" is the 6 that were counted. Let us say they are: 9, 2, 5, 4, 12, 7
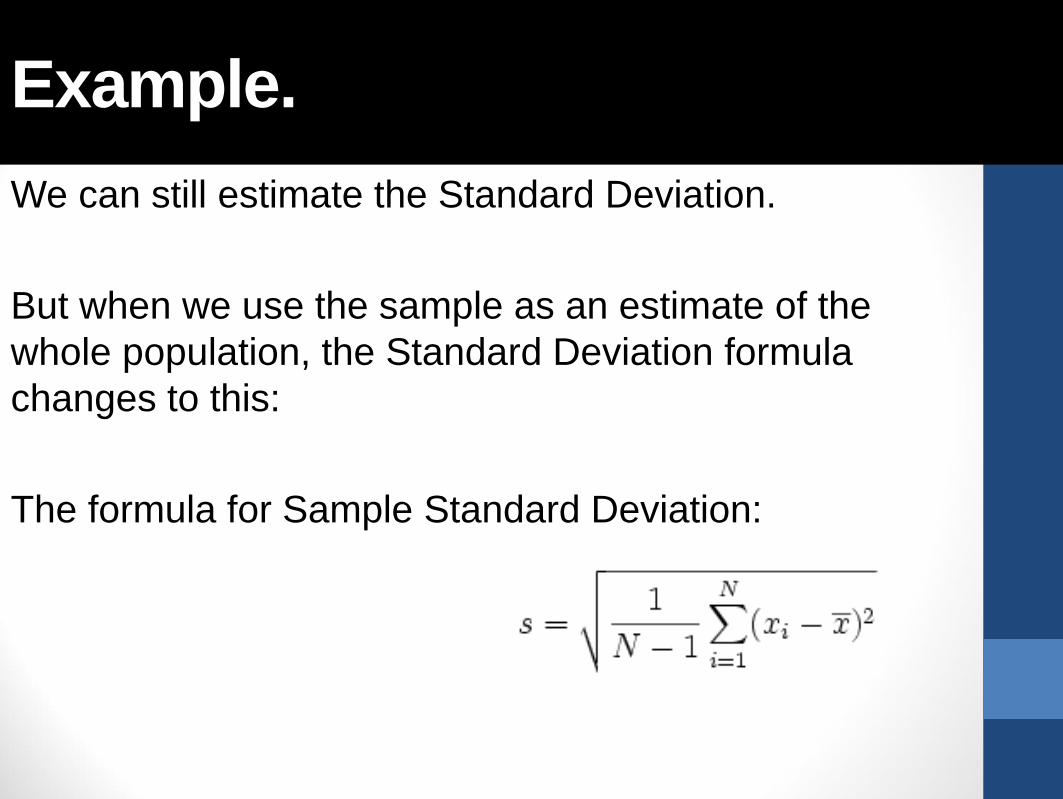
Example.
Planning – Why What When How
We can still estimate the Standard Deviation. But when we use the sample as an estimate of the whole population, the Standard Deviation formula changes to this: The formula for Sample Standard Deviation:

Example.
Planning – Why What When How
The symbols also change to reflect that we are working on a sample instead of the whole population: The mean is now x (for sample mean) instead of μ (the population mean), And the answer is s (for Sample Standard Deviation) instead of σ. But that does not affect the calculations. Only N-1 instead of N changes the calculations.

Calculating the Sample Standard Deviation:
Planning – Why What When How
Step 1. Work out the mean Example 2: Using sampled values 9, 2, 5, 4, 12, 7 The mean is (9+2+5+4+12+7) / 6 = 39/6 = 6.5 So: x = 6.5

Calculating the Sample Standard Deviation:
Planning – Why What When How
Step 2. Then for each number: subtract the Mean and square the result Example 2 (continued): (9 - 6.5)2 = (2.5)2 = 6.25 (2 - 6.5)2 = (-4.5)2 = 20.25 (5 - 6.5)2 = (-1.5)2 = 2.25 (4 - 6.5)2 = (-2.5)2 = 6.25 (12 - 6.5)2 = (5.5)2 = 30.25 (7 - 6.5)2 = (0.5)2 = 0.25

Calculating the Sample Standard Deviation:
Planning – Why What When How
Step 3. Then work out the mean of those squared differences. To work out the mean, add up all the values then divide by how many. But hang on ... we are calculating the Sample Standard Deviation, so instead of dividing by how many (N), we will divide by N-1

Calculating the Sample Standard Deviation:
Planning – Why What When How
Example 2 (continued): Sum = 6.25 + 20.25 + 2.25 + 6.25 + 30.25 + 0.25 = 65.5 Divide by N-1: (1/5) × 65.5 = 13.1 (This value is called the "Sample Variance")

Calculating the Sample Standard Deviation:
Planning – Why What When How
Step 4. Take the square root of that: Example 2 (concluded): s = √(13.1) = 3.619...

Calculating the Sample Standard Deviation:
Planning – Why What When How
When we used the whole population we got: Mean = 7, Standard Deviation = 2.983... When we used the sample we got: Sample Mean = 6.5, Sample Standard Deviation = 3.619... Our Sample Mean was wrong by 7%, and our Sample Standard Deviation was wrong by 21%.
Calculating the Sample Standard Deviation:
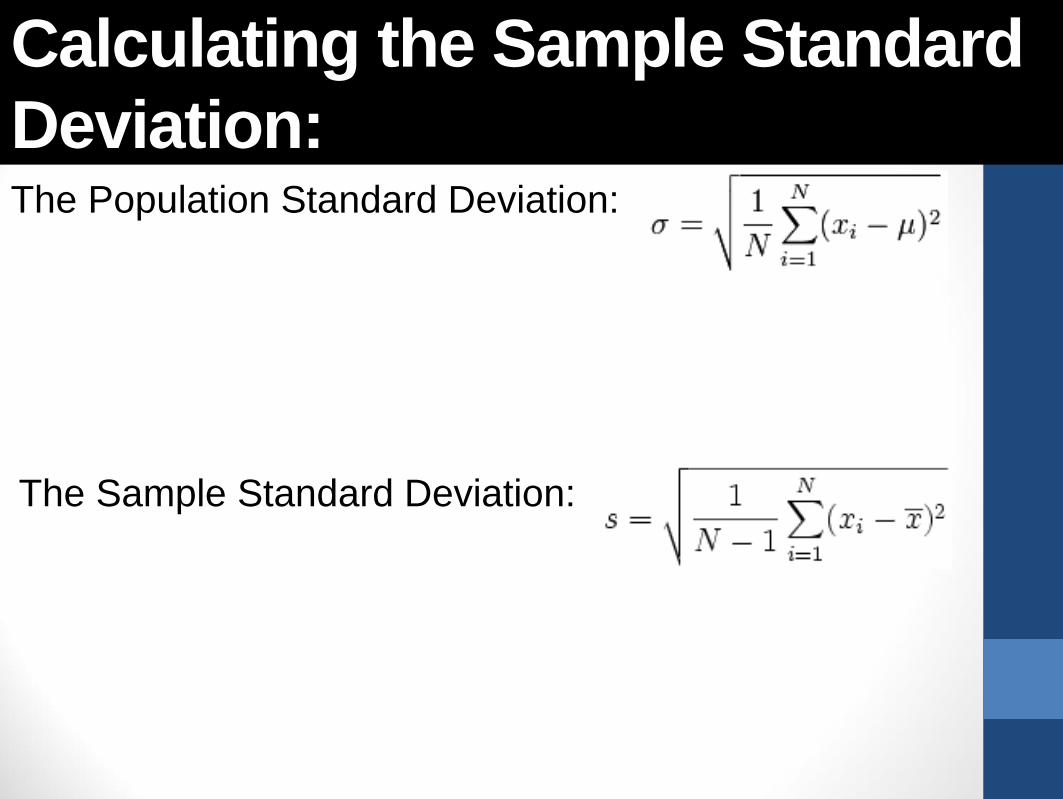
Planning – Why What When How
The Population Standard Deviation:
The Sample Standard Deviation:

Standard Scores The number of standard deviations from the mean is also called the "Standard Score", "sigma" or "z-score". Get used to those words!
Example: 95% of students at school are between 1.1m and 1.7m tall. Assuming this data is normally distributed can you calculate the mean and standard deviation? The mean is halfway between 1.1m and 1.7m: Mean = (1.1m + 1.7m) / 2 = 1.4m 95% is 2 standard deviations either side of the mean (a total of 4 standard deviations) so: And this is the result:

Standard Scores
Developing Questionnaire
Planning – Why What When How
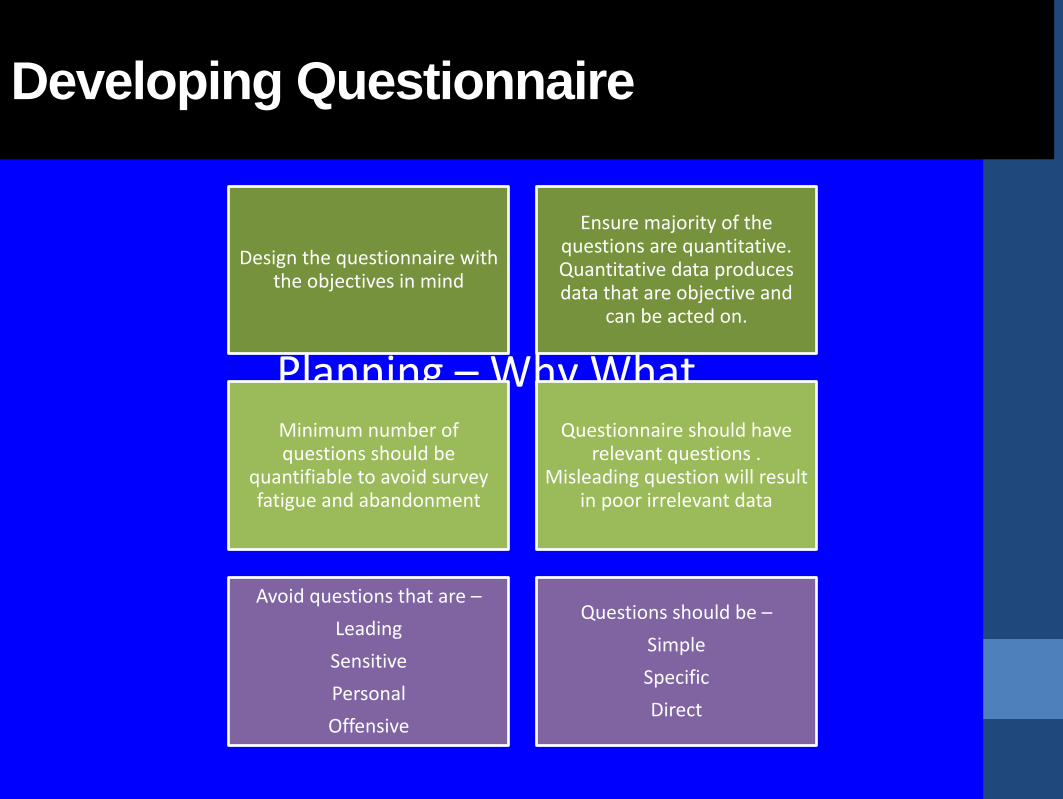
Design the questionnaire with the objectives in mind
Ensure majority of the questions are quantitative. Quantitative data produces data that are objective and
can be acted on.
Minimum number of questions should be
quantifiable to avoid survey fatigue and abandonment
Questionnaire should have relevant questions .
Misleading question will result in poor irrelevant data
Avoid questions that are – Leading
Sensitive Personal Offensive
Questions should be – Simple Specific Direct

Research – Data Collection
Planning – Why What When How
• It is not realistic to think that entire marketing population can be covered for a survey an adequate percentage and cross-section of target consumer is needed.
• If there are variations in the target population or statistically significant differences are to be noted between subgroups in the sample, the sample size should be adjusted for it.
Sample Size
• Choosing the right distribution method to collect your data is important. Different modes introduce different forms of bias so carefully consider your target audience and the best channel for reaching them. Eg - For instance, if your target audience is the elderly, social media or internet channels may not be the best distribution options. Direct mail, phone or personal interview may be the best option for reaching this audience.
• Consider other distribution methods such as QR code or web address on receipts, newsletters and printed brochures.
Distribution Method

Analysing the Data
Planning – Why What When How
Clean your survey data: Identify and weed out responses that have straight-line, Christmas
tree, red herring, and/or outlier patterns that can taint the results.
Analyze your data: Analyze the data to determine questions are answered in the format you expected. Unusual trends could indicate a problem with the question or question type. If so, you may need to discount the question or run another study related to the learning objective.
Segment your data: Segment your data by learning objective so that you can truly understand the most significant findings of your research
Report your results: Share your findings!

Make Strategic Business Decisions
Planning – Why What When How
Armed with your market research data, you can confidently make sound management decisions.
Make Decisions
Meet with your research stakeholders to discuss your pre-defined course of action. Implement your action plan and measure the results.
Share decisions

Value
Decreased uncertainty Increased likelihood of correct decision Improved marketing performance and resulting higher profits
Costs
Research expenditures Delay of marketing decision and possible disclosure of information to rivals Possible erroneous research results
Potential Value of a Marketing Research Effort Should Exceed Its Estimated Costs
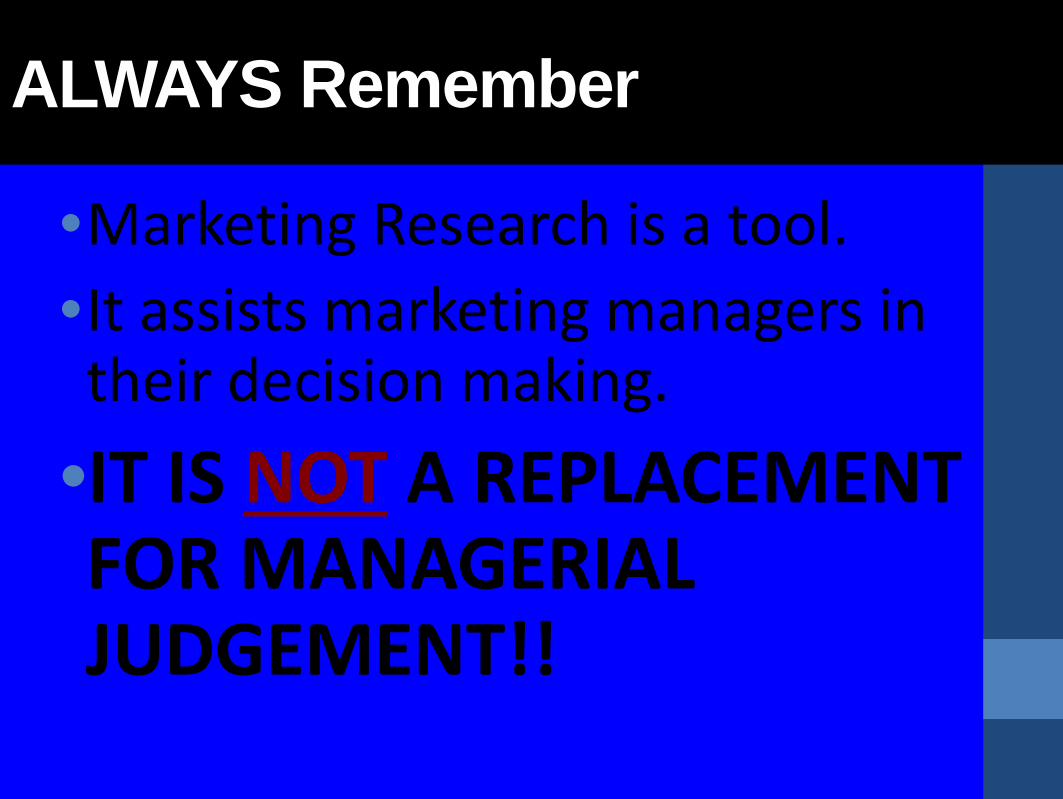
ALWAYS Remember
•Marketing Research is a tool. •It assists marketing managers in their decision making.
•IT IS NOT A REPLACEMENT FOR MANAGERIAL JUDGEMENT!!

Research Proposal a plan showing step by step description of how a proposed
research project will be undertaken. reflects the researcher’s understanding of the problem and
ability to conduct the research. If the research is to be conducted through a research
agency, the research proposal acts as an important selection criterion. Upon its acceptance, the research proposal becomes the
basis for the contract or agreement between the research agency and the client, and serves as a record of what was agreed on.
RESEARCH PROPOSAL I There is no fixed or standard format for a research proposal
as it is dependent on the nature of the specific research project. However, most research proposals contain the following
items. 1. Introduction 2. Statement of the Marketing Problem 3. Specification of the Research Objectives 4. Details of the Proposed Research Plan 5. Time schedule 7. Research team
Research Proposal


![[Research];[Digital marketing market]](https://img.pdfslide.us/doc/110x75/54539d82b1af9f84228b46ac/researchdigital-marketing-market.jpg)


