Embed Size (px)
Citation preview
MARKETING EARTH OBSERVATION PRODUCTS AND SERVICES
PART # 1
The work leading to these results has received funding from the European Union's Seventh Framework Programme (FP7/2007-2013) under grant agreement n° FP7-244172.
CONTRIBUTING TO DELIVERABLES:
D1.0.1 EXISTING CAPACITY IN EARTH OBSERVATIONS; EXISTING AND POTENTIAL MARKETS FOR EARTH OBSERVATION PRODUCTS AND CAPACITY BUILDING EFFORTS
D2.0.1 OPPORTUNITIES AND BOTTLENECKS IN EARTH OBSERVATION BROKERAGE AND CAPACITY BUILDING
D2.0.2 OPPORTUNITIES FOR EARTH OBSERVATIONS TO CONTRIBUTE TO CUSTOMER-CENTERED INNOVATION OF CLIENT ORGANIZATIONS
Signatures Author(s) : Mark Noort Reviewer(s) : Project Partners / Advisory Board Approver(s) : Issuing authority : ITC
Change record Release Date Pages Description of change Editor(s) / Reviewer(s) 1.0 11/10/2010 64 First version Mark Noort / Project Partners 1.2 18/01/2011 110 Edited version Project Meeting Mark Noort / Project Partners 1.3 22/02/2011 134 Edited version Advisory Board Mark Noort / Advisory Board 2.0 25/03/2011 134 Final version Mark Noort
List of acronyms AAFC agriculture and agri-food Canada ACMAD African centre of meteorological application for development ADB Asian development bank AEGOS African European georesources observation system AfDB African development bank AFIS advanced fire information system AG- agriculture SBA (GEO task) AGRI4CAST MARS crop yield forecasting AGRIMETH centre de recherches agroalimentaires AIP architecture implementation pilot AIT Asian institute of technology ALOS advanced land observing satellite AMESD African monitoring of environment for sustainable development AMMA African monsoon multidisciplinary analysis AR- architecture (GEO task) ARCSSTE-E African regional centre for space science and technology education in
English ARS agricultural research service ASAL agence spatiale algerienne ASAR advanced synthetic aperture radar ASTER advanced space borne thermal emission and reflection radiometer ATSR along track scanning radiometer AU African Union AVHRR advanced very high resolution radiometer AVIRIS airborne visible/infrared imaging spectrometer AWCI Asian water cycle initiative B brokerage BC before Christ BCC Beijing climate centre BGR bundesanstalt fur geowissenschaften und rohstoffe BI- biodiversity SBA (GEO task) BIODAM biodiversity and renewable resources management in the Amazon BO business object BSc Bachelor of Science CAP common agricultural policy CB capacity building CB- capacity building (GEO task) CBERS China-Brazil earth resources satellite CD compact disc CENATEL national centre of remote sensing and forest cover observation (Benin) CEOP coordinated energy and water cycle observations project CEOS committee on earth observation satellites CEPREDENAC centro para prevencion de desastres naturales en America Central CFSVA comprehensive food security and vulnerability analysis ChloroGIN chlorophyll global integrated network CL- climate SBA (GEO task) CliC climate and cryosphere project CLIVAR climate variability and predictability
CMA China meteorological administration CNES centre national d’etudes spatiales CONAE national space activities commission (Argentina) CoP community of practice CPR continuous plankton recorder CRASTE-LF centre regional Africain des sciences et technologie de l’espace en langue
francaise CRECTEALC regional centre for space science and technology education in Latin America
and the Caribbean CRF common reporting format CRTS centre royal de teledetection spatiale CSA Canadian space agency CSE centre suivi ecologique CSIR council for scientific and industrial research CSSTEAP centre for space science and technology education in Asia and the Pacific CUNI Charles university D deliverable DA- data management (GEO task) DANIDA Danish international development assistance DEM digital elevation model DevCoCast GEONETCast for and by developing countries DI- disaster SBA (GEO task) DLR deutsches zentrum for luft- und raumfahrt DMI Danish meteorological institute DMN national meteorological directorate (Morocco) EAMNET European African marine network EBONE European biodiversity observation network EC European Commission EC- ecosystems SBA (GEO task) EcoNet ecosystem observation and monitoring network ECV essential climate variable eGEP e-government economics project EMBRAPA Brazil’s agricultural research agency EMMSDAG establishing a mapping and monitoring system for development activities in
Ghana EN- energy SBA (GEO task) ENVISAT environmental satellite ENVISOLAR environmental information services for solar energy industries EO earth observations ERS European remote sensing satellite ESA European space agency ESRI environmental systems research institute ESSP earth system science partnership ETM enhanced thematic mapper EU European Union fAPAR fraction of absorbed photosynthetically active radiation FAO food and agriculture organization FAS foreign agricultural service FEMA federal emergency management agency FESA food early solutions for Africa FEWS famine early warning system
FLOREO flood risk earth observation monitoring FP7 seventh framework program FRA forest resources assessment GBIF global biodiversity information facility GCOS global climate observation system GDACS global disaster alert and communication system GDEM global digital elevation model GEO group on earth observations GEOBON GEO biodiversity observation network GEONetCab GEO Network for capacity building GEONETCast global network of satellite based data dissemination systems GEOSS global earth observations system of systems GEWEX global energy and water cycle experiment GGOS global geodetic observing system GIC geomagnetically induced current GIDEON basic provision for geo-information in the Netherlands GIEWS global information and early warning system GIFS global interactive forecast system GIS geographic information system GISIN global invasive species information network GLAM global agricultural monitoring community of practice GLOBCOVER global land cover product GMES global monitoring for environment and security GMFS global monitoring of food security GML geography (or general) markup language GMS geosynchronous meteorological satellite GNC GEONetCab (in UML model) GOCE gravity field and steady-state ocean circulation explorer GODAE global ocean data assimilation experiment GOES geostationary operational environmental satellite GOFC-GOLD global observation for forest and land cover dynamics GOOS global ocean observation system GOSAT greenhouse gases observing satellite GPG good practice guidance GPL general public licence GPS global positioning system GRACE gravity recovery and climate experiment GRASS geographic resources analysis support system GRDC global run-off data centre GRIP global risk identification program GSE GMES service element HARIMAU hydrometeorological array for ISV-monsoon automonitoring HE- health SBA (GEO task) IADB inter-American development bank IDB Islamic development bank IFFI Italian landslide inventory project IGBP international geosphere-biosphere program IGOS-P integrated global observation strategy partnership IGWCO integrated global water cycle observations ILWIS integrated land and water information system INCOIS Indian national centre for ocean information systems
INPE Brazil’s national institute for space research InSAR interferometric synthetic aperture radar IOC intergovernmental oceanographic commission IOCD Indian ocean data coverage IPC integrated food security phase classification IPCC international panel on climate change IRD institute de recherche pour le developpement IRS Indian remote sensing satellite ISESCO Islamic educational, scientific and cultural organisation ISO international standards organization ISRO Indian space research organization ISU international space university ISV intra-seasonal variability ITC faculty of geo-information science and earth observation, university of Twente JAXA Japan aerospace exploration agency JEP joint education programme JERS Japanese earth resources satellite LAI leaf area index LCCS land cover classification system LIDAR light detection and ranging LME large marine ecosystem LULUCF land use, land use change and forestry MARS monitoring agriculture with remote sensing MDG millennium development goal Mdweb tool for cataloguing and locating information MERIS medium resolution imaging spectrometer MERIT meningitis environmental risk information technologies MESoR management and exploitation of solar resource knowledge MEWS malaria early warning system MiniCAM mini-climate change assessment model MODIS moderate resolution imaging spectrometer MoE ministry of education / ministry of environment MSc Master of Science MSG meteosat second generation NAIS national agriculture information system NAP/CCD national action programme for combating desertification NASA national aeronautics and space administration NCAS national carbon accounting system NDVI normalized difference vegetation index NEPAD new partnership for Africa’s development NGO non-governmental organization NIDIS national integrated drought information service NMS national meteorological service NOAA national oceanic and atmospheric administration OARS ocean acoustic remote sensing OBIS ocean biographic information system OCO orbiting carbon observatory ODINAfrica ocean data and information network for Africa ODIS ocean data information system OGC open geospatial consortium
OSS Sahara and Sahel observatories PAGE pilot analysis of global ecosystems PECS plan for European cooperating states PhD Doctor of Philosophy PFZ potential fishing zones PI-GOOS Pacific Islands global ocean observation system PIAP Polish industrial research institute for automation and management PIPEMON pipeline monitoring POGO partnership for observation of the global oceans PPP powerpoint presentation PROMOTE protocol monitoring for the GMES service element R&D research and development RCMRD regional centre for mapping of resources for development RECTAS regional centre for training in aerospace surveys REDD reduced deforestation and forest degradation RMF radio muzyka fakty (Poland) ROSELT reseau d’observatoires de surveillance ecologique a long terme SAC space application centre SADC Southern African development community SAFARI societal applications in fisheries and aquaculture using remote sensing SAFER seismic early warning for Europe SAFNet Southern African fire network SAHFOS sir Alistair Hardy foundation for ocean science SAR synthetic aperture radar SBA societal benefit area SBC spot building count SDI spatial data infrastructure SDS-WAS sand and dust storm warning advisory system SEAS survey of Amazonian environment assisted by satellites SeaWIFS sea-viewing wide field of view sensor SEIS shared environmental information system SEOCA GEO capacity building initiative in Central Asia SERTIT service regional de traitement d’image et de teledetection SERVIR regional visualization and monitoring system SMOS soil moisture and ocean salinity SPARC stratospheric processes and their role in the climate SPOT satellite pour l’observation de la terre SRC space research centre SSE surface meteorology and solar energy ST- science and technology (GEO task) START global change system for analysis, research and training STDM social tenure domain model SWERA solar and wind renewable energy SWEX soil, water and energy exchange SWIR short wave infrared SWOT strengths, weaknesses, opportunities, threats THORPEX the observing research and predictability experiment TIGER technology informatics guiding education reform TIGGE THORPEX interactive grand global ensemble TIROS television infrared observation satellite TM thematic mapper
UML unified modelling language UN United Nations UNDP United Nations development program UNECA United Nations economic commission for Africa UNEP United Nations environmental program UNESCO United Nations educational, scientific and cultural organization UN-HABITAT United Nations human settlements program UN-OOSA United Nations office for outer space affairs US United States US- user engagement (GEO task) USAID US agency for international development USA United States of America USDA US department of agriculture USGS US geological survey UV ultraviolet WA- water SBA (GEO task) WACMOS water cycle multi-mission observation strategy WCMC world conservation monitoring centre WCRP world climate research program WE- weather SBA (GEO task) WFP world food program WHO world health organization WISE water information system Europe WMO world meteorological organization WP work package WRI world resources institute WWRP world weather research program

i
SUMMARY The objective of this study is to identify bottlenecks that limit the use of earth observations and formulate strategies to remove these bottlenecks. The business process of (end-)user organizations plays a central role in the analysis. End-users are defined as potentially exposed to the benefits of earth observations, but are not inside the earth observations community yet. Decision makers form an important part of the end-user group. To analyze the business process of organizations a general model has been developed based on the UML modelling technique. The model describes the relationship between different entities (‘business objects’) in very general terms, such as ‘client’, ‘provider’ and ‘product/service’. This provides a reference framework for the quick identification of bottlenecks. To provide additional structure, the bottlenecks are placed in sequence according to the expert system development life cycle (initialization, system analysis and design, rapid prototyping, system development, implementation and post-implementation). Marketing for earth observations, as for any other expert system, needs to be synchronized with the phases in the life cycle of a particular product or service. Several factors determine marketing opportunities. Earth observations are now at the verge of reaching a whole new group of end-users. Applications have matured and are ready for the market. Another very important aspect is how to involve this new group of end-users. This does not only entail their technical capacity to deal with earth observation applications, but also a sense of ownership making it possible to empower new groups of end-users. For an application of earth observations to be successful for and with new groups of users it is important to look critically at the ‘weakest link’ aspect. This is done by analyzing the whole chain from provider to end-user. The instruments to do this are capacity building and brokerage. Capacity building is defined here simply as ‘learning and being capable of adding something new and relevant to a previously defined purpose’ and brokerage is defined as ‘linking providers and (potential) users of a product or service’. In this light marketing is just capacity building and brokerage put together. It also implies that the process works both ways: marketing does not only entail ‘selling’ a certain product or service to clients, but also involves interaction with the earth observations community to find better ways to serve the client community. A preliminary analysis of the available data shows some trends in capacity-building needs for earth observations. The base flow consists of a regular need for professionals in geo-information, both in the technical substrata and in the applied disciplines. Another trend is that there is a need for short courses at all levels to familiarize professionals of all types with earth observations and their applications. This ranges from short courses for engineers or geographers with different backgrounds, to refresher courses for geo-information specialists (to keep up with developments), and seminars and workshops for decision makers. The potential demand for this type of capacity building is huge, as the benefits of earth observation applications become more and more apparent.
ii
There are quite a number of capacity building initiatives and programs under implementation worldwide. Different regions experience different problems and challenges. Europe, North America and Australia struggle to get enough students interested in technical subjects, such as space science and earth observations, while for example in large parts of Asia there is a huge interest in these subjects. In many parts of the world funding is available and the choice to invest in earth observation capacity building is one of allocation, while in most parts of Africa there is a general shortage of resources. The analysis of bottlenecks and the need for capacity building yields the following action points for the GEONetCab project:
1. Complete the inventory of open-source software and make an action plan for increased use for various purposes with partners in developing countries.
2. Approach major providers of geo-information software to discuss increased support for capacity building initiatives with the aim to develop the market.
3. Further investigate the use of Google Earth type applications. 4. Complete the inventory of successful modes of delivery for capacity building minimizing the
constraints of limited internet access. 5. Further investigate the future possibilities of GEONETCast and related systems for capacity
building and reaching new target groups. 6. Provide general marketing for earth observation applications, directed at the end-user
target group, including decision-makers, especially paying attention to capacity building opportunities.
7. Alert the earth observations community to funding opportunities. 8. Identify and collect success stories (in terms of income generation, sustainability, potential
for replication, spin-offs from research, etc.). 9. Provide feedback to the GEO community to ensure good synthesis in system development
(involving end-users). 10. Develop promotion material targeted at the donor community. 11. Promote certification of short courses and compatibility between the systems used by major
capacity building providers. 12. Organize a workshop on performance indicators for capacity building in earth observations. 13. Provide the GEONetCab website (and the GEO Portal) with information on capacity building,
open-source software, success stories, funding opportunities and certification of courses.
Products and services pertaining to each GEO Societal Benefit Area (SBA) are divided into categories. Each SBA is discussed, taking the following four dimensions into account:
1. A distinction between earth observation product and service categories as part of the business process of organizations,
2. The determination of the life cycle phases and the prospects of development towards maturity of these products and services (the vertical process),
3. The regional spread of applications, and (to a lesser extent) research and development (the horizontal process),
4. The optimal mix of marketing (capacity building and brokerage) efforts to support speeding up the vertical (towards application) and horizontal (towards replication) process for each product and service category.
iii
The analysis of opportunities and bottlenecks for the GEO Societal Benefit Areas yields the following action points for the project:
Disasters
1. Include capacity building material on disaster risk assessment, early warning, monitoring, damage assessment, prevention & planning, and community mapping in the GEONetCab capacity building web.
2. Gather success stories about disaster risk assessment, early warning, and planning & prevention as promotion material for decision makers.
3. Elaborate on specific case studies on successful application of wild fire early warning systems and disaster prevention & planning.
4. Liaise with disaster coordination initiatives, such as Provention and the GEO Geohazards Community of Practice to optimize promotion.
5. Liaise with insurance providers about funding opportunities and sponsoring of capacity building activities in developing countries.
Health 1. Include capacity building material on air quality forecasting, epidemics forecasting and the
relationship between diseases and environmental factors on the GEONetCab capacity building web.
2. Gather (potential) success stories on local applications in developing countries and investigate the possible role of GEONETCast.
3. Liaise with the GEO Health Community of Practice with the aim to acquire funding for further development of health applications.
Energy
1. Include capacity building material on resource assessment for renewable energy and energy resource exploration support on the GEONetCab capacity building web.
2. Gather success stories on resource assessment for renewable energy and energy resources exploration support in cooperation with the GEO Energy Community of Practice that may be replicated in new markets.
3. Promote resource assessment for renewable energy and energy resources exploration support with decision makers and international organizations with a mandate in this field.
Climate
1. Include capacity building material on climate monitoring and modelling, carbon accounting schemes and the prediction and mitigation of the effects of climate change on the GEONetCab capacity building web.
2. Identify outcomes of climate monitoring and modelling that yield results sufficiently robust for scenarios covering prediction and mitigation, or carbon accounting schemes in cooperation with the GEO Carbon Community of Practice.
3. Use successful applications, for example practical studies into the prediction and mitigation of effects of climate change, to promote the use of earth observations amongst policy- and decision-makers in new markets.
iv
Water
1. Include capacity building material on ocean topography, temperature & currents, ocean colour, drought monitoring & early warning, and hydraulic information systems on the GEONetCab capacity building web.
2. Investigate whether current initiatives cover the introduction of earth observations for ocean topography, temperature, currents & ocean colour, and drought monitoring & early warning in developing countries and emerging economies sufficiently.
3. If not, use success stories to market ocean and drought products and services to potential clients.
4. Gather success stories on hydraulic information system applications for marketing in developing countries and emerging economies.
5. Use hydraulic information system success stories for promotion in cooperation with the GEO (IWGCO) Water Community of Practice.
Weather 1. Include capacity building material on global & local weather forecasting and precipitation
monitoring & forecasting on the GEONetCab capacity building web. 2. Gather success stories on applications of GEONETCast for weather forecasting and
precipitation monitoring & forecasting for marketing in developing countries and emerging economies.
Ecosystems
1. Include capacity building material on marine & coastal ecosystems, terrestrial ecosystems and local applications for ecosystems, including protected areas, on the GEONetCab capacity building web.
2. Gather success stories on local applications for ecosystems for marketing in developing countries and emerging economies.
3. Promote local applications for ecosystems to decision makers, environmental organizations and protected area management.
Agriculture
1. Include capacity building material on satellite based fishing, precision agriculture, monitoring & modelling of crop conditions, and forest monitoring on the GEONetCab capacity building web.
2. Investigate whether current initiatives cover the introduction of earth observations for satellite based fishing in developing countries and emerging economies sufficiently.
3. If not, use success stories to market satellite based fishing products and services to potential clients.
4. Gather success stories on monitoring and modelling of crop conditions, with special emphasis on food security (in cooperation with the GEO (GLAM) Agriculture Community of Practice), and on forest monitoring in developing countries and emerging economies.
v
5. Promote applications for the monitoring and modelling of crop conditions and forests with national and local authorities and international organizations using (agricultural) production and food security as mandate.
Biodiversity
1. Include capacity building material on biodiversity monitoring and modelling, invasive species monitoring and ecological forecasting on the GEONetCab capacity building web.
2. Liaise with the GEOBON initiative to identify success stories for local application and promotion.
General
1. Include relevant capacity building material on digital elevation models, sensor webs, property risk management, surveying & mapping, location based services, humanitarian issues, homeland security, satellite communication, land administration, and spatial data infrastructure on the GEONetCab capacity building web.
2. Identify the added value of topics mentioned above for inclusion in the success stories used for promotion of the different product and service categories of the GEO SBAs.

vi
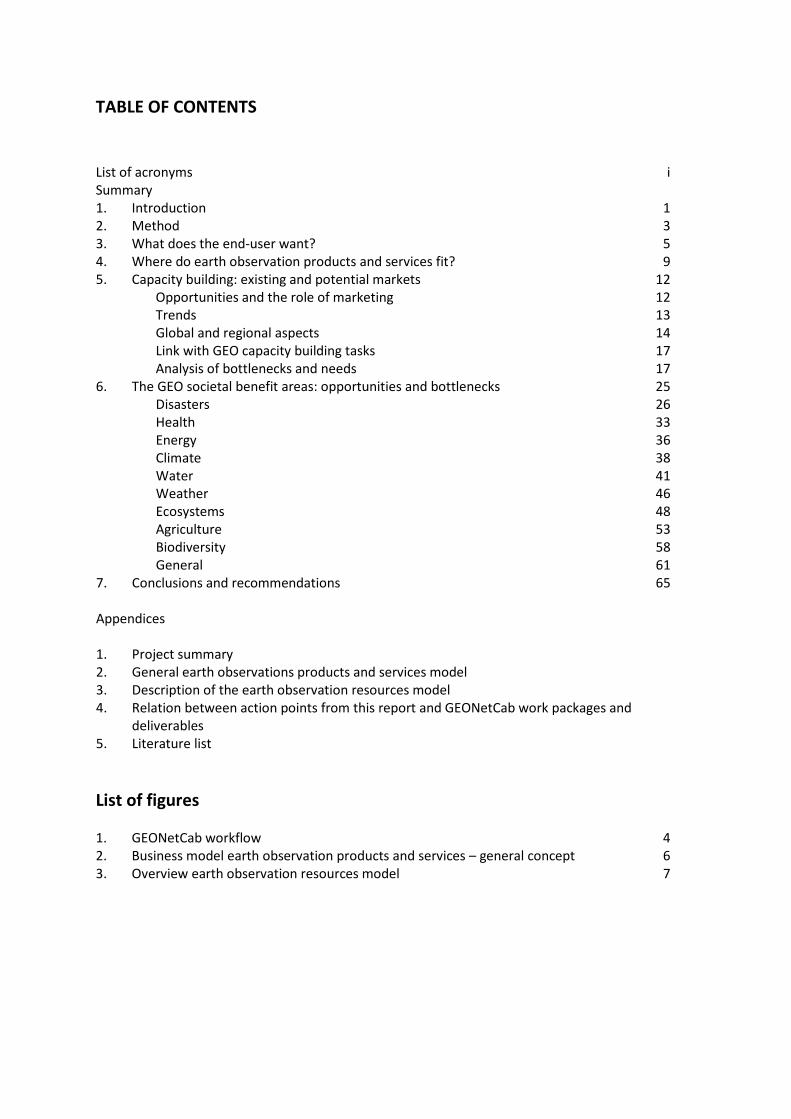
TABLE OF CONTENTS List of acronyms i Summary 1. Introduction 1 2. Method 3 3. What does the end-user want? 5 4. Where do earth observation products and services fit? 9 5. Capacity building: existing and potential markets 12
Opportunities and the role of marketing 12 Trends 13 Global and regional aspects 14 Link with GEO capacity building tasks 17 Analysis of bottlenecks and needs 17
6. The GEO societal benefit areas: opportunities and bottlenecks 25 Disasters 26
Health 33 Energy 36 Climate 38 Water 41 Weather 46 Ecosystems 48 Agriculture 53 Biodiversity 58 General 61
7. Conclusions and recommendations 65
Appendices 1. Project summary 2. General earth observations products and services model 3. Description of the earth observation resources model 4. Relation between action points from this report and GEONetCab work packages and
deliverables 5. Literature list
List of figures 1. GEONetCab workflow 4 2. Business model earth observation products and services – general concept 6 3. Overview earth observation resources model 7
List of text boxes Capacity building by CRASTE-LF Earth observation education in the Czech Republic SPOT5 multi-user government licence, South Africa ITC’s joint education programme GIDEON – geo-information facility for the Netherlands Advanced Fire Information System (AFIS), Southern African Development Community (SADC) Flood risk earth observation monitoring (FLOREO), Czech Republic Flood monitoring, Poland Tele-epidemiology: monitor, predict and prevent epidemics Carbon balances, Poland Wetlands validation of SMOS, Poland GEONETCast: low-cost access to EO products, services and satellite data - practical opportunities for capacity building Baltic Sea ecosystem monitoring Long-term ecological monitoring observatories network ROSELT/OSS Centre Suivi Ecologique, Senegal Detailed crop monitoring, Poland Forestry monitoring for reporting on greenhouse gases and sustainable management, Poland Survey of Amazonian environment assisted by satellites Monitoring of the bark beetle calamity in Sumava national park, Czech Republic Suburbanization and urban sprawl in the Czech Republic Archaeological survey of El-Hayez, Egypt
1
1. INTRODUCTION The GEONetCab project is an FP7 project funded by the European Commission. The main objective of the project is ‘to create the conditions for improvement and increase of the GEO capacity building activities and framework, with special emphasis on developing countries, new EU member states (and EU neighbouring states), and climate monitoring, and will serve the bigger goal of improved effectiveness and efficiency of GEO capacity building for application in the GEO societal benefit areas. Coinciding with this purpose, successful brokerage with (potential) clients for earth observation products and services will be facilitated.’ The project runs from November 2009 to October 2012. A summary of the project can be found in Appendix 1. The project consists of the following work packages: WP 1 inventory of the current situation, WP 2 opportunities and bottlenecks, WP 3 connecting and building, WP 4 awareness and dissemination, WP 5 evaluation and follow-up for continuous brokerage functions, and WP 6 management. This report contributes to the following deliverables within work package 1 and 2: D1.0.1 existing capacity in earth observations; existing and potential markets for earth observation
products and capacity building efforts, D2.0.1 opportunities and bottlenecks in earth observation brokerage and capacity building, and D2.0.2 opportunities for earth observations to contribute to customer-centred innovation of client
organizations. These deliverables are joined, because of their internal cohesion and because unforeseen circumstances just after the start of the project caused some delays. However, this did create the opportunity to outline the overall marketing vision and approach of the project. D1.0.1 will be completed with the establishment of the capacity building database, which will also form the foundation of the capacity building web (work package 3.5.2). Further reporting on the analysis of this database will be part of D2.0.3 ‘Strategic document on the establishment of a platform of modules in capacity building for earth observations, including an estimate of what can be achieved in the time frame of this project’. A more detailed analysis of capacity building ability, bottlenecks and opportunities, based on this report, will complete deliverables D1.0.1 and D2.0.1. Regional aspects of capacity aspects will be dealt with in the synthesis report on regional diagnostics regarding capacity (building) in EO with analysis on gaps and priority issues (D1.1.1). The four regional studies will also describe opportunities for marketing, completing deliverable D2.0.2. Feedback from (potential) clients forms the basis of deliverable D2.0.4 ‘synthesis report, summarizing the findings of the interaction with (potential) clients and providing the general outline for a marketing strategy for earth observation products and services’. This deliverable will be
2
integrated in ‘earth observation products and services marketing part #2’. Reporting on this subject later in the time frame of the project is done in work package 5. As indicated throughout this document the GEONetCab project is compatible with the broader framework of GEO (group on earth observations) and GEOSS (global earth observations system of systems) and aims to contribute to the general purposes of these initiatives. The problem the GEONetCab project aims to solve is formulated as follows: More and more earth observation products and services are on offer for applications providing societal benefit and/or economic gain, but the general perception is that these products and services are not used (enough). The question then arises: why, if earth observations do provide added value, are they not used more in practice and integrated in general operations of public and private organizations? For this seeming contradiction three possible explanations exist:
1. Earth observations do not provide sufficient societal benefit and/or economic gain; 2. Earth observation products and services are used, but are generally not well known; 3. There are a number of bottlenecks impeding the use of earth observations (and
consequently the (end-)user misses out on the benefits). The next section presents a method for dealing with this problem and describes the different sections of this report.
3
2. METHOD With respect to the problem stated in the previous section (earth observation products and services are not used (enough)) this study assumes that the third explanation is the correct one, without completely ruling out the first and second one (in some cases). The objective of the study is therefore to identify the bottlenecks that limit the use of earth observations and formulate strategies to remove these bottlenecks. The study is not of a scientific nature, in the sense that the ultimate aim is not to create scientific publications, but rather is practical and heuristic: the ultimate aim is to solve this problem. The approach is more a journey of discovery, than a complete inventory of stock, although information will certainly be processed in great quantities to sustain the findings and arrive at sound conclusions. The focus is to build on existing information: to make new connections by rearranging and ‘ranking’ information in ways that lead to action. In time, and certainly during the course of the GEONetCab project, the results of this first study will be refined and improved upon, and its initially formulated hypotheses adjusted or maybe even discarded (hence also the part 1 in the title of this document). The business process of (end-)user organizations plays a central role in the analysis. If earth observation applications cannot provide added value to these processes, then all marketing efforts are useless. The model to structure data concerning business processes and earth observations is presented in section 3. Section 4 deals with the expert system development cycle: it describes the different stages of development of earth observation products and services. Capacity building efforts and brokerage activities differ with each life cycle phase. The project will act as a node in the GEO Portal network for capacity building and earth observation resources: the capacity building web. Section 5 provides an overview. Section 6 deals with the earth observation products and services categories. Within the framework of the GEO Societal Benefit Areas the different categories are discussed and marketing of applications is assessed, where possible accounting for regional differences. During the course of the project success stories about earth observations will be compiled, presented and used for promotion. In text boxes throughout this document the project partners already indicate some promising initiatives from their own experience they found particularly interesting. The project will also focus on quick-win projects, where, with little additional input, useful and replicable applications of earth observations are demonstrated. All this will be input for the project dissemination strategy and activities, which in turn is part of the brokerage initiative carried out by the project. Continuous feedback and development of this initiative is important and included in the workflow of the project (see figure 1 (next page)). The project does not carry out in-depth scientific studies or global market studies. It aims to build on existing material and complement ongoing marketing initiatives. This document is based on a literature study, and inputs and experiences of the project partners and members of the earth observations community. Most studies on the market for earth observation applications carried out
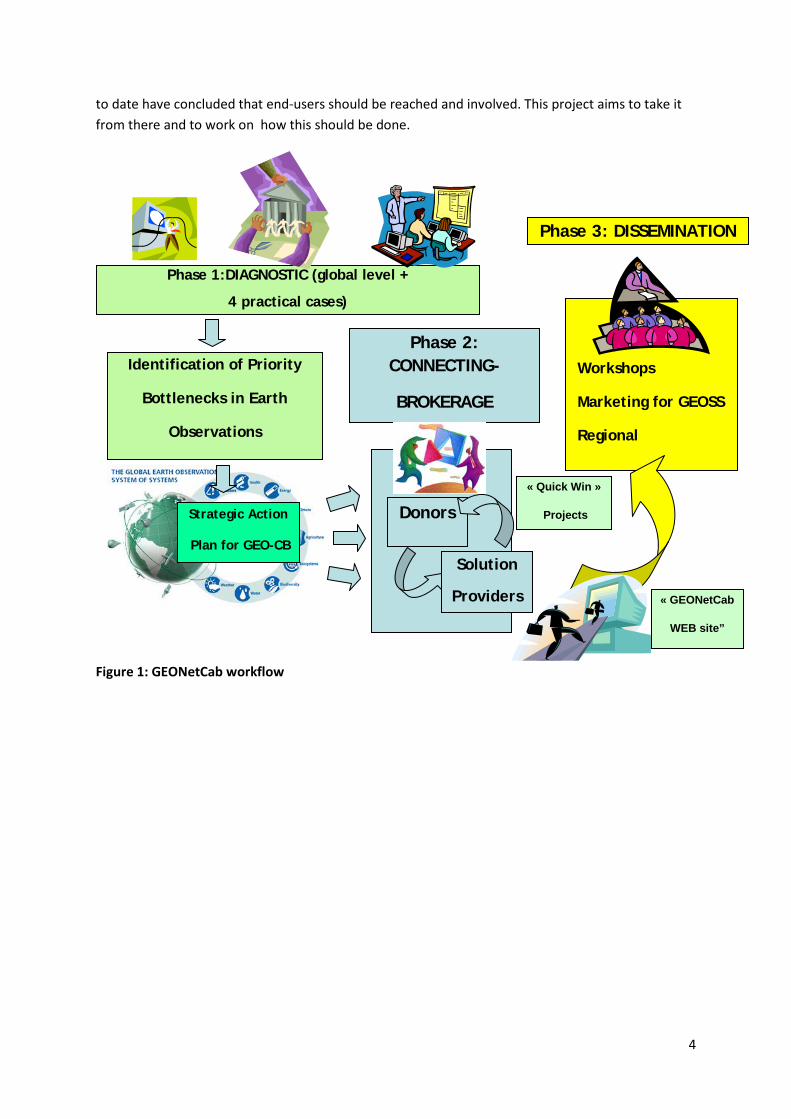
4
to date have concluded that end-users should be reached and involved. This project aims to take it from there and to work on how this should be done.
Figure 1: GEONetCab workflow
Phase 1:DIAGNOSTIC (global level +
4 practical cases)
Identification of Priority
Bottlenecks in Earth
Observations
Phase 2: CONNECTING-
BROKERAGE
Donors
Solution
Providers
« Quick Win »
Projects
Strategic Action
Plan for GEO-CB
Phase 3: DISSEMINATION
Workshops
Marketing for GEOSS
Regional
« GEONetCab
WEB site”
5
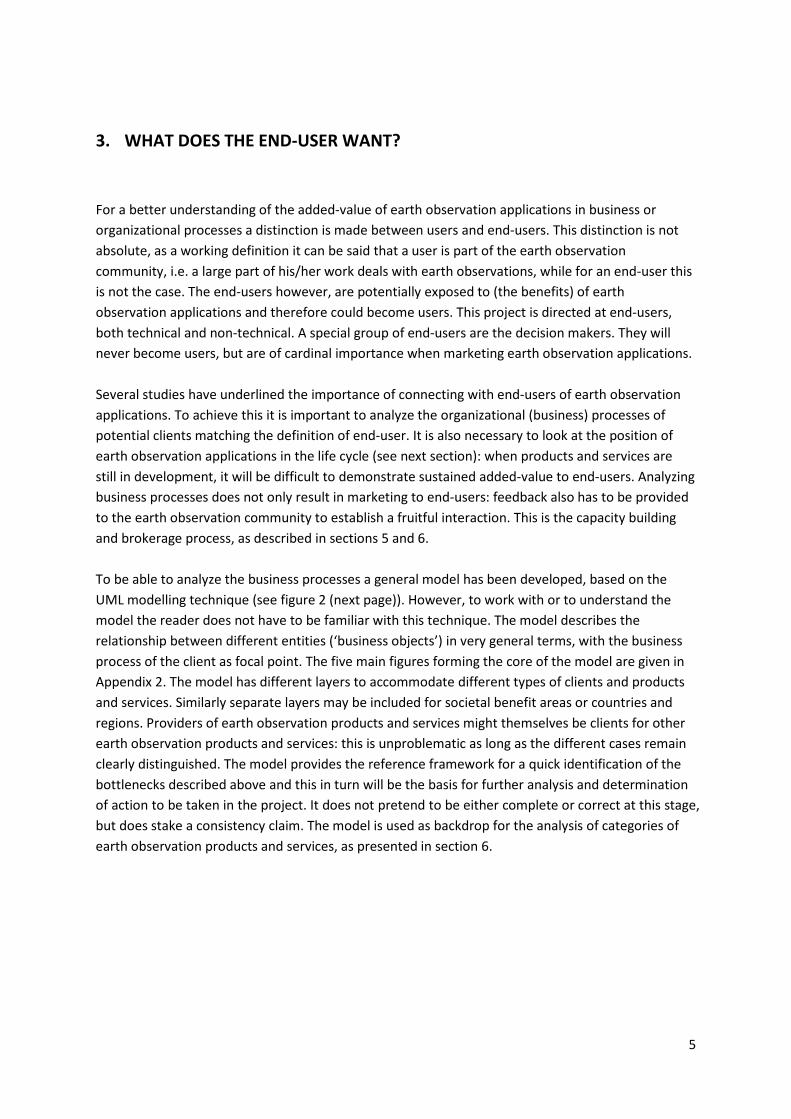
3. WHAT DOES THE END-USER WANT? For a better understanding of the added-value of earth observation applications in business or organizational processes a distinction is made between users and end-users. This distinction is not absolute, as a working definition it can be said that a user is part of the earth observation community, i.e. a large part of his/her work deals with earth observations, while for an end-user this is not the case. The end-users however, are potentially exposed to (the benefits) of earth observation applications and therefore could become users. This project is directed at end-users, both technical and non-technical. A special group of end-users are the decision makers. They will never become users, but are of cardinal importance when marketing earth observation applications. Several studies have underlined the importance of connecting with end-users of earth observation applications. To achieve this it is important to analyze the organizational (business) processes of potential clients matching the definition of end-user. It is also necessary to look at the position of earth observation applications in the life cycle (see next section): when products and services are still in development, it will be difficult to demonstrate sustained added-value to end-users. Analyzing business processes does not only result in marketing to end-users: feedback also has to be provided to the earth observation community to establish a fruitful interaction. This is the capacity building and brokerage process, as described in sections 5 and 6. To be able to analyze the business processes a general model has been developed, based on the UML modelling technique (see figure 2 (next page)). However, to work with or to understand the model the reader does not have to be familiar with this technique. The model describes the relationship between different entities (‘business objects’) in very general terms, with the business process of the client as focal point. The five main figures forming the core of the model are given in Appendix 2. The model has different layers to accommodate different types of clients and products and services. Similarly separate layers may be included for societal benefit areas or countries and regions. Providers of earth observation products and services might themselves be clients for other earth observation products and services: this is unproblematic as long as the different cases remain clearly distinguished. The model provides the reference framework for a quick identification of the bottlenecks described above and this in turn will be the basis for further analysis and determination of action to be taken in the project. It does not pretend to be either complete or correct at this stage, but does stake a consistency claim. The model is used as backdrop for the analysis of categories of earth observation products and services, as presented in section 6.
6
Figure 2: Business model earth observation products and services - general concept BO 01 requires CLIENT feedback implements feedback BO 05 BO 04 BO 06 INPUT supplies produces OUTPUT
PRODUCT /
SERVICE BUSINESS PROCESS PRODUCT / SERVICE
transforms feedback
BO 02 improves creates new
EO PRODUCT /
SERVICE feedback feedback
delivers feedback
EARTH OBSERVATION RESOURCES
BO 03 sells PROVIDER
7
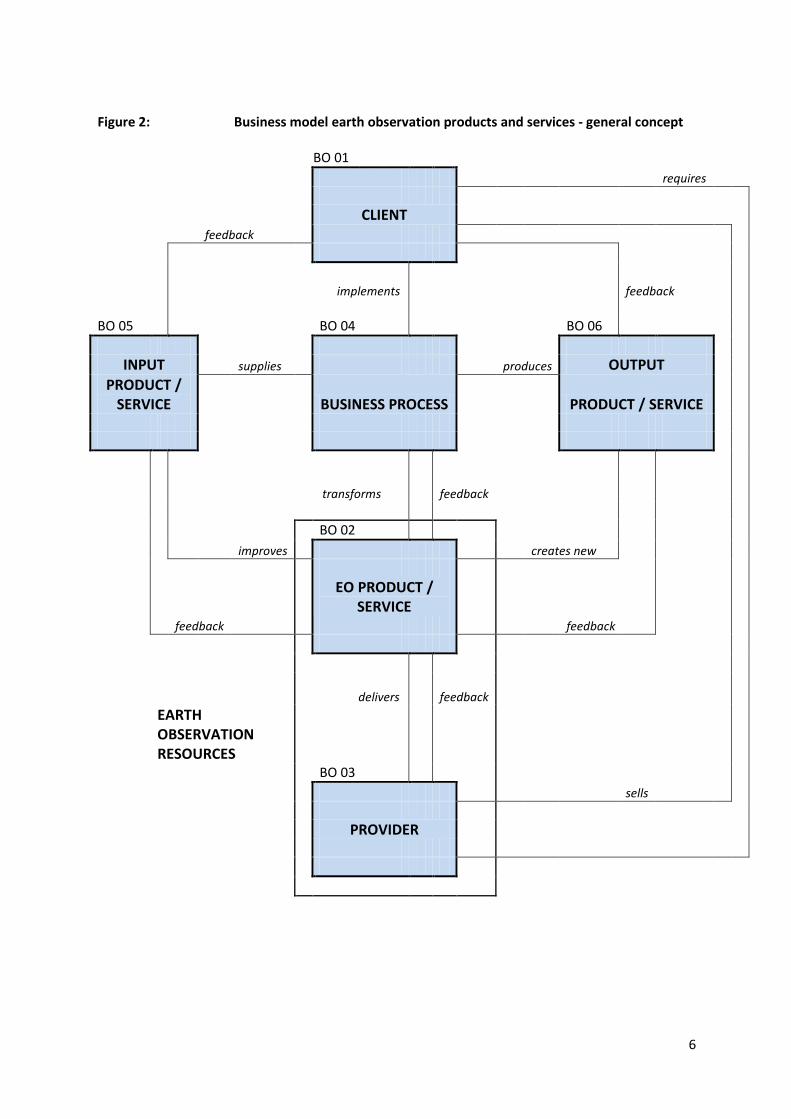
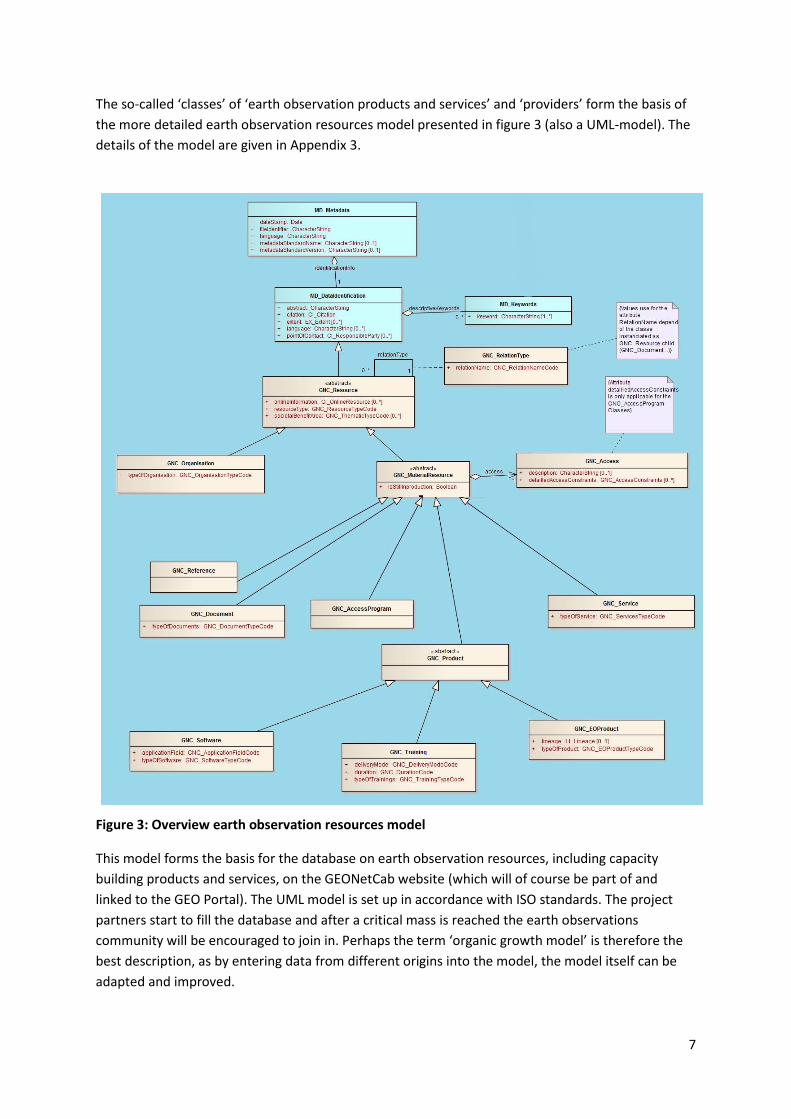
The so-called ‘classes’ of ‘earth observation products and services’ and ‘providers’ form the basis of the more detailed earth observation resources model presented in figure 3 (also a UML-model). The details of the model are given in Appendix 3.
Figure 3: Overview earth observation resources model
This model forms the basis for the database on earth observation resources, including capacity building products and services, on the GEONetCab website (which will of course be part of and linked to the GEO Portal). The UML model is set up in accordance with ISO standards. The project partners start to fill the database and after a critical mass is reached the earth observations community will be encouraged to join in. Perhaps the term ‘organic growth model’ is therefore the best description, as by entering data from different origins into the model, the model itself can be adapted and improved.
8
The success stories, both the ones presented in this report and the ones to be used for promotion of earth observation applications, will be connected and presented in the form of the earth observation resources model. The aim is to gain structural insight into the importance of the different phases of the life cycle (section 4), the effects of and on capacity building (section 5) and the impact on the different products and services categories (section 6). This in turn gives better insight in answers to the question ‘what does the end-user want’ and enables better targeting of client groups and improvement of the marketing of earth observations (work packages 3 and 4 of the GEONetCab project).
9
4. WHERE DO EARTH OBSERVATION PRODUCTS AND SERVICES FIT?
An identification of bottlenecks and needs with respect to the use of earth observations is compiled and summarized. The list of bottlenecks and needs is derived from different GEO and other documents (see literature list). Those specifically related to, or with special consequences for, capacity building have CB added in brackets, and those where the GEONetCab project or other GEO promotion activities may play a particular role have B (for Brokerage) added in brackets. To provide structure, the bottlenecks and needs are placed in the order of first occurrence in a phase of the expert system development life cycle. The different phases of the life cycle of the expert system are:
1. Initialization (problem definition, needs assessment, evaluation of alternative solutions,
verification of an expert system approach, consideration of managerial issues); 2. System analysis and design (conceptual design and plan, development strategy, sources of
knowledge, computing resources, feasibility study, cost benefit analysis); 3. Rapid prototyping (building a small prototype, testing, improving, expanding, demonstrating
and analyzing feasibility, completing design); 4. System development (building knowledge base, testing, evaluating and improving
knowledge base, planning for integration); 5. Implementation (acceptance by users, installation, demonstration, deployment, orientation,
training, security, documentation, integration and field testing); 6. Post-implementation (operation, maintenance and upgrades, periodic evaluation).
The combination yields the following results:
INITIALIZATION
1. High cost of software licenses (use and development of open software needed). (CB) 2. Easy and fast internet access is lacking (sufficient bandwidth needed). (CB) 3. Insufficient capacity building resources to provide a sustainable human resource base. (CB) 4. Lack of infrastructure to access, use and develop EO data and products (infrastructure for data
access, analysis and distribution needed). (CB) 5. Heavy financial constraints in general (boundary conditions). (CB) 6. The information cannot be found, cannot be accessed or is otherwise not available. 7. Need for identification of national providers and users of EO information as basis for an
organizational strategy that connects to general policies and decision making processes (look for customer value). (B)
SYSTEM ANALYSIS AND DESIGN
1. Insufficient collaborative research for and in developing countries. (CB) 2. Low rate of introduction and incorporation of EO courses in the regular curricula of higher
learning institutions (universities). (CB)
10
3. The information is accessible, but not usable or reliable for forecasting or scenario development in different subjects.
4. The information should be processed in a way that is fit to support the decision-making process. (B)
5. Inertia and other constraints need to be overcome to develop new business models enabling public and private customers to adopt EO solutions. (B)
RAPID PROTOTYPING
1. Lack of expertise, infrastructure and mechanisms to validate earth observations with in-situ observations.
2. Lack of consistency in approaches and methods for data collection, as well as type and quality of data collected (need for a reference system).
3. The information is usable, but not shareable: lack of standardization of data, related difficulties in data sharing, lack of policy regulating access and sharing of geo-information data at different levels.
4. Identification and selection of appropriate models and product generation. 5. Need for more focus on capacity building and research to develop prototypes of EO operational
models and products. (CB)
SYSTEM DEVELOPMENT
1. Insufficient linkage between stakeholders and user communities to determine the research agenda and CB requirements (based on common interest), resulting in uncoordinated initiatives without common vision, common purpose or communal action. (CB) (B)
2. Inadequate promotion and dissemination of achievements, capabilities and opportunities at various levels of decision-making. (CB) (B)
3. The information is shareable, but not timely delivered or up to date: inadequate quality of the information to support the decision-making processes.
4. Development or enhancement of EO capacity and EO curricula at universities and other tertiary institutions (scientific level); training of trainers needs to be promoted to keep pace with changes in the environment and technology (refresher and vocational level). (CB)
5. Need for adequate infrastructure for data storage and processing at the level of the end-user. IMPLEMENTATION
1. Lack of performance indicators, standards for accreditation, and certification procedures for education in the field of EO (and for the use of EO in general). (CB)
2. Institutionalization of CB to support proficiency in the development of EO applications and awareness of new applications. (CB)
3. Identification of key partners (early adopters) at the different levels is crucial to assure the establishment of a structured policy supporting the flow of information and full participation of main stakeholders. (B)
4. A common information platform is essential to assure cooperation between the different thematic networks and cross-cutting activities sharing EO data, technology and knowledge. (CB)
5. Promoting the participation of research communities into established programs of EO research and technology development. (CB)
6. Establishment of a locally driven institutional and policy framework, making use of local dynamics and organizational structures.
7. Ensuring sufficient infrastructure for data dissemination and data utilization.
11
POST-IMPLEMENTATION
1. Awareness raising at institutional level, including added value evaluation, user and use follow-up, and feedback to improve models and products. (B)
2. Promoting networking and capacity building (refresher courses) at all levels, especially cooperation between developing countries. (CB) (B)
The list presented above certainly provides conditions necessary for success. To fulfil these conditions, the aims and objectives of GEO are:
- Create the GEO system of systems (GEOSS); - Coordinate and improve observation systems; - Provide easier and more open access to data; - Foster the use of EO (e.g. for science, applications, capacity building, …) -> … to answer
society’s need for informed decision making; - Focus on societal benefit areas -> … to address the global issues of our time.1
There are of course specific regional components and differences. These will be addressed in the next section on capacity building and in the discussion per SBA of section 6. Important are the aspects ‘connecting with the end-user’ and ‘innovation’: smarter ways to design products and organize processes to reach consumers. There are of course regional differences: some countries may face constraints and needs belonging to the implementation phase of a particular product or service, while others may face constraints and needs belonging to the initiation phase of that same product or service. Based on the analysis in the following sections, conclusions are drawn about which bottlenecks should be tackled first and which success stories deserve to be copied elsewhere.
1 Source: GEO and the latest news, Alan Edwards, PPP, 2008
12
5. CAPACITY BUILDING: EXISTING AND POTENTIAL MARKETS
Opportunities and the role of marketing Earth observations are now at the verge of becoming accessible to a whole new group of end-users. Applications have matured and are ready for the market. The authors are even convinced that general applications of earth observations will occur even if marketing efforts are not undertaken, but also realize that this may take a long time. It is necessary and beneficial to society to speed up the process and this involves making contact with new groups of end-users. The community of earth observation users has grown from a limited group of specialists to a broader community. Now is the time to facilitate the use of earth observations further, and accelerate its integration in regular organizational processes. To do this it is necessary to reach out to new groups of users and decision makers. To give an example: if one looks at the millennium development goals (MDGs), it is difficult to establish a direct relation between the individual goals and earth observations. But if one analyzes the individual goals and the whole process further, it becomes evident that earth observations can provide much added value. To make this clear is one of the aims of this project. Another very important aspect is the involvement of the new group of end-users. This does not only entail a technical capacity to deal with earth observation applications, but also a sense of ownership that makes it possible to empower these new groups of end-users. For example: drinking-water projects in developing countries can be implemented as a strictly technical exercise, but may also be used to improve the organizational capability of villages and neighbourhood groups and to create new dynamics of development. The latter aspect could be even more important. For successful application of earth observations for and by new groups of users it is important to look critically at the ‘weakest link’ aspect. This is achieved by analyzing the whole supply chain from provider to end-user. In earth observation terms this means that products and services should provide an adequate temporal, spatial, radiometric and spectral resolution and that they are reliable, sustainable, affordable and easily adoptable. The instruments to help achieve this are capacity building and brokerage forming the main objective of this project. Capacity building2
2 Sometimes it is useful to subdivide capacity building into human resources development (supply of technical and professional personnel), organizational strengthening (increase management capacity of organizations) and institutional strengthening (increase the capacity of organizations to develop and negotiate appropriate mandates and modus operandi, as well as appropriate (new) legal and regulatory frameworks (Georgiadou and Groot, 2002).
is defined here simply as ‘learning and being capable of doing something new and relevant to a previously defined purpose’ and brokerage is defined as ‘linking providers and (potential) users of a product or service’. Consequently, marketing is just capacity building and brokerage put together. It also implies that the process works both ways: marketing is not only ‘selling’ a certain product or service to clients, but also interaction with the earth observation community to find better ways of serving the client community. To summarize:
13
marketing involves selling earth observation applications as well as providing feedback about client needs for earth observations. Trends The key to a successful approach to capacity building is extending the existing capacity3
. To do that the existing capacity in earth observations has to be assessed. This is not an easy task, as earth observations are not only integrated in geo-information, but (like geo-information) are embedded in many different disciplines. As described in section 3, the inventory based on the simple UML-model provides a first insight and forms the basis for further development and refinement (work package 3.5.1). Still, some trends can already be distinguished and are described below.
In many cases applications of earth observations are still in the initialization, design, prototyping or system development phase. Markets (and funding opportunities) are therefore not well developed yet. Market studies, such as the remote sensing study by Global Insights/NOAA for North and South America, Asia, Africa, Europe and Australia show a continued upward trend in remote sensing data use and predict strong growth for the remote sensing sector. This is confirmed by other studies, even when the current economic crisis is taken into account. If the market really expands, there will be an accompanying strongly growing demand for capacity building. A preliminary analysis of the available data shows some of the trends in capacity building needs for earth observations. The base flow consists of a regular need for professionals in geo-information, both in the technical substrata, such as cartography, surveying, visualization, database management, web services, spatial data handling, and geo-statistics, and in applied disciplines, such as water and natural resource management, agriculture, urban planning, earth sciences, meteorology, oceanography, and land administration. This need ranges from the vocational/technologist level to the masters/PhD level. There is not much information available and the situation differs per region, but the general assumption is that in most developed countries there is a steady, slow growing, but limited number of job opportunities available. In developing countries and emerging economies the situation may be different. Once a certain level is reached it is assumed demand will stabilize. Ball park figures for a developed country with a mature geo-information market are 3 – 5 geo-professionals per 10,000 inhabitants with a 20-40-40 ratio between university, polytechnic and vocational. The regular annual inflow needed to match demand and supply is estimated at 5 – 10 % of the total geo-information workforce. The demand is usually served through the regular educational system of the country concerned. The other trend is that there is a need for short courses at all levels to familiarize professionals of all types with earth observation and its applications. This ranges from short courses for engineers or geographers with different backgrounds, to refresher courses for geo-information specialists (to keep up with developments), to seminars and workshops for decision makers. As mentioned above, the potential demand for this type of capacity building is huge, as the benefits of earth observation applications become more and more apparent. The number of different subjects is also substantial
3 Building on capacity, Molenaar en Beerens, 2005
14
as the discussion on the different Societal Benefit Areas in section 6 will show. This demand is partly addressed by the regular educational system and partly by specialized organizations and/or special initiatives in a project or program format. To successfully cater to this growing demand for capacity in earth observations and create a truly international dimension, issues such as certification of training, cross-border recognition of diploma’s and certificates, and quality assurance become very important. This is of course a very ambitious exercise; within the framework of GEO various workshops have been organized to address the issue of cross-border recognition. The first step should be certification of international short courses on earth observations, allowing for all big players to keep or establish their own systems, but at the same time ensuring coordination and compatibility (a ‘GEOSS within GEOSS’ for capacity building). The GEONetCab capacity building web would be the home base for this ‘capacity building GEOSS’ within GEOSS, forming a node within the GEO Portal network. This website should provide as much material as possible for free, and accompanied by references to other sites with training materials. Partners, including the GEONetCab project partners, are strongly encouraged, but not obliged, to provide capacity building material at no cost. As the recent example of the Massachusetts Institute of Technology has shown, the trend is to disclose the curriculum and contents of lectures to the general public, as the most prized commodity of educational and research institutions is not their material, but their intellectual capacity. Global and regional aspects The general components of capacity building initiatives are technical assistance (such as advice, and curriculum development), facilities (buildings, equipment and instruments, hard- and software, library, etc.), training, joint research, and general management. The modalities for training range from seminars, distance education, tailor-made courses, regular short courses, and diploma courses (technologist level) to BSc, MSc, and PhD education. These activities are usually directed at professionals and students. In some countries4 the education of geo-information also receives attention in secondary schools, or even in primary schools. From this variety of capacity building tools, the best packages have to be composed to address different problems and target groups. It is clear that a ‘one-size fits all’ approach will not offer the optimal solution. An important aspect to keep in mind is that capacity building, certainly in the form of institutional strengthening, is a long-term process: the common perception is that the time it takes to start a program almost from scratch and to develop it into a sustainable program with (joint) research is about 10 – 12 years5
.
There are quite a number of capacity building initiatives and programs under implementation worldwide. Long-term players in global earth observation capacity building are the regional centres, resorting under the United Nations office for outer space affairs (UN-OOSA): - the centre for space science and technology education in Asia and the Pacific (CSSTEAP) in India;
4 Such as in Rwanda with support from ESRI. 5 Common experience of IRD and ITC.
15
- the African regional centre for space science and technology education in English (ARCSSTE-E) in Nigeria;
- the African regional centre for space science and technology education in French (CRASTE-LF) in Morocco; and
- the regional centre for space science and technology education in Latin America and the Caribbean (CRECTEALC) in Brazil and Mexico.
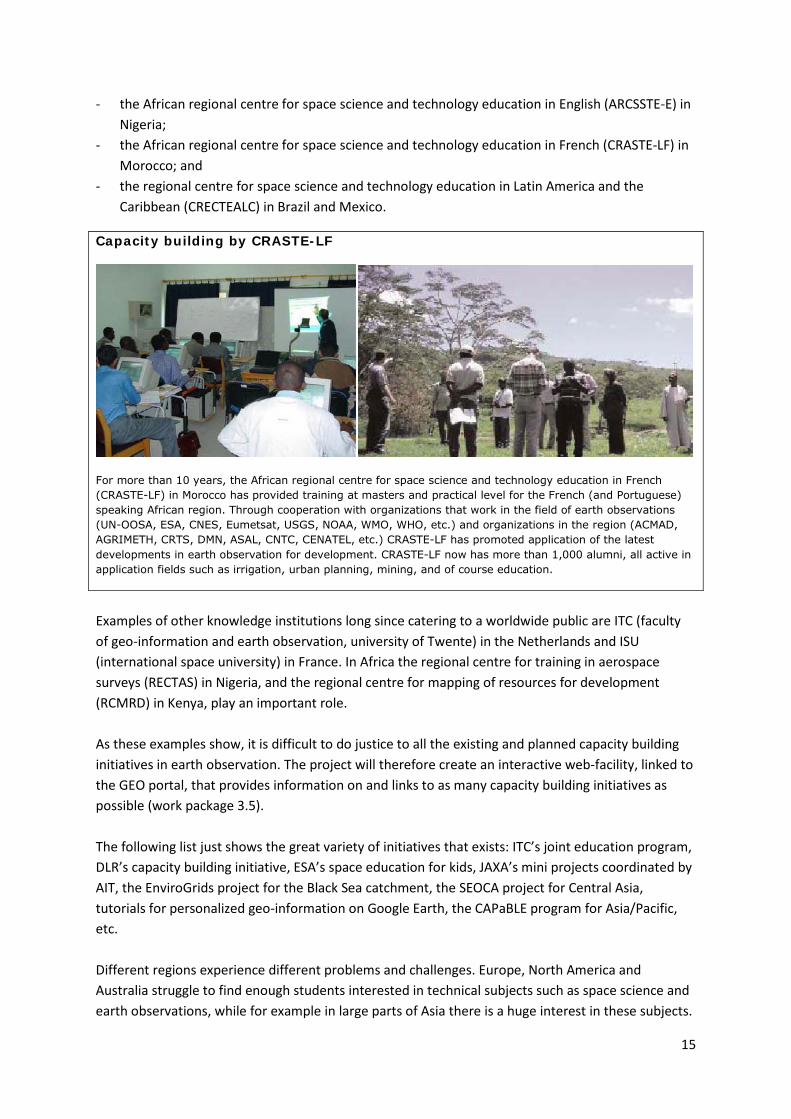
Capacity building by CRASTE-LF
For more than 10 years, the African regional centre for space science and technology education in French (CRASTE-LF) in Morocco has provided training at masters and practical level for the French (and Portuguese) speaking African region. Through cooperation with organizations that work in the field of earth observations (UN-OOSA, ESA, CNES, Eumetsat, USGS, NOAA, WMO, WHO, etc.) and organizations in the region (ACMAD, AGRIMETH, CRTS, DMN, ASAL, CNTC, CENATEL, etc.) CRASTE-LF has promoted application of the latest developments in earth observation for development. CRASTE-LF now has more than 1,000 alumni, all active in application fields such as irrigation, urban planning, mining, and of course education.
Examples of other knowledge institutions long since catering to a worldwide public are ITC (faculty of geo-information and earth observation, university of Twente) in the Netherlands and ISU (international space university) in France. In Africa the regional centre for training in aerospace surveys (RECTAS) in Nigeria, and the regional centre for mapping of resources for development (RCMRD) in Kenya, play an important role. As these examples show, it is difficult to do justice to all the existing and planned capacity building initiatives in earth observation. The project will therefore create an interactive web-facility, linked to the GEO portal, that provides information on and links to as many capacity building initiatives as possible (work package 3.5). The following list just shows the great variety of initiatives that exists: ITC’s joint education program, DLR’s capacity building initiative, ESA’s space education for kids, JAXA’s mini projects coordinated by AIT, the EnviroGrids project for the Black Sea catchment, the SEOCA project for Central Asia, tutorials for personalized geo-information on Google Earth, the CAPaBLE program for Asia/Pacific, etc. Different regions experience different problems and challenges. Europe, North America and Australia struggle to find enough students interested in technical subjects such as space science and earth observations, while for example in large parts of Asia there is a huge interest in these subjects.
16
In many parts of the world funding is available and the choice for investment in earth observations capacity building is one of allocation, while in most parts of Africa there is a general shortage of resources. This is precisely the reason why Africa receives special attention in earth observation capacity building, also by means of this project. Some examples of ongoing efforts in Africa are: IRD/CNES programs, ITC’s joint education programs, SERVIR, TIGER, AMESD, national programs and programs funded by multi- and bilateral donors. South-south cooperation is also becoming more and more important. Most of these initiatives are supported by different fellowship programs facilitating capacity building in earth observations (and many other subjects) by sponsoring a study abroad. Another preliminary observation that applies to most countries in Africa is that there is an overall shortage of capacity, but that, on the other hand, the number of professionals and scientists trained to PhD and MSc level is relatively high. This is confirmed by the work these highly skilled professionals (have to) do in practice. There is a huge need for professionals at technologist level. This is confirmed by the demand for existing courses at this level6
.
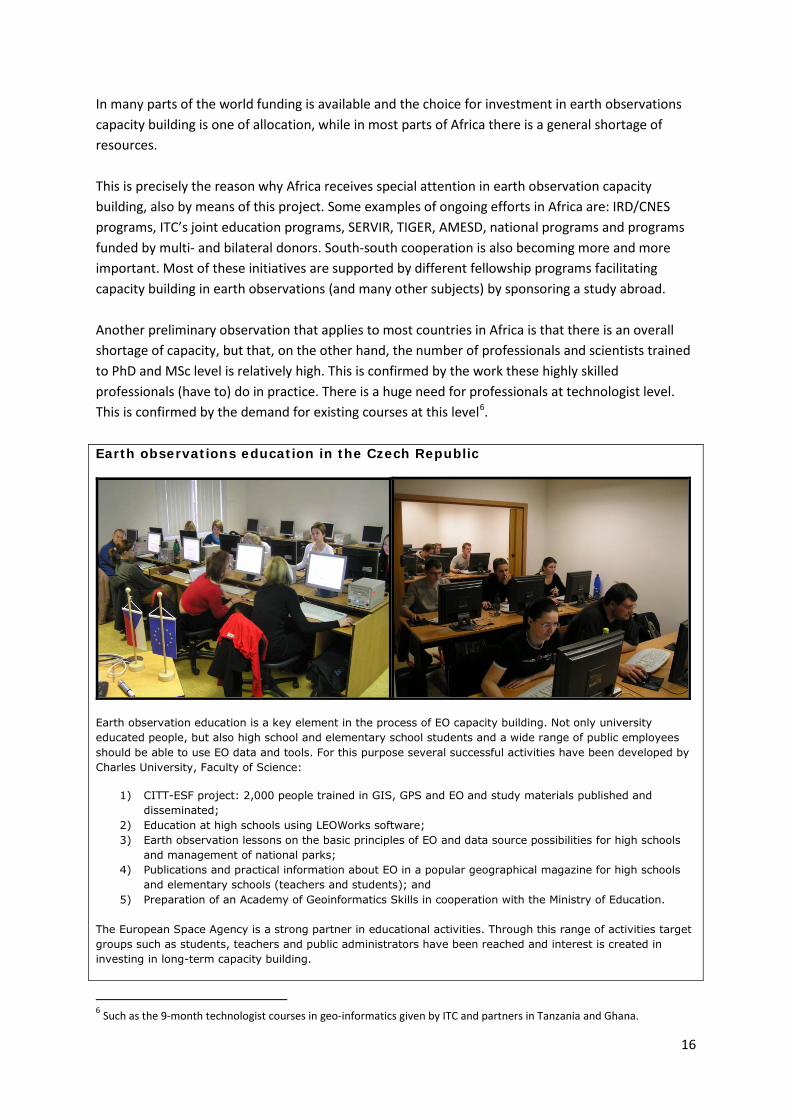
Earth observations education in the Czech Republic
Earth observation education is a key element in the process of EO capacity building. Not only university educated people, but also high school and elementary school students and a wide range of public employees should be able to use EO data and tools. For this purpose several successful activities have been developed by Charles University, Faculty of Science:
1) CITT-ESF project: 2,000 people trained in GIS, GPS and EO and study materials published and disseminated;
2) Education at high schools using LEOWorks software; 3) Earth observation lessons on the basic principles of EO and data source possibilities for high schools
and management of national parks; 4) Publications and practical information about EO in a popular geographical magazine for high schools
and elementary schools (teachers and students); and 5) Preparation of an Academy of Geoinformatics Skills in cooperation with the Ministry of Education.
The European Space Agency is a strong partner in educational activities. Through this range of activities target groups such as students, teachers and public administrators have been reached and interest is created in investing in long-term capacity building.
6 Such as the 9-month technologist courses in geo-informatics given by ITC and partners in Tanzania and Ghana.
17
Link with GEO capacity building tasks Within GEO are the following GEO capacity building tasks: CB-09-01 ‘resource mobilization (Seville roadmap)’ There is an overlap with this project, WP 3 (connecting and building), 4 (awareness and dissemination) and 5 (evaluation and follow-up for brokerage) basically cover this task. CB-09-02 ‘building individual capacity building in earth observations’ The project has a link with subtask a) ‘recognition of cross-border education’ through WP 3.5 (capacity building web). Subtasks d) ‘CBERS/GEO network’ (WP 4) and g) ‘GEONETCast training’ can be used as success stories. CB-09-03 ‘building institutional capacity building in earth observations’ There is definitely a link with the task in general, although the project does not link specifically to any of the current subtasks. CB-09-04 ‘capacity building needs and gap assessment’. WP 1 (inventory) and 2 (bottlenecks and opportunities) of the project should deliver the results for subtask a) ‘identifying best practices, gaps and needs’. There is a link with b) ‘capacity building performance indicators’: a workshop on the subject is planned in WP 4. The IOC principles for capacity building report and BGR capacity building in GEOSS document are used as reference for this subtask. CB-09-05 ‘infrastructure development and technology transfer for information access’. The project has links with the task in general, but not specifically with any of the current subtasks. CB-10-01 ‘building capacity through outreach and awareness raising’. There is a link with WP 4 of the project. There is also a relation with GEO-tasks ST-09-01 ‘catalyzing R&D funding for GEOSS’ and US-09-01 ‘user engagement’. The results of this study and future actions resulting from the project will be shared and, where applicable, carried out jointly with the coordinators of these tasks. Analysis of bottlenecks and needs The analysis presented below is based on the issues relevant to capacity building indicated in section 4. Each constraint and need is dealt with and further treatment in relation to SBAs is taken up in the next section. Action points for the GEONetCab are formulated to reach the end-user (‘last mile’ aspect) and to remove bottlenecks and satisfy needs (‘weakest link aspect’).
18
Initialization
This constraint affects developing countries most and can be removed by making use of free or low-cost software. There are a number of free packages available, such as GRASS, SPRING and ILWIS, that are accessible, free and available in different languages. The market leader in geo-information software, ESRI, sponsors activities in developing countries. For instance, ESRI not only provides free software to ITC graduates, but also to ITC’s education partners in developing countries and their graduates. Also, more and more people are getting familiar with web-based initiatives such as Google Earth and quite a number of manuals and tutorials have been developed to facilitate use for specific purposes.
High costs of software licenses (use and development of open-source software needed)
Action points for the project:
1. Complete the inventory of open-source software and make an action plan for increased use for different purposes with partners in developing countries.
2. Approach major providers of geo-information software to discuss increased support for capacity building initiatives with the aim of market development.
3. Investigate the use of Google Earth type applications further. 4. Put the opportunities derived from actions 1 – 3 on the GEONetCab website (as part of the
capacity building web) and create a link with the GEO Portal.
Again, this constraint is most severely felt in developing countries, often accompanied by the more traditional problem of power outages. New modes of delivery of data and capacity building material in the form of, for example, the GEONETCast initiative, can help solve (parts of) this problem. Distance education by satellite is already applied successfully in several countries, for instance in India (ISRO/IIRS). As long as easy and fast internet are not readily available, other modes of data distribution have to be considered, such as through CDs. ITC, for example, uses a combination in its distance education courses (with participants all over the world): the software, course material and data are sent by courier (on CD) and the actual communication during the course is done through the internet.
Easy and fast internet access is lacking (sufficient bandwidth needed)
Action points for the project:
1. Complete the inventory of successful modes of delivery of capacity building that minimize the constraints of limited internet access.
2. Further investigate future possibilities of GEONETCast and related systems for capacity building and gaining access to new target groups.
3. Put the opportunities derived from actions 1 – 2 on the GEONetCab website (as part of the capacity building web) and create a link with the GEO Portal.
This is a general constraint that is being addressed by GEO and other initiatives. If the other capacity building constraints are removed and the needs are satisfied, then this problem will also be solved.
Insufficient capacity building resources to provide a sustainable human resource base
19
This is again a general constraint, addressed by GEO and other initiatives. The problem is tackled in two ways: on the one hand more and better infrastructure is provided, on the other hand ways are sought to provide cheap, easy to use and robust alternatives (see the GEONETCast example).
Lack of infrastructure to access, use and develop EO data and products (infrastructure for data access, analysis and distribution needed)
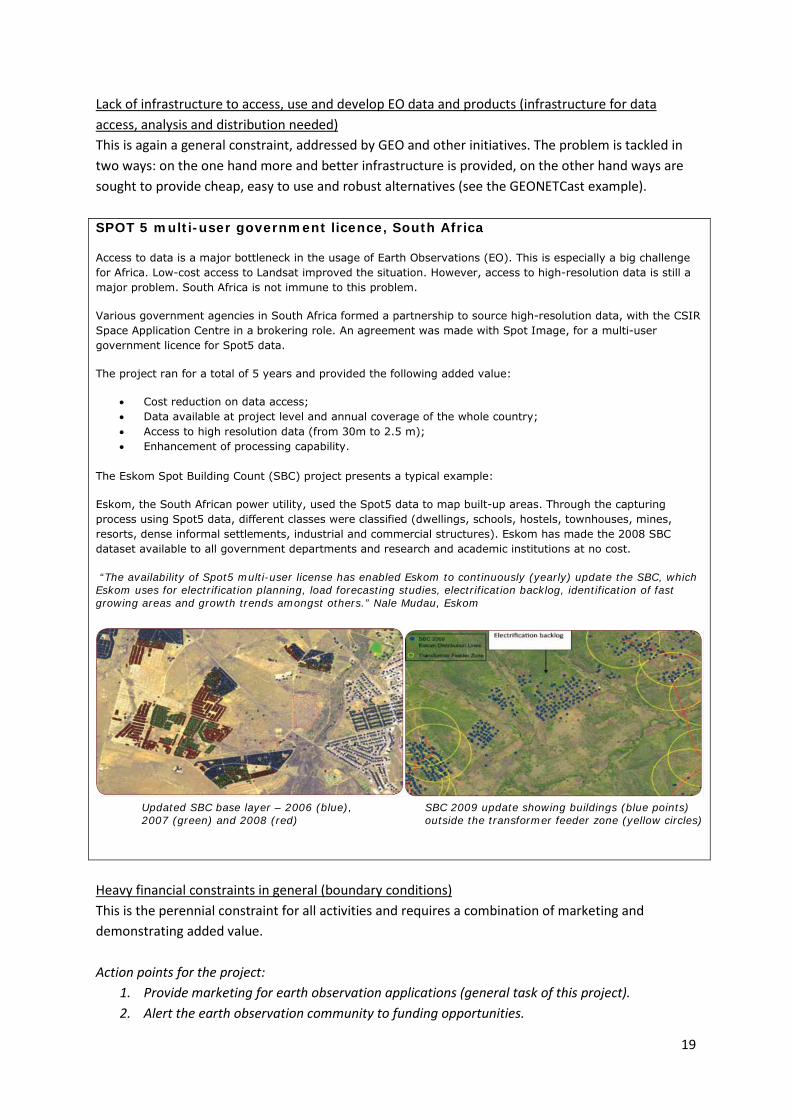
SPOT 5 multi-user government licence, South Africa
Access to data is a major bottleneck in the usage of Earth Observations (EO). This is especially a big challenge for Africa. Low-cost access to Landsat improved the situation. However, access to high-resolution data is still a major problem. South Africa is not immune to this problem.
Various government agencies in South Africa formed a partnership to source high-resolution data, with the CSIR Space Application Centre in a brokering role. An agreement was made with Spot Image, for a multi-user government licence for Spot5 data.
The project ran for a total of 5 years and provided the following added value:
• Cost reduction on data access; • Data available at project level and annual coverage of the whole country; • Access to high resolution data (from 30m to 2.5 m); • Enhancement of processing capability.
The Eskom Spot Building Count (SBC) project presents a typical example:
Eskom, the South African power utility, used the Spot5 data to map built-up areas. Through the capturing process using Spot5 data, different classes were classified (dwellings, schools, hostels, townhouses, mines, resorts, dense informal settlements, industrial and commercial structures). Eskom has made the 2008 SBC dataset available to all government departments and research and academic institutions at no cost.
“The availability of Spot5 multi-user license has enabled Eskom to continuously (yearly) update the SBC, which Eskom uses for electrification planning, load forecasting studies, electrification backlog, identification of fast growing areas and growth trends amongst others.” Nale Mudau, Eskom Updated SBC base layer – 2006 (blue), SBC 2009 update showing buildings (blue points) 2007 (green) and 2008 (red) outside the transformer feeder zone (yellow circles)
This is the perennial constraint for all activities and requires a combination of marketing and demonstrating added value.
Heavy financial constraints in general (boundary conditions)
Action points for the project:
1. Provide marketing for earth observation applications (general task of this project). 2. Alert the earth observation community to funding opportunities.
20
3. Identify success stories in terms of income generation and sustainability. 4. Put the opportunities and information derived from actions 1 – 3 on the GEONetCab website
(as part of the capacity building web) and link them to the GEO Portal. System analysis and design
This constraint has several different aspects. Firstly, in developing countries there is a lack of absolute research capacity. Secondly, developing countries are not perceived to be an interesting market for targeted solutions. And thirdly, when an effort is made, products and services are usually one-to-one copies from other environments and consequently not suited to the particular situation on the ground. Most emerging economies went through this stage and have managed to establish a good research environment (EMBRAPA in Brazil is often used as an example). Apart from supporting all aspects of capacity building, showing the possibilities of building research capacity from within may help.
Insufficient collaborative research for and in developing countries
Action points for the project:
1. Identify and collect success stories from emerging economies and developing countries in setting up a research culture for country-specific solutions7
2. Put the success stories on the GEONetCab website (as part of the capacity building web), link them to the GEO Portal, and use them for the dissemination toolkit.
in earth observations.
This general constraint is addressed by GEO and other initiatives. General promotion and capacity building activities will remove this bottleneck, as earth observations will become more popular and mainstream.
Low rate of introduction and incorporation of EO courses in the regular curricula of higher learning institutions (universities)
Rapid prototyping
The need for more focus on development of prototypes is very much related to the need for setting up a good research environment. The actions relating to the project are therefore the same.
Need for more focus of capacity building and research on development of prototypes of EO operational models and products
System development
This constraint is very important. It is one of the main objectives of GEO to improve the link between all stakeholders. Regarding reaching the user community great progress has been made. The next step is the involvement of end-user communities, which are not necessarily earth observation oriented.
Insufficient linkage between stakeholders, user communities to determine a research agenda and CB requirements (based on common interest), resulting in uncoordinated initiatives without common vision, common purpose or joint action
7 And also for development of prototypes (see below).
21
Action points for the project:
1. Ensure that all the promotion material developed by the project is directed at and intelligible for the end-user, including decision makers.
2. Ensure that the capacity building opportunities identified and highlighted by the project are accessible to and brought under the attention of the end-user, including decision-makers.
3. Provide feedback to the GEO community to ensure good synthesis in system development (i.e. end-users, including decision-makers, are also involved in products and services development).
This is one of the great impediments hampering the general acceptation and adoption of earth observation applications by a wider public. GEO has been instrumental in addressing this constraint in general and has put earth observations on the map. Now it is time to take a next step and increase the promotion and dissemination to specific target groups (see also section 6). The corresponding increase in interest will also lead to new opportunities for capacity building.
Inadequate promotion and dissemination of achievements, capabilities and opportunities at various levels of decision-making
Action points for the project: see above at ‘insufficient linkage…’.
GEO has made great headway in achieving this and the GEO process is a catalyst in itself ensuring research participation dynamics.
Promote the participation of research communities into established programs of EO research and technology development
Action points for the project: see above at ‘heavy financial constraints…’.
This need is most pressingly felt in developing countries. Institutions with a mission towards both development cooperation and earth observations, such as the UN centres mentioned above, are addressing this need. There is quite a range of initiatives, but in general it is difficult to convince the donor community of the direct relevance of earth observation for development as the subject does not clearly match any of the established support categories.
Develop or enhance EO capacity and EO curricula at universities and other tertiary institutions (scientific level); promote training of trainers to keep pace with changing environments and technology (refresher and vocational level)
Action points for the project:
1. Provide links to existing EO curricula and free material through the GEONetCab website. 2. Develop promotion material targeted at the donor community to show successful earth
observations and create interest in investing in capacity building and system development for earth observations.
22
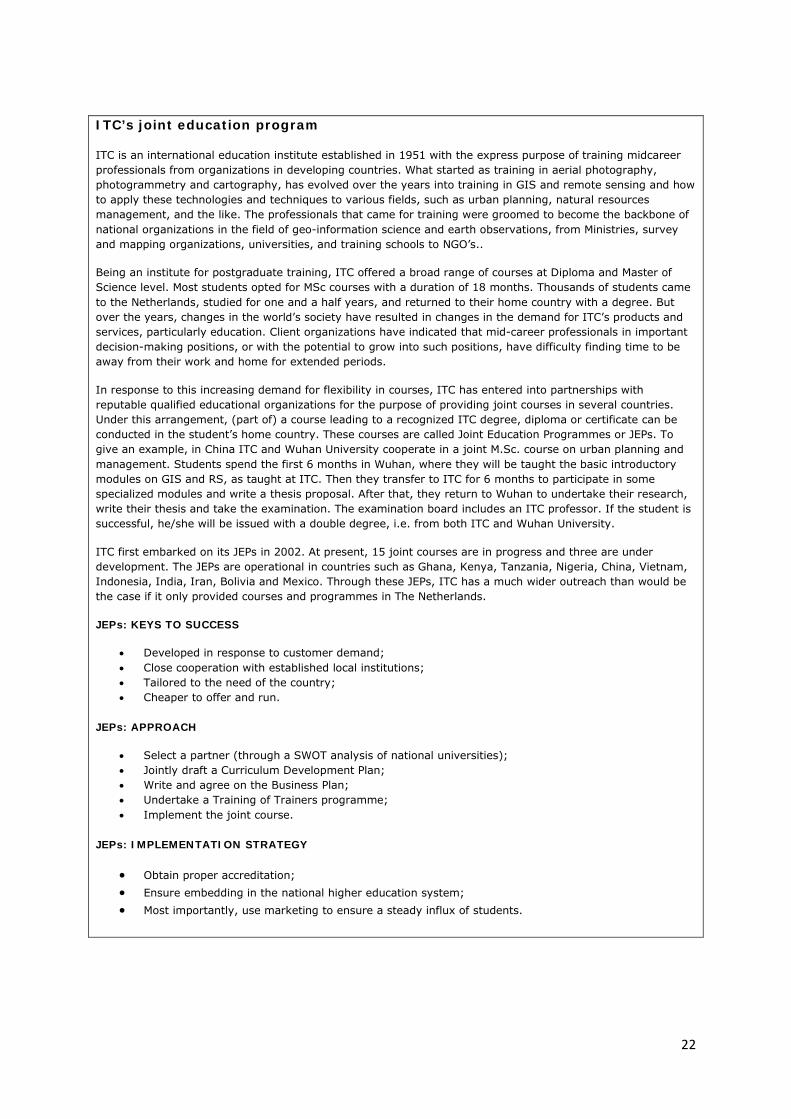
ITC’s joint education program
ITC is an international education institute established in 1951 with the express purpose of training midcareer professionals from organizations in developing countries. What started as training in aerial photography, photogrammetry and cartography, has evolved over the years into training in GIS and remote sensing and how to apply these technologies and techniques to various fields, such as urban planning, natural resources management, and the like. The professionals that came for training were groomed to become the backbone of national organizations in the field of geo-information science and earth observations, from Ministries, survey and mapping organizations, universities, and training schools to NGO’s..
Being an institute for postgraduate training, ITC offered a broad range of courses at Diploma and Master of Science level. Most students opted for MSc courses with a duration of 18 months. Thousands of students came to the Netherlands, studied for one and a half years, and returned to their home country with a degree. But over the years, changes in the world’s society have resulted in changes in the demand for ITC’s products and services, particularly education. Client organizations have indicated that mid-career professionals in important decision-making positions, or with the potential to grow into such positions, have difficulty finding time to be away from their work and home for extended periods.
In response to this increasing demand for flexibility in courses, ITC has entered into partnerships with reputable qualified educational organizations for the purpose of providing joint courses in several countries. Under this arrangement, (part of) a course leading to a recognized ITC degree, diploma or certificate can be conducted in the student’s home country. These courses are called Joint Education Programmes or JEPs. To give an example, in China ITC and Wuhan University cooperate in a joint M.Sc. course on urban planning and management. Students spend the first 6 months in Wuhan, where they will be taught the basic introductory modules on GIS and RS, as taught at ITC. Then they transfer to ITC for 6 months to participate in some specialized modules and write a thesis proposal. After that, they return to Wuhan to undertake their research, write their thesis and take the examination. The examination board includes an ITC professor. If the student is successful, he/she will be issued with a double degree, i.e. from both ITC and Wuhan University.
ITC first embarked on its JEPs in 2002. At present, 15 joint courses are in progress and three are under development. The JEPs are operational in countries such as Ghana, Kenya, Tanzania, Nigeria, China, Vietnam, Indonesia, India, Iran, Bolivia and Mexico. Through these JEPs, ITC has a much wider outreach than would be the case if it only provided courses and programmes in The Netherlands.
JEPs: KEYS TO SUCCESS
• Developed in response to customer demand; • Close cooperation with established local institutions; • Tailored to the need of the country; • Cheaper to offer and run.
JEPs: APPROACH
• Select a partner (through a SWOT analysis of national universities); • Jointly draft a Curriculum Development Plan; • Write and agree on the Business Plan; • Undertake a Training of Trainers programme; • Implement the joint course.
JEPs: IMPLEMENTATION STRATEGY
• Obtain proper accreditation; • Ensure embedding in the national higher education system; • Most importantly, use marketing to ensure a steady influx of students.
23
Implementation
This is also a general constraint for capacity building. The issue is addressed by GEO through the subtasks on cross-border recognition and performance education. An additional difficulty is that this is not only a problem for earth observation education, but for international education in general. The worldwide problem is too big to tackle with GEO, let alone the GEONetCab project. The project therefore focuses on those elements that really stand in the way of capacity building for concrete applications, starting with short courses.
Lack of performance indicators, standards for accreditation, and certification procedures for education in the field of EO (and for the use of EO in general)
Actions for the project:
1. Promote the use of certification for short courses on earth observation and promote compatibility between the systems used by major capacity building providers.
2. Put the certification results, or at least the acquired capabilities, of the different courses on the project website.
3. Organize a workshop on performance indicators for capacity building (WP 4), focusing on bottlenecks and needs to ensure successful applications of earth observations.
Traditionally this is one of the main bottlenecks in capacity building. In a lot of projects and programs capacity building is included and it often forms an important component of the initiative, but during the implementation phase it becomes an afterthought covered only (partly) at the very end. The GEO capacity building committee aims to achieve institutionalization of capacity building for earth observation. The contribution of the project to achieving this aim is highlighted by the actions presented above.
Institutionalize CB to support proficiency in the development of EO applications and awareness of new applications
A common information platform is essential to assure cooperation between the different thematic networks and cross-cutting activities sharing EO data, technology and knowledgeThe GEO Portal aims to be this common information platform. The goal is to direct customers through its network of networks to the right place at the right time. To accomplish this for capacity building is one of the main tasks of the GEONetCab project. The project website, linked to the GEO Portal, provides the common information platform. The different activities related to the website are presented above.
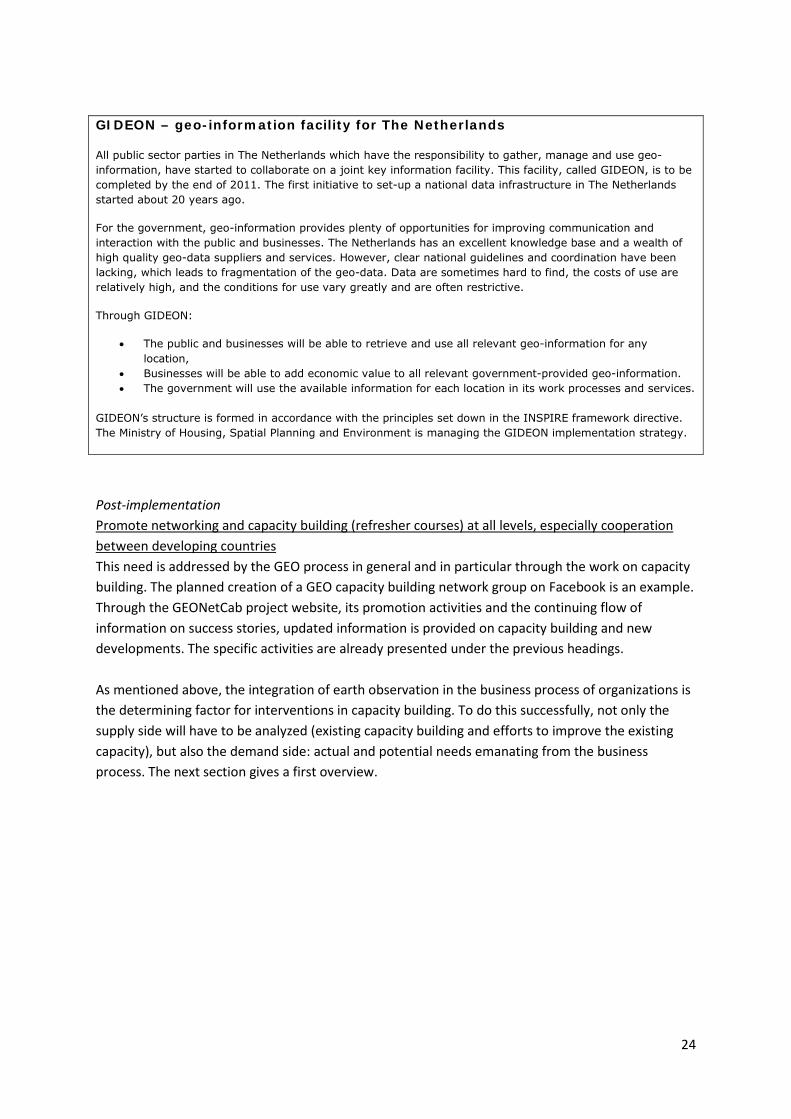
24
GIDEON – geo-information facility for The Netherlands
All public sector parties in The Netherlands which have the responsibility to gather, manage and use geo-information, have started to collaborate on a joint key information facility. This facility, called GIDEON, is to be completed by the end of 2011. The first initiative to set-up a national data infrastructure in The Netherlands started about 20 years ago.
For the government, geo-information provides plenty of opportunities for improving communication and interaction with the public and businesses. The Netherlands has an excellent knowledge base and a wealth of high quality geo-data suppliers and services. However, clear national guidelines and coordination have been lacking, which leads to fragmentation of the geo-data. Data are sometimes hard to find, the costs of use are relatively high, and the conditions for use vary greatly and are often restrictive.
Through GIDEON:
• The public and businesses will be able to retrieve and use all relevant geo-information for any location,
• Businesses will be able to add economic value to all relevant government-provided geo-information. • The government will use the available information for each location in its work processes and services.
GIDEON’s structure is formed in accordance with the principles set down in the INSPIRE framework directive. The Ministry of Housing, Spatial Planning and Environment is managing the GIDEON implementation strategy.
Post-implementation
This need is addressed by the GEO process in general and in particular through the work on capacity building. The planned creation of a GEO capacity building network group on Facebook is an example. Through the GEONetCab project website, its promotion activities and the continuing flow of information on success stories, updated information is provided on capacity building and new developments. The specific activities are already presented under the previous headings.
Promote networking and capacity building (refresher courses) at all levels, especially cooperation between developing countries
As mentioned above, the integration of earth observation in the business process of organizations is the determining factor for interventions in capacity building. To do this successfully, not only the supply side will have to be analyzed (existing capacity building and efforts to improve the existing capacity), but also the demand side: actual and potential needs emanating from the business process. The next section gives a first overview.
25
6. THE GEO SOCIETAL BENEFIT AREAS: OPPORTUNITIES AND BOTTLENECKS
For each GEO Societal Benefit Area a quick and preliminary analysis has been performed8
to determine where the highest impact and added value may be obtained for the end-user in using earth observations (also aiming at creating a snowball effect). To do this, it is important to analyze the different Societal Benefit Areas of GEO in relation to already successful and promising earth observation interventions.
Each Societal Benefit Area is divided into different categories of products and services. Where great minds, such as Aristotle and Kant, have tried to construe the world in terms of categories, and failed, we do not see the categories as absolute and given, but rather as workable distinctions as perceived by the end-user. General actions for capacity building are already described in the previous section and aim to cover all Societal Benefit Areas. Specific actions for the project are formulated below, based on the analysis per products/services category and taking into account the constraints and needs identified in section 4 with special relevance to brokerage. Project activities will be selected to provide maximum added value: some products and services categories will already be well covered by current promotion activities, while others will need special attention. A similar distinction will be made with respect to constraints and needs for different regions. All the constraints related to brokerage emphasize the need to reach out to decision-makers and end-users throughout all expert system life cycle phases (see section 4). The phase in the life cycle determines the type of marketing needed for each product services category. In early phases marketing will be more directed at research and development, and in later phases more at applications. The regional distribution of applications of earth observation is something that also has to be taken into account. Applications, which have been implemented in certain regions, may not have been replicated in others yet. This will determine the type of capacity building and promotion effort best suited to a particular situation. In summary, there is a framework with four dimensions:
1. A distinction between categories of earth observation products / services, as part of the business process of organizations;
2. The determination of the life cycle phase and the prospects of development towards maturity of these products and services (the vertical process);
3. The regional spread of applications and (to a lesser extent) research and development (the horizontal process);
8 From various GEO-documents plus other sources.
26
4. The optimal mix of marketing (capacity building and brokerage) efforts to support speeding up the vertical process (towards application) and horizontal process (towards replication) for each products / services category.
This framework also forms the general foundation for an evaluation mechanism. Once the baseline is established, performance indicators are derived from the increased vertical and horizontal spread.9
Disasters For the assessment of the disaster SBA a distinction is made between the following categories of product lines: risk assessment/simulation models, forecasting/early warning, monitoring, damage assessment, prevention/planning and a general category. In view of marketing opportunities this type of partitioning is preferred to categorizing per type of disaster (volcanic eruptions, landslides, earthquakes, floods, droughts, etc.). The description of the different topics is meant as illustration from a marketing perspective and does not pretend to present a complete overview. In the category ‘risk assessment/simulation models’, examples are ocean surface topography and subsidence detection. Ocean surface topography products are directed at hurricanes and typhoons and therefore mainly serve a governmental market. In some regional areas there are products available in the implementation phase (NASA twitter service for hurricanes in the US). The initiative aims at worldwide coverage. The status of worldwide operational use and capacity building requirements is not clear yet. For a successful implementation in other regions alternative options for dissemination may have to be considered. Subsidence detection for the prediction of landslides and earthquakes is directed at the government and local government market. An example is the Italian landslide inventory project (IFFI). Earth observations (CORINE land cover) form the basis of the inventory, the project relies heavily on airborne photography. WebGIS applications are developed for local authorities. For successful promotion in other regions of the world an analysis has to be made, which data apart from earth observations are essential. After such a feasibility assessment, capacity building takes place through a series of short courses, especially paying attention to WebGIS and other tools that serve local authorities and disaster management agencies. The related GEO-tasks are DI-09-01 ‘monitoring for geohazards risk assessment’ (including the work of the geohazards community of practice) and DI-09-02 ‘multi-risk management and regional applications’. Promotion and capacity building for risk assessment will be included in the project activities for planning and prevention (see below). Specific actions as part of the project:
1. Include disaster risk assessment capacity building material in the GEONetCab capacity building web.
2. Gather success stories for general promotion aimed at decision makers.
9 A complicating factor with an evaluation mechanism for GEO will be to distinguish between GEO-induced developments and developments caused by other factors.
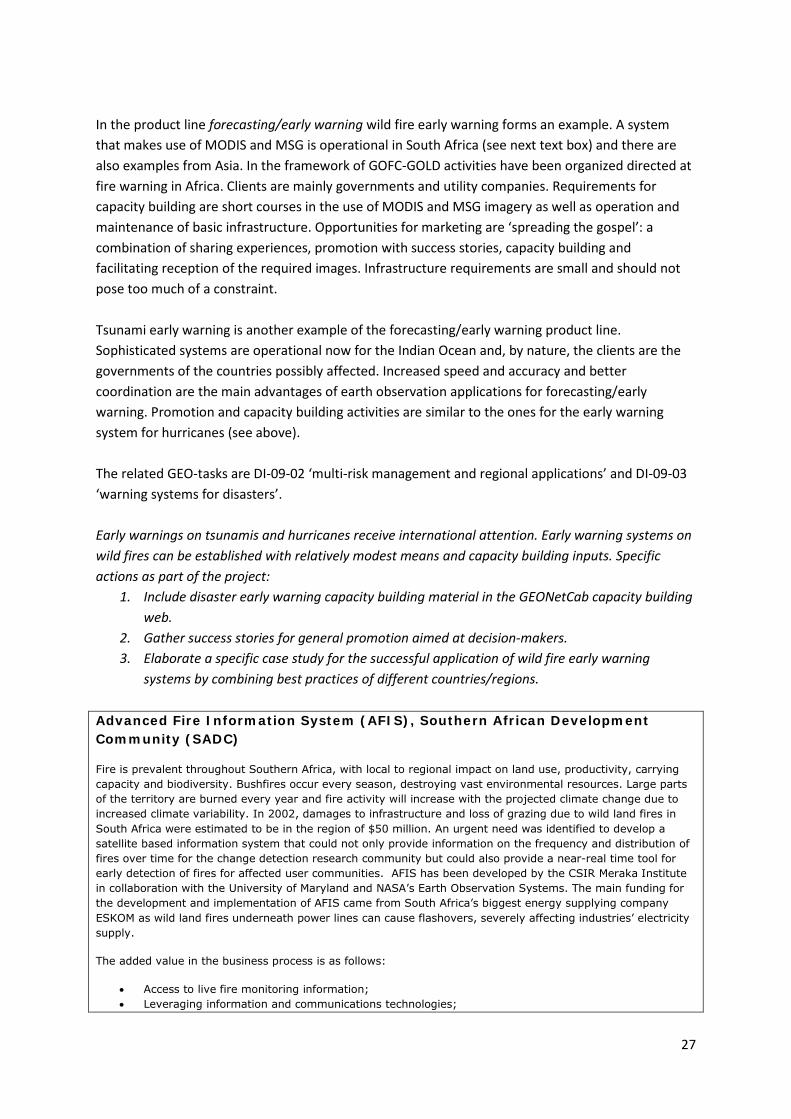
27
In the product line forecasting/early warning wild fire early warning forms an example. A system that makes use of MODIS and MSG is operational in South Africa (see next text box) and there are also examples from Asia. In the framework of GOFC-GOLD activities have been organized directed at fire warning in Africa. Clients are mainly governments and utility companies. Requirements for capacity building are short courses in the use of MODIS and MSG imagery as well as operation and maintenance of basic infrastructure. Opportunities for marketing are ‘spreading the gospel’: a combination of sharing experiences, promotion with success stories, capacity building and facilitating reception of the required images. Infrastructure requirements are small and should not pose too much of a constraint. Tsunami early warning is another example of the forecasting/early warning product line. Sophisticated systems are operational now for the Indian Ocean and, by nature, the clients are the governments of the countries possibly affected. Increased speed and accuracy and better coordination are the main advantages of earth observation applications for forecasting/early warning. Promotion and capacity building activities are similar to the ones for the early warning system for hurricanes (see above). The related GEO-tasks are DI-09-02 ‘multi-risk management and regional applications’ and DI-09-03 ‘warning systems for disasters’. Early warnings on tsunamis and hurricanes receive international attention. Early warning systems on wild fires can be established with relatively modest means and capacity building inputs. Specific actions as part of the project:
1. Include disaster early warning capacity building material in the GEONetCab capacity building web.
2. Gather success stories for general promotion aimed at decision-makers. 3. Elaborate a specific case study for the successful application of wild fire early warning
systems by combining best practices of different countries/regions. Advanced Fire Information System (AFIS), Southern African Development Community (SADC)
Fire is prevalent throughout Southern Africa, with local to regional impact on land use, productivity, carrying capacity and biodiversity. Bushfires occur every season, destroying vast environmental resources. Large parts of the territory are burned every year and fire activity will increase with the projected climate change due to increased climate variability. In 2002, damages to infrastructure and loss of grazing due to wild land fires in South Africa were estimated to be in the region of $50 million. An urgent need was identified to develop a satellite based information system that could not only provide information on the frequency and distribution of fires over time for the change detection research community but could also provide a near-real time tool for early detection of fires for affected user communities. AFIS has been developed by the CSIR Meraka Institute in collaboration with the University of Maryland and NASA’s Earth Observation Systems. The main funding for the development and implementation of AFIS came from South Africa’s biggest energy supplying company ESKOM as wild land fires underneath power lines can cause flashovers, severely affecting industries’ electricity supply.
The added value in the business process is as follows:
• Access to live fire monitoring information; • Leveraging information and communications technologies;
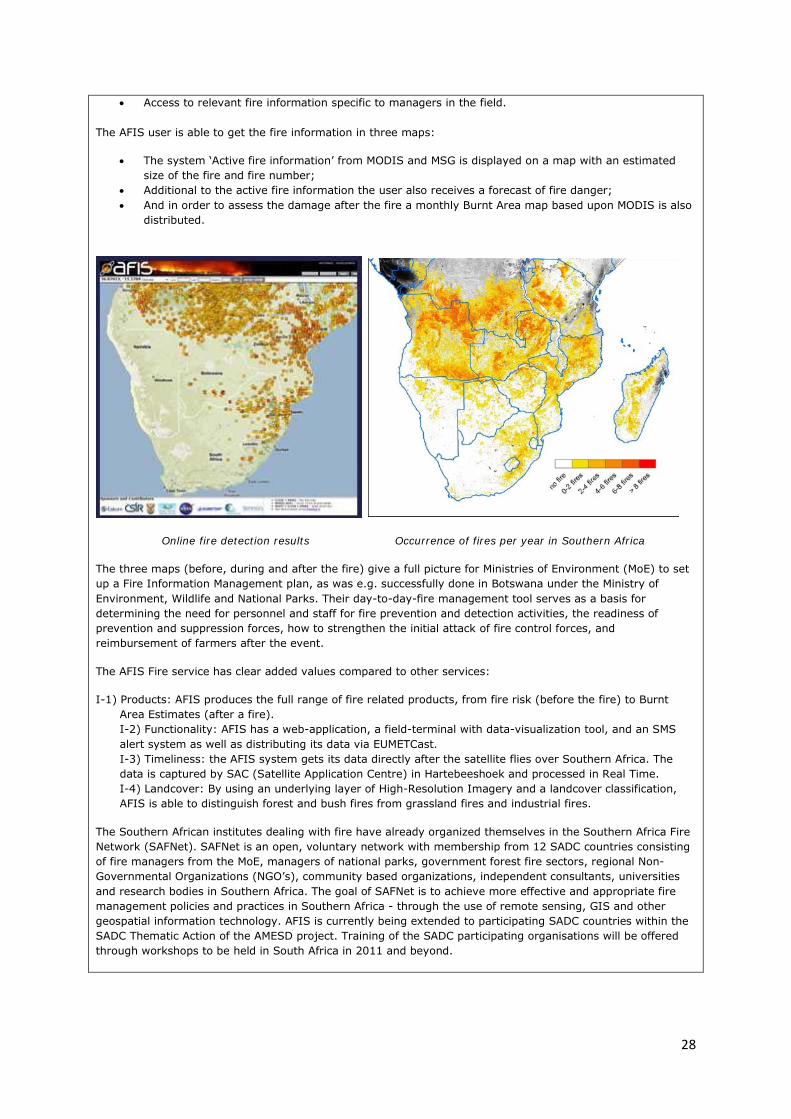
28
• Access to relevant fire information specific to managers in the field.
The AFIS user is able to get the fire information in three maps:
• The system ‘Active fire information’ from MODIS and MSG is displayed on a map with an estimated size of the fire and fire number;
• Additional to the active fire information the user also receives a forecast of fire danger; • And in order to assess the damage after the fire a monthly Burnt Area map based upon MODIS is also
distributed.
Online fire detection results Occurrence of fires per year in Southern Africa
The three maps (before, during and after the fire) give a full picture for Ministries of Environment (MoE) to set up a Fire Information Management plan, as was e.g. successfully done in Botswana under the Ministry of Environment, Wildlife and National Parks. Their day-to-day-fire management tool serves as a basis for determining the need for personnel and staff for fire prevention and detection activities, the readiness of prevention and suppression forces, how to strengthen the initial attack of fire control forces, and reimbursement of farmers after the event.
The AFIS Fire service has clear added values compared to other services:
I-1) Products: AFIS produces the full range of fire related products, from fire risk (before the fire) to Burnt Area Estimates (after a fire). I-2) Functionality: AFIS has a web-application, a field-terminal with data-visualization tool, and an SMS alert system as well as distributing its data via EUMETCast. I-3) Timeliness: the AFIS system gets its data directly after the satellite flies over Southern Africa. The data is captured by SAC (Satellite Application Centre) in Hartebeeshoek and processed in Real Time. I-4) Landcover: By using an underlying layer of High-Resolution Imagery and a landcover classification, AFIS is able to distinguish forest and bush fires from grassland fires and industrial fires.
The Southern African institutes dealing with fire have already organized themselves in the Southern Africa Fire Network (SAFNet). SAFNet is an open, voluntary network with membership from 12 SADC countries consisting of fire managers from the MoE, managers of national parks, government forest fire sectors, regional Non-Governmental Organizations (NGO’s), community based organizations, independent consultants, universities and research bodies in Southern Africa. The goal of SAFNet is to achieve more effective and appropriate fire management policies and practices in Southern Africa - through the use of remote sensing, GIS and other geospatial information technology. AFIS is currently being extended to participating SADC countries within the SADC Thematic Action of the AMESD project. Training of the SADC participating organisations will be offered through workshops to be held in South Africa in 2011 and beyond.
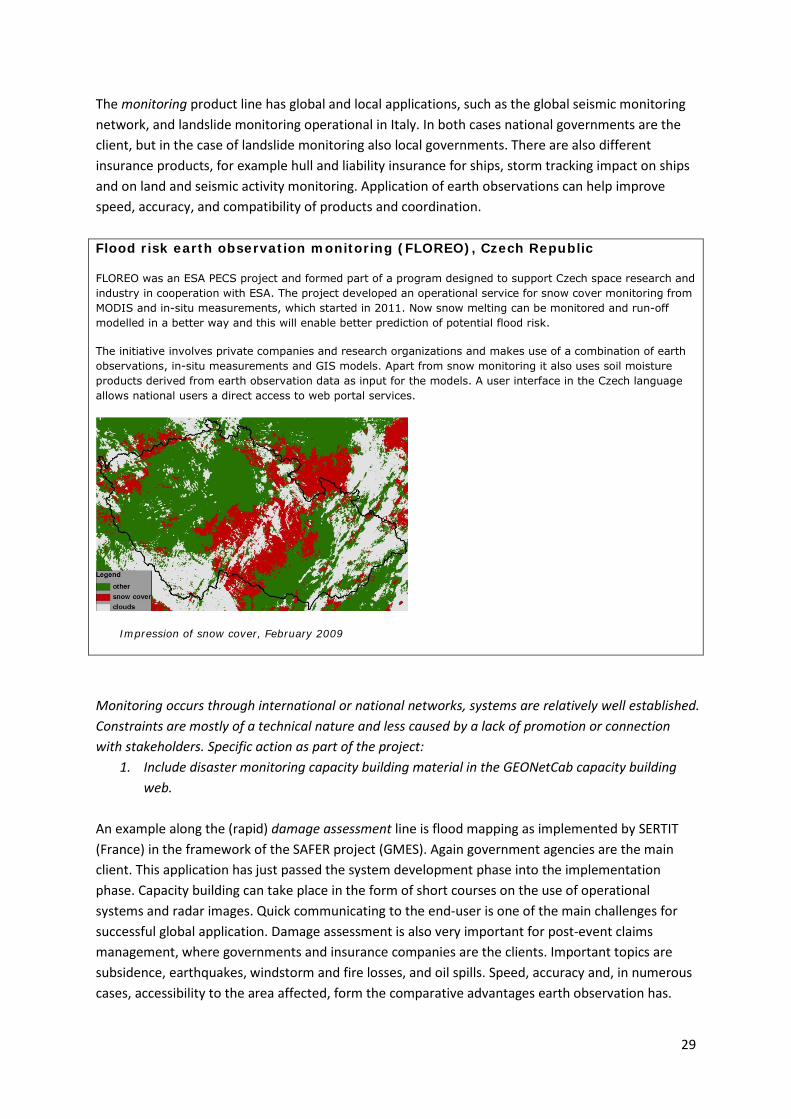
29
The monitoring product line has global and local applications, such as the global seismic monitoring network, and landslide monitoring operational in Italy. In both cases national governments are the client, but in the case of landslide monitoring also local governments. There are also different insurance products, for example hull and liability insurance for ships, storm tracking impact on ships and on land and seismic activity monitoring. Application of earth observations can help improve speed, accuracy, and compatibility of products and coordination. Flood risk earth observation monitoring (FLOREO), Czech Republic
FLOREO was an ESA PECS project and formed part of a program designed to support Czech space research and industry in cooperation with ESA. The project developed an operational service for snow cover monitoring from MODIS and in-situ measurements, which started in 2011. Now snow melting can be monitored and run-off modelled in a better way and this will enable better prediction of potential flood risk.
The initiative involves private companies and research organizations and makes use of a combination of earth observations, in-situ measurements and GIS models. Apart from snow monitoring it also uses soil moisture products derived from earth observation data as input for the models. A user interface in the Czech language allows national users a direct access to web portal services.
Impression of snow cover, February 2009
Monitoring occurs through international or national networks, systems are relatively well established. Constraints are mostly of a technical nature and less caused by a lack of promotion or connection with stakeholders. Specific action as part of the project:
1. Include disaster monitoring capacity building material in the GEONetCab capacity building web.
An example along the (rapid) damage assessment line is flood mapping as implemented by SERTIT (France) in the framework of the SAFER project (GMES). Again government agencies are the main client. This application has just passed the system development phase into the implementation phase. Capacity building can take place in the form of short courses on the use of operational systems and radar images. Quick communicating to the end-user is one of the main challenges for successful global application. Damage assessment is also very important for post-event claims management, where governments and insurance companies are the clients. Important topics are subsidence, earthquakes, windstorm and fire losses, and oil spills. Speed, accuracy and, in numerous cases, accessibility to the area affected, form the comparative advantages earth observation has.
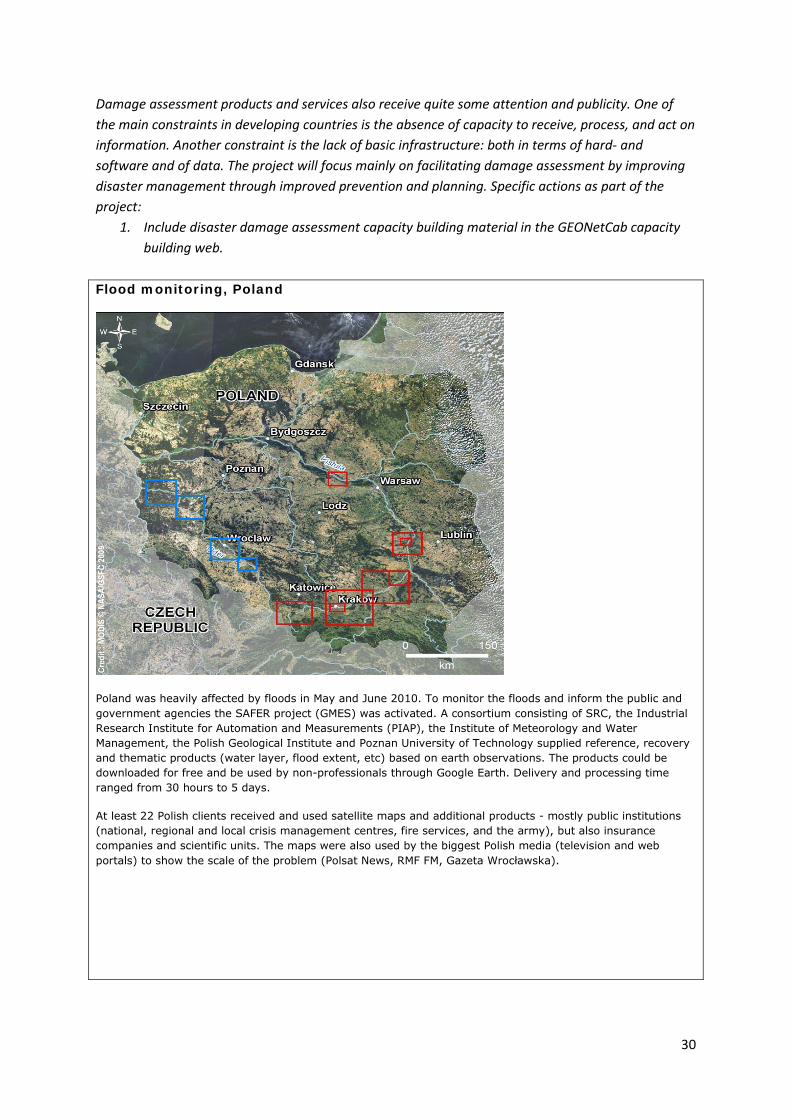
30
Damage assessment products and services also receive quite some attention and publicity. One of the main constraints in developing countries is the absence of capacity to receive, process, and act on information. Another constraint is the lack of basic infrastructure: both in terms of hard- and software and of data. The project will focus mainly on facilitating damage assessment by improving disaster management through improved prevention and planning. Specific actions as part of the project:
1. Include disaster damage assessment capacity building material in the GEONetCab capacity building web.
Flood monitoring, Poland
Poland was heavily affected by floods in May and June 2010. To monitor the floods and inform the public and government agencies the SAFER project (GMES) was activated. A consortium consisting of SRC, the Industrial Research Institute for Automation and Measurements (PIAP), the Institute of Meteorology and Water Management, the Polish Geological Institute and Poznan University of Technology supplied reference, recovery and thematic products (water layer, flood extent, etc) based on earth observations. The products could be downloaded for free and be used by non-professionals through Google Earth. Delivery and processing time ranged from 30 hours to 5 days.
At least 22 Polish clients received and used satellite maps and additional products - mostly public institutions (national, regional and local crisis management centres, fire services, and the army), but also insurance companies and scientific units. The maps were also used by the biggest Polish media (television and web portals) to show the scale of the problem (Polsat News, RMF FM, Gazeta Wrocławska).
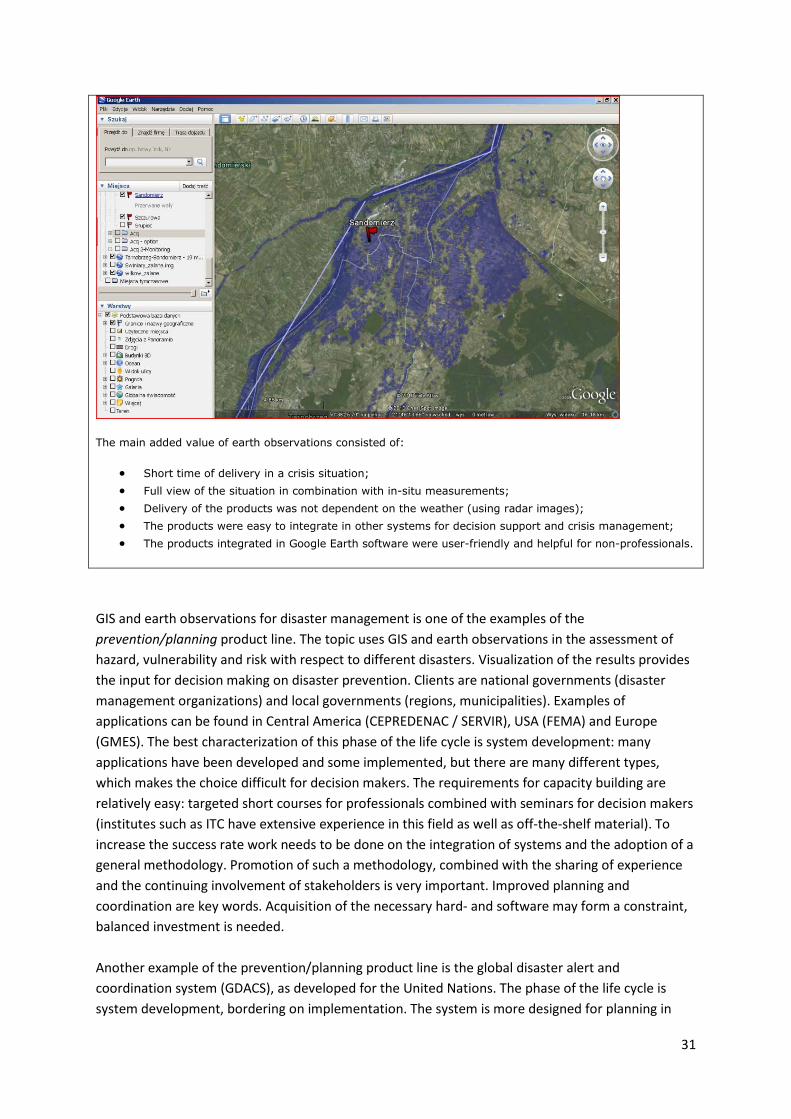
31
The main added value of earth observations consisted of:
• Short time of delivery in a crisis situation; • Full view of the situation in combination with in-situ measurements; • Delivery of the products was not dependent on the weather (using radar images); • The products were easy to integrate in other systems for decision support and crisis management; • The products integrated in Google Earth software were user-friendly and helpful for non-professionals.
GIS and earth observations for disaster management is one of the examples of the prevention/planning product line. The topic uses GIS and earth observations in the assessment of hazard, vulnerability and risk with respect to different disasters. Visualization of the results provides the input for decision making on disaster prevention. Clients are national governments (disaster management organizations) and local governments (regions, municipalities). Examples of applications can be found in Central America (CEPREDENAC / SERVIR), USA (FEMA) and Europe (GMES). The best characterization of this phase of the life cycle is system development: many applications have been developed and some implemented, but there are many different types, which makes the choice difficult for decision makers. The requirements for capacity building are relatively easy: targeted short courses for professionals combined with seminars for decision makers (institutes such as ITC have extensive experience in this field as well as off-the-shelf material). To increase the success rate work needs to be done on the integration of systems and the adoption of a general methodology. Promotion of such a methodology, combined with the sharing of experience and the continuing involvement of stakeholders is very important. Improved planning and coordination are key words. Acquisition of the necessary hard- and software may form a constraint, balanced investment is needed. Another example of the prevention/planning product line is the global disaster alert and coordination system (GDACS), as developed for the United Nations. The phase of the life cycle is system development, bordering on implementation. The system is more designed for planning in
32
emergencies than for prevention. Again the link with local end-users (information processors and decision makers) is crucial. The promotion of planning and prevention earth observation products and services will be one of the focal points of the project. It is possible to improve the current situation in developing countries with relatively simple means. Once this is achieved national and local authorities will also be better prepared for post-disaster events. Through dissemination of success stories and other promoting decision makers will be informed about the possibilities of spatial information for disaster prevention and planning. Specific actions as part of the project:
1. Include disaster prevention and planning capacity building material in the GEONetCab capacity building web.
2. Gather success stories as general promotion material for decision makers. 3. Elaborate specific case studies on the successful application of prevention and planning for
disasters by combining best practices of different countries/regions. There are some general aspects concerning disaster management that are not covered by a single product line. An example is the international charter which takes care of the free availability of satellite images directly after a disaster. The scale of the program is global and the clients are mainly governments and international organizations. The international charter has operated successfully for a number of years and definitely has increased the profile of earth observations. The related GEO task is DI-06-09 ‘use of satellites for disaster management’. Still, emphasis is on post-disaster intervention and if there is no processing capacity available in the country affected before the disaster (or if the infrastructure is destroyed during the disaster) the impact on mitigation in general is likely to be limited. A requirement is therefore to have processing capacity in place before a disaster strikes. Apart from building local capacity, customization and a direct link with disaster management organizations are important. The GEO Portal could play an important role here. Another initiative is the Global Risk Identification Program, with involvement of a number of important international actors, such as the World Bank, IADB, UNDP, USAID, etc. The program is directed at risk informers, disaster analysts and capacity developers and aims to provide better information and improve coordination. It is currently in the analysis and design phase. Additionally, there are initiatives that aim to bring the use of earth observation (and GIS) directly to communities and NGOs, such as the toolbox for community mapping for disaster management (in Mozambique, funded by Munich Re). Promotion of and capacity building in earth observation should connect with these activities to reach the actual end-users. Vice versa, examples such as the toolbox can be used to show the relevance of earth observation for disaster management to decision makers. The advantage of the use of earth observation in the general disaster management activities mentioned above is that it helps improve planning and coordination as well as compatibility between the systems and methods used. Specific actions as part of the project:
1. Gather examples of community mapping for disaster management for the GEONetCab capacity building web.
33
2. Liaise with coordinating initiatives for disasters, such as Provention and the GEO Geohazards community of practice to optimize the promoting to decision makers.
The insurance market for disasters of any kind deserves special mention, as here, apart from the advantages mentioned above, such as speed and accuracy, cost reduction is also an important factor in the application of earth observation. Activities in the risk assessment/simulation models and forecasting/early warning product lines are property risk mapping (subsidence, floods, general impact), forestry portfolio risk mapping (fire), agriculture loss forecasting and risk rating, urban exposure and vulnerability mapping. In the monitoring product line hull and liability insurance for ships, storm tracking (impact on land and ships) and seismic activity monitoring are examples. Damage assessment is of course very important in the form of post-event claims management for all types of disasters (subsidence, earthquake, windstorm, fire loss, oil spills). Clients are the big (re)insurance companies. Cross-over effects between the private and public sector are interesting, both in terms of sharing experiences and benefiting from capacity building opportunities. Specific action as part of the project:
1. Liaise with insurance providers for funding opportunities and sponsoring of capacity building activities in developing countries (also link with Agriculture SBA).
Health The health SBA consists of three different product/services categories: air quality forecasting/early warning/monitoring, epidemics forecasting, and relationships between diseases and environmental factors. The distinction between the second and third category is a bit arbitrary, as there is a clear link and overlap. The time/response factor plays a more prominent role in epidemics forecasting and through modelling and research the relationship between diseases and environmental factors may be made more explicit. Vice versa, there is feedback from research and modelling this relationship to epidemics forecasting. In Europe, Canada and the US municipalities and government agencies use air quality forecasts that are made public through the internet, sometimes complimented by a text message service or e-mail notification to inform and warn vulnerable citizens. The technology used is a combination of earth observation and in-situ measurements. Subjects are general air quality (index), ozone, NO2, particle pollution, UV and smoke from fires. An example from Europe is the GMES service element PROMOTE, an example from the US is AIRnow and from Canada it is the air quality forecasting by the Weather Office. These activities are in the (post-)implementation phase. In other regions of the world (for example India, Central America, South-East Asia, the Middle East and Kazakhstan) initiatives are being undertaken and are mainly in the system analysis phase. For capacity building and promotion it is important to use the successes of Europe and North America and adapt them to the local circumstances elsewhere. The availability or development of locally applicable air quality models is still a constraint. A special branch of air quality forecasting is sand / dust storm warning, paying special attention to related diseases such as meningitis. WMO is developing a sand and dust storm warning advisory
34
system (SDS-WAS) with a Northern Africa, Middle East and Europe node and an Asia node. The envisaged program has a capacity building component. A niche type of forecasting / prediction is safe sunning forecasting (prevention of skin cancer). An example is the HappySun initiative in Italy (offered by FlyBy), which provides information on UV, cloud coverage, ozone, sea surface temperature and transparency. The service is delivered via internet, with text messages to tourists and to hotels. An example of the epidemics forecasting category is the malaria early warning system (MEWS). The system is developed for the African region by NASA and Columbia University as part of FEWS NET (Famine Early Warning System). It consists of a combination of earth observations, weather forecasts, climate models and an analysis of long-term data records. Apart from through the web service FEWS NET, target organizations in Africa are also approached directly. The technical part of the system is in the implementation phase. Capacity building, in the form of short courses, is best directed towards increasing local processing capacity as well as the ‘last mile’ aspect (from warning to taking preventative measures on the ground). GEONETCast could play an important role here. The WHO is working on general early warning systems for diseases (not only malaria). The GEO-tasks relating to the air quality and epidemics forecasting categories are HE-09-01 ‘information systems for health’ and HE-09-02 ‘monitoring and prediction systems for health’. The third category is the relationship between diseases and environmental factors. Projects such as the MERIT-project (meningitis environmental risk information technologies) try to clarify this relationship (see also the sand and dust storm warning initiative). The project is directed at Africa with pilots in different countries and is supported by GEO-task HE-09-03 a). The activity is in the system analysis and design phase. Apart from these three categories there are general studies linking health and earth observations. Examples are the relation between population distribution and health (utilities and sewers), influence of agriculture on health (chemicals, fire (aerosols)), climate change and health and the effects of mining (contamination) on health. Also the analysis of existing earth observation databases is important, for instance for more in-depth research into the relation between land, water and health. The related GEO-task is HE-09-03 ‘end to end projects for health’.
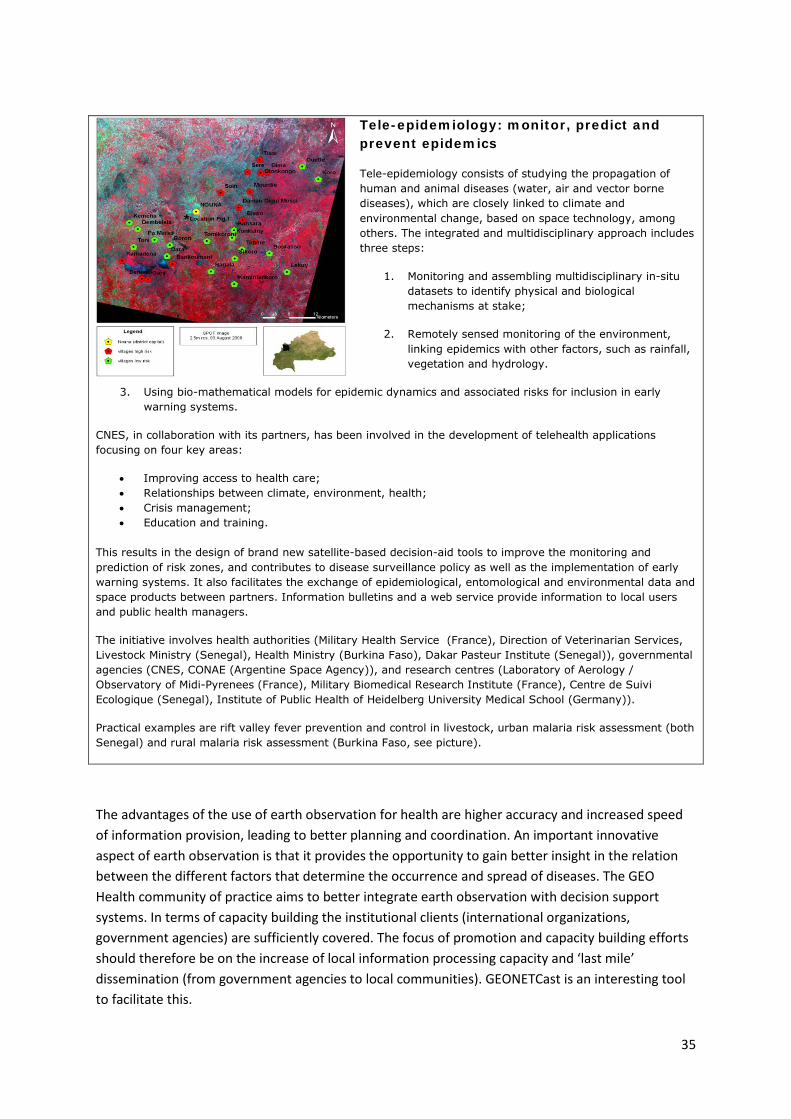
35
Tele-epidemiology: monitor, predict and prevent epidemics
Tele-epidemiology consists of studying the propagation of human and animal diseases (water, air and vector borne diseases), which are closely linked to climate and environmental change, based on space technology, among others. The integrated and multidisciplinary approach includes three steps:
1. Monitoring and assembling multidisciplinary in-situ datasets to identify physical and biological mechanisms at stake;
2. Remotely sensed monitoring of the environment, linking epidemics with other factors, such as rainfall, vegetation and hydrology.
3. Using bio-mathematical models for epidemic dynamics and associated risks for inclusion in early warning systems.
CNES, in collaboration with its partners, has been involved in the development of telehealth applications focusing on four key areas:
• Improving access to health care; • Relationships between climate, environment, health; • Crisis management; • Education and training.
This results in the design of brand new satellite-based decision-aid tools to improve the monitoring and prediction of risk zones, and contributes to disease surveillance policy as well as the implementation of early warning systems. It also facilitates the exchange of epidemiological, entomological and environmental data and space products between partners. Information bulletins and a web service provide information to local users and public health managers.
The initiative involves health authorities (Military Health Service (France), Direction of Veterinarian Services, Livestock Ministry (Senegal), Health Ministry (Burkina Faso), Dakar Pasteur Institute (Senegal)), governmental agencies (CNES, CONAE (Argentine Space Agency)), and research centres (Laboratory of Aerology / Observatory of Midi-Pyrenees (France), Military Biomedical Research Institute (France), Centre de Suivi Ecologique (Senegal), Institute of Public Health of Heidelberg University Medical School (Germany)).
Practical examples are rift valley fever prevention and control in livestock, urban malaria risk assessment (both Senegal) and rural malaria risk assessment (Burkina Faso, see picture).
The advantages of the use of earth observation for health are higher accuracy and increased speed of information provision, leading to better planning and coordination. An important innovative aspect of earth observation is that it provides the opportunity to gain better insight in the relation between the different factors that determine the occurrence and spread of diseases. The GEO Health community of practice aims to better integrate earth observation with decision support systems. In terms of capacity building the institutional clients (international organizations, government agencies) are sufficiently covered. The focus of promotion and capacity building efforts should therefore be on the increase of local information processing capacity and ‘last mile’ dissemination (from government agencies to local communities). GEONETCast is an interesting tool to facilitate this.
36
Specific actions as part of the project:
1. Include capacity building material on air quality forecasting, epidemics forecasting and the relationship between disease and environmental factors on the GEONetCab capacity building web.
2. Gather (potential) success stories about local applications in developing countries and investigate the possible role of GEONETCast.
3. Liaise with the GEO Health community of practice with the aim to acquire funding for further development of health applications.
Energy The products/services categories within the energy SBA are resource assessment for renewable energy, energy resources exploration support, pipeline monitoring and optimization of biofuel production (cross linked with Agriculture SBA). Then there are some niche markets (not implying they are unimportant or small), for instance sustainable building design (NASA satellite and modelled derived data for preliminary design of buildings and associated renewable-energy power systems) and prediction of damaging geomagnetically induced currents (GICs), important for power systems and pipelines. Another special subject is the effect of climate change on energy requirements (NASA’s mini-climate change assessment model (MiniCAM)). The activities within the energy SBA are generally targeted at specific well-defined customers, who are familiar with the benefits of earth observations. Economy of scale plays a role, i.e. clients are mostly large private or public corporations. Resource assessment for renewable energy deals with establishing the feasibility of locations. Examples are solar radiation information and wind volume forecasting. Through different projects (ENVISOLAR, Helioclim, MESoR, etc.) models (such as Heliosat (Mines Paristech / Armines)) for solar radiation are developed, based on MSG, GOES, IOCD and GMS data. Another example is NASA’s Surface meteorology and Solar Energy web-based service (SSE) in cooperation with RETScreen Canada. Clients are all parties interested in investing in renewable or cleaner energy, such as governments, utilities and private companies. Projects such as MESoR aim to make the products/services more user-friendly. As a result a web-based service has been set up; one of the objectives of the project was to contribute to the GEO/GEOSS common infrastructure. Other services include plant management and failure detection (where satellites are used for communication). The life cycle phases are currently prototype or implementation. Cooperation with international institutions such as World Bank and UN has also been established, as the UNEP SWERA initiative shows. Related datasets used for wind volume forecasting are often also used for the location of wind parks and optimization of operations. In off-shore situations, scatterometer, altimeter and SAR based data provide the input (wind, waves and tidal currents) and in onshore cases, terrain roughness and elevation are important. As there is a lot of interest in renewable energy, the products and markets are relatively well developed in regions, whichcan afford it. In emerging economies and developing countries there are a lot of opportunities and challenges, including capacity building. The related GEO-task is EN-07-01 ‘management of energy sources’.
37
An example of energy resources exploration support is the web-based geoinformation system as envisaged by the AEGOS (African European Georesources Observation System) project. The project deals with issues such as harmonizing and sharing of data and dissemination. The aim is to optimize the use of georesources, including oil, natural gas and coal in Africa. A more direct exploration example is the vibrosis method for oil exploration. Earth observation is used as a supporting tool in the seismographic survey. Of course earth observations play an important role in oil and gas exploration in general: as a support tool for geological interpretation and in the detection of hydrocarbon seepages. Systems for pipeline monitoring are investigated by, for example, the PIPEMON project. The main goals are to detect pipeline-related ground and structure motion (with SAR) and to plan routes for pipelines (with DEMs and interferometry). The advantages of earth observations over airborne data gathering (heli) consist of automated processing, availability of data archives (change detection), rapid subsidence detection (if the circumstances permit) and integration and availability of a lot of support data (for route planning). Pipelines are critical infrastructure, and consequently safety concerns play a role. Contacts with the end-user community are well established; cost is the factor, which determines if earth observation is used. Whether cost-effective solutions are on offer at the moment is not clear. Optimization of biofuel production is related to both the Energy and the Agriculture SBA and a special type of crop yield monitoring. USDA-ARS is developing models for corn-based ethanol production. As biofuel production will become more and more important, the service is mentioned as a separate category under Energy. Promotion and capacity building will have the same requirements as those of crop yield monitoring. For the Energy SBA earth observations provide comparative advantages in accuracy, cost reduction or revenue increase, planning, and innovation. In general, the clients and end-users in the energy sector are well aware of the products and services (being) developed and on offer. A number of applications still needs further improvement to reach the implementation phase. GEO-tasks EN-07-01 ‘management of energy sources’, EN-07-02 ‘energy environmental impact monitoring’, EN-07-03 ‘energy policy planning’ and the Energy community of practice aim to facilitate this. In regions where development of new markets for renewable energy is interesting, the advantages of the application of earth observation are not that well known. Promotion and capacity building within the framework of GEO should therefore concentrate on a transfer of experience and capabilities to these new markets (and raise further interest at international organizations with a mandate towards development). Capacity building can take place in the form of short courses, if sufficient basic capacity is available. The GEONetCab project will focus on the first two products/services categories (resource assessment for renewable energy and energy resources exploration support) and not on the last two. Pipeline monitoring is a very specific application and, as indicated above, clients are generally well aware of the options and feasibility. Optimization of biofuel production is taken up as part of the crop yield monitoring products/services category in the Agriculture SBA. Specific actions as part of the project:
38
1. Include capacity building material on resource assessment for renewable energy and energy resource exploration support on the GEONetCab capacity building web.
2. Gather success stories on resource assessment for renewable energy and energy resource exploration support that are replicable in new markets, in cooperation with the GEO Energy community of practice.
3. Promote resource assessment for renewable energy and energy resources exploration support to decision makers and to international organizations with a mandate in this field.
Climate The product/services categories of the Climate SBA are monitoring and modelling, carbon accounting schemes, and prediction and mitigation of effects. Monitoring and modelling is a very broad category, the issues generally dealt with are greenhouse gases, the arctic environment, oceans, agriculture and weather. Climate monitoring and modelling is the prime task of the WCRP (World Climate Research Program) and the IPCC (International Panel on Climate Change). WCRP cooperates with the IGBP (International Geosphere-Biosphere Program) in the ESSP (Earth System Science Partnership). Then there is GCOS (Global Climate Observation System) with the ECV (Essential Climate Variables) studies. All these initiatives are aimed at a better understanding of the climate change process and make use of earth observations for this general purpose. Consequently, they are all linked to GEO. Programs such as START (global change SysTem for Analysis, Research and Training) provide capacity building. CL-06-01 ‘a climate record for assessing variability and change’ is the related GEO-task. Because the issue of climate change is so complex and there is a huge need for additional data, the research community focuses on the development of better and more refined models. The research community is well established and climate change is an important issue on the international agenda. The non-research end-user community is primarily interested in the relationship between forecasting and planning: how can national, regional and local governments prepare for future scenarios? Earth observation has firmly established its role in the climate studies of the research community, but in terms of reaching (local) decision makers there is still a lot of work to do. Below, the monitoring and modelling applications are described shortly, after which the attention shifts to issues of more relevance to decision makers, such as carbon accounting schemes, and forecasting and predicting the effects of climate change10
.
Greenhouse gases have been monitored for quite a number of years through NASA’s EOS-system. Japan launched the world’s first greenhouse gas monitoring satellite (GOSAT / Ibuki) in 200911
10 This is not a general priority setting, just an indication of the focus of this particular project.
. Optical, thermal and short wave infrared sensors check the density of carbon dioxide and methane. This complements ground measurements and provides data on areas where no ground network is available. Another example is the GMES GSE PROMOTE project for Europe. This service is in the system development phase. Yet another example is the CNES/NASA/ESA CALIPSO sensor (as part of
11 Unfortunately the launch with NASA’s OCO sensor failed in 2009.
39
the A-train) that makes use of LIDAR. Ozone studies are usually closely connected to the monitoring of greenhouse gases (example: SPARC (stratospheric processes and their role in the climate)). The cryosphere is monitored through a series of sensors (optical, radar, laser, etc.) to measure temperature differences, change detection, ice fluctuation, ice cap melting, velocity of ice movement and subsidence. Programs such as CliC (Climate and Cryosphere project, WCRP), CryoClim (ESA / Norway) and arctic monitoring with RADARSAT-2 (CSA) are examples. Other activities with earth observation applications concern permafrost and glacier monitoring. Ocean monitoring and modelling in relation to climate change focuses on sea-level rise and the effects of global warming on marine ecology. Examples are the sea-level rise projections of WCRP and the ocean surface topography initiatives of a number of space agencies. Earth observations (altimeters and gravity field measurements (JASON, GRACE) are complemented by tide gauge measurements, for example the argo floats. In addition the effects on marine ecology can be measured with sensors such as SMOS (soil moisture and ocean salinity). Another example is the determination of the effect of increased acidity on coral reefs (mapped with the aid of bathymetry (SeaWIFS) and multispectral images (Landsat)). Examples of monitoring and modelling the effects of climate change on agriculture are the CLIVAR and GEWEX initiatives of WCRP. CLIVAR concentrates on seasonal predictions for agriculture (monsoon land areas) and GEWEX (global energy and water cycle experiment) on the hydrological cycle and energy fluxes, with special attention paid to the effects of droughts on soil moisture and vegetation. Both efforts are a combination of research and coordination programs. Monsoon predictions and forecasts are an example of weather monitoring and modelling, in which both CLIVAR and GEWEX are involved. Another example is the GPCC (global precipitation climate centre) offering free access to precipitation data and models. The WCRP initiative SPARC, already mentioned above, provides a combination of numerical weather prediction and climate change studies. The already mentioned argo floats are also a valuable source for gathering weather data and modelling. The ECV studies address specific aspects of the topics mentioned above. The Integrated modelling using the ECVs and earth observations results from the ‘state of the climate’ initiative of NASA and WMO. On a regional level there are different integrated modelling initiatives on ecohydrological fluxes (example: HydroKorea and CarboKorea, integrated in CarboEastAsia and AsiaFlux). These in turn are part of FLUXNET, a global network of data from micrometeorological towers (a valuable combination with earth observations). Another example is the climate atlas for Africa (including greenhouse gases and dust). All the monitoring and modelling has to be translated into the prediction and mitigation of the effects of climate change. As a mitigation measure carbon accounting schemes12
12 Carbon emissions resulting from (underground) coal fires are substantial, but not included in current carbon accounting schemes. Earth observations play an important role in the detection and monitoring of coal fires.
have been established. REDD (or REDD+), reduced deforestation and forest degradation, forms an example
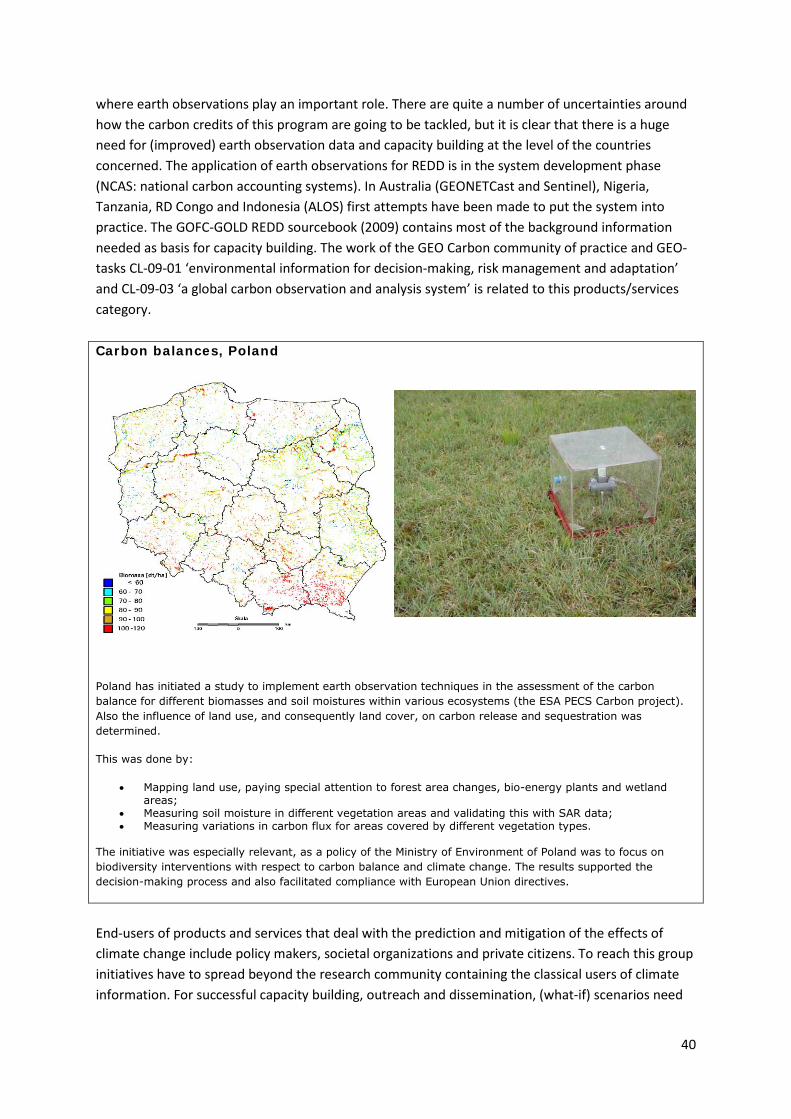
40
where earth observations play an important role. There are quite a number of uncertainties around how the carbon credits of this program are going to be tackled, but it is clear that there is a huge need for (improved) earth observation data and capacity building at the level of the countries concerned. The application of earth observations for REDD is in the system development phase (NCAS: national carbon accounting systems). In Australia (GEONETCast and Sentinel), Nigeria, Tanzania, RD Congo and Indonesia (ALOS) first attempts have been made to put the system into practice. The GOFC-GOLD REDD sourcebook (2009) contains most of the background information needed as basis for capacity building. The work of the GEO Carbon community of practice and GEO-tasks CL-09-01 ‘environmental information for decision-making, risk management and adaptation’ and CL-09-03 ‘a global carbon observation and analysis system’ is related to this products/services category. Carbon balances, Poland
Poland has initiated a study to implement earth observation techniques in the assessment of the carbon balance for different biomasses and soil moistures within various ecosystems (the ESA PECS Carbon project). Also the influence of land use, and consequently land cover, on carbon release and sequestration was determined.
This was done by:
• Mapping land use, paying special attention to forest area changes, bio-energy plants and wetland areas;
• Measuring soil moisture in different vegetation areas and validating this with SAR data; • Measuring variations in carbon flux for areas covered by different vegetation types.
The initiative was especially relevant, as a policy of the Ministry of Environment of Poland was to focus on biodiversity interventions with respect to carbon balance and climate change. The results supported the decision-making process and also facilitated compliance with European Union directives.
End-users of products and services that deal with the prediction and mitigation of the effects of climate change include policy makers, societal organizations and private citizens. To reach this group initiatives have to spread beyond the research community containing the classical users of climate information. For successful capacity building, outreach and dissemination, (what-if) scenarios need
41
to be realistic, reliable and easy to understand for non-specialists. Earth observation provides added value, not only in terms of data provision and analysis, but also as a visualization tool. Paradoxically, this will also make the value earth observation has for researchers obvious to non-scientific end-users. There seems to be a consensus among end-users that something needs to be done, but the question remains: ‘what and how?’. Both climate models and capacity building efforts have not been able to provide answers to date, perhaps justifiably so. The comparative advantages earth observation provides in terms of accuracy, planning and coordination, need to be translated from climate modelling and monitoring to adaptation and mitigation. There are a number of studies by local and regional authorities in developed countries (for example in coastal Australia, and in water utilities, USA) and general initiatives in developing countries, an example of the latter being ClimDev Africa. The UN-system also has its focus on increasing the capacity of national meteorological services (NMS) to create better understanding of local processes and, consequently, more effective adaptation. Examples of an integrated approach to adaptation are the ‘roadmap for responding to climate change’ of the US Forest Service and ‘integrating agriculture, forestry and other land use in future climate regimes’ of the Netherlands environmental assessment agency. Earth observations play an important role in both initiatives. However, in most developing countries and emerging economies, a gap exists between capacity building and dissemination towards end-users (the activity is in the system analysis and design phase). Local authorities and interest groups are definitely interested: possible topics are the effect of climate change on agriculture, changes in ecosystems caused by a combination of climate change and urbanization, coastal vulnerability and health risks associated with climate change, to mention a few. The GEONetCab project needs to address this gap. The aim is to gather information about existing studies and the role earth observation plays, and integrate this into the project’s capacity building portfolio and dissemination material. Specific actions as part of the project:
1. Include capacity building material on climate monitoring and modelling, carbon accounting schemes and the prediction and mitigation of the effects of climate change on the GEONetCab capacity building web.
2. Identify outcomes of climate monitoring and modelling that yield results sufficiently robust for scenarios on prediction and mitigation, and for carbon accounting schemes in cooperation with the GEO Carbon community of practice.
3. Use successful applications, such as practical studies into prediction and mitigation of the effects of climate change, to promote the use of earth observation with policy and decision makers in new markets.
Water The earth observation products/services categories for the water SBA are: ocean topography, temperature and currents, ocean water quality & chlorophyll (cross linked with Agriculture SBA (fishery)), drought monitoring/early warning (cross linked with Disaster SBA), hydrologic information systems (including agrometeorology) (cross linked with Agriculture and Disaster SBA), soil-moisture modelling (cross linked with Agriculture SBA) and monsoon monitoring/forecasting.
42
Ocean topography, temperature and currents are measured by an array of satellite sensors, in combination with networks that provide in-situ measurements (Argo, drifting buoys, tidal gauges, etc.). The role of earth observation is well established and improved by coordination efforts such as GODAE (global ocean data assimilation experiment). Modelling systems and forecasts have also matured; products and services are therefore in the implementation stage. There is a well defined group of clients, who in general are well aware of the products on offer, and the advantages and possibilities earth observation presents. As the time-series of earth observation increases models and forecasting are improving. Examples of clients are:
- Offshore industry: winds, waves and offshore soil conditions (also commercial providers), risk management (storms (winds and generated waves)), seismic data;
- Tourism: beach sediment forecasting; - Environmental management: forecasting; - General maritime: marine safety, iceberg prediction, ship routing, search and rescue (drift
calculation), marine pollution (oil spills), tropical cyclone forecasting (linked to Disaster SBA); - Specific navy applications: acoustic (sonar prediction), current velocity predictions, forecast
near-shore wave environment, diver operation safety, radar performance; - General: operational ((near) real-time) and seasonal forecasting, prediction of extreme
events). Issues that merit further research are: climate change models, improvement of modelling and forecasting, strategic policy support, real-time forecasting near-shore / coastal waters, ecosystem modelling. Ocean colour products and services are in general delivered by the same community of providers mentioned above. Governments and the fishery industry are both important clients. One product line concentrates on the relationship between environmental factors, such as plankton and commercial opportunities for fishing, another product line deals with harmful algal blooms. More strategically the product aims are sustainable fishery (fishing management maps), ecosystem modelling and change prediction. Networks such as ChloroGIN focus on coordination, planning, capacity building and outreach. ChloroGIN is a global network, but it also has regional components/networks. GEONETCast may be used for capacity building purposes, for example in EAMNET (European African marine network). EAMNET is related to the DevCoCast project focusing on GEONETCast applications. GMES Marine Core Services, with its MyOcean project, is an example of an attempt at providing an all-inclusive ocean service. MyOcean offers free data on global oceans and European seas. It also provides access to catalogues on sea level, ocean colour, sea surface temperature, sea ice and wind (in a combination of earth observations and in-situ data). Another example is the Africa marine atlas, a result of the efforts of ODINAfrica. UNEP is responsible for maintaining the atlas and a needs assessment for African countries has been carried out. PI-GOOS (Pacific Islands global ocean observation system (part of GOOS)) forms another example. The initiative does not only aim to build oceanographic observation systems, but also to improve regional coordination and support, with special attention being paid to building capacity and education in the Pacific region (cross linked with Climate and Disasters SBAs). The above shows that oceanic earth observation products and services are relatively well-developed and that, although there is always room for improvement, the focus of capacity building should be on end-users in less developed countries, to enable them to make full
43
use of the products and services that are usually offered for free or at low cost. Present-day clients of these products and services are familiar with them and have usually also been involved in their development. They recognize the advantages of the use of earth observations, which lie in greater speed and accuracy and better planning and coordination. Promotion should therefore concentrate on, again, the adaptation of applications for use in less-developed countries. Specific actions as part of the project:
1. Include capacity building material on ocean topography, temperature and currents and ocean colour on the GEONetCab capacity building web.
2. Investigate whether current initiatives cover the introduction of earth observation for ocean topography, temperature, currents and ocean colour, sufficiently in developing countries and emerging economies.
3. If not, use success stories to market ocean products and services to potential clients. Drought monitoring/early warning is the first of the ‘terrestrial’ water SBA products and services categories. Of course, there is a direct crosslink with the Disaster SBA. Examples of systems that are operational are Canada’s NAIS (national agriculture information system (of AAFC)) and USA’s NIDIS (national integrated drought information service). Both systems are interrelated and apart from drought monitoring/early warning, the ultimate goal is climate resilience. Earth observations (NDVI and other parameters) play an important role. Monitoring and forecasting results are delivered to the public (free of charge) through a web service. On a global scale, WMO is the organization responsible for drought monitoring and early warning. Some regional examples to be mentioned are in: China (Beijing Climate Centre), South Africa (South African Weather Service) and Australia (National Agricultural Monitoring System). The related GEO-task is WA-06-02 ‘droughts, floods and water resources management’. Typical clients are: governments, the agricultural sector, the inland shipping sector, the recreation/tourism sector, environmental organizations (depending on type of drought). The examples show that the services offered are in the implementation phase and that contact with clients is well established. Earth observation allows these systems to operate with greater accuracy and speed. Promotion and capacity building should therefore focus on the dissemination of successful operations and experiences to regions where these systems are much needed, but not yet implemented. Specific actions as part of the project:
1. Include capacity building material on drought monitoring and early warning on the GEONetCab capacity building web.
2. Investigate whether current initiatives cover the introduction of earth observation for drought monitoring and early warning in developing countries and emerging economies sufficiently.
3. If not, use success stories to market drought monitoring and early warning products and services to potential clients.
The subject of hydrologic information systems is another products/services category linked to the Climate, Agriculture and Disaster SBAs. An example of improved coordination and planning, with the contribution of earth observation, is the global run-off data centre (GRDC), under the auspices of WMO and supported by Germany, which aims to gather and distribute data concerning the
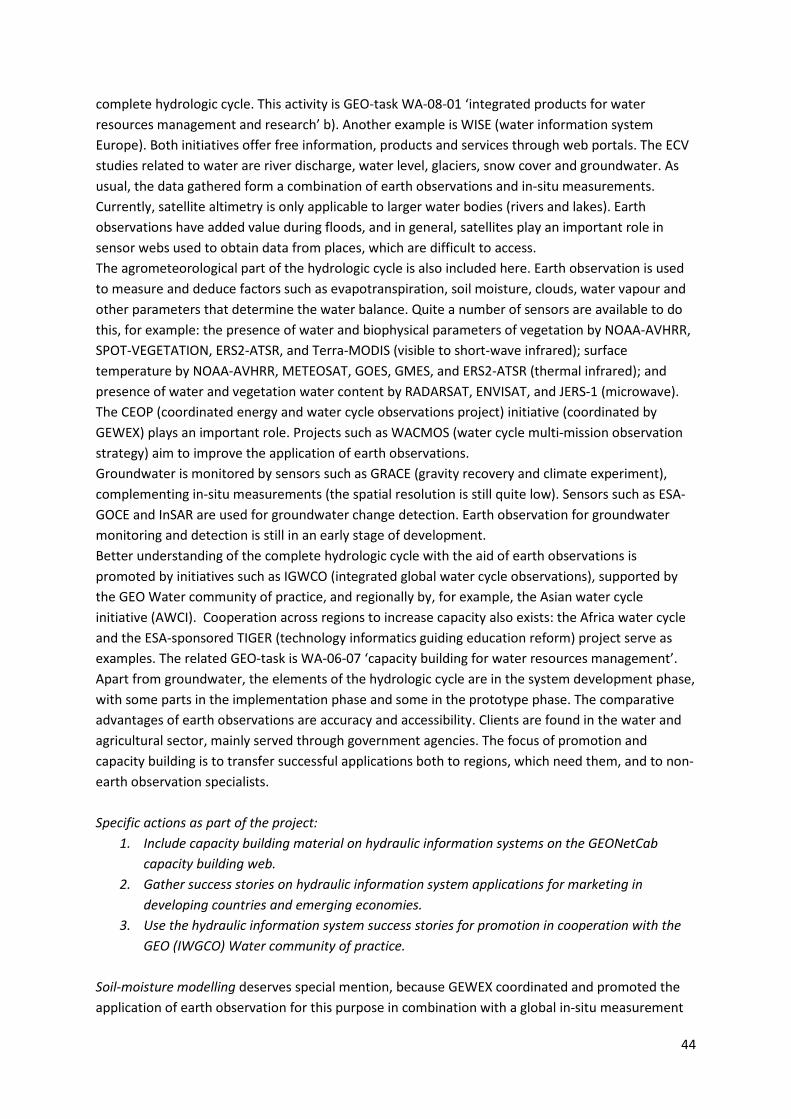
44
complete hydrologic cycle. This activity is GEO-task WA-08-01 ‘integrated products for water resources management and research’ b). Another example is WISE (water information system Europe). Both initiatives offer free information, products and services through web portals. The ECV studies related to water are river discharge, water level, glaciers, snow cover and groundwater. As usual, the data gathered form a combination of earth observations and in-situ measurements. Currently, satellite altimetry is only applicable to larger water bodies (rivers and lakes). Earth observations have added value during floods, and in general, satellites play an important role in sensor webs used to obtain data from places, which are difficult to access. The agrometeorological part of the hydrologic cycle is also included here. Earth observation is used to measure and deduce factors such as evapotranspiration, soil moisture, clouds, water vapour and other parameters that determine the water balance. Quite a number of sensors are available to do this, for example: the presence of water and biophysical parameters of vegetation by NOAA-AVHRR, SPOT-VEGETATION, ERS2-ATSR, and Terra-MODIS (visible to short-wave infrared); surface temperature by NOAA-AVHRR, METEOSAT, GOES, GMES, and ERS2-ATSR (thermal infrared); and presence of water and vegetation water content by RADARSAT, ENVISAT, and JERS-1 (microwave). The CEOP (coordinated energy and water cycle observations project) initiative (coordinated by GEWEX) plays an important role. Projects such as WACMOS (water cycle multi-mission observation strategy) aim to improve the application of earth observations. Groundwater is monitored by sensors such as GRACE (gravity recovery and climate experiment), complementing in-situ measurements (the spatial resolution is still quite low). Sensors such as ESA-GOCE and InSAR are used for groundwater change detection. Earth observation for groundwater monitoring and detection is still in an early stage of development. Better understanding of the complete hydrologic cycle with the aid of earth observations is promoted by initiatives such as IGWCO (integrated global water cycle observations), supported by the GEO Water community of practice, and regionally by, for example, the Asian water cycle initiative (AWCI). Cooperation across regions to increase capacity also exists: the Africa water cycle and the ESA-sponsored TIGER (technology informatics guiding education reform) project serve as examples. The related GEO-task is WA-06-07 ‘capacity building for water resources management’. Apart from groundwater, the elements of the hydrologic cycle are in the system development phase, with some parts in the implementation phase and some in the prototype phase. The comparative advantages of earth observations are accuracy and accessibility. Clients are found in the water and agricultural sector, mainly served through government agencies. The focus of promotion and capacity building is to transfer successful applications both to regions, which need them, and to non-earth observation specialists. Specific actions as part of the project:
1. Include capacity building material on hydraulic information systems on the GEONetCab capacity building web.
2. Gather success stories on hydraulic information system applications for marketing in developing countries and emerging economies.
3. Use the hydraulic information system success stories for promotion in cooperation with the GEO (IWGCO) Water community of practice.
Soil-moisture modelling deserves special mention, because GEWEX coordinated and promoted the application of earth observation for this purpose in combination with a global in-situ measurement
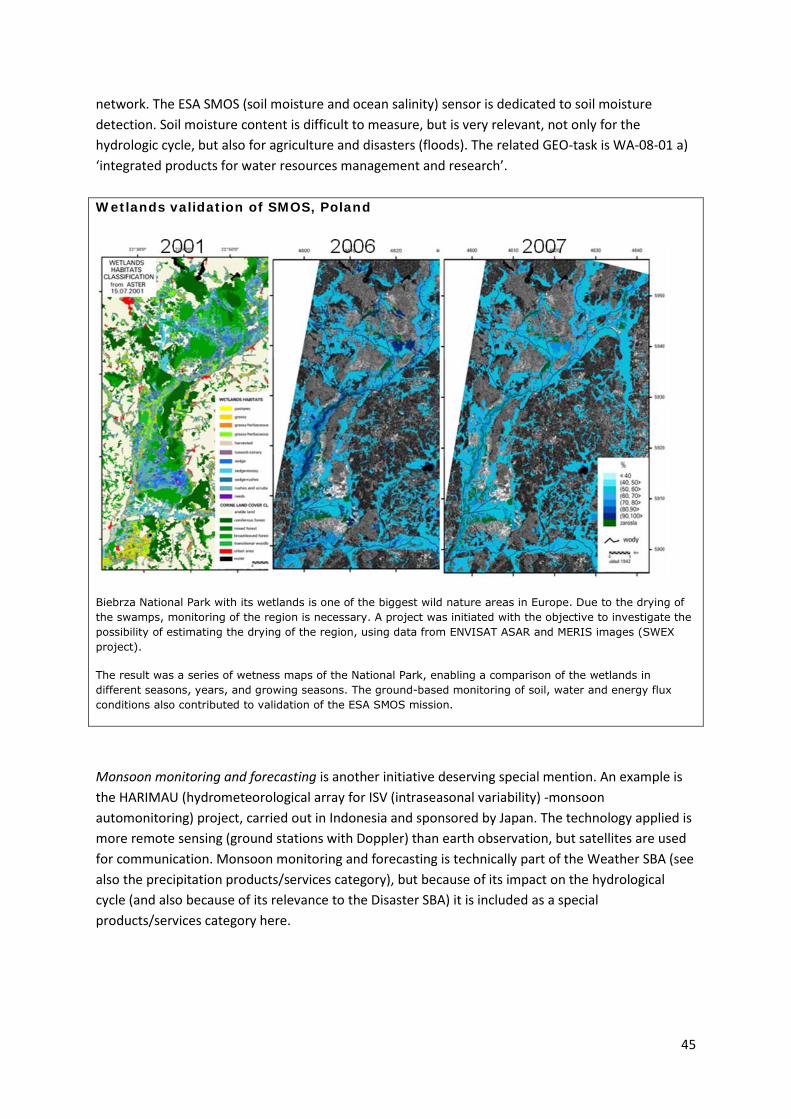
45
network. The ESA SMOS (soil moisture and ocean salinity) sensor is dedicated to soil moisture detection. Soil moisture content is difficult to measure, but is very relevant, not only for the hydrologic cycle, but also for agriculture and disasters (floods). The related GEO-task is WA-08-01 a) ‘integrated products for water resources management and research’. Wetlands validation of SMOS, Poland
Biebrza National Park with its wetlands is one of the biggest wild nature areas in Europe. Due to the drying of the swamps, monitoring of the region is necessary. A project was initiated with the objective to investigate the possibility of estimating the drying of the region, using data from ENVISAT ASAR and MERIS images (SWEX project).
The result was a series of wetness maps of the National Park, enabling a comparison of the wetlands in different seasons, years, and growing seasons. The ground-based monitoring of soil, water and energy flux conditions also contributed to validation of the ESA SMOS mission.
Monsoon monitoring and forecasting is another initiative deserving special mention. An example is the HARIMAU (hydrometeorological array for ISV (intraseasonal variability) -monsoon automonitoring) project, carried out in Indonesia and sponsored by Japan. The technology applied is more remote sensing (ground stations with Doppler) than earth observation, but satellites are used for communication. Monsoon monitoring and forecasting is technically part of the Weather SBA (see also the precipitation products/services category), but because of its impact on the hydrological cycle (and also because of its relevance to the Disaster SBA) it is included as a special products/services category here.
46
Weather The products/services categories of the Weather SBA are: forecasting global/local; precipitation monitoring/forecasting (cross linked with Agriculture SBA); and sand/dust storm forecasting (cross linked with Health SBA). A key initiative for the global and local weather forecasting category is TIGGE (the THORPEX interactive grand global ensemble). THORPEX stands for ‘the observing research and predictability experiment’ and is part of WMO’s WWRP (world weather research program). Although directed at high impact weather, the initiative, including the operational system GIFS (global interactive forecast system), is an example of international coordination and standardization. The aims of improved modelling, data assimilation (and reanalysis), and outreaching to user groups are very much in line with the GEO objectives. Earth observations are useful in achieving these aims. The initiative is superimposed on all kinds of national initiatives of weather forecasting, which also benefit from earth observation applications. A special branch is ocean weather forecasting, as produced by MyOcean or by DMI (Danish meteorological institute). GEO task WE-06-03 deals with TIGGE: ‘TIGGE and the development of a global interactive forecasting system’. One of the goals of the task is to engage with the user community. The other Weather GEO-task deals with capacity building: ‘capacity building for high-impact weather prediction’ (WE-09-01). Downstream, GEONETCast aims to provide the end-user at minimal cost. Through its global coverage GEONETCast is able to deliver free data and dissemination products on weather and the environment, while solving the limited-bandwidth problem. Institutes such as ITC have developed a free software toolbox to process the data (for example MODIS-fire, MSG and other Meteosat products and SPOT VEGETATION) and projects such as DevCoCast are developing different applications in and for developing countries. The different products and services developed for and from GEONETCast, including the training channel, are still in the prototyping or system development phase. The above shows that the activities in this category operate like a two-edged sword: on the one hand research is done to improve, already state-of-the-art, weather forecasting, on the other hand a methodology for worldwide data exchange and outreach is developed. Together with other initiatives GEONETCast can become a powerful tool reaching a whole new group of users and with potential for dissemination and capacity building purposes serving all SBAs. In the global and local weather forecasting products and services category links with user groups and capacity building are well established. The GEONetCab project therefore focuses on potential applications of GEONETCast for weather forecasting. Specific actions as part of the project:
1. Include capacity building material on global and local weather forecasting on the GEONetCab capacity building web.
2. Gather success stories on applications of GEONETCast on weather forecasting for marketing in developing countries and emerging economies.
47
GEONETCast - low cost access to EO products, services and satellite data: practical opportunities for capacity building
GEONETCast is a near real-time, global network of satellite-based data dissemination systems designed to distribute space-based, air-borne and in situ data, metadata and products to diverse communities. GEONETCast is a Task in the GEO Work Plan and is led by EUMETSAT, the United States, China, and the World Meteorological Organization (WMO). Many GEO Members and Participating Organizations contribute to this Task. Currently, GEONETCast applications are available for all Societal Benefit Areas. Prime application areas are weather, water and disasters.
GEONETCast is a low cost dissemination system with as additional advantage that it can be used in areas without fast and reliable Internet services, conditions that prevail in many countries in Africa. The system is already well anchored in the meteorological community.
Processing tools are needed to exploit the full potential of GEONETCast for use by non-meteorological organizations. Several initiatives are aiming to sustain the development of more applications. One example is the GEONETCast toolbox developed at ITC, which builds on EUMETSAT software and enables users to import data into ILWIS GIS for further analysis. ILWIS is open source GIS software under GPL license available at 52north (http://52north.org/). At this site the GEONETCast toolbox can also be downloaded. The number of downloads of the toolbox by interested users is steadily growing. The GEONETCast applications based on the toolbox require little resources while all knowledge to customize applications to local needs is accessible online at no further cost.
As a result, a new community is emerging, promoting the use of free near real-time environmental and earth observation data (in-situ, airborne and space based) and derived products for worldwide use. Using inexpensive, off-the-shelf equipment, the data can be directly received from communication satellites. This capability, in conjunction with data from freely accessible archives, provides the possibility to obtain a multitude of environmental and earth observation related data. This information is highly relevant for various application domains such as weather, atmosphere, oceans, land, vegetation, water and environment.
To allow the user community to grow spontaneously into an open network, anyone can join, using their own resources to set up the system, and acquiring knowledge how to install and to operate the system and to set up specific applications. A distance education system, with online tutorials, manuals, and exchange platforms, is available, enabling anyone with a basic knowledge of EO to engage in setting up a receiving station and start applications.
In the precipitation monitoring and forecasting category the planned mission Megha-Tropiques (cooperation between CNES and ISRO) serves as an example. Better data acquisition and analysis of the thermal exchange between the oceans and the atmosphere in the tropics will result in improved forecasts of hurricanes and monsoons, and consequently also of floods and droughts. Another example is the global precipitation monitoring initiative that aims to help understand processes
48
better, to improve coverage (global) and temporal sampling, thus leading to more refined models and better forecasts. These initiatives are still in the system analysis and design phase, but in general precipitation monitoring and forecasting are operational and technology transfer is therefore important. Capacity building for high impact weather prediction is a GEO task (WE-09-01) aimed at the national meteorological and hydrological services in developing countries within the framework of THORPEX. An activity dedicated to Africa is the forecasters’ handbook project within the framework of AMMA (African monsoon multidisciplinary analysis). The direct client of the two products and services categories mentioned above is the meteorological user community itself, the indirect client is the society at large. Promotion of the benefit of earth observations should be aimed at government agencies responsible for the sectors where added value is obtained through earth observation: agriculture, health, transport, civil defence, etc. Specific actions as part of the project:
1. Include capacity building material on precipitation monitoring and forecasting, including monsoon monitoring and forecasting, on the GEONetCab capacity building web.
2. Gather success stories on applications of GEONETCast for precipitation monitoring and forecasting for marketing in developing countries and emerging economies.
Sand and dust storm forecasts are another category of the weather SBA. The activity is described under the Health SBA with SDS-WAS as an example. The related GEO task is HE-09-02 (monitoring and prediction systems for health), subtask a): aerosol impacts on health and environment. Ecosystems The Ecosystems SBA deals with mapping and monitoring, both at a global scale (international treaties) and a local scale (for example: protective measures by a municipality). The products/services categories of the Ecosystems SBA are: marine and coastal ecosystems (global/regional), terrestrial and freshwater ecosystems (global/regional), biogeophysical variables (vegetation, soil, radiation, water cycle) (cross linked with Water and Agriculture SBA) and local applications, such as protected areas. All subjects are also related to the Biodiversity SBA. The distinctive features of the biogeophysical variables category and the local applications category are, respectively, the technical angle of approach and the scale and type of intervention. Both have consequences for the (envisaged) clients groups, as will be outlined below. Global and regional ecosystem mapping and monitoring spends a lot of energy on international coordination, in order to obtain consistency in modelling and denomination. Again, the challenge for the Ecosystem SBA is to make the step from analysis to planning and decision making for/by the end-user, mainly governments and environmental organizations (but also the perception of the general public plays an important role).
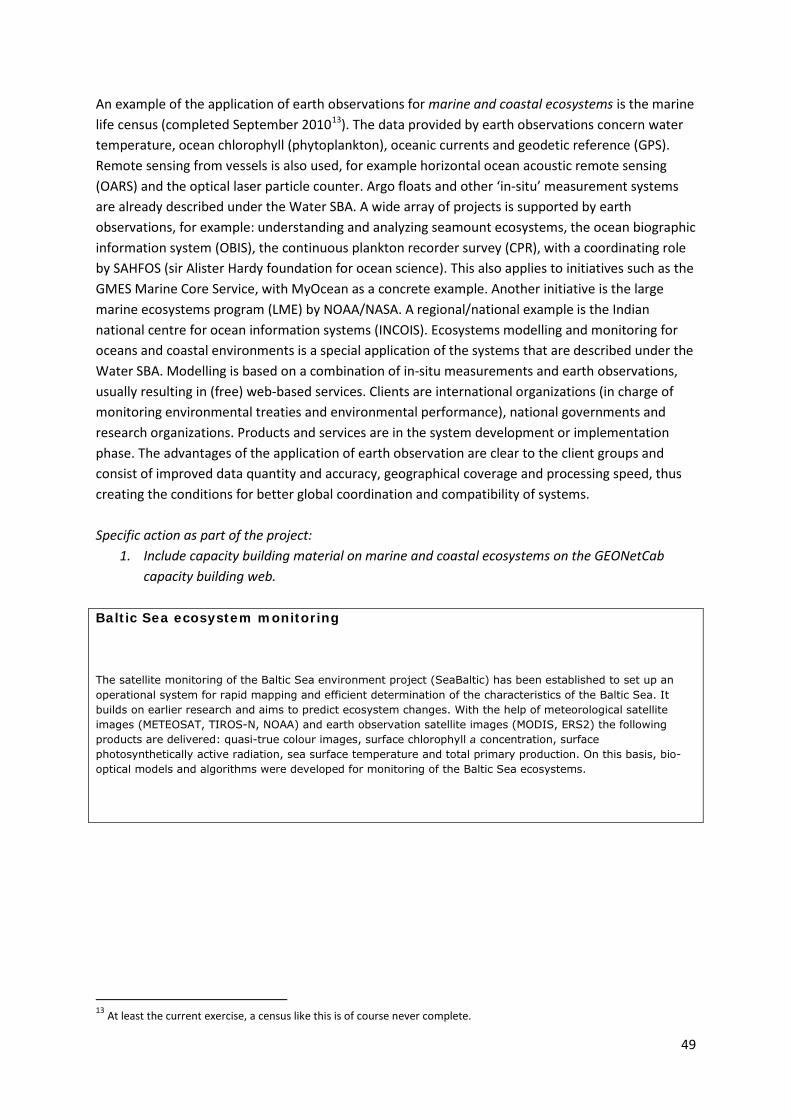
49
An example of the application of earth observations for marine and coastal ecosystems is the marine life census (completed September 201013
). The data provided by earth observations concern water temperature, ocean chlorophyll (phytoplankton), oceanic currents and geodetic reference (GPS). Remote sensing from vessels is also used, for example horizontal ocean acoustic remote sensing (OARS) and the optical laser particle counter. Argo floats and other ‘in-situ’ measurement systems are already described under the Water SBA. A wide array of projects is supported by earth observations, for example: understanding and analyzing seamount ecosystems, the ocean biographic information system (OBIS), the continuous plankton recorder survey (CPR), with a coordinating role by SAHFOS (sir Alister Hardy foundation for ocean science). This also applies to initiatives such as the GMES Marine Core Service, with MyOcean as a concrete example. Another initiative is the large marine ecosystems program (LME) by NOAA/NASA. A regional/national example is the Indian national centre for ocean information systems (INCOIS). Ecosystems modelling and monitoring for oceans and coastal environments is a special application of the systems that are described under the Water SBA. Modelling is based on a combination of in-situ measurements and earth observations, usually resulting in (free) web-based services. Clients are international organizations (in charge of monitoring environmental treaties and environmental performance), national governments and research organizations. Products and services are in the system development or implementation phase. The advantages of the application of earth observation are clear to the client groups and consist of improved data quantity and accuracy, geographical coverage and processing speed, thus creating the conditions for better global coordination and compatibility of systems.
Specific action as part of the project: 1. Include capacity building material on marine and coastal ecosystems on the GEONetCab
capacity building web.
Baltic Sea ecosystem monitoring
The satellite monitoring of the Baltic Sea environment project (SeaBaltic) has been established to set up an operational system for rapid mapping and efficient determination of the characteristics of the Baltic Sea. It builds on earlier research and aims to predict ecosystem changes. With the help of meteorological satellite images (METEOSAT, TIROS-N, NOAA) and earth observation satellite images (MODIS, ERS2) the following products are delivered: quasi-true colour images, surface chlorophyll a concentration, surface photosynthetically active radiation, sea surface temperature and total primary production. On this basis, bio-optical models and algorithms were developed for monitoring of the Baltic Sea ecosystems.
13 At least the current exercise, a census like this is of course never complete.
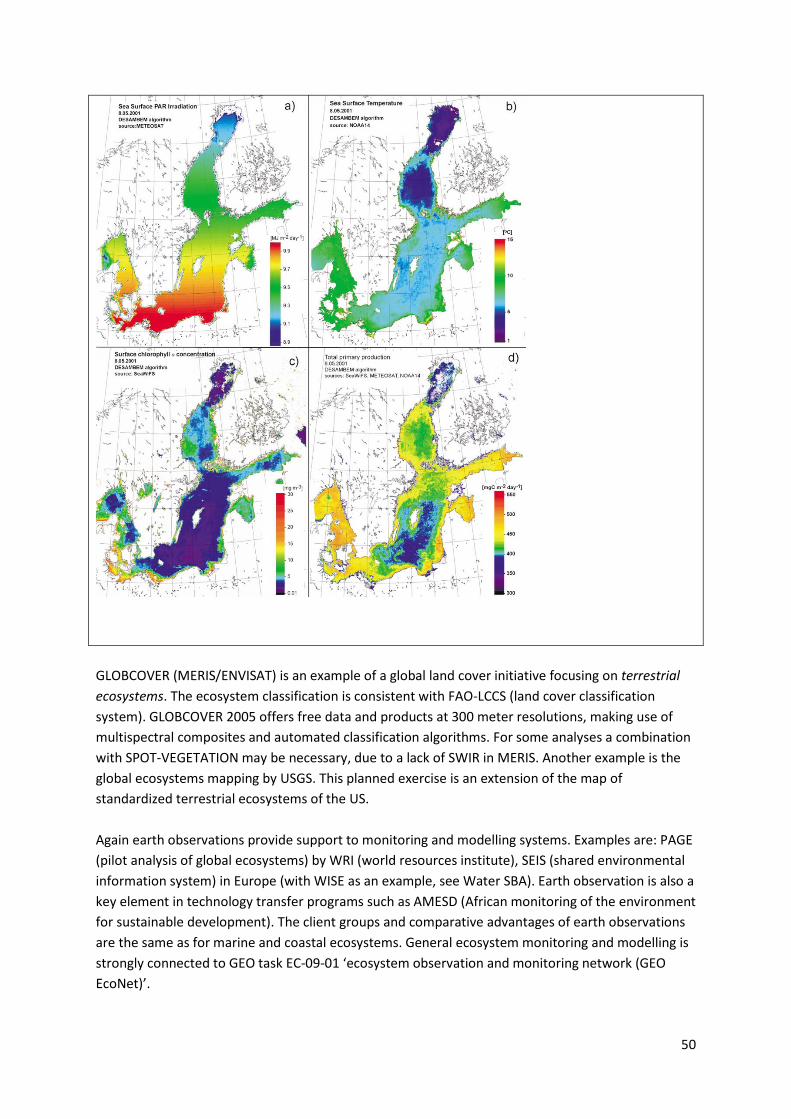
50
GLOBCOVER (MERIS/ENVISAT) is an example of a global land cover initiative focusing on terrestrial ecosystems. The ecosystem classification is consistent with FAO-LCCS (land cover classification system). GLOBCOVER 2005 offers free data and products at 300 meter resolutions, making use of multispectral composites and automated classification algorithms. For some analyses a combination with SPOT-VEGETATION may be necessary, due to a lack of SWIR in MERIS. Another example is the global ecosystems mapping by USGS. This planned exercise is an extension of the map of standardized terrestrial ecosystems of the US. Again earth observations provide support to monitoring and modelling systems. Examples are: PAGE (pilot analysis of global ecosystems) by WRI (world resources institute), SEIS (shared environmental information system) in Europe (with WISE as an example, see Water SBA). Earth observation is also a key element in technology transfer programs such as AMESD (African monitoring of the environment for sustainable development). The client groups and comparative advantages of earth observations are the same as for marine and coastal ecosystems. General ecosystem monitoring and modelling is strongly connected to GEO task EC-09-01 ‘ecosystem observation and monitoring network (GEO EcoNet)’.
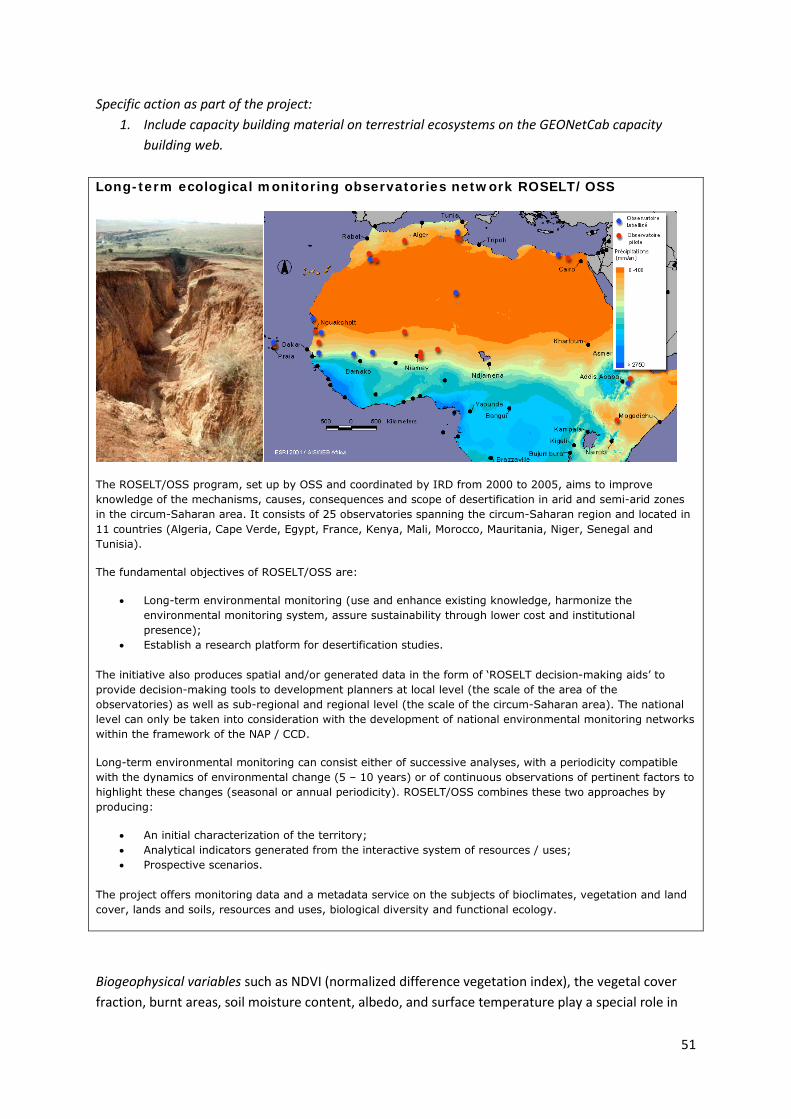
51
Specific action as part of the project: 1. Include capacity building material on terrestrial ecosystems on the GEONetCab capacity
building web. Long-term ecological monitoring observatories network ROSELT/OSS
The ROSELT/OSS program, set up by OSS and coordinated by IRD from 2000 to 2005, aims to improve knowledge of the mechanisms, causes, consequences and scope of desertification in arid and semi-arid zones in the circum-Saharan area. It consists of 25 observatories spanning the circum-Saharan region and located in 11 countries (Algeria, Cape Verde, Egypt, France, Kenya, Mali, Morocco, Mauritania, Niger, Senegal and Tunisia).
The fundamental objectives of ROSELT/OSS are:
• Long-term environmental monitoring (use and enhance existing knowledge, harmonize the environmental monitoring system, assure sustainability through lower cost and institutional presence);
• Establish a research platform for desertification studies.
The initiative also produces spatial and/or generated data in the form of ‘ROSELT decision-making aids’ to provide decision-making tools to development planners at local level (the scale of the area of the observatories) as well as sub-regional and regional level (the scale of the circum-Saharan area). The national level can only be taken into consideration with the development of national environmental monitoring networks within the framework of the NAP / CCD.
Long-term environmental monitoring can consist either of successive analyses, with a periodicity compatible with the dynamics of environmental change (5 – 10 years) or of continuous observations of pertinent factors to highlight these changes (seasonal or annual periodicity). ROSELT/OSS combines these two approaches by producing:
• An initial characterization of the territory; • Analytical indicators generated from the interactive system of resources / uses; • Prospective scenarios.
The project offers monitoring data and a metadata service on the subjects of bioclimates, vegetation and land cover, lands and soils, resources and uses, biological diversity and functional ecology.
Biogeophysical variables such as NDVI (normalized difference vegetation index), the vegetal cover fraction, burnt areas, soil moisture content, albedo, and surface temperature play a special role in
52
the classification and monitoring of ecosystems. Only the subject matter is different to earth observation applications mentioned in the Agriculture SBA. Biogeophysical variables are presented here as a specific ecosystem products/services category because of their special value for ecosystem assessment and change detection/prediction. GEO task EC-09-01 subtask b) ‘ecosystems functions and services’ is especially dedicated to this purpose. The ECV-studies into biomass, fAPAR (fraction of absorbed photosynthetically active radiation), leaf area and land cover are relevant to the biogeophysical variables product/services category. Local applications, including protected areas concern land use planning and (national) parks management at a more local level. Global datasets and products are used as information base for a rapid assessment of the local situation. Additional processing and measurements are usually needed for a successful application at a local level. Then again, a clear advantage of earth observations is, for example, showing changes in protected areas in a very visual way that is easy to understand for decision makers and the general public. The list of potential applications of earth observations is almost endless. Examples are mitigation of ecological damage in case of hurricanes, insect defoliation, fires, air pollution, dust storms, water pollution (less waves due to garbage), oil spills (calming the waters: detected by radar and UV), land reclamation and development and mining. Other examples are more related to planning, such as management of coastal tourism, fish resources, watersheds, forest, agro-ecological zones, the relation between urban growth and ecosystems and the effect of air pollution on environmental change. Then there are very specific applications, such as the potential use of water hyacinths for biofuel (Pantanal) and the environmental effects of coca cultivation (and the attempts to eradicate this cultivation), as for example in Colombia. GEO task EC-09-02 ‘ecosystems vulnerability to global change’ focuses on a number of similar topics. Clients are regional and local authorities, environmental organizations and protected area management. The advantages of earth observation vary with the local situation and availability of data and expertise. The need and opportunity for capacity building in emerging economies and lesser developed countries is therefore huge. Specific actions as part of the project:
1. Include capacity building material on local ecosystem applications, including protected areas, on the GEONetCab capacity building web.
2. Gather success stories on local ecosystem applications for marketing in developing countries and emerging economies.
3. Promote local applications for ecosystems with decision makers, environmental organizations and protected area management.
53
Centre Suivi Ecologique, Senegal
The Centre Suivi Ecologique (CSE) is a public institution, support by the Government of Senegal, DANIDA and UNDP. It resorts under the Senegalese Ministry of Environment and Nature Protection. The centre provides environmental information for decision support with respect to natural resources management and policy. CSE also provides scientific and technical advice and has been very successful in supporting a substantial number of development initiatives.
Recent activities and projects include the subjects such as wild fires, ecosystem management, capacity building in earth observations and geoinformatics, climate change adaptation, food security, and carbon balance. CSE also houses various databases and organizes workshops and training events. CSE is an example of African expertise used for the benefit of Africa.
Agriculture The Agriculture SBA’s earth observation product/service categories consist of: satellite based fishing (cross linked with Water SBA), precision agriculture, monitoring and modelling of crop conditions, including food security (cross linked with Climate and Water SBA), insurance monitoring, forestry monitoring, including illegal logging (cross linked with Climate SBA). In the Agriculture SBA most applications serve developed countries and have not found a ‘market’ in developing countries (where they seem most needed). India provides a good example of satellite based fishing with the identification of potential fishing zones (PFZ). ODIS (ocean data information system) is coordinated by INCOIS for the Indian Ocean. Information is derived from SST and chlorophyll data. Wind is also a factor taken into account in some models. The data are combined with in-situ measurements (Argo floats) and delivered through web-services. The result is identification of feeding grounds, which is delivered near-real time to the clients. To serve the fishery community not only feeding grounds should to be identified, but also locations to avoid, such as those with harmful algae blooms (see Disaster SBA) or anti-cyclonic eddies. Cost considerations are a concern, for example NOAA data are not available for identification of potential fishing grounds, to avoid competing with commercial interests (SeaWIFS is privately owned). Another concern is the uncertainty around the continuation of ocean colour missions. On the other hand, depth penetration by thermal sensors could provide new opportunities. Fishery does not only deal with potential fishing grounds, but with sustainable management of resources. Earth observations play an important role in understanding whole ecosystems, long-term
54
effects (El Nino), and consequences for species at risk. Determination of the total allowable catch is therefore more important than a mere indication of potential fishing zones. The subject is related to the Ecosystems SBA: GOOS, POGO (partnership for observation of the global oceans) and the Climate SBA (CLIVAR). The fisheries related GEO task is AG-06-02 ‘data utilization in fisheries and aquaculture’ through the SAFARI project (societal applications in fisheries and aquaculture using remote sensing), coordinated by CSA and NOAA. Products and services for identification of potential fishing zones are in the implementation phase, those related to total allowable catch are in the system development phase. Clients are (national and local) governments, the fisheries sector (big and small companies) and environmental organizations. When products and services are provided for free, arguably the goal of sustainable fishery is better served. Capacity building is needed at all levels to facilitate this. Specific actions as part of the project:
1. Include capacity building material on satellite based fishing on the GEONetCab capacity building web.
2. Investigate whether current initiatives cover the introduction of earth observations for satellite based fishing in developing countries and emerging economies sufficiently.
3. If not, use success stories to market satellite based fishing products and services to potential clients.
Earth observation applications for precision agriculture have the following advantages: the ability to monitor large areas, no interference from obstacles on the ground, no access restrictions, no sampling bias. Disadvantages are: cost considerations and the high spatial and temporal resolution needed. Earth observations are instrumental in the identification of crop disease, water and/or nutrient shortages and the relation between crop growth and soil characteristics and conditions. This results in better water and fertilizer management and higher yields. Apart from earth observations, required ingredients are: GPS, GIS, geo-referenced agricultural statistics, availability of sensors, controllers, etc. For the developed market products and services are in the implementation phase with farmers as main clients. Initiatives such as GEONETCast present opportunities for a low-cost version by providing weather forecasts (linked with Weather SBA) and other information relevant in developing countries that lack the necessary infrastructure. Capacity building efforts should focus on this effort to facilitate better information provision to small farmers. Actions with respect to precision agriculture in developing countries and emerging economies follow on from improved monitoring and modelling of crop conditions. The GEONetCab project will focus first on that products and services category. Specific action as part of the project:
1. Include capacity building material on precision agriculture on the GEONetCab capacity building web.
The ECV variables relevant to monitoring and modelling of crop conditions are: albedo, leaf area index, fAPAR (fraction of absorbed photosynthetically active radiation), biomass, and land cover. To
55
assess land cover for agriculture, such as monitoring for the EU common agricultural policy, images of relatively high resolution are needed. Evapotranspiration data are derived from NDVI, LAI, albedo, insolation, and land surface temperature. Different levels of temporal and spatial resolutions are needed for different applications (global/local). Validation based on in-situ measurements is important, and in combination with historical analysis (previous growing seasons) and agricultural statistics it becomes a powerful instrument. Cost considerations are a concern: there are examples of high resolution applications (Iraq), but generally these are not affordable. Crop emergence and acreage are generally measured with radar, plant water regimes and deficits with SWIR and thermal sensors. Data from NOAA, MSG, SPOT VEGETATION, MODIS, ASAR, and ASTER are used most. The bulletins of AGRI4CAST (Europe) provide a good example of an application. AG-07-03 ‘global agricultural monitoring’ is the related GEO task, supported by the global agricultural monitoring community of practice (GLAM). Food security is a very important applications field. Examples of end products are WFP/FAO’s comprehensive food security and vulnerability analysis (CFSVA) and the USDA food security assessment 2010 – 2020. Examples of food security monitoring and modelling systems are: FAS (USDA foreign agricultural service), GLAM (mentioned before), GIEWS (FAO global information and early warning system), FEWS (USAID famine early warning system), MARS (EU monitoring agriculture with remote sensing), and GMFS (global monitoring of food security). Of course there are also various national monitoring systems. A recent coordination effort is the integrated food security phase classification (IPC), which aims to take a multi-agency approach. IPC provides a standardized scale, combining food security and nutrition with livelihood information, and will be delivered through the web. Clients of food security products and services are national and local governments, international organizations dealing with food security, NGOs and the scientific community. Initiatives such as GMFS, FEWSnet and related projects provide good capacity building material for clients in developing countries. Products and services are in the system development / implementation phase. Good validation and more detailed modelling are both necessary for the successful application on a local scale in developing countries. Validation efforts in developed countries (for example Andalusia, Spain) of different crop models have shown promising results. Specific actions as part of the project:
1. Include capacity building material on monitoring and modelling of crop conditions, with special emphasis on food security, on the GEONetCab capacity building web.
2. Gather success stories on monitoring and modelling of crop conditions, with special emphasis on food security and in cooperation with the GEO (GLAM) Agriculture community of practice, in developing countries and emerging economies.
3. Promote applications for monitoring and modelling of crop conditions to national and local authorities and international organizations with agricultural production and food security as mandate.
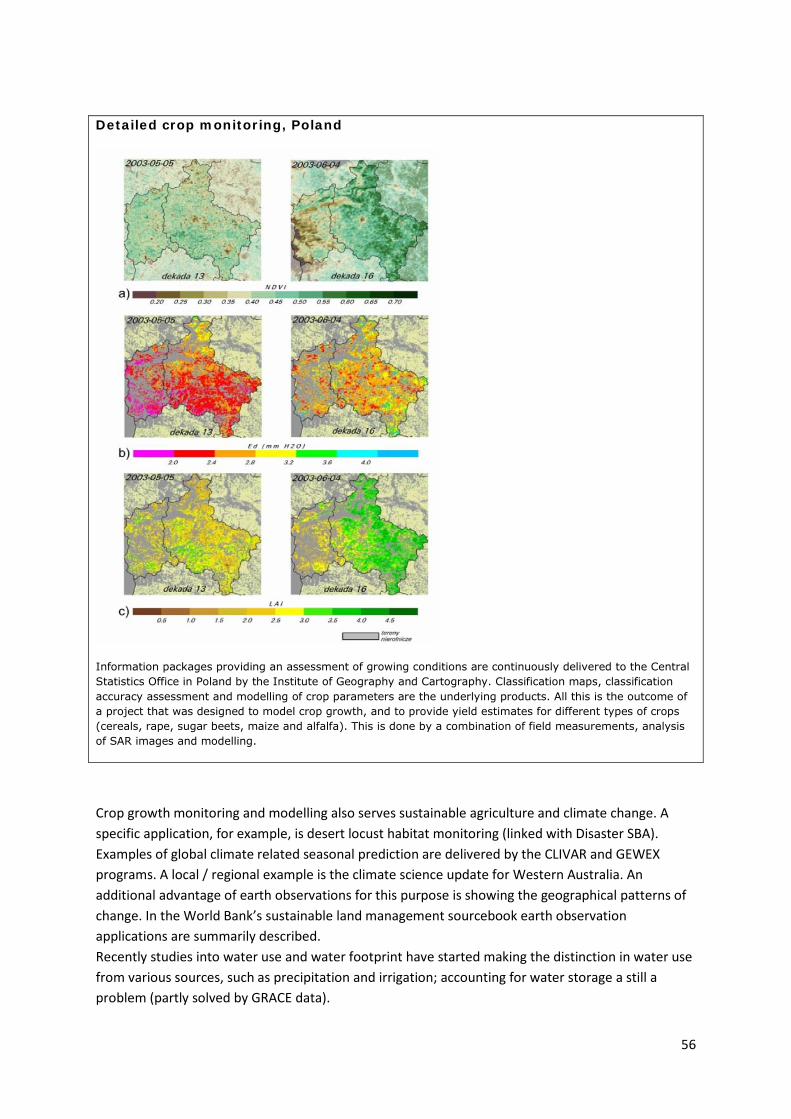
56
Detailed crop monitoring, Poland
Information packages providing an assessment of growing conditions are continuously delivered to the Central Statistics Office in Poland by the Institute of Geography and Cartography. Classification maps, classification accuracy assessment and modelling of crop parameters are the underlying products. All this is the outcome of a project that was designed to model crop growth, and to provide yield estimates for different types of crops (cereals, rape, sugar beets, maize and alfalfa). This is done by a combination of field measurements, analysis of SAR images and modelling.
Crop growth monitoring and modelling also serves sustainable agriculture and climate change. A specific application, for example, is desert locust habitat monitoring (linked with Disaster SBA). Examples of global climate related seasonal prediction are delivered by the CLIVAR and GEWEX programs. A local / regional example is the climate science update for Western Australia. An additional advantage of earth observations for this purpose is showing the geographical patterns of change. In the World Bank’s sustainable land management sourcebook earth observation applications are summarily described. Recently studies into water use and water footprint have started making the distinction in water use from various sources, such as precipitation and irrigation; accounting for water storage a still a problem (partly solved by GRACE data).
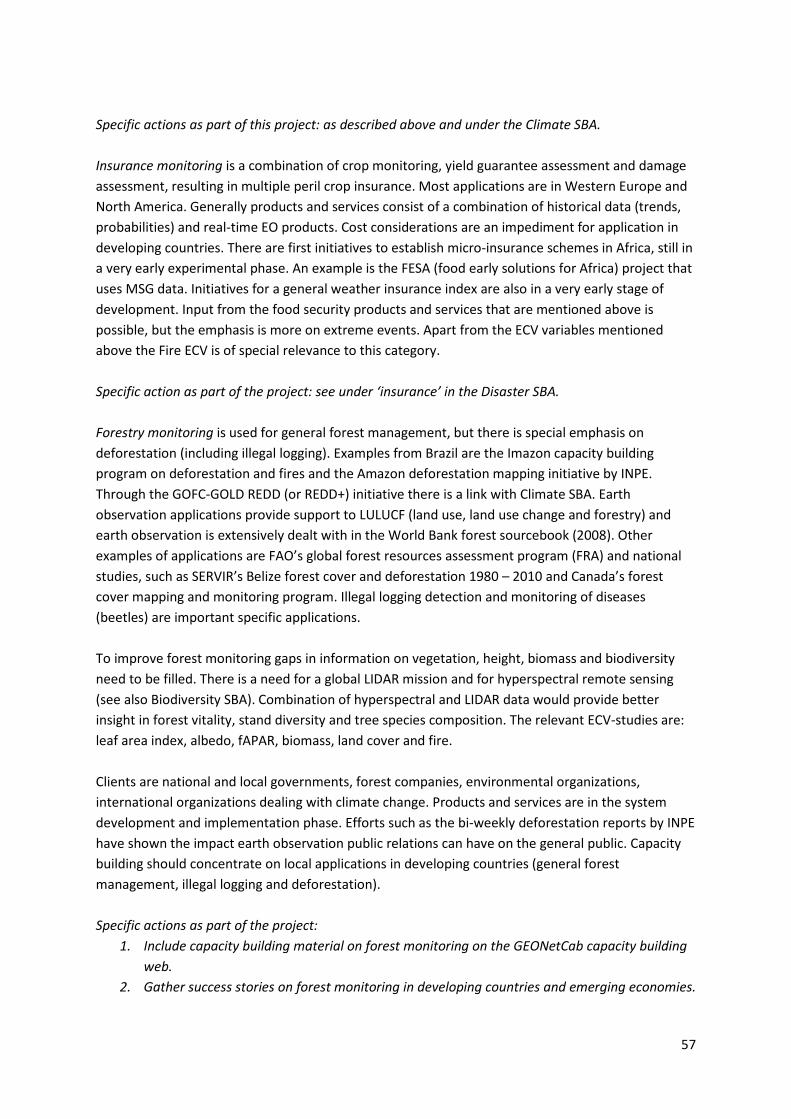
57
Specific actions as part of this project: as described above and under the Climate SBA. Insurance monitoring is a combination of crop monitoring, yield guarantee assessment and damage assessment, resulting in multiple peril crop insurance. Most applications are in Western Europe and North America. Generally products and services consist of a combination of historical data (trends, probabilities) and real-time EO products. Cost considerations are an impediment for application in developing countries. There are first initiatives to establish micro-insurance schemes in Africa, still in a very early experimental phase. An example is the FESA (food early solutions for Africa) project that uses MSG data. Initiatives for a general weather insurance index are also in a very early stage of development. Input from the food security products and services that are mentioned above is possible, but the emphasis is more on extreme events. Apart from the ECV variables mentioned above the Fire ECV is of special relevance to this category. Specific action as part of the project: see under ‘insurance’ in the Disaster SBA. Forestry monitoring is used for general forest management, but there is special emphasis on deforestation (including illegal logging). Examples from Brazil are the Imazon capacity building program on deforestation and fires and the Amazon deforestation mapping initiative by INPE. Through the GOFC-GOLD REDD (or REDD+) initiative there is a link with Climate SBA. Earth observation applications provide support to LULUCF (land use, land use change and forestry) and earth observation is extensively dealt with in the World Bank forest sourcebook (2008). Other examples of applications are FAO’s global forest resources assessment program (FRA) and national studies, such as SERVIR’s Belize forest cover and deforestation 1980 – 2010 and Canada’s forest cover mapping and monitoring program. Illegal logging detection and monitoring of diseases (beetles) are important specific applications. To improve forest monitoring gaps in information on vegetation, height, biomass and biodiversity need to be filled. There is a need for a global LIDAR mission and for hyperspectral remote sensing (see also Biodiversity SBA). Combination of hyperspectral and LIDAR data would provide better insight in forest vitality, stand diversity and tree species composition. The relevant ECV-studies are: leaf area index, albedo, fAPAR, biomass, land cover and fire. Clients are national and local governments, forest companies, environmental organizations, international organizations dealing with climate change. Products and services are in the system development and implementation phase. Efforts such as the bi-weekly deforestation reports by INPE have shown the impact earth observation public relations can have on the general public. Capacity building should concentrate on local applications in developing countries (general forest management, illegal logging and deforestation). Specific actions as part of the project:
1. Include capacity building material on forest monitoring on the GEONetCab capacity building web.
2. Gather success stories on forest monitoring in developing countries and emerging economies.
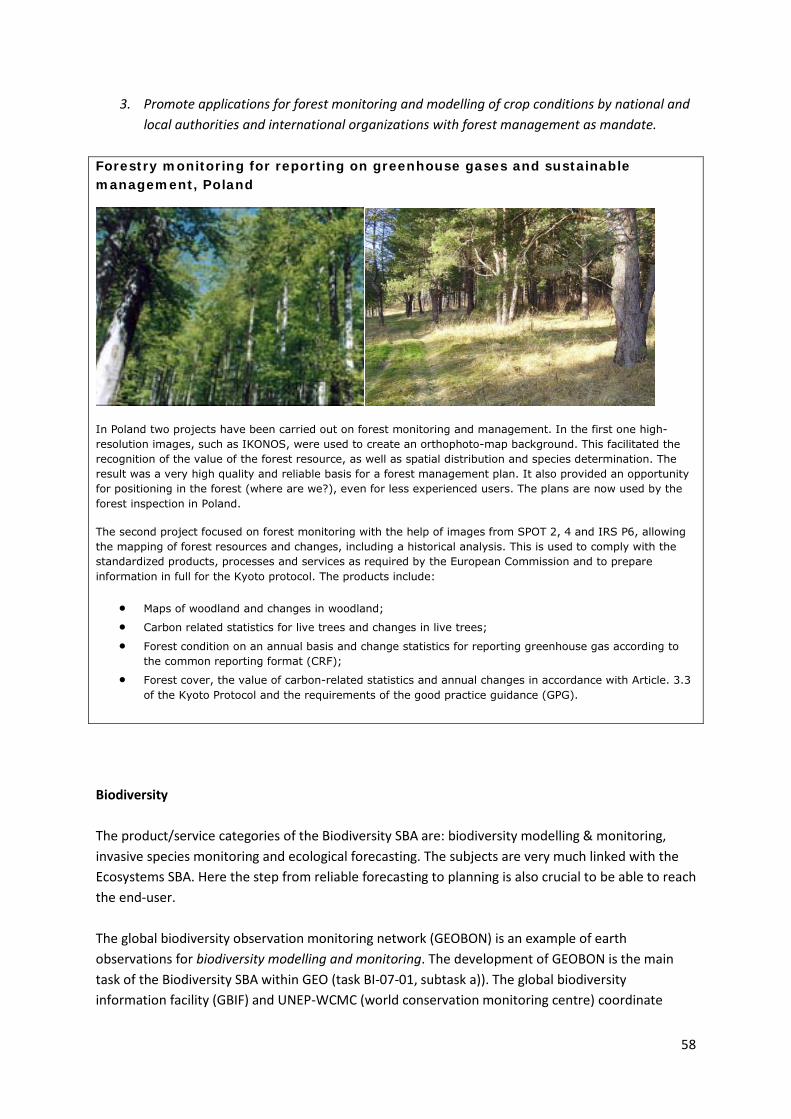
58
3. Promote applications for forest monitoring and modelling of crop conditions by national and local authorities and international organizations with forest management as mandate.
Forestry monitoring for reporting on greenhouse gases and sustainable management, Poland
In Poland two projects have been carried out on forest monitoring and management. In the first one high-resolution images, such as IKONOS, were used to create an orthophoto-map background. This facilitated the recognition of the value of the forest resource, as well as spatial distribution and species determination. The result was a very high quality and reliable basis for a forest management plan. It also provided an opportunity for positioning in the forest (where are we?), even for less experienced users. The plans are now used by the forest inspection in Poland.
The second project focused on forest monitoring with the help of images from SPOT 2, 4 and IRS P6, allowing the mapping of forest resources and changes, including a historical analysis. This is used to comply with the standardized products, processes and services as required by the European Commission and to prepare information in full for the Kyoto protocol. The products include:
• Maps of woodland and changes in woodland; • Carbon related statistics for live trees and changes in live trees; • Forest condition on an annual basis and change statistics for reporting greenhouse gas according to
the common reporting format (CRF); • Forest cover, the value of carbon-related statistics and annual changes in accordance with Article. 3.3
of the Kyoto Protocol and the requirements of the good practice guidance (GPG).
Biodiversity The product/service categories of the Biodiversity SBA are: biodiversity modelling & monitoring, invasive species monitoring and ecological forecasting. The subjects are very much linked with the Ecosystems SBA. Here the step from reliable forecasting to planning is also crucial to be able to reach the end-user. The global biodiversity observation monitoring network (GEOBON) is an example of earth observations for biodiversity modelling and monitoring. The development of GEOBON is the main task of the Biodiversity SBA within GEO (task BI-07-01, subtask a)). The global biodiversity information facility (GBIF) and UNEP-WCMC (world conservation monitoring centre) coordinate
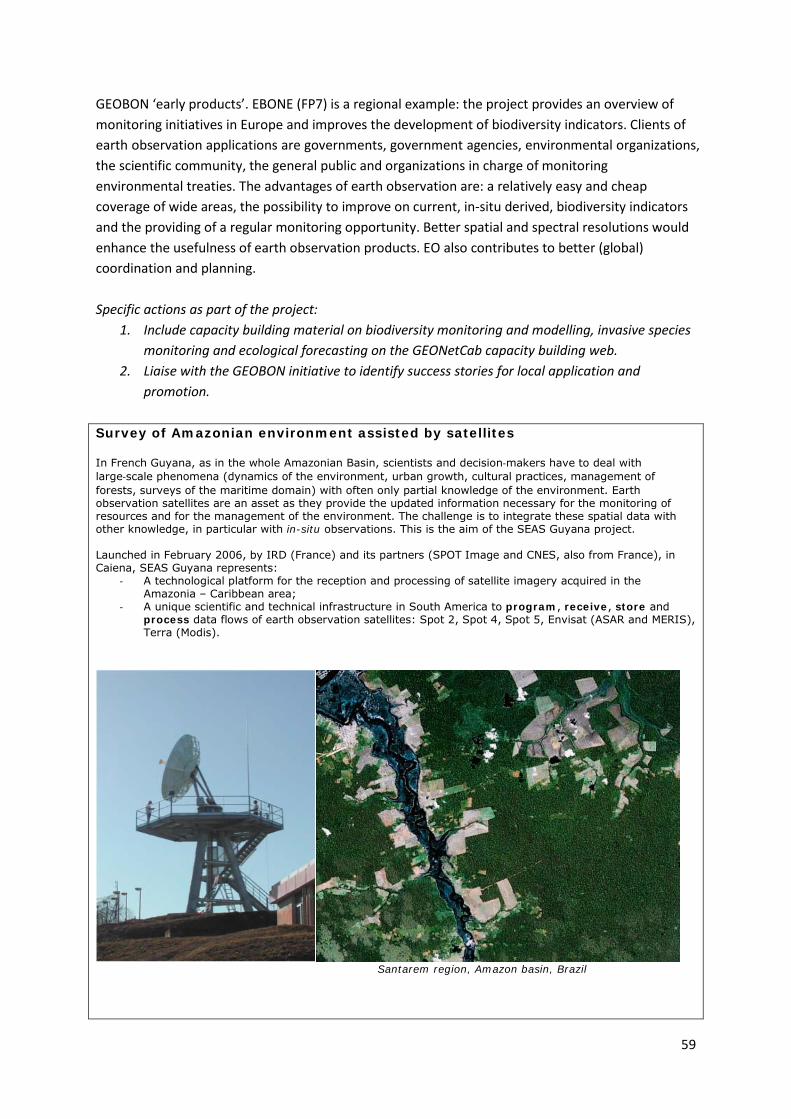
59
GEOBON ‘early products’. EBONE (FP7) is a regional example: the project provides an overview of monitoring initiatives in Europe and improves the development of biodiversity indicators. Clients of earth observation applications are governments, government agencies, environmental organizations, the scientific community, the general public and organizations in charge of monitoring environmental treaties. The advantages of earth observation are: a relatively easy and cheap coverage of wide areas, the possibility to improve on current, in-situ derived, biodiversity indicators and the providing of a regular monitoring opportunity. Better spatial and spectral resolutions would enhance the usefulness of earth observation products. EO also contributes to better (global) coordination and planning. Specific actions as part of the project:
1. Include capacity building material on biodiversity monitoring and modelling, invasive species monitoring and ecological forecasting on the GEONetCab capacity building web.
2. Liaise with the GEOBON initiative to identify success stories for local application and promotion.
Survey of Amazonian environment assisted by satellites
In French Guyana, as in the whole Amazonian Basin, scientists and decision-makers have to deal with large-scale phenomena (dynamics of the environment, urban growth, cultural practices, management of forests, surveys of the maritime domain) with often only partial knowledge of the environment. Earth observation satellites are an asset as they provide the updated information necessary for the monitoring of resources and for the management of the environment. The challenge is to integrate these spatial data with other knowledge, in particular with in-situ observations. This is the aim of the SEAS Guyana project. Launched in February 2006, by IRD (France) and its partners (SPOT Image and CNES, also from France), in Caiena, SEAS Guyana represents:
- A technological platform for the reception and processing of satellite imagery acquired in the Amazonia – Caribbean area;
- A unique scientific and technical infrastructure in South America to program, receive, store and process data flows of earth observation satellites: Spot 2, Spot 4, Spot 5, Envisat (ASAR and MERIS), Terra (Modis).
Santarem region, Amazon basin, Brazil
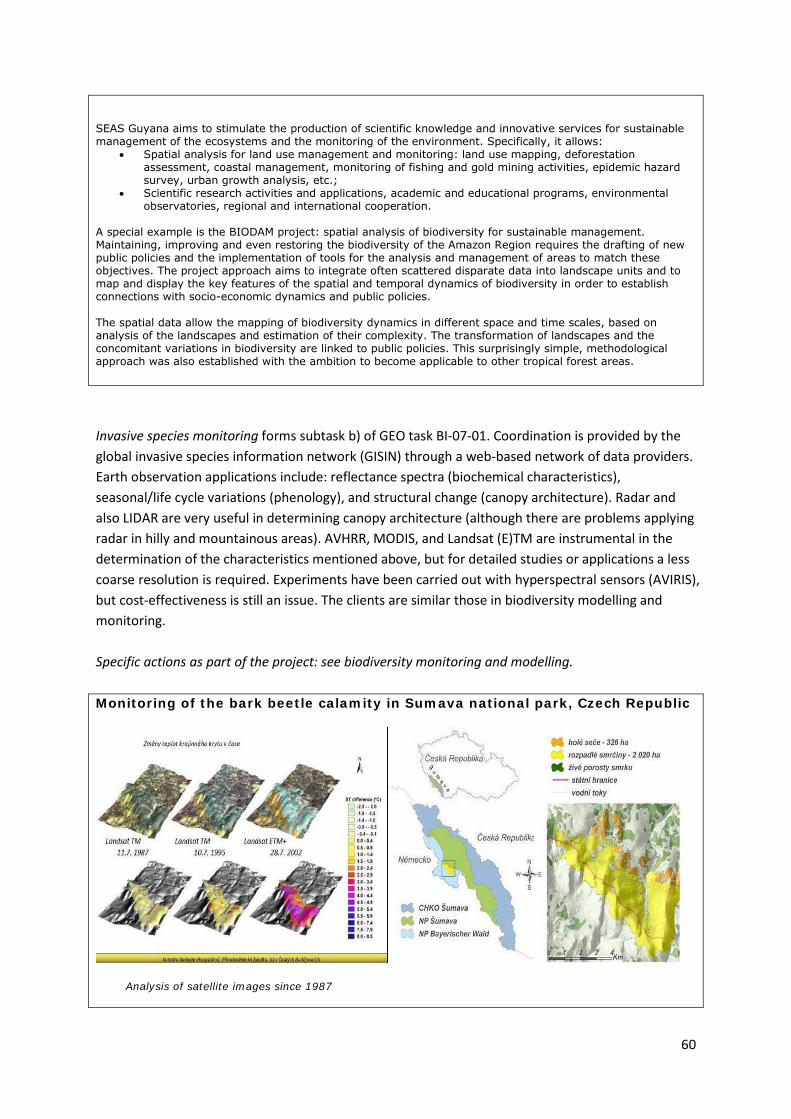
60
SEAS Guyana aims to stimulate the production of scientific knowledge and innovative services for sustainable management of the ecosystems and the monitoring of the environment. Specifically, it allows:
• Spatial analysis for land use management and monitoring: land use mapping, deforestation assessment, coastal management, monitoring of fishing and gold mining activities, epidemic hazard survey, urban growth analysis, etc.;
• Scientific research activities and applications, academic and educational programs, environmental observatories, regional and international cooperation.
A special example is the BIODAM project: spatial analysis of biodiversity for sustainable management. Maintaining, improving and even restoring the biodiversity of the Amazon Region requires the drafting of new public policies and the implementation of tools for the analysis and management of areas to match these objectives. The project approach aims to integrate often scattered disparate data into landscape units and to map and display the key features of the spatial and temporal dynamics of biodiversity in order to establish connections with socio-economic dynamics and public policies. The spatial data allow the mapping of biodiversity dynamics in different space and time scales, based on analysis of the landscapes and estimation of their complexity. The transformation of landscapes and the concomitant variations in biodiversity are linked to public policies. This surprisingly simple, methodological approach was also established with the ambition to become applicable to other tropical forest areas. Invasive species monitoring forms subtask b) of GEO task BI-07-01. Coordination is provided by the global invasive species information network (GISIN) through a web-based network of data providers. Earth observation applications include: reflectance spectra (biochemical characteristics), seasonal/life cycle variations (phenology), and structural change (canopy architecture). Radar and also LIDAR are very useful in determining canopy architecture (although there are problems applying radar in hilly and mountainous areas). AVHRR, MODIS, and Landsat (E)TM are instrumental in the determination of the characteristics mentioned above, but for detailed studies or applications a less coarse resolution is required. Experiments have been carried out with hyperspectral sensors (AVIRIS), but cost-effectiveness is still an issue. The clients are similar those in biodiversity modelling and monitoring. Specific actions as part of the project: see biodiversity monitoring and modelling. Monitoring of the bark beetle calamity in Sumava national park, Czech Republic
Analysis of satellite images since 1987
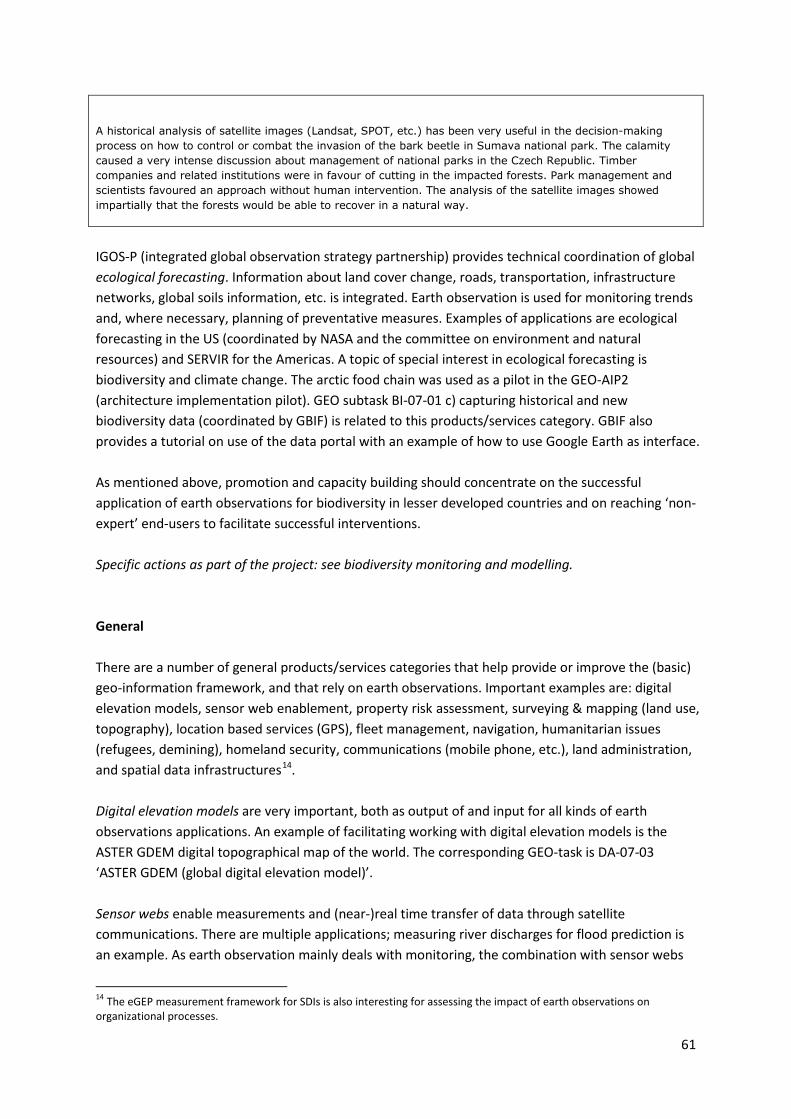
61
A historical analysis of satellite images (Landsat, SPOT, etc.) has been very useful in the decision-making process on how to control or combat the invasion of the bark beetle in Sumava national park. The calamity caused a very intense discussion about management of national parks in the Czech Republic. Timber companies and related institutions were in favour of cutting in the impacted forests. Park management and scientists favoured an approach without human intervention. The analysis of the satellite images showed impartially that the forests would be able to recover in a natural way.
IGOS-P (integrated global observation strategy partnership) provides technical coordination of global ecological forecasting. Information about land cover change, roads, transportation, infrastructure networks, global soils information, etc. is integrated. Earth observation is used for monitoring trends and, where necessary, planning of preventative measures. Examples of applications are ecological forecasting in the US (coordinated by NASA and the committee on environment and natural resources) and SERVIR for the Americas. A topic of special interest in ecological forecasting is biodiversity and climate change. The arctic food chain was used as a pilot in the GEO-AIP2 (architecture implementation pilot). GEO subtask BI-07-01 c) capturing historical and new biodiversity data (coordinated by GBIF) is related to this products/services category. GBIF also provides a tutorial on use of the data portal with an example of how to use Google Earth as interface. As mentioned above, promotion and capacity building should concentrate on the successful application of earth observations for biodiversity in lesser developed countries and on reaching ‘non-expert’ end-users to facilitate successful interventions. Specific actions as part of the project: see biodiversity monitoring and modelling. General There are a number of general products/services categories that help provide or improve the (basic) geo-information framework, and that rely on earth observations. Important examples are: digital elevation models, sensor web enablement, property risk assessment, surveying & mapping (land use, topography), location based services (GPS), fleet management, navigation, humanitarian issues (refugees, demining), homeland security, communications (mobile phone, etc.), land administration, and spatial data infrastructures14
.
Digital elevation models are very important, both as output of and input for all kinds of earth observations applications. An example of facilitating working with digital elevation models is the ASTER GDEM digital topographical map of the world. The corresponding GEO-task is DA-07-03 ‘ASTER GDEM (global digital elevation model)’. Sensor webs enable measurements and (near-)real time transfer of data through satellite communications. There are multiple applications; measuring river discharges for flood prediction is an example. As earth observation mainly deals with monitoring, the combination with sensor webs
14 The eGEP measurement framework for SDIs is also interesting for assessing the impact of earth observations on organizational processes.
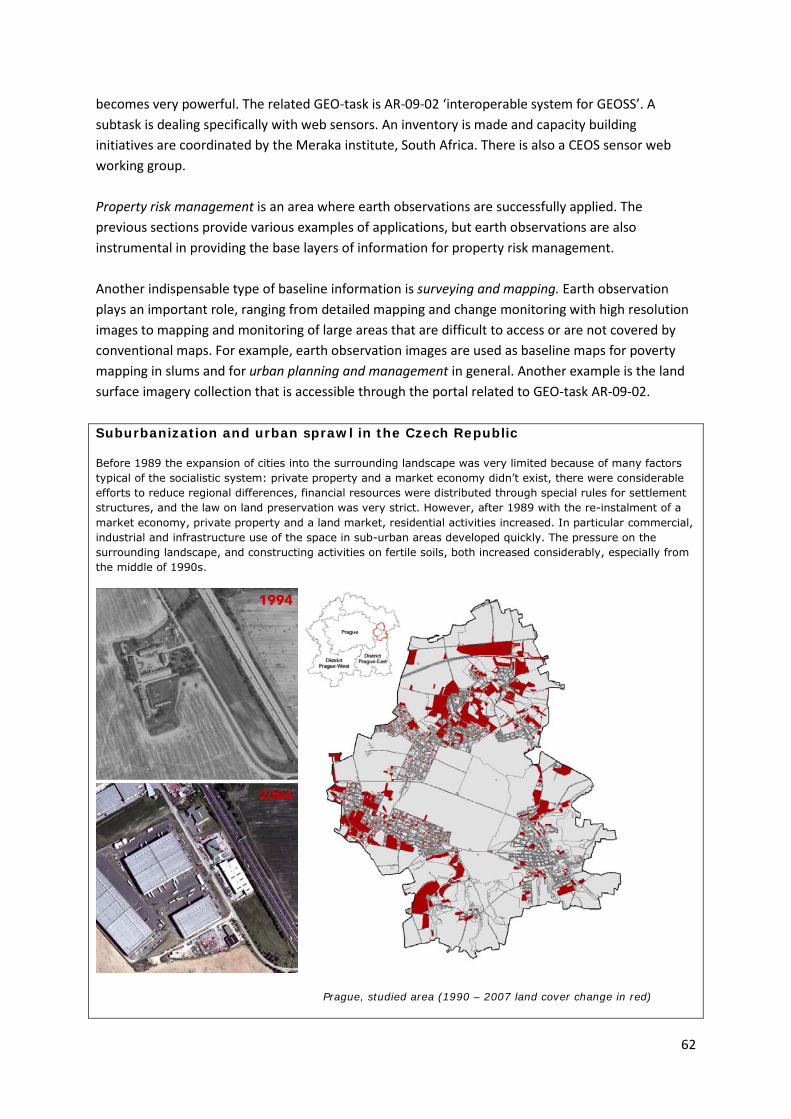
62
becomes very powerful. The related GEO-task is AR-09-02 ‘interoperable system for GEOSS’. A subtask is dealing specifically with web sensors. An inventory is made and capacity building initiatives are coordinated by the Meraka institute, South Africa. There is also a CEOS sensor web working group. Property risk management is an area where earth observations are successfully applied. The previous sections provide various examples of applications, but earth observations are also instrumental in providing the base layers of information for property risk management. Another indispensable type of baseline information is surveying and mapping. Earth observation plays an important role, ranging from detailed mapping and change monitoring with high resolution images to mapping and monitoring of large areas that are difficult to access or are not covered by conventional maps. For example, earth observation images are used as baseline maps for poverty mapping in slums and for urban planning and management in general. Another example is the land surface imagery collection that is accessible through the portal related to GEO-task AR-09-02. Suburbanization and urban sprawl in the Czech Republic
Before 1989 the expansion of cities into the surrounding landscape was very limited because of many factors typical of the socialistic system: private property and a market economy didn’t exist, there were considerable efforts to reduce regional differences, financial resources were distributed through special rules for settlement structures, and the law on land preservation was very strict. However, after 1989 with the re-instalment of a market economy, private property and a land market, residential activities increased. In particular commercial, industrial and infrastructure use of the space in sub-urban areas developed quickly. The pressure on the surrounding landscape, and constructing activities on fertile soils, both increased considerably, especially from the middle of 1990s.
Prague, studied area (1990 – 2007 land cover change in red)
63
EO data used for the study area in the eastern part of the Prague suburban zone showed significant spatial and functional changes in the area and especially changes from highly fertile agricultural land to urban, built up areas. A project has been set up, supported by the Czech Ministry of Environment to assess the spatial extent and intensity of the suburbanization process and to quantify the predominantly negative effects. The results will be presented to decision makers and the public in general to help formulate measures to prevent and mitigate the negative consequences of suburban development.
Location based services are also an essential element in support of earth observation applications. The availability of GPS systems has created a wealth of opportunities for applications and also has helped raise awareness with the general public about the usefulness of satellites. Location based services in combination with earth observations also enable better fleet management and navigation, both for terrestrial and marine applications. Humanitarian issues are a very important field for earth observation applications. Poverty mapping is already mentioned, support for monitoring and management of refugee camps and peace keeping operations are other examples. Related to this type of application is the use of earth observations for homeland security. Satellite communications are a necessity for quite a number of integrated earth observation applications. The related GEO-task is AR-09-04 ‘dissemination and distribution networks’, with the GEONETCast and FengYunCast initiatives as examples. A special application of earth observations is land administration. The use of conventional methods provides slow results when applied in developing countries and emerging economies and time is usually too short to enable these systems to evolve in a natural way. Earth observations can help to speed up the process, both by providing a quick scan of large areas and by increasing the participation of the communities involved through visualization. An example is the social tenure domain model (STDM) that is currently under development for UN-HABITAT. Spatial data infrastructures integrate different layers of information. The aim of all the GEO data management tasks is to create the conditions to facilitate this integration: GEOSS data sharing principles (DA-06-01), data management (DA-09-01), data integration and analysis (DA-09-02), and global datasets (DA-09-03). Spatial data infrastructures can also be used for special, targeted applications. The World Bank ‘mapping for results’ initiative, UNECA MDG (millennium development goals) mapper tool, ISRO (Indian space research organization) village resource centres and the pilot project to set up a rural SDI in Ghana (EMMSDAG project) are examples. The Gates Foundation and Google are also focusing on spatial applications for development. Google Earth is used more and more for issues as community vulnerability mapping and biodiversity mapping, to mention a few applications. For each type of earth observation product and service some of the general applications presented above play an important role and sometimes this may help remove a bottleneck hampering successful application. Inclusion of these elements therefore has to be taken into account in capacity building and brokerage initiatives.
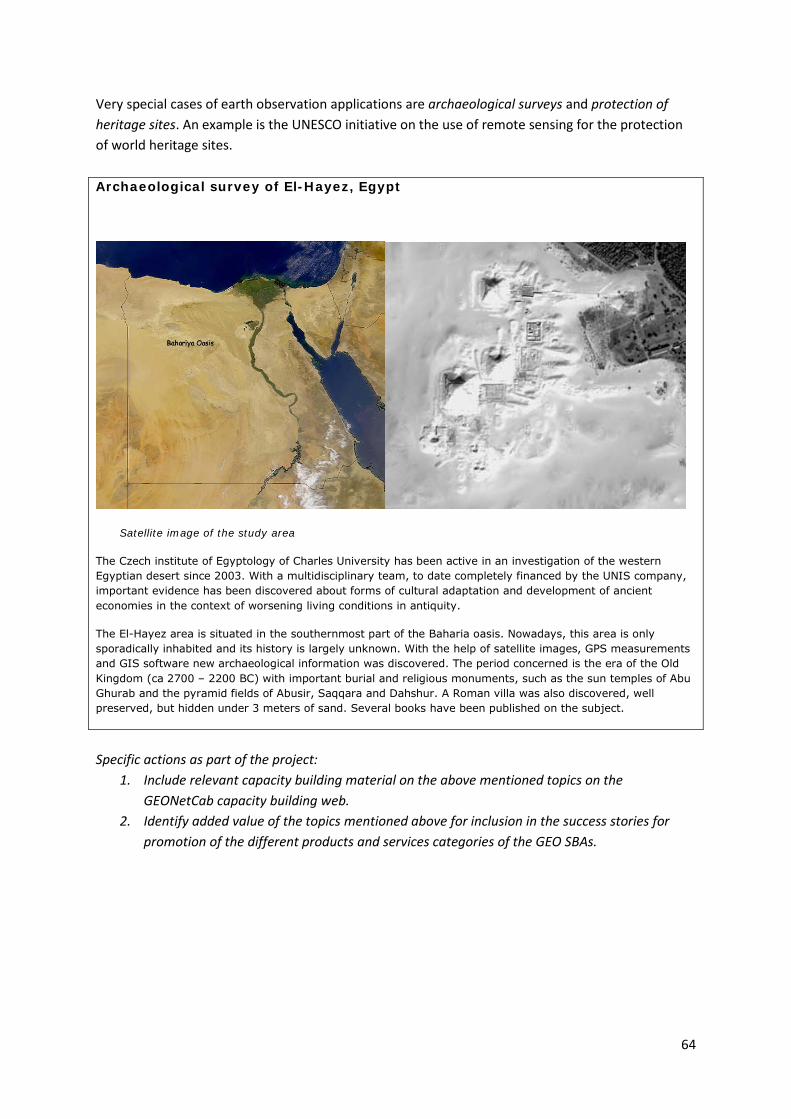
64
Very special cases of earth observation applications are archaeological surveys and protection of heritage sites. An example is the UNESCO initiative on the use of remote sensing for the protection of world heritage sites. Archaeological survey of El-Hayez, Egypt
Satellite image of the study area
The Czech institute of Egyptology of Charles University has been active in an investigation of the western Egyptian desert since 2003. With a multidisciplinary team, to date completely financed by the UNIS company, important evidence has been discovered about forms of cultural adaptation and development of ancient economies in the context of worsening living conditions in antiquity.
The El-Hayez area is situated in the southernmost part of the Baharia oasis. Nowadays, this area is only sporadically inhabited and its history is largely unknown. With the help of satellite images, GPS measurements and GIS software new archaeological information was discovered. The period concerned is the era of the Old Kingdom (ca 2700 – 2200 BC) with important burial and religious monuments, such as the sun temples of Abu Ghurab and the pyramid fields of Abusir, Saqqara and Dahshur. A Roman villa was also discovered, well preserved, but hidden under 3 meters of sand. Several books have been published on the subject.
Specific actions as part of the project:
1. Include relevant capacity building material on the above mentioned topics on the GEONetCab capacity building web.
2. Identify added value of the topics mentioned above for inclusion in the success stories for promotion of the different products and services categories of the GEO SBAs.
65
7. CONCLUSIONS AND RECOMMENDATIONS
Conclusions
1. Marketing for earth observations needs to be synchronized with the phase in the life cycle of a particular product or service.
2. The whole chain, from provider of earth observation products and services to end-user, needs to be analyzed.
3. Marketing, in the form of capacity building and brokerage, can provide a better link between the earth observation community and (potential) clients and increase the use of earth observation applications.
4. There are important regional differences in research, development and application of earth observation products and services.
5. The framework for the assessment of marketing intervention consists of the following four dimensions: a. A distinction between earth observation products / services categories as part of the
business process of organizations, b. The determination of the life cycle phase and the prospects of development towards
maturity of these products and services (the vertical process), c. The regional spread of applications and (to a lesser extent) research and development (the
horizontal process), d. The optimal mix of marketing (capacity building and brokerage) efforts to support speeding
up the vertical (towards application) and horizontal (towards replication) process for each products / services category.
Recommendations
See the action points mentioned in the summary and section 5 and 6.


APPENDICES
APPENDIX 1 - PROJECT SUMMARY
The purpose of the GEO Network for Capacity Building (GEONetCab) project is to create the conditions for the improvement of, and an increase in the GEO capacity building activities and framework, with special emphasis on developing countries, on new EU member states (and EU neighbouring states), and on climate monitoring. The ultimate goal of the project will be to improve the effectiveness and efficiency of GEO capacity building for application in the GEO societal benefit areas. Coincidental, successful brokerage with (potential) clients for earth observation products and services will be facilitated.
The project will deliver the following output:
1. Identification of capacity building needs in earth observation (at a generic and global level, but with emphasis on the target regions).
2. Description of specifications for earth observation capacity building. 3. Identification of resource providers. 4. Establishment of sustainable brokerage between stakeholders (including resource
providers). 5. Establishment of a mechanism to facilitate cooperation between stakeholders and
providers is established. 6. Establishment of a global base of technical expertise for education and training in earth
observation (with emphasis on developing countries, new EU member states and climate monitoring).
7. Creation of monitoring and evaluation mechanisms to determine the efficacy of GEO capacity building efforts.
To achieve maximal impact demonstration projects will be carried out in Southern Africa, the French-speaking countries in Africa, and Central and Eastern Europe, with spin-offs to EU neighbouring countries and Latin America and Asia. The three-year project) will be carried out by a well balanced consortium of partners from the Netherlands, France, South Africa, Morocco, Czech Republic and Poland, supervised by an advisory board with a worldwide representation and strong connections to GEO.
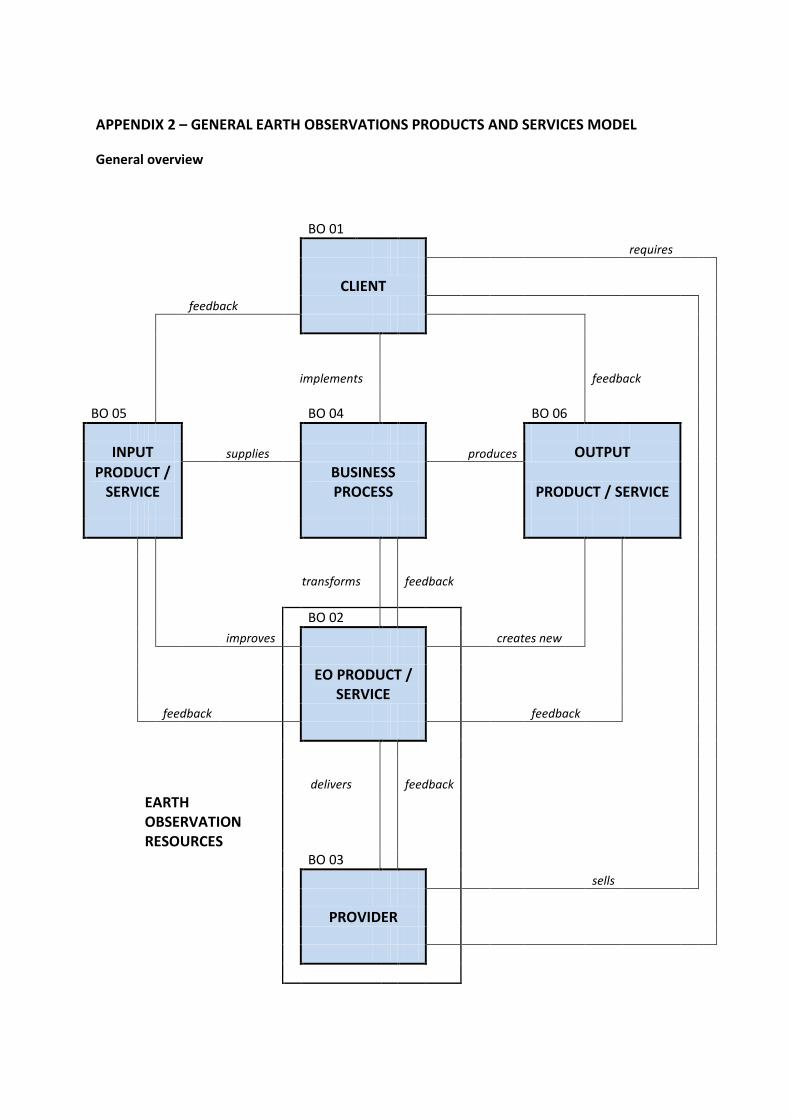
APPENDIX 2 – GENERAL EARTH OBSERVATIONS PRODUCTS AND SERVICES MODEL
General overview
BO 01 requires CLIENT feedback
implements feedback BO 05 BO 04 BO 06
INPUT supplies produces OUTPUT PRODUCT /
SERVICE BUSINESS PROCESS PRODUCT / SERVICE
transforms feedback
BO 02 improves creates new
EO PRODUCT /
SERVICE feedback feedback
delivers feedback
EARTH OBSERVATION RESOURCES
BO 03 sells PROVIDER
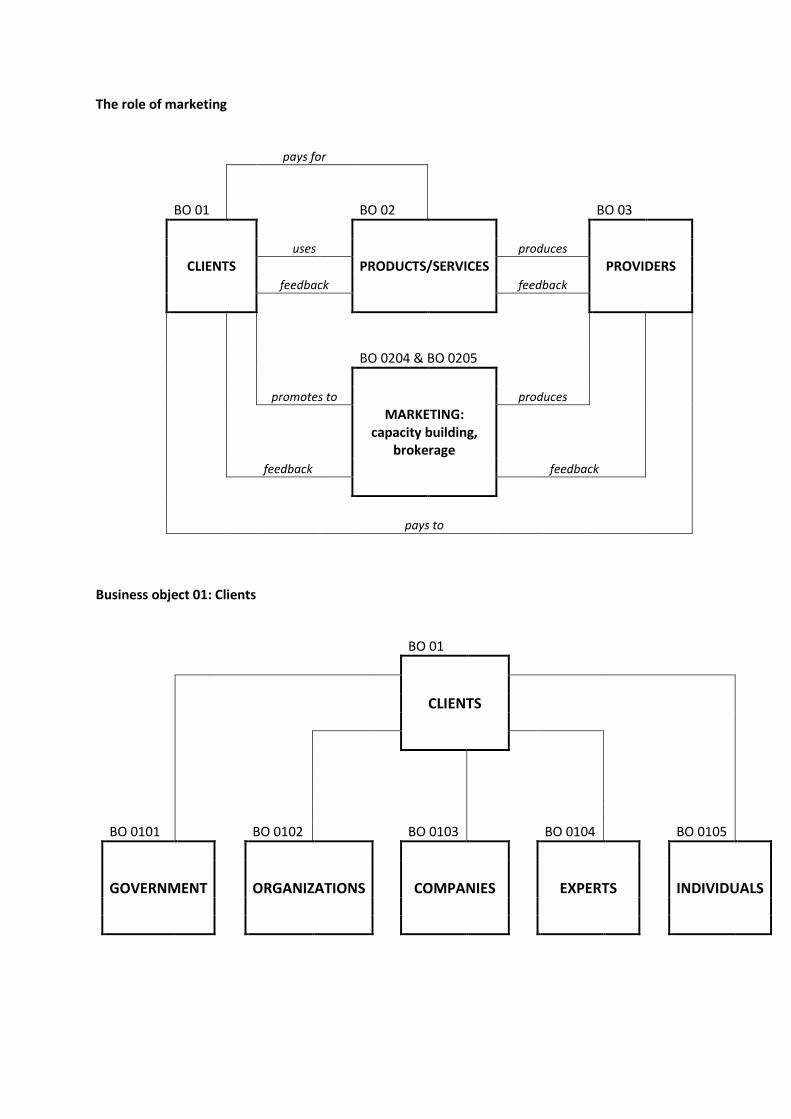
The role of marketing
pays for BO 01 BO 02 BO 03 uses produces CLIENTS PRODUCTS/SERVICES PROVIDERS feedback feedback BO 0204 & BO 0205 promotes to produces
MARKETING: capacity building,
brokerage feedback feedback pays to
Business object 01: Clients
BO 01 CLIENTS BO 0101 BO 0102 BO 0103 BO 0104 BO 0105 GOVERNMENT ORGANIZATIONS COMPANIES EXPERTS INDIVIDUALS
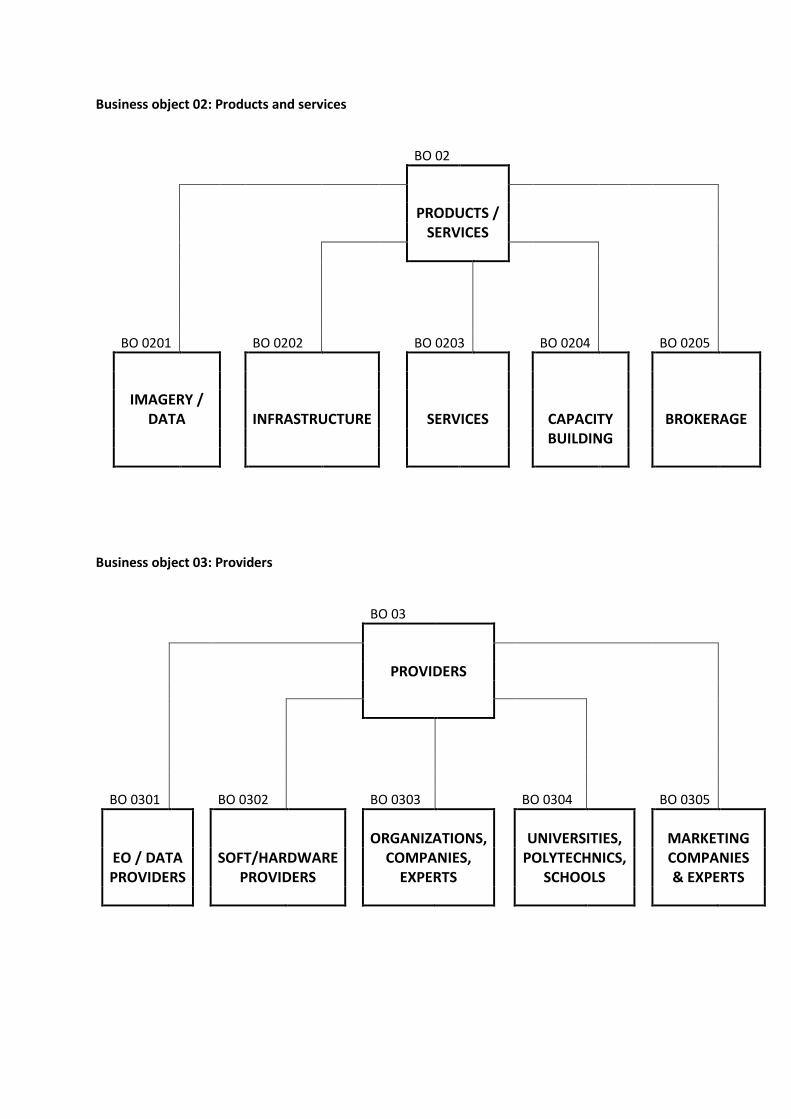
Business object 02: Products and services
BO 02 PRODUCTS / SERVICES BO 0201 BO 0202 BO 0203 BO 0204 BO 0205
IMAGERY /
DATA INFRASTRUCTURE SERVICES CAPACITY BROKERAGE BUILDING
Business object 03: Providers
BO 03 PROVIDERS BO 0301 BO 0302 BO 0303 BO 0304 BO 0305 ORGANIZATIONS, UNIVERSITIES, MARKETING EO / DATA SOFT/HARDWARE COMPANIES, POLYTECHNICS, COMPANIES PROVIDERS PROVIDERS EXPERTS SCHOOLS & EXPERTS
APPENDIX 3 –DESCRIPTION OF THE EARTH OBSERVATION RESOURCES MODEL
Update of the GEONetCab UML Model (February 2011)
MDWEB IMPLEMENTATION
The design of Mdweb has been established as a result of previous model reviewing, and is based on GNC RessourceSpecivicationV3 and different corrections proposed between April and June 2010. The original Mdweb objectives will be recalled and the implemented model described.
OBJECTIVES AND CONTENT OF THE GEONETCAB RESOURCES DATABASE
One of the objectives of the GEONetCab project is to popularize earth observation products with potential users. A way of doing this is to disseminate information about these products and the uses they may have, thus improving their visibility and accessibility.
To this end, it is proposed to build a prototype around a database of information on these products and services. This prototype will connect to the database via a web application for searching, browsing and accessing descriptions of relevant resources and, possibly, even the resources themselves.
The database’s content will consist of descriptions of various existing resources relating to earth observation products and services, to their uses, and to related institutions. The latter could be involved in the acquisition process, pre-processing, production, interpretation or even just the use of these products or services.
To begin with, earth observation products/services and associated information will be described with a view to providing information on their characteristics, their content and their access conditions for potential users (user status; usage restrictions, mainly temporal and spatial). There will be references to information from institutional producers thus allowing cross-referenced product-supplier-user searches.
In fact, GEONetCab defined seven resources relating to earth observations:
• Organisation Entities • EO products • Services • Software • Training • References (Success stories) • Documents
Each of these resources has been implemented in Mdweb, to permit data entry according to the UML
model presented below.
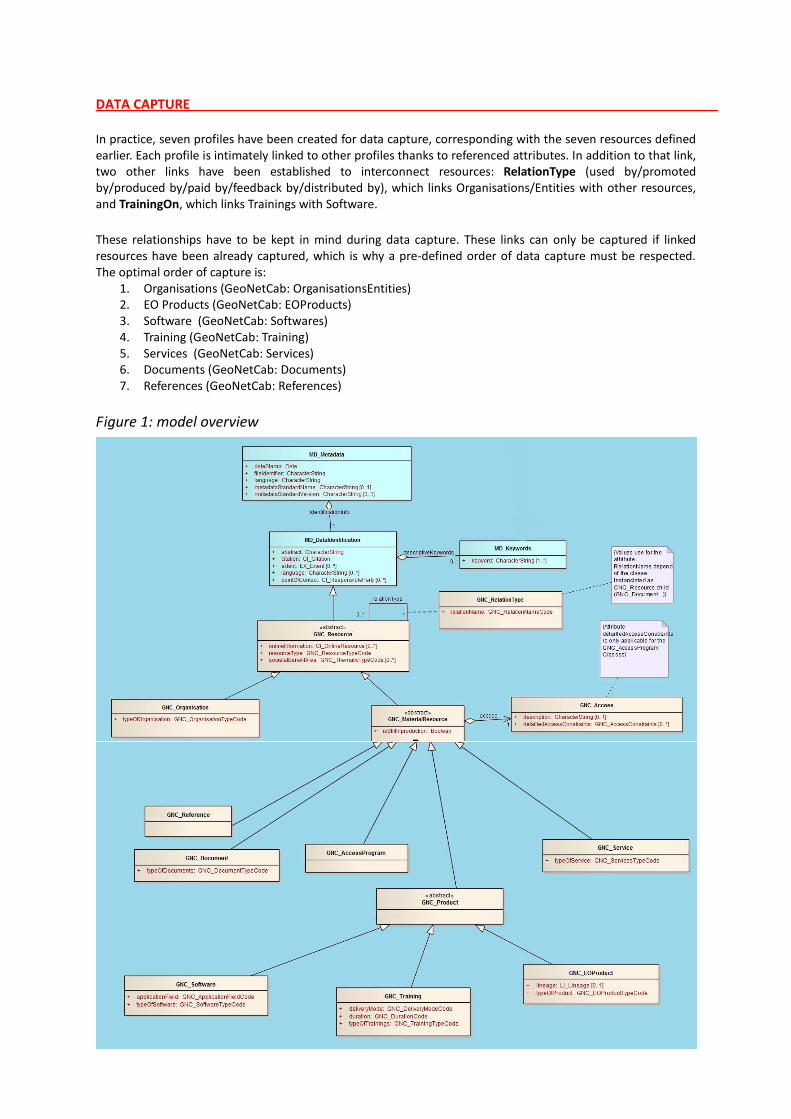
DATA CAPTURE
In practice, seven profiles have been created for data capture, corresponding with the seven resources defined earlier. Each profile is intimately linked to other profiles thanks to referenced attributes. In addition to that link, two other links have been established to interconnect resources: RelationType (used by/promoted by/produced by/paid by/feedback by/distributed by), which links Organisations/Entities with other resources, and TrainingOn, which links Trainings with Software.
These relationships have to be kept in mind during data capture. These links can only be captured if linked resources have been already captured, which is why a pre-defined order of data capture must be respected. The optimal order of capture is:
1. Organisations (GeoNetCab: OrganisationsEntities) 2. EO Products (GeoNetCab: EOProducts) 3. Software (GeoNetCab: Softwares) 4. Training (GeoNetCab: Training) 5. Services (GeoNetCab: Services) 6. Documents (GeoNetCab: Documents) 7. References (GeoNetCab: References)
Figure 1: model overview
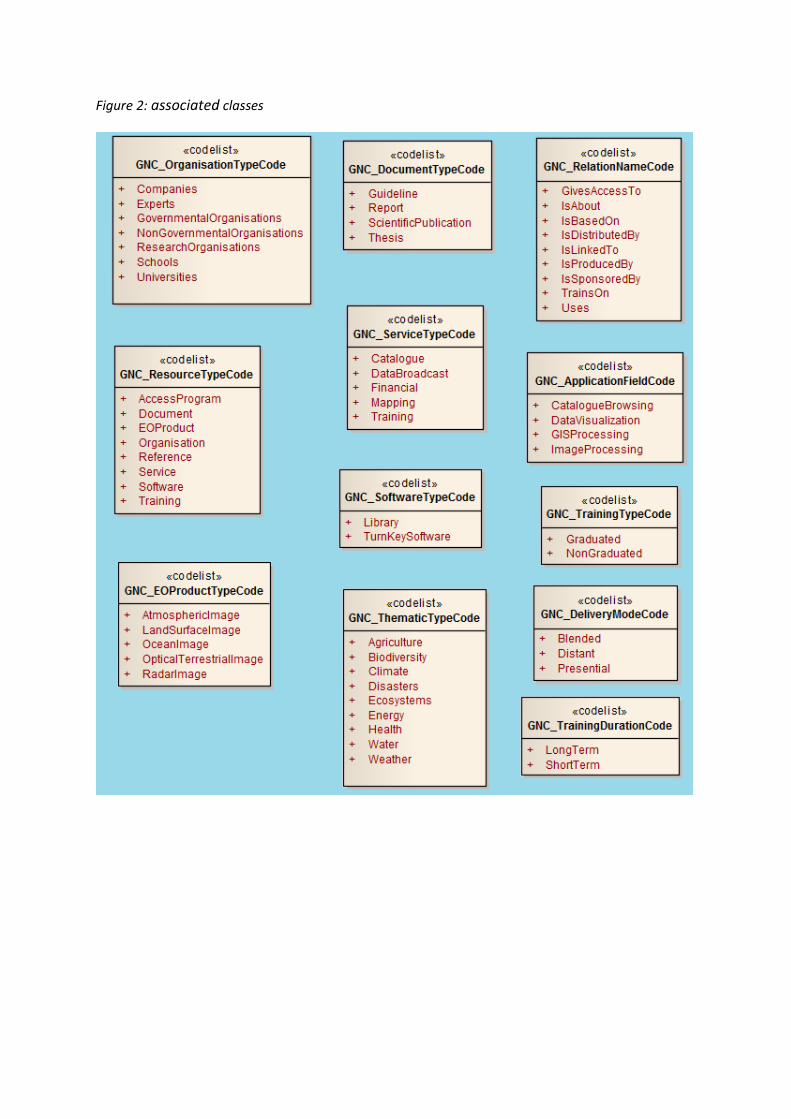
Figure 2: associated classes
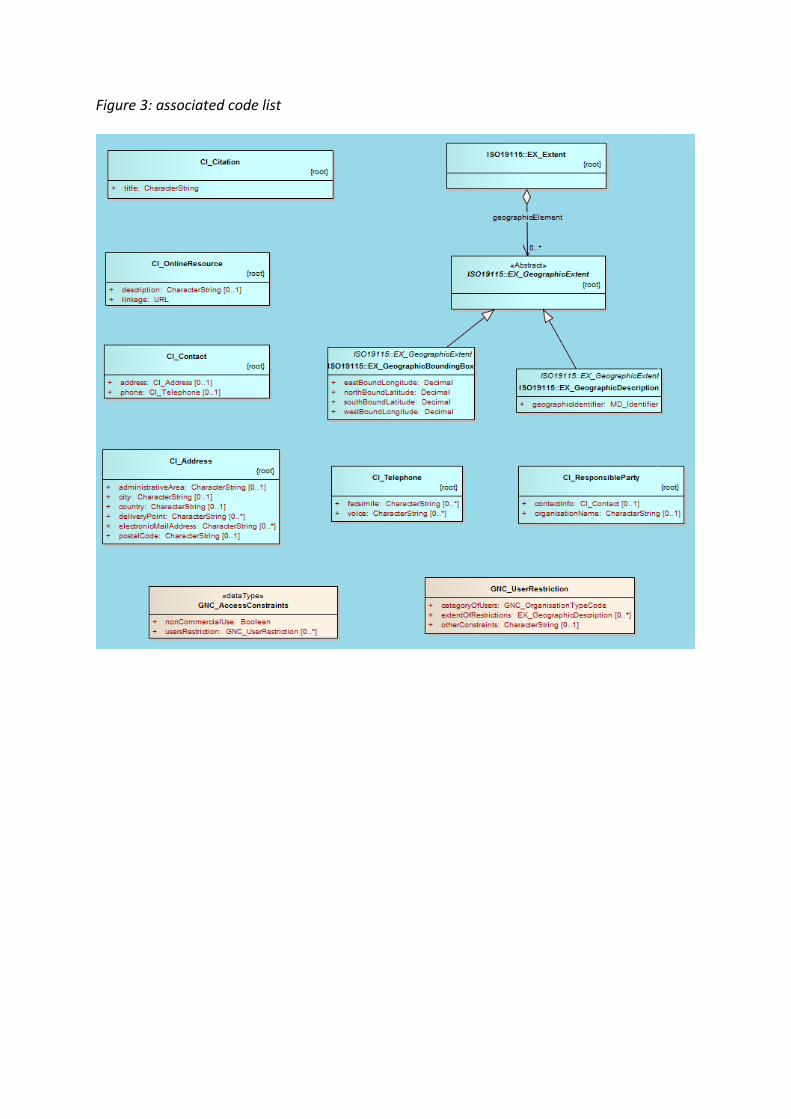
Figure 3: associated code list
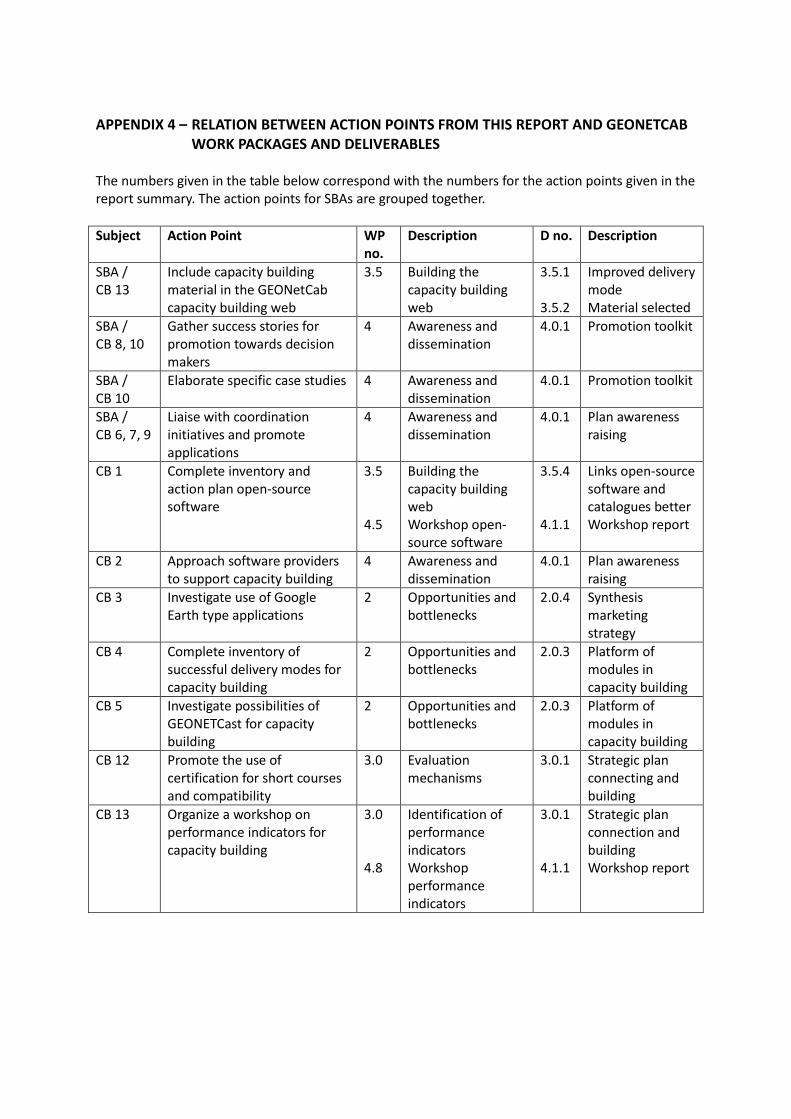
APPENDIX 4 – RELATION BETWEEN ACTION POINTS FROM THIS REPORT AND GEONETCAB
WORK PACKAGES AND DELIVERABLES The numbers given in the table below correspond with the numbers for the action points given in the report summary. The action points for SBAs are grouped together. Subject Action Point WP
no. Description D no. Description
SBA / CB 13
Include capacity building material in the GEONetCab capacity building web
3.5 Building the capacity building web
3.5.1 3.5.2
Improved delivery mode Material selected
SBA / CB 8, 10
Gather success stories for promotion towards decision makers
4 Awareness and dissemination
4.0.1 Promotion toolkit
SBA / CB 10
Elaborate specific case studies 4 Awareness and dissemination
4.0.1 Promotion toolkit
SBA / CB 6, 7, 9
Liaise with coordination initiatives and promote applications
4 Awareness and dissemination
4.0.1 Plan awareness raising
CB 1 Complete inventory and action plan open-source software
3.5 4.5
Building the capacity building web Workshop open-source software
3.5.4 4.1.1
Links open-source software and catalogues better Workshop report
CB 2 Approach software providers to support capacity building
4 Awareness and dissemination
4.0.1 Plan awareness raising
CB 3 Investigate use of Google Earth type applications
2 Opportunities and bottlenecks
2.0.4 Synthesis marketing strategy
CB 4 Complete inventory of successful delivery modes for capacity building
2
Opportunities and bottlenecks
2.0.3 Platform of modules in capacity building
CB 5 Investigate possibilities of GEONETCast for capacity building
2 Opportunities and bottlenecks
2.0.3 Platform of modules in capacity building
CB 12 Promote the use of certification for short courses and compatibility
3.0 Evaluation mechanisms
3.0.1 Strategic plan connecting and building
CB 13 Organize a workshop on performance indicators for capacity building
3.0 4.8
Identification of performance indicators Workshop performance indicators
3.0.1 4.1.1
Strategic plan connection and building Workshop report
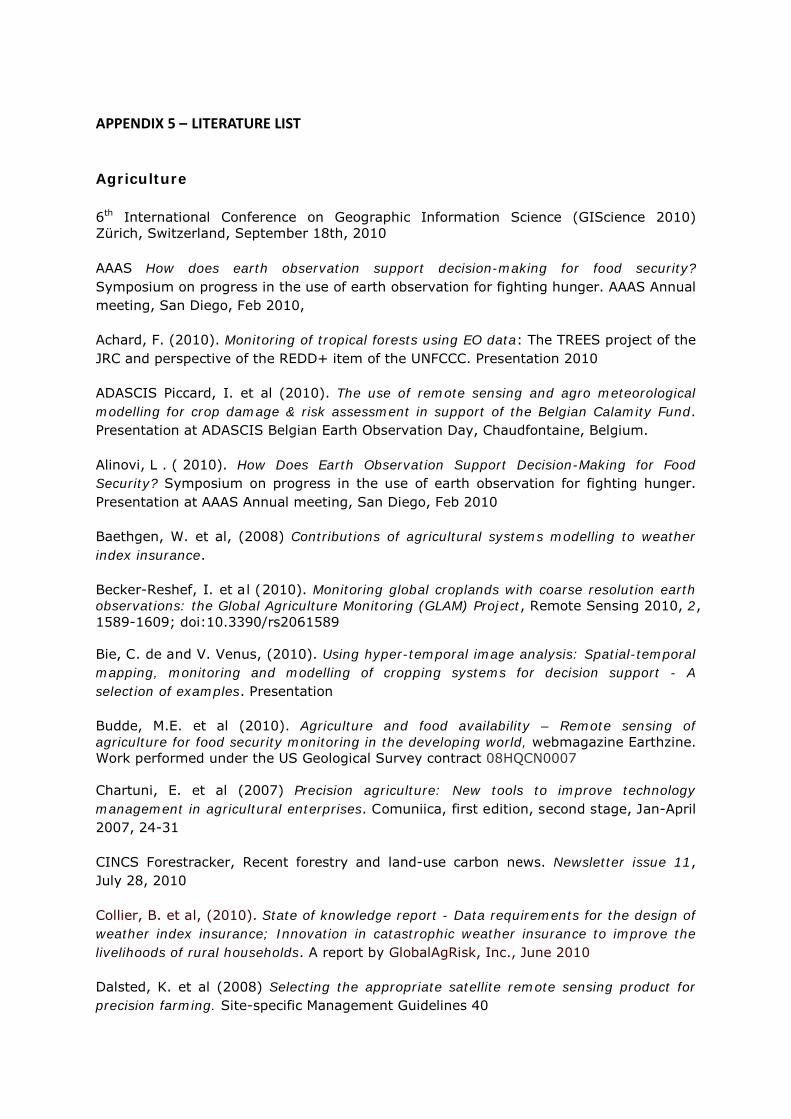
APPENDIX 5 – LITERATURE LIST Agriculture
6th International Conference on Geographic Information Science (GIScience 2010) Zürich, Switzerland, September 18th, 2010
AAAS How does earth observation support decision-making for food security? Symposium on progress in the use of earth observation for fighting hunger. AAAS Annual meeting, San Diego, Feb 2010,
Achard, F. (2010). Monitoring of tropical forests using EO data: The TREES project of the JRC and perspective of the REDD+ item of the UNFCCC. Presentation 2010
ADASCIS Piccard, I. et al (2010). The use of remote sensing and agro meteorological modelling for crop damage & risk assessment in support of the Belgian Calamity Fund. Presentation at ADASCIS Belgian Earth Observation Day, Chaudfontaine, Belgium.
Alinovi, L . ( 2010). How Does Earth Observation Support Decision-Making for Food Security? Symposium on progress in the use of earth observation for fighting hunger. Presentation at AAAS Annual meeting, San Diego, Feb 2010
Baethgen, W. et al, (2008) Contributions of agricultural systems modelling to weather index insurance.
Becker-Reshef, I. et al (2010). Monitoring global croplands with coarse resolution earth observations: the Global Agriculture Monitoring (GLAM) Project, Remote Sensing 2010, 2, 1589-1609; doi:10.3390/rs2061589
Bie, C. de and V. Venus, (2010). Using hyper-temporal image analysis: Spatial-temporal mapping, monitoring and modelling of cropping systems for decision support - A selection of examples. Presentation
Budde, M.E. et al (2010). Agriculture and food availability – Remote sensing of agriculture for food security monitoring in the developing world, webmagazine Earthzine. Work performed under the US Geological Survey contract 08HQCN0007
Chartuni, E. et al (2007) Precision agriculture: New tools to improve technology management in agricultural enterprises. Comuniica, first edition, second stage, Jan-April 2007, 24-31
CINCS Forestracker, Recent forestry and land-use carbon news. Newsletter issue 11, July 28, 2010
Collier, B. et al, (2010). State of knowledge report - Data requirements for the design of weather index insurance; Innovation in catastrophic weather insurance to improve the livelihoods of rural households. A report by GlobalAgRisk, Inc., June 2010
Dalsted, K. et al (2008) Selecting the appropriate satellite remote sensing product for precision farming. Site-specific Management Guidelines 40
Dauwe, T. and E. Swinnen, (2010). Presentation of the Be-REDD-I, Development of Belgian REDD Information Systems
The State of Food and Agriculture- Livestock in the balance. FAO report (2009)
EARS Food early solutions for Africa – Micro-insurance. Abstract of FESA report, 2010
Eliasson, A., R. Jones, F. Nachtergaele, D. Rossiter et al (2010) Common criteria for the redefinition of intermediate less favoured areas in the European Union. In: Environmental science and policy, (2010) IN PRESS, 12 p.
ESA Rice mapping using radar from space. Earth Observation services today. Sarmap, Synopsis and RADARSAT, 2002
Eyes in the sky aid crop insurers (2005). In: Spotlight
FAO “e-Agriculture”, a definition and profile of its application. A ‘statement’ in: Bridging the rural digital divide. 2005
FAO Foresty Dept. Ridder, R.M. Global forest resources assessment 2010: options and recommendations for a global remote sensing survey of forests, 2007
FAO GIEWS The global information and early warning system on food and agriculture. Brochure
FAO The global forest resource assessment FRA2010 and remote sensing survey. FAO presentation, 2008
FAO, JRC, SDSU and UCL The 2010 Global Forest Resources Assessment Remote Sensing Survey: an outline of the objectives, data, methods and approach. Forest Resources Assessment Working Paper 155. Published by FAO with FRA RSS partners, Rome, 2009
FAO-GIEWS Workstation EC-FAO Food security information for action programme. Presentation
FEWSNET Famine Early Warning Systems Network: Southern Africa Food Security Outlook, January to June 2010
GEO 2 009-2011 W ork P lan, AG -07-03c T ask sheet on Expanding earth observation applications in agriculture and promoting capacity building in developing countries, 2009
GEO Summary of the GEO Forest monitoring symposium, Foz do Iguaçu, Brazil, Nov 2008
GEO Survey on Synthetic Aperture Radar (SAR) to support agricultural monitoring, May 2009
Geospatial applications in precision farming with TNTmips
GIEWS World Wide Watch: Earth observation products for FAO operational locust habitat monitoring and for GIEWS agriculture monitoring, Belgian earth observation day. Chaudfontaine, Belgium, May 2010
GMES FP7 Land Monitoring Core Service: Fast Track Service Land. Prague, March 2009
GMES Kopernikus-Land M onitoring C ore S ervice. G OFC-GOLD Workshop on accuracy assessment of land cover change & area estimates, Jena, Germany, Oct 2008
GMES Land User Newsletter, issue 11, March 2010
GMES Land User Newsletter, issue 12, July 2010
GMFS Global Monitoring for Food Security. Core user needs and user standards dossier. Dec 2008
GMFS Global Monitoring for Food Security. Enhancing food security monitoring in sub Saharan Africa. Presentation, 2008
GMFS Global Monitoring for Food Security. GMFS Final report stage 1 and stage 2, Dec 2009
GMFS Global Monitoring for Food Security. Promotion and training plan. Aug 2008
Government of Western Australia, Western Australian Agriculture climate science update 2010, Department of Agriculture and Food, Government of Western Australia
GTOS ECV-T10 Fraction of Absorbed Photosynthetically Active Radiation (FAPAR). Draft report version 8, May 2009
GTOS ECV-T11 Leaf area index. Draft report version 10, May 2009
GTOS ECV-T12 Biomass: Assessment of the status of the development of standards for the Terrestrial Essential Climate Variables. Draft report version 8, Nov 2008
GTOS ECV-T13 Fire disturbance. Draft report version 24, Nov 2008
GTOS ECV-T8 Albedo and reflectance anisotropy. Report version 12, May 2009
GTOS ECV-T9 Land cover. Draft report version 10, Nov 2008
Haruyama, Y . (RESTEC, Ja pan) ( 2010) Mapping and Monitoring Emission from Deforestation and Degradation in Indonesia Presentation GEO-VII/UES, Beijing, China
Huber, S. et al (2009). Improving early warning systems for food security in Africa with geostationary earth observation data. IOP Conf. Series: Earth and Environmental Science 6 (2009) 472007, doi:10.1088/1755-1307/6/7/472007
HYPERFOREST Advanced LiDAR & airborne hyperspectral remote sensing to support forest management. Presentation, 2010
Imran, M. (2010) SDI-based architecture for integrated agricultural assessments and decision-making by farmer communities in Sub-Saharan Africa. GI Science Doctoral Colloquium
INCOIS T he Indian N ational C entre f or O cean I nformation S ervices. Satellite-based Fishing, www.incois.gov.in
INPE Almeida, C.A. et al (2009). Metodologia para mapeamento de vegetação secundária na Amazônia Legal. Technical report of Instituto Nacional de Pesguisas Espaciais (INPE), São José dos Campos, Brasilia
IOCCG7 Ocean-colour radiometry and fisheries. Wilson, C. et al (eds). Report of the Working Group on Ocean-Colour Radiometry and Fisheries, No 6, Dartmouth, Canada, 2008
IOCCG7 Why ocean Colour? The societal benefits of ocean-colour technology.
ISRO Indian Space Research Organisation, Space technology enabled Village Resource Centre (VRC). July 2007
Jochem, A., M. Hollaus, M. Rutzinger and B. Höfle. ( 2010) Estimation of Aboveground Biomass in Alpine Forests: A Semi-Empirical Approach Considering Canopy Transparency Derived from Airborne LiDAR Data. Article in Sensors 2011, 11
Johnson, S.P., (2010) Geospatial Applications in Agriculture and Global Food Security: an NGA and USDAP project success, Earthzine
Justice, C., O. Leo, Wu Binfang, Jai Singh Parihar (2010) GEO TASK AG‐07‐03a: Global Agricultural Monitoring. CoP Presentation, November 1-2, 2010, Beijing, China
Kirtman, B. et al (2007). WCRP Position Paper on Seasonal Prediction. Report from the First W CRP S easonal Prediction W orkshop, 4-7 Ju ne 20 07, B arcelona, Spa in. WCRP Informal Report No. 3/2008, ICPO Publication No. 127
Lebeau J. (2010) Biosphere Reserve of Manambolo: Reforestation as a tool for Madagascar Rural Development. Article Planet Action, Project detail
Li Zengyuan (2010) Introduction of Forest Mapping Activities in the Asia-Pacific Region. Presentation I nternational W orkshop on F orest M onitoring in S upport o f S ustainable Forest Management in the Asia-Pacific Region, 29-30 April, Beijing
Liaghat, S. and Balasundram, S.K. (2010). A Review: The Role of Remote Sensing in Precision Agriculture. American Journal of Agricultural and Biological Sciences 5 (1): 50-55, 2010. ISSN 1557-4989
MARS EC-JRC Pasture bulletin. Abundant rainfall and average temperatures in southern Europe generated a favourable situation; a delay in development and dry soil conditions affected production levels in Ireland, western UK and northern Germany. Report number 1/2010, Jan-May 2010
Massart, M., F. Rembold, O. Rojas, and O. Leo (2010) The Use of Remote Sensing Data and Meteorological Information for Food Security Monitoring, Examples in East Africa. Chapter in Advances in Earth Observation of Global Change. 1st Edition
Milesi, C. et al (2010). Decadal variations in NDVI and food production in India, Remote Sensing 2010, 2, 758-776; doi: 10.3390/rs2030758
Miner, R. (2010) Impact of the global forest industry on atmospheric greenhouse gases. FAO Forestry paper 159
NASA Annual report Oct 2007 – Sept 2008: Enhancing USAID Famine and Malaria Early Warning with NASA Earth Science Results. NASA Science Mission Directorate, Cooperative Agreement Notice N N-H-04-Z-YO-010-C “Decision support through e arth science results”
NLWIS T he N ational L and a nd W ater Information S ervice, A griculture a nd A gri-food Canada. Where we’re at! project update. Canadian Interoperability Day, 20 April 2010
Pattabhi Rama Rao, E. et al (2008). ODIS Ocean Data and Information System and web based services. The International Archives of the Photogrammetry, Remote Sensing and Spatial Information Sciences. Vol. XXXVII. Part B4. Beijing 2008, 697-702
Platt, T., et al (eds.). Report of the International Ocean-Colour Coordinating Group, No. 7, IOCCG, Dartmouth, Canada, 2008
Regional agricultural monitoring systems, overview. 2010
Report of the first GEO Forest monitoring symposium, GOFC-GOLD report no 37, Foz do Iguaçu, Brazil, Oct 2007
Romaguera, M. et al (2010). Potential of using remote sensing techniques for global assessment of water footprint of crops, Remote S ensing 2010, 2, 1177-1196; doi:10.3390/rs2041177
Royer, A., C. Tote, S. Gilliams, L. Bydekerke. (2009) GMFS South Sudan CFSAM Support Kit for JRC. GMFS Report Southern Sudan
SAFARI International symposium remote sensing and fisheries, report. Kochi, India. 15–17 February, 2010
SAFARI Symposium on Remote Sensing and Fisheries. Abstract List, Kochi, India, 2010
SAFARI, Forget, M.-H. et al (2010) Societal applications in fisheries and aquaculture using remotely-sensed imagery – the SAFARI project. Paper at SAFARI Symposium, Kochi, India, 2010
Sekhar Panda, S. et al (2010). Application of vegetation indices for agricultural crop yield prediction using neural network techniques, Remote S ensing 2010, 2, 6 73-696; doi:10.3390/rs2030673
Shapiro, M.A. et al (2010). An earth-system prediction initiative for the 21st Century (preliminary PDF of the author-produced manuscript to be published in) Bulletin of the American Meteorological Society. doi: 10.1175/2010BAMS2944.1
Shen, Fang: Zhou, Yun-Xuan: Li, Dao-Ji; Zhu, Wei-Jian and Salama, Mhd Suhyb. (2010) Medium resolution imaging spectrometer (MERIS) estimation of chlorophyll-a concentration in the turbid sediment-laden waters of the Changjiang (Yangtze) Estuary. International Journal of Remote Sensing Vol. 31, Nos. 17–18, September 2010, 4635–4650
Solanki, H.U. et al (2008). Fish habitat mapping; Satellite observations of main oceanographic processes to identify ecological associations in the Northern Arabian sea
for fishery resources exploration. Hydrobiologia 2008, 612:269–279, doi 10.1007/s10750-008-9496-8
Souza, C. Jr. (2006) Imazon’s (NGO) perspective on earth observations capacity building. Presentation.
SPARSSO - Bangladesh Space Research & Remote Sensing Organization, presentation at APRSAF-16, Bangkok, January 26, 2010
Sridhara Murthi, K.R., et al (2007). Organizational systems, commercialization and cost–benefit analysis of Indian space programme, Current Science 2007, 93-12, 1812-1822
The State of Food Insecurity in the World - Addressing food insecurity in protracted crises. FAO report 2010
Sullivan, C. et al (2006). Mapping the Links between Water, Poverty and Food Security. Report on the Water Indicators workshop held at the Centre for Ecology and Hydrology, Wallingford, UK, 16 to 19 May, 2005. GWSP Issues in GWS Research, No.1. GWSP IPO, Bonn. Available at: www.gwsp.org.
The G8 Forest experts’ report on illegal logging, May 2008
The World Bank Forests sourcebook: practical guidance for sustaining forests in development cooperation. In series: Agriculture and rural development. World Bank, 2008. doi: 10.1596/978-0-8213-7163- 3
UN Food and Agriculture Organization Climate change and food security, a Framework document, 2008
UN World Food Programme - VAM Food Security Analysis (2008). Kingdom of Cambodia, Comprehensive Food Security and Vulnerability Analysis (CFSVA)
UNEP-SERVIR Cherrington, E.A. et al (2010). Forest cover and deforestation in Belize 1980-2010. Project report
US-AID: Special brief: Revising the FEWS NET food insecurity severity scale, Sept 2010
USDA United State Dept of Agriculture. Shapouri, S., Food security assessment 2010-20, a report from the Economic Research Service (GFA-21), July 2010
WCRP Climate Variability and Predictability (CLIVAR) contribution to World Climate Research Program (WCRP) strategic framework, 2009
World Bank Sustainable land management sourcebook: Agriculture and rural Development. DOI: 10.1596/978-0-8213-7432-0, 2008
Wulder, M.A. (2006) Satellite land cover mapping of Canada’s forests: the EOSD land cover project. Proceedings of the North American land cover summit, Ch 3, 21-30
Biodiversity
Doko T., et al Identifying habitat patches and potential ecological corridors for remnant Asiatic black bear (Ursus thibetanus japonicus) populations in Japan Ecological Modelling (2010) Elsevier (14 pages)
GBIF Providing means for evaluating the impact of climate change on crop wild relatives. Poster, 2010
GBIF The GBIF data portal, a practical hands-on tutorial. A web publication by Global Biodiversity Information Facility, 2007
GEO BON Geobon detailed implementation plan 2010, Version 1.0, 2010
GEO B ON The Geo Biodiversity Observation Network, p resentation a t International workshop for networking biodiversity observation activities in Asia Pacific region, Nagoya, 2009
GEOSS Architecture Implementation Pilot, Phase 2. Arctic Food Chain. Climate Change and Biodiversity, WG Use Scenario Engineering Report. 2009
GISIN Global invasive species Information network, factsheet 2010
Guerra, C., et al The Rationale behind the Biodiversity Information System for North Portugal: The Path for a Strategic and Collaborative Biodiversity Information System posted on December 22nd, 2010 in Articles, Biodiversity, Earth Observation, Ecosystems, GEOSS/ICEO News, Technology
Hall, R.J. et al (2009). Creating a national forest biomass map of Canada by integrating satellite data and models. P resentation g iven a t th e GOFC-GOLD B iomass m eeting, Canadian Forest Service, 2009
Janetos, A. C. and Townshend. J .R. (2005) Integrated Global Observations of the Land (IGOL) – an IGOS-P Theme, Special meeting on observational priorities for conservation and biodiversity, (3rd-4th November 2005), John Heinz III Centre, Washington DC., USA, IGOL Report No. 4.
Parr, T.W. et al, The selection of Biodiversity indicators for EBONE Development Work, Version 2.12, 2010
Planet Action Satellites: An Eye on the Oceans; Crisis Point article (2004)
Smith, G. (2007). GMES and the UK Countryside Survey programme. Presentation given at GEOLAND Forum, Section for Earth Observation of the Centre of Ecology and Hydrology, 2007, Monkswood, U.K.
Strand, H., Höft, R., Strittholt, J ., Miles, L ., Horning, N., Fosnight, E., Turner, W., eds. (2007). Sourcebook on remote sensing and biodiversity indicators. Secretariat of the Convention on Biological Diversity, Montreal, Canada, Technical Series no. 32,
Turner, W. (2010). The integration imperative redrawing the lines to invigorate research and spark applications, a presentation given at NASA Biodiversity and Ecological Forecasting Team Meeting, 2010, Washington DC, USA
Underwood, E., Trends in invasive alien species, i n: S trand, H ., Höft, R ., S trittholt, J ., Miles, L., Horning, N., Fosnight, E., Turner, W., eds. (2007). Sourcebook on remote sensing and biodiversity indicators. Secretariat of the Convention on Biological Diversity, Montreal, Canada, Technical Series no. 32, 161-177
UNEP Biodiversity and climate change on t he o ccasion o f t he International D ay f or Biological Diversity, brochure, 2007
UNEP Guidelines for biodiversity assessment and monitoring for protected areas, brochure, 2005
USGS Ecological forecasting: Agenda for the future. Brochure published by USGS Committee on Environment and Natural Resources, subcommittee on ecological systems
USGS factsheet 2007-3040 Land cover applications, landscape dynamics, and global change, 2007
Yanda, P .Z., (2008) Potential use of GBIF-like data for assessing impact of climate on biodiversity in Africa: Need for capacity building, a presentation given at the 6th Annual GBIF Science Symposium, 2008, Arusha, Tanzania
Capacity building
Anh V. (2010) Best tool for remote sensing search and ordering, Pp 1-6
APN Activities: Scientific Capacity Building/Enhancement for Sustainable Development in Developing Countries (CAPaBLE), Program information (2010)
BC-CARMS LiDAR – Overview of Technology, Applications, Market Features & Industry (2006)
BGR Ranke, U. (2008) GEOSS Capacity Development Global Earth Observation System of Systems Hannover, Germany, Pp 1- 48
BGR Ranke, U. (2007) Capacity building in GEOSS, Abstract, Pp 1-8
Canada Centre for Remote Sensing Fundamentals of Remote Sensing Tutorial
CSIRO Minchin S. (2010) Participation, Visualization, Collaborative Infrastructure and Games: New approaches to user engagement with earth observation in the Australasian region Presentation, Pp 1-17
Dadhwal V .K. (2009) Capacity Building in use of Geoinformatics for Disaster Risk Reduction: Experience of IIRS, India Presentation for UNESCAP/ APCiCT International Conference ‘Building a Local Government A lliance for Disaster R isk Reduction’ & Expert
Group Meeting on ICT for Disaster Risk Reduction 11-13 August 2009, Incheon, Republic of Korea, Pp 1-22
Dam, ten G., T. Loran and F. Paats (2010) ITC's joint education program focusing on capacity building: main findings internal reviews and ideas for new policy: powerpoint. In: ISPRS 2010: ISPRS mid - term symposium commission VI: cross - border education for global g eo - information: I TC, Enschede, t he N etherlands, 2 -4 Ju ne 2 010. - [s.l.]: International Society for Photogrammetry and Remote Sensing (ISPRS), 2010. 25 slides
Deutsches Zentrum für Luft und Raumfahrt Mund J.P., Keuck J. et al (2009) Capacity Building for Earth Observation From rapid science to prepared society - A cross cutting approach Presentation, Pp 1-23
EnviroGRIDS Allenbach K. (2009) EnviroGRIDS remote sensing data use and integration guideline, Report FP7 European project Building Capacity for a Black Sea Catchment Observation and Assessment supporting Sustainable Development, Pp 1-90
ESA B équignon J. , Fe llous J. L. A tentative list of funding institutions and agencies potentially involved in R&D Support to GEO and GEOSS Article for the ST-09-01 Task group
ESA/ESRIN Sa rti F. ( 2010) Introduction to the ESA Earth Observation Programme Educational tools for schools Presentation EGU/GIFT 2010, Vienna, Austria 3 May 2010, Pp 1-52
European Commission Capacity Building within GEO Brochure ISBN 978-92-79-16599-3 doi 10.2777/22187 (2010)
European Commission Edwards A. (2010) The Group on Earth Observations (GEO) & the Global Earth Observation System of Systems: GEOSS Perspectives P resentation f or EuroGEOSS Workshop INSPIRE Conference 2010 Krakow, Poland 23 June 2010, Pp 1-25
Fauville G ., J. Hodin e t a l, ( 2010) Inquiry-to-Insight (I2I): An International Digital Environmental Education Project in Articles, Education, Technology, Pp 1-5
Foundation centre proposal writing short course, Course contents (2011)
GEO Introduction to GEO Capacity Building Performance Indicators Report V1.1 1011 Article
Gershenzon V.E. (2007) Scanex Research and Development Centre Remote Sensing data market trends Russia, Third Conference Earth from Space; The most effective solutions December 4-6 2007 Moscow Russia, Pp 1-16
Global Insights Inc. Johnson S. P. (2006) NOAA Sponsored 2005-2015 International Remote Sensing Research Overview Paper number 1045 Article, Pp 1–6
Global Insights Inc. Survey and Analysis of Remote Sensing Market Aerial and Spaceborne (2005)
Global M arketing I nc. Loy S . (2 009) 2008 Africa Remote Sensing Study Aerial and Spaceborne 10-Year Trends USGS 2008-2018 Africa Remote Sensing Study Presentation, Pp 1-18
Global Marketing Inc. Johnson S. (2009) 2008-2018 Africa Remote Sensing Study Paper Number 1021 Ohio USA
ITC GI Science and Earth Observation a process-based approach, ITC Educational Textbook series ISBN: 978-90-6164-293-0 (2010), Pp 1-536
ITC Molenaar M. From “Building Capacity” to “Building on Capacity” Presentation, Pp 1 – 25
ITC Molenaar M. Internationaal Hoger Onderwijs en Capacity Development: tot hier en nu verder, Presentation, Pp 1-29
ITC Molenaar M., Beerens I. (2005) From “Building Capacity” to “Building on Capacity” The example of the International GEO-Information Community. Dies rede 2005 Enschede, The Netherlands
ITC Report of the Executive Seminar Recognition of Cross-Border Capacity Building in Earth Observation 1 and 2 November 2007 ITC Enschede, The Netherlands (2007)
ITC Van der Werff H. (2010) Cross-border education in an international institute E-learning presentation for the EAGE Workshop GEO SKILL 2010 The challenges of Training and Developing E&P Professionals in the 21st century 29 September - 1 October 2010 Pau, France, Pp 1-22
Ivánová, I., O. Huisman et al (2010) Developing a distance education programming skills course f or G eo-Information S cience a nd Earth Observation S tudents P owerPoint presentations given at ISPRS Commission VI Symposium: Cross-Border Education for Global Geo-information, 2-4 June 2010, ITC, Enschede, The Netherlands Pp 1-6
Levine S. J. ( 2010) Guide for writing a funding proposal, tutorial http://learnerassociates.net/proposal/ Pp 1-20
Mercy Corps A rough Google Earth guide (2008)
Microsoft Corporation Gail W.B. (2007) Remote sensing in the coming decade: the vision and the reality Journal of Applied Remote Sensing, Vol. 1, 012505 (19 January 2007) Pp 1–19
Molenaar, M. and C. Mannaerts (2008) Capacity building networks for earth observation and GEO - ICT: a first step towards a virtual university. In: ISPRS 2008: Proceedings of the XXI congress: Silk road for information from imagery: the International Society for Photogrammetry and Remote Sensing, 3-11 July, Beijing, China. Comm. VI, WG VI/3. Beijing: ISPRS, 2008. pp. 93-96.
Molenaar, M. (2008) Rekenen aan onderwijs: VI in perspectief. In: Vi matrix, 16 (2008) 2, pp. 11.
Molenaar, M. (2008) Rekenen aan onderzoek: VI in perspectief. In: Vi matrix, 16 (2008) 5, pp. 9.
National S cience F oundation A guide for proposal writing NSF 0 4-016 http://www.nsf.gov/pubs/2004/nsf04016/nsf04016.pdf
Obe R .O., L. S . Hsu ( 2010) PostGIS in action MEAP Edition M anning Ea rly A ccess Program ©Manning Publications Co. www.manning.com, Pp 1-523
Rowland J., E. Wood et al. (2007) Review of Remote Sensing Needs and Applications in Africa: Executive Summary Report, Pp 1-16
SARMAP, ESA, UNESCO, BILKO, SAR Tutorial (2005)
Sentinel Asia Project Office Request for Proposals JAXA-AIT Mini Projects 2010/2011Call (2010)
Terralook TerraLook V2 short description, http://terralook.cr.usgs.gov/ (2011)
The Regional Environmental Centre Nebiu B (2002) Developing skills of NGOS project proposal writing ISBN: 963 9424 18 8, Pp 1 – 38
UNESCO IOC Principles and Strategy for Capacity Building TEMA TEMA Report No. 1 IOC/INF-1211 (2005)
United Nations Capacity-building in space science and technology Regional Centres for Space Science and Technology Education affiliated to the United Nations (2008)
United Nations United Nations Programme on Space Applications Brochure ST/SPACE/52V.09-88627 (2010)
University of Peradeniya M.Sc. in Disaster Management 2010/2011 (Conducted jointly by the PGIS and the Faculty of Engineering, University of Peradeniya) Course i nformation (2010)
USGS/FEWSNET Magadzire T.T. (2009) Capacity Building in Earth Observation Applications for Agricultural Monitoring in Africa and Central America a FEWSNET perspective Presentation, Pp 1-45
Uttinger A. L . ( 2005) Occupations in Remote Sensing A re port f or ES 7 71 Remote Sensing in the Earth Science Department at Emporia State University, Emporia Kansas USA, Pp 1-11
Veldkamp, A. (2010) Capacity building for food and water security: geospatial issues for science and policy makers: k eynote. In: AAR SE 20 10: 8 th in ternational c onference African Association of Remote Sensing of the Environment, AARSE, on earth observation for Africa's development agenda: conference proceedings, 25-29 October 2010, Addis Ababa, Ethiopia. - [s.l.]: [s.n.], 2010. - 163 p.; 28 cm. 36 slides.
Vliet, M. van, C. Kok et al (2009) Linking stakeholders and modellers in scenario studies: The use of Fuzzy Cognitive Maps as a communication and learning tool Article in Elsevier Futures 42 (2010) 1–14
Climate
Arndt, D. S., M. O. Baringer, and M. R. Johnson, Eds., 2010: State of the Climate in 2009. Bull.Amer.Meteor.Soc., 91-6, S1–S224
Ciais, P. Dolman, A.J., Dargaville, R. Barrie, L., Bombelli, A. Butler, J. Canadell, P., Moriyama, T. (2010) Geo Carbon Strategy Geo Secretariat Geneva,/FAO, Rome 48 pp.
Collins, J., et al, Radar instrumentation for operation ice bridge, Article Earthzine 2010, 10 pages
CSIS Earth observation for climate change, a report of the CSIS technology and Public Policy Program. Centre for Strategic and International Studies, 2010
Dangermond, J., et al, Climate Change is a Geographic Problem (the geographic approach to climate change), e-book ESRI June 2010, 40 pages
Dangermond, J., et al, ESRI, GIS for Climate Change, ESRI Press Release, GIS Best Practice, February 2010, 53 pages
Doherty, S., e t a l, Lessons learned from IPCC AR4, Scientific Developments needed to Understand, Predict, and Respond to Climate Change, Article for American Meteorological Society, April 2009, 17 pages
ESA P RODEX S olberg, R . e t al, CryoClim - A new system for cryospheric climate monitoring. Proposal, 2008
ESA PRODEX Solberg, R. et al, First results from the Cryoclim system for cryospheric climate monitoring, 2010
ESA SMOS helps understanding water cycle. GIM International, May 2010
Geibel, M.C. et al, (2010) A fully automated FTIR system for remote sensing of greenhouse gases in the tropics, Atmos. Meas. Tech. Discuss., 3, 3067–3103
GEOmon– Global Earth Observation and Monitoring. A prototype system for monitoring atmospheric composition for climate applications. www.geomon.eu Executive summary, 2007
GHG Global Greenhouse Gas Information System, Workshop on policy needs and current capabilities, Caltech, USA, 2008
GMES GSE PROMOTE U5 Core user needs dossier, version 12, 2006
GMES GSE PROMOTE U7 Service Utility Report, version 2, 2008
GOFC-GOLD A sourcebook of methods and procedures for monitoring and reporting anthropogenic greenhouse gas emissions and removals caused by deforestation, gains and losses of carbon stocks in forests, remaining forests and deforestation. GOFC-GOLD report version COP15-1 (GOFC-GOLD Project office, Natural Resources Canada, Alberta, Canada) 2009
GOSAT Greenhouse gases Observing SATellite, Yokota, T. Improving the global mapping of greenhouse gas sources and sinks.
GOSAT Greenhouse g ases Observing S ATellite. Hamazaki, T . Greenhouse gases Observation from space: overview of TANSO and GOSAT.
GTOS Permafrost and seasonally frozen ground, Version 13, Rome, 2009
Gurran, N. et al (2008) Planning for climate change: Leading practice principles and models for sea change communities in coastal Australia, prepared for the National Sea Change Taskforce
Janetor, A., Climate change, remote sensing and monitoring from space, presentation at the EastFire Conference, George Mason University, USA, 2007
Kay, R.C. and Travers (2008) A coastal vulnerability and adaptation assessment, Compendium of Coastal Resources, Tools & Methodologies
Kim, J . et a l, AsiaFlux – Sustaining ecosystems and people through resilience thinking, Observing, Predicting and Projecting Climate Conditions, Report Climate Sense, WMO, 2009
Kim, J ., HydroKorea - Understanding and nowcasting of ecohydrological cycles in complex landscapes of Korea. Abstract
Lajas, D. et a l, (2007) Aerosols and clouds: improved knowledge through space borne lidar measurements, ESA CALIPSO. Conference paper, American Meteorological Society
Mbui, J. M. (2007) Geo-Information science and earth observation for environmental modelling and management, MSc thesis, ITC, the Netherlands
Moriyama, T., et al, November 2010, The GEO Carbon strategy, Report for User Engagement Session, China National Convention Centre, Beijing, China, Group on Earth Observations (GEO), http://www.falw.vu/~dola/downloads.html, 17 pages
Mumby, P.J., (2001) Remote sensing and the management of Caribbean coral reefs. Technical report
Naishen Liang, Activities and results of CarboEastAsia, Joint meeting for GSWP/GLASS, AsiaFlux/FLUXNET, LandFlux-EVAL CEOP, Tsukuba, Japan, 22-25 June 2010
NASA OCO C risp, D ., Opportunities for Coordinated Observations of CO2 with the Orbiting Carbon Observatory (OCO) and Greenhouse Gases Observing Satellite (GOSAT). Technical report, 2009
NASA sponsored projects. Remote sensing of coral reefs, Overview of integrated collaborations, projects and products. http://eol.jsc.nasa.gov/Reefs/
Nobuko S., Networking flux measurements and inter-site comparison under CarboEastAsia program, Joint meeting for GSWP/GLASS, AsiaFlux/FLUXNET, LandFlux-EVAL CEOP, Tsukuba, Japan, 22-25 June 2010
2003
Oosterzee, P. van and S.T. Garnett (2008), Seeing REDD: issues, principles and possible opportunities in Northern Australia, Public Admin. Dev. 28, 386-392, 2008. doi: 10.1002/pad511
RECOFTC T he Centre f or People a nd Forests Forests and Climate change after Copenhagen, an Asia-Pacific perspective, ISBN 978-616-90183-0-, 2010
Red Cross/Red Crescent Climate Centre. Global La Niña Update and Background Information. www.climatecentre.org Aug 2010
REDD Launching of the REDD initiative in Tanzania. Tanzania REDD initiative, newsletter, issue 2, Jan 2010
REDD Regional REDD for the lower Mekong: A technical support body, Project concept, 2010?
REDD Strengthening national REDD+ readiness through regional collaboration; Lower Mekong subregion. REDD+ Workshop proceedings, Hanoi, May 2010
Shapiro, M., et al, October 2010, An earth-system prediction initiative for the twenty-first century, Article for American Meteorological Society, 12 pages
START Global change SysTem for analysis, research and training, START 2008-2009 Annual report, 2009
START Issue paper on capacity-building for adaptation to climate change, presented to the World Climate Conference-3 by START and UNESCO, Copenhagen, Sep 2009
The World Bank. Joint Departmental discussion paper – issue 1: Agricultural development under a changing climate: opportunities and challenges for adaptation, 2009
The World Bank. Managing climate risk integrating adaptation into World Bank Group Operations. Report, 2006
Trines, E. et al (2006) Climate change; scientific assessment and policy analysis (WAB) on Climate change, options for (post 2012) climate policies and international agreement; Integrating a griculture, f orestry a nd other land us e i n f uture c limate re gimes; Methodological issues and policy options.
UN Economic and Social Council Climate for development in Africa, Executive summary. Sixth session of the committee on food security and sustainable development CFSSD-6)/Regional Implementation Meeting (RIM) for CSD-18, Addis Abeba, 2009
UN Economic and Social Council Climate for development in Africa, summary. Sixth session of the committee on food security and sustainable development CFSSD-6)/Regional Implementation Meeting (RIM) for CSD-18, Addis Abeba. In: Africa climate advisory bulletin, 2009
UN Environmental Programme Climate change science compendium. McMullen, C.P. and Jabbour, J. (eds) 2009
UN-CEB Report: Acting on climate change: the UN system delivering as one, 2008
UNEP Assessing coastal vulnerability: Developing a global index for measuring risk, Report, 2005
UNEP, 2010, Kick the habit, a UN guide to climate neutrality, ISBN: 978-92-807-2926-9, 202 pages
UN-REDD Role of satellite remote sensing in REDD. Issues Paper, Oct 2008
UN-REDD Standard joint programme document Indonesia, draft, 2009
USAID Adapting to climate variability and change, A guidance manual for development planning. Aug 2007
USDA Forest Service, U.S. Department of Agriculture. Forest service roadmap for responding to climate change. 2010
VEGECLIM Defourny, P. et al, Tropical forests carbon dynamics using 10-y spot-vegetation time series and land-surface modelling. The VEGECLIM project, a project o f the STEREO II program. Presentation at BELSPO Day, May 2010
WCRP ICSU-WMO-IOC-IGFA Review of the World Climate Research Programme (WCRP). 40 pp. Paris, International Council for Science. Available at www.icsu.org ISBN: 978-0-930357-70-2, 2009
WCRP Accomplishment Report 2005-2009. Promoting, facilitating and coordinating climate research in service to society, 2009
WCRP Implementation plan 2010-2015, 2009
WCRP The World climate research programme achievements; scientific knowledge for climate adaptation, mitigation and risk management, 2009
WCRP Workshop on Understanding Sea-level Rise and Variability, Paris, June 2006
WMO GCOS Guideline for the generation of satellite-based datasets and products, GCOS/WRCP Atmospheric observation panel for climate, fifteenth session, Geneva, Switzerland, 27-30 April 2009
WMO Guidelines on Analysis of extremes in a changing climate in support of informed decisions for adaptation Climate Data and Monitoring WCDMP-No. 72, 2009
WMO R eport on Climate and land degradation, WMO-No. 9 89, W orld Meteorological Organization. ISBN 92-63-10989-3 (2005)
WRCP Global sea-level rise update, 2007
WRCP News. Global Energy and Water Cycle Experiment (GEWEX). Activities portfolio, June 2008
WRCP-CliC The Climate and cryosphere project contribution to the WCRP Implementation Plan up to 2013 and beyond (2009)
WUCA Decision support planning methods: incorporating climate change uncertainties into water planning. Water Utility Climate Alliance white paper. Jan 2010
Yokomizo, M., (2008) Greenhouse gases Observing SATellite (GOSAT) ground stations. Publication submitted at Fujitsu Sci. Techn. J. Vol 44-4, 410-417
Disasters
Aube et al., (2010) From Preparation to Response: Coastal Decision Support during the Caribbean Hurricane Season 2010 with RADARSAT-2. Disasters, Earth O bservation, Featured Article
Berte, C., Fighting sand encroachment Lessons from Mauritania. FAO Forestry Report 2010, PAPERISSN 0258-6150
Bhanumurthy V. , B ehera G, ( 2008), Deliverables from space data sets for disaster management – present and future trends
Brady M., Mbow C., (2009) Report of the GOFC-GOLD workshop on requirements for fire early warning systems in Africa, Accra, Ghana, GOFC-GOLD report no. 35
CAPRA Evaluación de Riesgos Naturales - América Latina - Consultores en Riesgos y Desastres Comprehensive (2009), Approach f or P robabilistic Risk A ssessment, Description of Software Platform
Ceccato, P., Early response system for forest fire management
De Groeve, T. et al (2009), Global disaster alert and coordination system
Guerrieri. L , T rigila A . e t a l, ( 2007) T he IFFI project (Italian Landslide Inventory): methodology and results, For the experts meeting on guidelines for mapping areas at risk of landslides in Europe JRC, Ispra 23-24 October 2007
Kerle, N., & O. Neussner (2010) Local Flood Early Warning Based on Low-Tech Geoinformatics Approaches and Community Involvement A Solution For Rural Areas in The Philippines. Joint Board of Geospatial Information Societies (JB GIS).
Kienberger S ., (2008) Toolbox & manual mapping the vulnerability of communities example from Búzi, Mozambique
Latina M., Köbben B., (2005) A web application for landslide inventory using data-driven svg
Lawford, R. , P. Harder, N. Lee, J . Pittman (2010). User Engagement Experience in the Drought Research Initiative (DRI). Presentation GEO User Engagement Session, Beijing, China
Maukonen, T., UNEP DEWA, Nairobi, Kenya, et al. Global Deserts Outlook. Report of the United Nations Environment Programme, ISBN: 92-807-2722-2 UNEP Job No. DEW/0839/NA
MyNgoc Nguyen et al., Gulf of Mexico Air Quality: CALIPSO Decision Support for Gulf of Mexico Air Quality Relating to the Deepwater Horizon Oil Spill. Article in Disasters, Earth Observation, Energy (January 4th, 2011)
Peters Guarín G ., ( 2008) Integrating local knowledge into gis-based flood risk assessment; the case of Triangulo and Mabolo communities in Naga City, The Philippines PhD thesis, ISBN: 978-90-8585-295-7
SAFER, Services and applications for emergency response, leaflet
UNDP, Dilley M. (2005), Global risk identification program (grip), a summary outline
UNDP, Wattegama C., (2007), ICT for disaster management, ISBN: 978-974-8283-94-4
UNESCO, Villagran de Leon J.C., Zeil P., (2006) Evaluation of the Capacity Building programme for Natural Disaster Reduction (CBNDR) in Central America and the Caribbean, final report
van Westen, C.J., Quan Luna, B., Vargas Franco, R.D. et al. (2010) Development of training materials on t he use of geo-information f or multi-hazard ri sk assessment i n a mountainous environment. In: Mountain r isks: bringing science to society: proceedings of the Mountain Risks International Conference, Firenze, Italy, 24-26 November 2010 / ed. b y J .-P. M alet, T. G lade a nd N . C asagli. - Strasbourg: C ERG, 2 010. ISBN 2 -95183317-1-5. pp. 469-475
Vargas Franco R., Van Westen C., CAPRA training needs and recommendation report, deliverable nr. 4, version 11/01/2010
Vrieling, A., G. Sterk, S. de Jong. Satellite-based estimation of rainfall erosivity for Africa. Journal of Hydrology 395 (2010) 235–241
Wood. H.M., (2006) Promoting risk-wise behaviour: an integrated strategy for reducing vulnerability and improving resiliency
World B ank ( 2008), International bank for reconstruction and development program document for a proposed catastrophe deferred drawdown option (cat ddo) loan in the amount of US $ 65 million to the republic of Costa Rica, report no. 44738-CR
World B ank, An derson, E., ( 2008), Central American probabilistic risk assessment, evaluación probabilistica de riesgos para Centro América
Zimmerli, P. et al, (2003) Natural Catastrophe and reinsurance. Publication Swiss Reinsurance Company 1493661_03_en
Ecosystems
10 messages for 2010 – Message 1. Climate change and biodiversity. EEA, Copenhagen, 2010
10 messages for 2010 – Message 2. Protected areas. EEA, Copenhagen, 2010
10 messages for 2010 – Message 3. Freshwater ecosystems . EEA, Copenhagen, 2010
10 messages for 2010 – Message 4. Marine ecosystems. EEA, Copenhagen, 2010
10 messages for 2010 – Message 5. Forest ecosystems. EEA, Copenhagen, 2010
10 messages for 2010 – Message 6. Urban ecosystems. EEA, Copenhagen, 2010
10 messages for 2010 – Message 7. Agricultural ecosystems. EEA, Copenhagen, 2010
10 messages for 2010 – Message 8. Mountain ecosystems. EEA, Copenhagen, 2010
10 messages for 2010 – Message 9. Coastal ecosystems. EEA, Copenhagen, 2010
AMESD No. 1 Monitoring of African Environment! Newsletter of African Monitoring of Environment for Sustainable Development Programme. (2010)
Arino, O. et al (2005) GlobCover – a land cover map for the year 2005 (Presentation)
Arino, O. et al (2009) GlobCorine presentation Final meeting in Copenhagen 17 November 2009
Ausubel J. et al. (2006) How to Census Marine Life. Director, Program for the Human Environment, The Rockefeller University New York City
Bahurel, P. (2007) MyOcean, building up the European “Marine Core Service”, Status report in Window on GMES
Baldi, G., M. Nosetto, R. Aragón, F. Aversa, J. Paruelo and E. Jobbágy. (2008) Long-term Satellite NDVI Data Sets: Evaluating Their Ability to Detect Ecosystem Functional Changes in South America. Sensors 2008, 8, 5397-5425; DOI: 10.3390/s8095397
Balthazar V. et al. (2010) Remote Sensing of the forest transition and its ecosystem impacts in mountain environments. (FOMO) (Presentation)
Baret, F. et a l. ( 2006) VGT4Africa user manual - First edition. Publication o f t he European Communities
Bicheron, P. et al (2008) Globcover Products discription manual
Bicheron, P. et al (2008) Products Description and Validation Report
Burkill, P. & C. Reid, Sir Alister Hardy Foundation for Ocean Science & University of Plymouth, UK . ( 2009) Plankton biodiversity of the North Atlantic: changing patterns revealed by the Continuous Plankton Recorder Survey.
Climate Change Science Compendium (2009) Earth’s Ecosystems
Coad, L. et al (2008) Global ecological forest classification and forest protected area gap analysis.(Report prepared by: United Nations Environmental Programme World Conservation, M onitoring C entre (UNEP-WCMC), W orld W ide F und f or N ature ( WWF) Network, World Resources Institute (WRI), Institute of Forest and Environmental Policy (IFP) and University of Freiburg)
CoML (2005) Recommendations to Census of Marine Life Project from the SCOR panel on new technologies for Observing marine life.
CoML (2007) Making ocean life count (Presentation)
CoML O’Dor, R. (2009) Scientific Basis for Selecting MPAs in Areas Beyond National Jurisdiction (Presentation)
CPR for Ocean Observations (2009) A global Continuous Plankton Recorder programme White paper
CPR programme article (2008) A global continuous plankton recorder programme
Defourny, P. et al (2006) Globcover: a 300 M global land cover product for 2005 using Envisat Meris time serie. Article ISPRS Commission VII Mid-term Symposium "Remote Sensing: From Pixels to Processes", Enschede, the Netherlands
Defourny, P. et al (2008) ESA-GLOBCOVER -A Global Land Cover Service at 300 m from ENVISAT MERIS Time Series. GOFC-GOLD Land Cover Symposium October 15, 2008 (Jena –Germany) (Presentation)
EC Joint Research Centre IES Global Environment Monitoring Unit (2007) Evaluating African Protected Areas. SDI Newsletter Africa Vol. 6, nr. 5
Esty, D. et al (2008). 2008 Environmental performance index. Report of the Yale Centre for Environmental Law & Policy, Yale University.
GOFC – Gold Land Cover Newsletter no. 17 (May 2008)
GOFC – Gold Land Cover Newsletter no. 18 (December 2008)
Herold, M. et al (2008) Translating and evaluating land cover legends using the UN Land Cover Classification System (LCCS). GOFC-GOLD_43 2008
Hoepffner, N. (2006) Marine and Coastal Dimension of Climate Change in Europe. A report to the European Water Director. EUR 22554 EN
Indian National Centre for Ocean Information Services (INCOIS), E. Pattabhi Rama Rao et al. (2008) Ocean data and information system (Odis) and web-based services. The International Archives of the Photogrammetry, Remote Sensing and Spatial Information Sciences. Vol. XXXVII. Part B4. Beijing 2008
Indian N ational C entre f or O cean Information S ervices ( INCOIS), M. R avichandran. Application of advances in Ocean Science & Technology, Space Technology and Information & Communication Technology for the benefit of Society, Hyderabad, India (2008)
Intergovernmental O ceanographic C ommission (I OC) (2 003) The i ntegrated s trategic design plan for the coastal ocean observations module of the global ocean observing system.
Intergovernmental O ceanographic C ommission, Reports of M eetings of E xperts a nd Equivalent Bodies. (2004) Consultative Meeting on Large Marine Ecosystems (LMEs).
International Geosphere-Biosphere Programme (2003) Marine Ecosystems and global change. IGBP Science No. 5
IOGOOS Workshop on Capacity Building and Strategy for Data and Information Management (December 8-10, 2003); Hyderabad,
Jensen, S., F. Daffner, C. Steenmans.(2002) Towards a Shared Environmental Information System SEIS. European Environment Agency SEIS presentation
Knox, N.M., A. Skidmore, and H. Prins (2010) Observing temporal and spatial variability of forage quality. Enschede, University of Twente Faculty of Geo-Information and Earth Observation ITC, 2010. ITC Dissertation 174, 165 p. ISBN: 978-90-6164-294-7.
Leeuw, J . de, Y. Georgiadou, N. Kerle, A . de Gier, et a l (2010) The function of remote sensing in support of environmental policy. In: Remote sensing, 2(2010)7, pp. 1731-1750.
LME NOAA Technical Memorandum NMFS-NE-208 (2007) Global Applications of the Large Marine Ecosystem Concept 2007 – 2010.
Pinardi, N. et al (2008) Ten years to build the GMES Marine. Core Service component for the Mediterranean Sea. Success story in Window on GMES
Pinardi, N. (2008) Marine Core Service products in support of the Marine Strategy Framework Directive Presentation
SAHFOS ( 2007) The ecological status of the North Atlantic environment based on observation from the continuous plankton recorder survey Ecological status report 2007/2008
Sayre, R., P. Comer, H. Warner, a nd J. Cress ( 2009) A New Map of Standardized Terrestrial Ecosystems of the Conterminous United States. U.S. Geological S urvey, Reston, Virginia: 2009
Schlerf, M ., Fauzi, A ., S kidmore, A.K., Walalite, T . a nd A xelsson, C.R. (2010) Hyperspectral remote sensing leaf nitrogen in mangroves. Powerpoint. Presented at East Kalimantan Project Conference, 20-22 September 2010, Samarinda, Indonesia. 27 slides
Sherbinin, A. de (2005) Remote Sensing in Support of Ecosystem Management Treaties and Transboundary Conservation. Centre for International Earth S cience Information Network (CIESIN) under the Remote Sensing Technologies for Ecosystem Management Treaties project funded by the U.S. Department of State Bureau of Oceans, Environment and International Scientific Affairs
Steenmans, C. (2007) Shared Environmental Information System. European Environment Agency
Steiner, A. (2009) New Science and Developments in our Changing Environment. UNEP Yearbook Division of Early Warning and Assessment (DEWA) United Nations Environment Programme
The geographic template: Visualization and analysis of biogeographic pattern. The geographic template (2010)
The GMES Marine Core Services project. An EU FP7 project 2009-2011. MyOcean overview presentation April 2009
Vreugdenhil, D. (2003) Protected areas system planning and monitoring. PhD thesis
Vandenberghe, E. (2006) Ocean Biogeographic Information System. OBIS presentation
White, R., S. Murray, M. Rohweder. (2000) PILOT ANALYSIS OF GLOBAL ECOSYSTEMS – Grassland Ecosystems.
Window on GMES (2010) Issue #3
Window o n G MES ( May 20 08) Fi rst I ssue. Published by t he B OSS4GMES E uropean consortium (Building Operational Sustainable Services for GMES).
Window on GMES (September 2008) Issue #2
Yale Centre for Environmental Law & Policy, Yale University and Centre for International Earth S cience Information N etwork, C olumbia U niversity. 2008 Environmental performance index - Summary of Policymakers. (2008)
Energy
AEGOS African-European geosources observation system: Design a pan-African infrastructure of interoperable data and user-oriented services to support the sustainable use of georesources in Africa. Flyer, 2008
AEGOS African-European geosources observation system: Design a pan-African infrastructure of interoperable data and user-oriented services to support the sustainable use of georesources in Africa. Poster, 2008
Antoniou, I. et al. (2005) Offshore wind profile measurements from remote sensing instruments
ENVISOLAR F ailure d etection rou tine f or g rid c onnection P V s ystems a s p art of t he PVSAT service. Factsheet, 2007
ENVISOLAR S pyce (Satellite photovoltaic y ield control and evaluation) uberwacht Ihre solaranlage. Factsheet, 2007
ENVISOLAR Wetter service. Factsheet, 2007
ENVISOLAR Irradiance data for solar energy systems: Access to helioclim databases derived from Meteosat data. Factsheet, 2007
ENVISOLAR Profi, Remote monitoring and yield analysis – innovative and secure. Factsheet, 2007
ENVISOLAR P V controller W eb-satellite i ntegrated s ystem f or t he r emote c ontrol of photovoltaic plants. Factsheet, 2007
ENVISOLAR PVSAT-satellite based monitoring of grid connected PV systems. Factsheet, 2007
ENVISOLAR Safer Sun. Factsheet, 2007
ENVISOLAR Space-based environmental information for solar energy industries. Brochure 2007
ENVISOLAR Stettler, S. et al. (2005) Failure Detection Routine for Grid Connected PV Systems as Part of the PVSAT2 Project (Applicable subject number: 6.1 PV Systems in grid-connected applications). Presented a t 20th E uropean P hotovoltaic S olar E nergy Conference and Exhibition, 6-10 June 2005, Barcelona, Spain
Furevik, B.R. et al. (2005) Satellite based services for the wind industry. Presentation at European Wind Energy Conference, London, 2004
ICSU Science plan: Sustainable energy in sub-Saharan Africa. July 2007
Kelly, T.A. et al. (2009) Challenges and solutions of remote sensing at offshore wind energy developments. Marine Pollution Bulletin
Langhoff, S., et al, 2009, Workshop Report on Sustainable Urban Development, NASA/CP-2009-214603, Report of a workshop sponsored by and held at NASA Ames Research Centre, California, 2009, 51 pages
MacAskill, A. and A. Oldroyd (e ds), Application of remote sensing in offshore wind. Technical report, 2008
Meijde, M. van der, et al, Environmental Impacts of pipelines, Encyclopedia of Geography, 2010, SAG E Publications. 25 O ctober 2 010. http://www.sage-ereference.com/geography/Article_n366.html, 4 pages
MESoR MESOR training seminar, part 1b: users’ needs, 2009
MESoR MESOR training seminar, part 1b: users’ needs, technical aspects, 2009
MESoR MESoR training seminar, part 3: benchmarking of radiation products, 2009
MESoR MESOR training seminar, part 3: overview on solar resource products, 2007
MESoR MESOR training seminar, part 7: outlook and discussion, 2007
MESoR MESOR training seminar: examples of use, 2007
MESoR MESOR training seminar: management and exploitation of solar resource knowledge, WP-2 Unifying Access, 2007
MESoR Simplified profit calculation for a photovoltaic system in Germany, 2007
Mueller, R.W. et al. (2004) Rethinking satellite-based solar irradiance modelling: The SOLIS clear-sky module. Remote Sensing of Environment 91 (2004) 160–174
NASA Energy Efficiency and RETScreen Version 4: NASA derived and validated c limate data for RETScreen use: description and access, 2008
NASA Energy Management Brochure, National Aeronautics and Space Administration, Science S erving S ociety: E nergy M anagement, B rochure, L G-2003-6-071-GSFC, M ay 2006
OECD/IEA Technology roadmap: wind energy. 2009
PIPEMON Pipeline Route Planning Service, Service Portfolio Specifications
PIPEMON Riedman, M. et al. (2006) Application of ground movement and automated route planning technologies for pipeline planning and management – the PIPEMON project. Proceedings of t he 6th I nternational P ipeline Conference, September 2 5-29, 2006, Calgary, Alberta, Canada. IPC2006-10545
PIPEMON Zirnig, W. et al. The PRESENSE and PIPEMON projects – Defining the ways of using space-borne earth observation services for pipeline monitoring, IGRC 2004, November 1-4 2004, Vancouver, Canada.
Pirjola, R. et al. Power and pipelines (ground systems). www.esa.spaceweather.net
Ranchin, T. et al, CoP Energy Presentation 2010, Group on Earth Observation (GEO), 10 pages
RETscreen International, brochure published by Natural Resources Canada, www.retscreen.net
US Dept. of Energy, Wind and water power program: Wind power today, 2010, Version 1, 28th July 2006
Werff, H. van der, et al, September 15, 2010, Hyperspectral Remote Sensing for Oil and Gas (There’s no end to what it can (not) do), Presentation, 29 pages
General
2008 Environmental Performance Index, Summary for policymakers, New Haven, Yale Centre for Environmental Law and Policy, 2008
ATOS Origin Tabasco, A., Contributing to Land Surveillance using Earth Observation. Toulouse, Space Show, 2008
ATSE An Australian strategic plan for earth observations from space. Report, 2009
Baud, I., M. Kuffer, K. Pfeffer, R. Sliuzas et al (2010) Understanding heterogeneity in metropolitan India: the added value of remote sensing data for analyzing sub - standard residential areas. In: I nternational j ournal o f a pplied e arth o bservation a nd geoinformation: JAG, 12 (2010)5, pp. 359-374.
CIESIN (Centre for International Earth Science Information Network) Where the Poor Are: An Atlas of Poverty. Palisades, N Y: C olumbia U niversity. A vailable a t: http://www.ciesin.columbia.edu/povmap/. 2006 ISBN: 0-9779255-0-1
CNES The ORFEO Tool Box Software Guide, Sixth Edition, Updated for OTB-2.2 OTB Development Team, 2008
Combating Poverty and Inequality: Structural Change, Social Policy and Politics. UNRISD/UN Publications. ISBN: 978-92-9085-076-2. 2010
Commission of the EC, Commission working document: European space policy progress report. Brussels, Belgium, Sept 2008. COM (2008)561 final
Council of the EU Council Resolution Taking forward the European Space Policy: 2891st competitiveness (international market, industry and research). Council meeting Brussels, 26 September 2008
Country report on SDI elaborated in the context of a study commissioned by the EC (EUROSTAT) i n t he framework of the INSPIRE initiative ( Under F ramework Contract REGIO/G4-2002-02-Lot 2). Jan 2008
Crafting geoinformation The art and science of Earth observation. (2010) GEO Crafting geoinformation report
Creating Sufficient User Pull to Secure the Benefits of Satellite Services for Society. Eurisy Position paper 2010
Critical Earth Observation Priorities final report October 2010. GEO Task US-09-01a. GEO US Report
Devillers, R ., A. Stein et al (2010) Thirty years of research on spatial data quality: achievements, failures and opportunities: review article. In: Transactions in GIS, 14 (2010)4, pp. 387-400.
Doll, C.N.H. (2008) CIESIN Thematic Guide to Night-time Light Remote Sensing and its Applications, Palisades, NY: Centre for International Earth Science Information Network of Columbia University. Available on-line at
EC DG Milieu Groof, H. de, Lost in Acronyms; Demystifying GMES, INSPIRE and SEIS, a Stakeholders Challenge. Presentation at Geoland 1 Forum 5, Berlin, May 2009
http://sedac.ciesin.columbia.edu/tg/
Economic development in Africa Report 2010 – South Africa Cooperation: Africa and the new forms of Development Partnership. United Nations Conference on Trade and Development ISBN: 978-92-1-112795-9 ISSN: 1990–5114
Elzakker, C. van, and I. Delikostidis (2010) Use, user and usability research for mobile geo - applications for personal orientation and navigation. In: Twenty10: IPCC 2010
University of Twente: communication in a self - service society: IEEE 2010 international professional c ommunication c onference: p roceedings, 7 -9 Ju ly 20 10, E nschede, T he Netherlands. - [s.l.]: IEEE, 2010. ISBN 978-1-4244-8143-9. pp. 121-130
ESA Sarti, F., Introduction to the ESA earth observation programme. Projects and tools for education. Presentation, 2007
ESA The State & Health of the European and Canadian EO Service Industry. Technical report, Sept 2004. EOMD.REP.018
ESA-VEGA The State and Health of the European and Canadian EO Service Industry; Analysis of the European and Canadian EO Service Industry. Executive Summary, 2008
ESPI 20 Perspectives. INSPIRE: A Real Step Forward in Building an Interoperable and Unified Spatial Information Infrastructure for Europe? 2009
ESPI 25 Perspectives. The Case of GMES as a Support Tool to Meet the Millennium Development Goals; Recommendations for the Current and Upcoming EU Council Presidencies in 2010 on Space Applications and Sustainable Development in Africa. 2009
ESPI European-African Partnership in Satellite Applications for Sustainable Development. A Comprehensive Mapping of European-African Actors and Activities. Report 26, Sep 2010
ESPI Space in Central and Eastern Europe; opportunities and challenges for the European space endeavour. Report 5, Sep 2007
ESPI Space policies, issues and trends in 2008/2009. Report 18, May 2009
ESPI Space-based services in Europe; addressing the transition between demonstration and operation. Report 17, Mar 2009
ESRI Cummens, P. and S. Grisé, Making technology work in the real world. P romotion presentation.
Esty, D.C., M.A. Levy, C.H. Kim, A. de Sherbinin, T. Srebotnjak, and V. Mara (2008) 2008 Environmental Performance Index. New Haven, Yale Centre for Environmental Law and Policy.
EU-JRC Advanced Regional Spatial Data Infrastructures in Europe. JRC Scientific and Technical Reports series, JRC 49811, EUR 23716 EN, ISBN: 978-92-79-11281-2, ISSN 1018-5593, DOI: 10.2788/77930
EU-JRC Assessing the impacts of spatial data infrastructures. Report of International Workshop on Spatial Data Infrastructures’ Cost-Benefit / Return on Investment. Ispra, Italy, 12-13 January 2006. ISBN 92-79-02458-2 ISSN 1018-5593
EU-JRC Craglia, M. and A. Annoni, INSPIRE: an innovative approach to the development of spatial data infrastructures in Europe. GSDI-9 Conference Proceedings, 6-10 Nov 2006, Santiago, Chile
EU-JRC Garcia Almirall, P. et al, The Socio-Economic Impact of the Spatial Data Infrastructure of Catalonia. ISBN 978-92-79-08728-8, ISSN 1018-5593, 2008
EU-JRC Joint Research Centre activities relevant for Earth Observation. Presentation for the GEO European Project Workshop, 3-4 September 2008, Brussels Belgium
EUMETSAT TD 15 - EUMETCast - EUMETSAT's Broadcast System for Environmental Data. Technical Description, v4, Aug 2006
EURISY Fostering the Competitiveness of European SMEs through the Use of Satellite Services Conference of Eurisy’s Support Initiative for SMEs Rome, Italy, 25 June 2010
EURISY Workshop. Himonas, S.D., Bridging the digital divide in remote areas – the Cyprus experience, presentation. Brussels, 2009
EuroSDR INSPIRE in the Netherlands, organizational perspective. EuroSDR atlas of INSPIRE implementation methods. Presentation, 2009
EuroSDR Report of EuroSDR workshop “EuroSDR-project Atlas of INSPIRE Implementation methods”. Brussels, Belgium, April 2009
Fukushima, Y ., Development of Global Map for GEOSS SBAs US-09-03a. UIC Us er Engagement Session.2 November, 2010 Presentation
Genovese, E. et al, Evaluating the socio-economic impact of Geographic Information: A classification of the literature. Submitted for publication at: the International Journal of Spatial Data Infrastructures Research, submitted 2008-10-27
GEO 2009-2011 Work Plan 2010 Progress Highlights GEO-VII Beijing, China Presentation 2010
GEO 2009-2011 work plan progress report. Document 5, Nov 2009
GEO 2009-2011 work plan, Revision 2. Dec. 2009
GEO 2009-2011 Work Plan, Version 2. Preliminary conclusions. Presentation for GEO European Projects Workshop, 3-4 September, 2008, Brussels, Belgium
GEO European projects workshop report. Brochure ISBN 978-92-79-10112-0, DOI 10.2777/22807. Brussels, 2008
GEO GMES and GEO hand in hand. Presentation at European projects workshop. Brussels, Belgium. Sept 2008
GEO High Level Working Group 13 Review and discussion of versions 2 & 3 of the GEO 2009-2011 Work Plan. Presentation. Brussels, 29 October 2008
GEO Outreach Plan 2007 to 2009, as Accepted at GEO-III. Document 12, v2. Nov 2006
GEO Strategic Guidance for current and potential contributors to GEOSS, submitted to GEO-IV. Document 25, Nov 2007
GEO Strategic Targets: GEOSS Implementation by 2015, Document 10. This document is submitted to GEO-V for acceptance, 19-20 Nov 2008
GEO Tactical Guidance for current and potential contributors to GEOSS, submitted to GEO-IV. Document 24, Nov 2007
GEO The first 100 steps to GEOSS; annex of early achievements to the report on progress 2007, Cape Town ministerial summit, Nov 2007.
GEO The full picture. Report, 2007
GEO The GEO Beijing Declaration - Observe, Share, Inform. Beijing Ministerial Summit 2010 GEO report
GEO The GEOSS architecture. P resentation a t the GEOSS in the Americas symposium, Mangaratiba, Brazil, Sept 2007
GEO-BENE Benefits assessment, presentation, 2008
GEO-BENE global database for bio-physical modelling v. 1.0 (Concepts, methodologies and data)
GEO-BENE Global Earth Observation: Benefit Estimation: Now, Next and Emerging. D3 (T12) Benefit assessment framework report. June 2007
GEO-BENE Global Earth Observation: Benefit Estimation: Now, Next and Emerging. D7 (T21) Interim aggregate benefit assessment report. March 2007
GEO-BENE Global Earth Observation: Benefit Estimation: Now, Next and Emerging. D4 (T21) Methodology and tools report. March 2007
GEO-BENE Global Earth Observation: Benefit Estimation: Now, Next and Emerging. D5 (T13) Status report year 1. Aug 2007
GEO-BENE Global Earth Observation: Benefit Estimation: Now, Next and Emerging. D6 (T14) Data base report. Sep 2007
GEO-BENE Global Earth Observation: Benefit Estimation: Now, Next and Emerging. D8 (T25) Status report year II. July 2008
GEO-BENE Global Earth Observation: Benefit Estimation: Now, Next and Emerging. D10 (T30) Draft GEO-BENE synthesis report
GEO-BENE Global Earth Observation: Benefit Estimation: Now, Next and Emerging.
GEO-IV Mobilizing resources for implementing GEOSS, The Seville Roadmap, October 2007. An output of the GEO Capacity Building Committee, 28-29 Nov 2007 Document 23
GEONETCast Delivering e nvironmental d ata t o u sers worldwide. Current Status and Upcoming Plans, 2009-10. Presentation, 2008
GEONETCast Delivering environmental data to users worldwide. The training channel, an implementation proposal. Presentation Sept 2008
GEONETCast for and by Developing Countries GMES Land Forum 5, Presentation, Berlin, Germany, 13 May 2009
GEONETCast Workshop: Global Dimension of Earth, June 27, 2007, San José, Costa Rica
GEOSS Data Sharing Action Plan for the Implementation of the GEOSS Data Sharing Principles. GEO-VII Plenary – 3-4 November 2010
GEOSS Outcome Performance Indicators, submitted to GEO-IV. Document 26, Oct 2007
GEOSS User Requirements Registry (URR). GEOSS brochure
Gershenzon, V.E. Remote sensing data market trends. ScanEx interview. Article, 2007
Global Roads, A Strategy for Developing an Improved Global Roads Data Set. Developed by Participants at The Global Roads Workshop, October 2007, Palisades, New York USA
GMES Data Access, Geoland-2 EO Datasets. Presentation at Geoland-2 Forum 5, Berlin, May 2009
Gross, R, G. Beutler, H.-P. Plag. Integrated scientific and societal user requirements and functional specifications for the GGOS. Global Geodetic Observing System Chapter 7. ISBN: 978-3-642-02686-7
Habib, S. et al, Space-based earth observations for societal benefit. WMO Bulletin 57-1, Jan. 2008, 22-27
Hansen, H . (Keyobs) a nd Wolff, E. ( ANAGEO-ULB) POPSATER New improvements in population estimate. BELSPO-EO Day, Chaudfontaine, Belgium, 6 May 2010
Huebler, F., The Millennium Development Goals Report 2010. 20-22 September 2010. United Nations, New York on the occasion of the 10-year anniversary of the Millennium Summit of 2000
IGN Tema 6: Medio ambiente (incluido Cambio Climatico), Presentation, 2008
IGOS IGOS-P 15 and GEO achievements planning meeting in 2009. Report to 4th C4, Paris, May 2008
INPE Por uma agenda espacial latino-americana – a visão do INPE. Presentation
INSPIRE Spatial Data Infrastructures in The Netherlands: State of play 2007.
Jai Singh Parihar. Harnessing Space for Societal Benefits: Indian Experience. GEO User Interface Engagement, November 1‐2, 2010, Beijing, China
Klugman, J. et al. The Real Wealth of Nations: Pathways to Human Development. Human Development Report 2010. 20th Anniversary Edition
Kohli, D., R. Sliuzas, N. Kerle (2010) Ontology of slums as a basis for object - oriented image classification. Presented at Earsel Joint SIG Workshop: Urban - 3D - Radar -
Thermal Remote Sensing a nd Developing Countries, 22-24 September 2010, Ghent, Belgium. 8 p.
Lance, K. (2010) Monitoring the earth observation sector in Africa: extended abstract. In: AARSE 2010: 8th international conference African Association of Remote Sensing of the Environment, AARSE, on earth observation for Africa's development agenda: conference proceedings, 25-29 October 2010, Addis Ababa, Ethiopia. - [s.l.]: [s.n.], 2010. - 163 p.; 28 cm. 2 p.
Lance, K ., Y. Georgiadou, a nd A. Bregt (2010) Evaluation o f t he D utch s ubsurface geoportal: w hat l ies b eneath. In: C omputers, Environment a nd U rban S ystems: a n international journal, (2010) IN PRESS, 9 p.
MapAction Field guide to humanitarian mapping. March 2009
MapAction. Google Earth and its potential in the humanitarian sector: a briefing paper. Google Earth paper April 2008
Measurement Framework Final Version. (2010) Prepared f or the eGovernment Unit DG Information Society and Media
Mid-Term Evaluation of GEOSS Implementation. GEO-VII Plenary – 3-4 November 2010, Beijing China. Document 6
Millennium Villages Handbook A Practitioner's Guide to the Millennium Villages Approach. Version 1.0, June 18, 2008
Molen, P. van der, and L. Jansen (2010) Rural and urban land management: the role of the Netherlands government as policy maker and as landowner + powerpoint. Presented at the International Land Management Symposium, 10 May 2010, Hannover, Germany.
Molenaar, M. and C. Mannaerts Capacity building networks for earth observation and GEO-ICT; a first step towards a virtual university. International Archives of the Photogrammetry, Remote Sensing and Spatial Information Sciences, Vol. 37 Part B6a. Beijing 2008
Navarra, D. (2010) A review of international experiences and inter - disciplinary perspectives on the use of geo - ICT and their value for public sector governance: implications for e-government policy. Enschede, ITC, 2010. ITC Working papers series 5, 24 p. ISBN: 978-90-6164-291-6.
Nelson, A. et al, Towards development of a high quality public domain global roads database. Data Science Journal, Volume 5, Nov 2006, 223-265
NSGIC National States Geographic Information Council Work for hire model; licensing considerations. 2008
Oosterom, P. van, G. Vosselman (eds) (2010) Management of massive point cloud data: wet and dry. Delft, Nederlandse Commissie voor Geodesie (NCG), 2010. Nederlandse Commissie voor Geodesie: groene serie: publikatie 49, 93 p. ISBN: 978-90-6132-322-8.
Plag, H-P., G. Foley, G . Ondich, J . Kaufman. (2010) The GEOSS User Requirement Registry- Supporting a User-Driven Global Earth Observation System of Systems. Article Imaging Notes.
Plag, H-P., (2010) GEOSS User Requirement Registry (URR): Issues to Clarify with the UIC. Overview presentation UIC 2010. GEO User Interface Committee, 15th UIC Meeting (UIC) Summary. Pretoria, South Africa. 20 May 2010
Ramage, S. (2010) Standards, Interoperability and Business Value. Third Workshop on the use of GIS/OGC Standards in Meteorology. Presentation
Remote Sensing and Digital Image Processing, 2010, Volume 10, 1-9, DOI: 10.1007/978-1-4020-4385-7_1 Chapters 1-18
Resources for the future, Earth Observations in Social Science Research for Management of Natural Resources and the Environment: Identifying the Contribution of the U.S. Land Remote Sensing (Landsat) Program. Discussion paper. March 2009, RFF DP 09-01
Richter, C., G. Miscione and Y. Georgiadou (2010) Conceptualizing people in SDI literature: implications for SDI research and development. In: International journal of spatial data infrastructures research: IJSDIR, 5 (2010) pp. 286-325.
Rutzinger, M. et al (2010) Change detection of building footprints from airborne laser scanning acquired in short time intervals. In: Proceedings of ISPRS TC VII symposium: 100 years ISPRS, 5-7 July 2010, Vienna, Austria / ed. by W. Wagner & B. Szekely. - : International Society for Photogrammetry and Remote Sensing (ISPRS), 2010. (International Archives of Photogrammetry and Remote Sensing: IAPRS: ISPRS ; XXXVIII, part 7B), pp. 475-480.
Ryaboshapko, O.A. Russian geoinformatics market in 2008; Marketing Activity Assessment
Sahagian, D., J. Abshire, D. Alsdorf, P. Davis, P., Houser, C. Kreemer, J. Melack, M. Pearlman, H.-P. Plag, P. Poli, S. Reid, M. Rodell and R. Thomas. Earth observation: Serving the needs of an increasingly global society. In H.-P. Plag and M. Pearlman (eds.): The Global Geodetic Observing System: Meeting the Requirements of a Global Society on a Changing Planet in 2020, Springer, Berlin
Seventh Framework Programme, La coopération internationale dans le programme COOPERATION. Focus sur les thèmes 1 (Health), 2 (Food) et 6 (Environnement). Réunion d’information, Montpellier, France, 2008
TNTmips Analyzing Terrain and Surfaces, tutorial. http://www.microimages.com/search, 2007
UN Office for Outer Space Affairs UN programme on space applications. Brochure, 2010
UNECA CODI-V Olusola Atilola: Geoinformation, employment and knowledge economy in Africa. Presentation at the fifth session of the committee on development information, Addis Ababa, Ethiopia, 2007
UNGIWG U nited N ations g eographic i nformation w orking g roup Report of the Ninth Annual Meeting, Vienna, Austria, 5-7 November 2008
US Office on Science and Technology Policy Achieving and Sustaining Earth Observations: a preliminary plan based on a strategic assessment by the US Group on Earth Observations. Sept 2010
Viana, V. (2010) Sustainable Development in Practice: Lessons Learned from Amazonas. International Institute for Environment and Development 17508IIED. ISBN 978-1-84369-773-2
White paper on the GEOSS data sharing principles. Review Draft 28 Sep 2008. CODATA, Paris, 2008
Woldai, T. and O. Kufoniyi, (2010) AARSE geoinformation vision and the way forward for Africa: keynote. In: AARSE 2010: 8th international conference African Association of Remote S ensing of t he Environment, A ARSE, on e arth observation f or A frica's development agenda: conference proceedings, 25-29 October 2010, Addis Ababa, Ethiopia. - [s.l.] : [s.n.], 2010. - 163 p.; 28 cm. 39 slides.
World B ank Africa’s Urbanization for Development: Understanding Africa’s Urban Challenges and Opportunities. Draft report 18th July 2008, 45298
Health
AIRNow-International Status and Next Steps. Presentation at the Shanghai Environmental Monitoring Centre for the 2010 World Expo
Ceccato, P. (Summer 2006) Introduction and Use of Remote Sensing to Predict Disease Outbreak. Colloquium on Climate and Health
EPIDEMOIST. Improving epidemiological modelling using satellite derived soil moisture proxies (2010).
ESRI. Approaches to GIS Programs In Health Education
EU JR C. Institute f or Environment a nd Su stainability ( 2006) Remote Sensing of Air Pollution. Publication of the European Communities
Foley, G. (2010) Connecting Ecosystems, Biodiversity, and Human Health: Using Earth Observations to Reduce and Prevent Infectious Diseases. P resentation B iodiversity and Human Health
GEO. Epidemic meningitis in Africa and environmental risk: a consultative meeting. Report (2007)
Hamm, N ., T. Demwez, A. Stein, a nd e t a l (2010) Air quality mapping: combining models, in situ measurements and remote sensing. In: Proceedings o f Accuracy 2010: 9th International symposium on spatial accuracy assessment in natural resources and environmental sciences, 20-23 July, 2010, Leicester, United Kingdom. / ed. by, N.J.Tate
and P.F. F isher. Leicester; University of Leicester on behalf of the International Spatial Accuracy Research Association (ISARA), 2010. pp. 381-384.
HappySun. The satellite based service for solar photo protection of tourists FlyBy brochure
Lozano-Fuentes, S. et a l (2008) Use of Google Earth™ to strengthen public health capacity and facilitate management of vector-borne diseases in resource-poor environments. Bulletin of the World Health Organization | September 2008, 86 (9)
NASA. NASA and Malaria Early Warning Systems: Using NASA Data to Combat Epidemics. Brochure
Osei, F.B., A. Stein, and A. Duker (2010) Spatial statistics of epidemic data : the case of cholera epidemiology in Ghana. Enschede, University of Twente Faculty of Geo-Information and Earth Observation ITC, 2010. ITC Dissertation 177, 160 p. ISBN: 978-90-6164-299-2.
Paliouras, E. et al (2006) GMES SERVICE ELEMENT PROMOTE - U5 Core User Needs DossierVersion 12. Promote-005
Sethi, V., (2010) Air Quality Community of Practice - Activities in India. Presentation User Engagement Session, Beijing
Simmons, A. (2010) Developing core GMES atmospheric environmental services. Presentation European Centre for Medium-Range Weather Forecasts
Thomson, M. a nd S. Connor ( MALSAT R esearch Group, L iverpool S chool o f Tropical Medicine) A Framework for Field Research in Africa – Malaria early warning Systems. CONCEPTS, INDICATORS AND PARTNERS (2001) WHO
WHO. Malaria Early Warning Systems − Concepts, Indicators and Partners − A Framework for Field Research in Africa (2001)
WMO. (July 2009) WMO dust and sand storm warning advisory and assessment system (SDS-WAS): implementation plan 2009-2013 (Draft)
Water
Alverson, K., 20 10, Oceans Observations and Services, Intergovernmental Oceanographic Commission of UNESCO, Arctic Ocean Observation GOOS Presentation (PPP), 33 pages
AMY Asian Monsoon Years, Asian monsoon monitoring presentation
An important observational tool for planetary science, Report, Ocean from Space, Venice 2010 (collection of lectures, presentations, posters, pictures, documents and things ...) , 6 pages
Bonsor, H. et al, Interpretation of GRACE data of the Nile basin using a groundwater recharge model. Hydrol. Earth Syst. Sci. Discuss., 7, 4501–4533, 2010 www.hydrol-earth-syst-sci-discuss.net/7/4501/2010/doi:10.5194/hessd-7-4501-2010
Canada Agriculture and AgriFood Canada, Agriculture and Agri-Food Canada’s Drought Monitoring and Information System, GEO – DRI Drought Monitoring Workshop, Winnipeg, May 10, 2010
Ceccato, P., Remote sensing for water resources management. IRI Presentation
ChloroGIN Chlorophyll Globally Integrated Network, Minutes of the ChloroGIN Workshop, Kochi, India, 18 - 19 February 2010
CLIVAR/AMMP-10 at APCC, Korea, June 18, 2010
EEA European Environment Agency, Water resources across Europe- confronting water scarcity and drought. ISSN 1725-9177, EEA Report 2/2009
ESA SM OS N ew global network validates SMOS soil moisture data http://www.esa.int/esaLP/SEM9UI19Y8G_LPsmos_0.html, Jan. 2011
EUMETSAT Altimetry programs Jason 3, presentation at OSTST meeting, Seattle USA< June 22-24, 2009
EUMETSAT Plans, Klaes, K.D. 16th International TOV8 Study Conference, Brasil 2008
Famiglietti, J. et al, Terrestrial and global hydrology from satellite observations of time-variable gravity, Presentation
Fangohr, S., Fluxes through the air-sea interface, Report, Ocean from Space, Venice 2010 (collection of lectures, presentations, posters, pictures, documents and things ...), 32 pages
Fekete, B. and C. Vörösmarty The current status of global river discharge monitoring and potential new technologies complementing traditional discharge measurements. In: Predictions in Ungauged Basins: PUB Kick-off (Proceedings of the PUB Kick-off meeting held in Brasilia, 20-22 Nov 2002, IAHS Publ. 309, 2007, 129-136
FUGRO Global Environmental & Ocean Sciences, brochure, 2005
Geological Society of America, Managing Drought: A Roadmap for Change in the United States. A Conference Report from Managing Drought and Water Scarcity in Vulnerable Environments, 18-20 September 2006, Longmont, USA
GEOSS African Water Cycle Symposium, programme. Tunis, Tunisia, 6-9 January 2009
GEOSS As ia-Pacific S ymposium, K artasasmita, M . Earth observation activities in Indonesia (related to GEOSS activities), presented a t th e Third G EOSS A sia-Pacific Symposium, Kyoto, Japan, 4-6 February 2009
GEWEX Global energy and water cycle experiment, Wikipedia, http://en.wikipedia.org/wiki/Global_Energy_and_Water_Cycle_Experiment, 2008
GEWEX Newsletter, Vol. 20-2, May 2010
GEWEX Plans for 2013 and Beyond. www.gewex.org
GEWEX, Pan GEWEX meeting, p resentation b y Kevin Trenberth, Chair SSG, Seattle, Washington, August 2010
GEWEX, P lanning for GEWEX Post 2013, The following will be discussed at the Second Pan-GEWEX science meeting in Seattle on August 23-27, 2010
GMES Marine monitoring service, Product/Service portfolio, brochure. Feb 2010
GODAE Davidson, F. et al, Safety and effectiveness of operations at sea, Presentation at GODAE Final Symposium, 12-15 November 2008, Nice, France
GODAE B ahurel, P. et a l, MyOcean, a European example of post-GODAE initiatives, Presentation at GODAE Final Symposium, 12-15 November 2008, Nice, France
GODAE Balmaseda, M. et al, Ocean Initialization for Seasonal Forecasts, Presentation at GODAE Final Symposium, 12-15 November 2008, Nice, France
GODAE Blanc, F. et al, Data and product serving, an overview of capabilities developed in 10 years, Presentation at GODAE Final Symposium, 12-15 November 2008, Nice, France
GODAE Brasseur, P. et a l, Integrating biogeochemistry and ecology into ocean data assimilation systems, Presentation at GODAE Final Symposium, 12-15 November 2008, Nice, France
GODAE De Mey, P. Coastal modelling and applications,
GODAE Development and implementation plan, 2004
GODAE Dombrowsky, E. et al, GODAE systems in operation, Presentation at GODAE Final Symposium, 12-15 November 2008, Nice, France
GODAE Goni, G. et a l, Applications of satellite-derived ocean measurements to tropical cyclone intensity forecasting, Presentation at GODAE Final Symposium, 12-15 November 2008, Nice, France
GODAE Hackett , B. et al, Marine pollution monitoring and prediction, Presentation at GODAE Final Symposium, 12-15 November 2008, Nice, France
GODAE Harrison, D. et al, The in situ Global Ocean Observing System - Progress since Ocean Observations Conference 1999, white paper, first draft
GODAE Hurlburt, H. et al, Global high resolution analyses and forecasts at the mesoscale, Presentation at GODAE Final Symposium, 12-15 November 2008, Nice, France
GODAE Jiang Zhu et al, Asia and Oceania Applications, Presentation at GODAE Final Symposium, 12-15 November 2008, Nice, France
GODAE Kamachi, M. et al, Regional resolution analyses and forecasts at the mesoscale, Presentation at GODAE Final Symposium, 12-15 November 2008, Nice, France
GODAE Le Traon, P. et al, GODAE oceanview: from an experiment towards a long-term ocean analysis and forecasting international program, Presentation a t G ODAE F inal Symposium, 12-15 November 2008, Nice, France
GODAE Lee, T. e t al, Ocean State Estimation for Climate Research, Presentation a t GODAE Final Symposium, 12-15 November 2008, Nice, France
GODAE Observing and Forecasting the Oceans: 10 Years of Achievements. Brochure 2008
GODAE Ok e, P . e t a l, Observing System Evaluation, Presentation a t G ODAE F inal Symposium, 12-15 November 2008, Nice, France
GODAE R ayner, R. a nd R. Stephens, Offshore industry applications, Presentation a t GODAE Final Symposium, 12-15 November 2008, Nice, France
GODAE Wilson, S. et al, Satellite Observing Systems and Relevance to GODAE. Paper presented at the GODAE Final Symposium, Nice, France, 12-15 November 2008
GODAE Woodham, R. et al, Applications from GODAE to Navies throughout the world, Presentation at GODAE Final Symposium, 12-15 November 2008, Nice, France
GRDC Hydrologic information – metadata; semantic structure for the description of hydrologic data (GRDC metadata profile, final draft). GRDC report series, report 39, 2008
GTOS ECV T03 Terrestrial Groundwater v0.5, 2008
GTOS ECV T04 Water level in lakes and reservoirs, water storage,GTOS 59, v8 May 2009
GTOS ECV T05 Snow cover, GTOS 60, v8, May 2009
GTOS, ECV T1 GTOS 56 River discharge, v8, Nov 2008
GTOS, ECV T6 GTOS 61 Glaciers and ice caps, v10, May 2009
HARIMAU Yamanaka, M.D. HARIMAU Radar-Profiler Network over the Indonesian
Houborg, R. et al, Toward integrating enhanced GRACE terrestrial water storage data into the U.S. and North American drought monitors. American Meteorological Society, 2007
ICARE Thematic Centre for Cloud, Aerosol, Water and Radiation. Presentation at CEOS-WGISS meeting, May 13, 2009
IGWCO Update of IGWCO activities and links with other programmes including GWSP and GEOSS. Presentation at IGOS 13 Meeting, 23 May 2006, Geneva Switzerland
INSHORE Janssens, R. et al, Integration of optical and acoustic remote sensing data over the backshore-foreshore-nearshore continuum, a case study in Oostende. Presentation at Belgian Earth Observation Day, May 6, 2010, Chaudfontaine, Belgium
IOC Intergovernmental Oc eanographic C ommission, IOC Principles and strategy for capacity building. Tema report no 1, IOC/INF-1211 UNESCO 2005
IODE International Oceanographic Data and Information Exchange (IODE), First African marine atlas in Africa launched http://iodeweb2.vliz.be/omap/OMAP/index.htm
Large ocean phenomena with human impact, Report, Ocean from Space, Venice 2010 (collection of lectures, presentations, posters, pictures, documents and things ...), 62 pages
Lawford, R., 2010, Update on the Integrated Global Water Cycle Observation (IGWO) COP, Presentation (PPP), Geo User Engagement Session, Beijing, China, 29 pages
Looking forward, Report, Ocean from Space, Venice 2010 (collection of lectures, presentations, posters, pictures, documents and things ...), 13 pages
Maritime Continent: A GEOSS Early Achievement for Hydrological Cycle and Disaster Prevention. Journal of Disaster Research Vol.3 No.1, 2008
Mesoscale ocean features: Eddies, Report, Ocean from Space, Venice 2010 (collection of lectures, presentations, posters, pictures, documents and things ...), 46 pages
Mesoscale ocean features: fronts, Report, Ocean from Space, Venice 2010 (collection of lectures, presentations, posters, pictures, documents and things ...), 43 pages
MICAS Monitoring Inland and Coastal Waters with APEX; A wavelet approach. Presentation at BEO Day, 6 May 2010
Modelling Watershed Geomorphology with TNTMips. Tutorial on http://www.microimages.com, 2010
MyOcean Catalogue v.3, Mar 2010 www.myocean.eu.org
MyOcean, MyOcean Information System; architecture and technical interfaces.
MyOcean, Towards the GMES marine core service, presentation at the European Meteorological Society Conference, Toulouse, France, 28 Sep – 2 Oct 2009.
NIDIS Newsletter, Vol. 1 no 1, 2009
NIDIS The National Integrated Drought Information System, Implementation Plan. 2007
Ocean biology from space, Report, Ocean from Space, Venice 2010 (collection of lectures, presentations, posters, pictures, documents and things ...), 54 pages
Ocean mesoscale features: Upwelling and other phenomena, Report, Ocean from Space, Venice 2010 (collection of lectures, presentations, posters, pictures, documents and things ...), 35 pages
Ocean surface waves, Report, Ocean from Space, Venice 2010 (collection of lectures, presentations, posters, pictures, documents and things ...), 40 pages
Operational Infrastructure of GMES Marine Core Services, my ocean, power point presentation for GEOS User Engagement Session, 1-2 November 2010, Ocean from Space, Venice 2010 (collection of l ectures, presentations, posters, p ictures, documents and things ...), 18 pages
PI-GOOS Pacific Island GOOS: Supporting sustainable development in the Pacific Islands through coastal and marine observations. Presentation 2008
Planetary waves and large-scale ocean dynamics, Report, Ocean from Space, Venice 2010 (collection of lectures, presentations, posters, pictures, documents and things ...), 44 pages
Putting ocean remote sensing to work, Report, Ocean from Space, Venice 2010 (collection of lectures, presentations, posters, pictures, documents and things ...), 67 pages
Robinson, I., Discovering the Ocean from Space, the unique applications of satellite oceanography, Springer-Praxis Books in Geophysical Science, Ocean from Space, Venice 2010 (collection of lectures, presentations, posters, pictures, documents and things ...), ISBN 978-3-540-24430-1, 46 pages
Salama, S . (2010) Uncertainty of inherent optical properties as derived from global products of ocean colour data. In: Ocean Optics XX : 20th Ocean Optics Conference 2010, 27 September-1 October 2010, Anchorage, Alaska. pp. 1-6.
Shelf seas, estuaries, and coasts, Report, Ocean from Space, Venice 2010 (collection of lectures, presentations, posters, pictures, documents and things ...), 54 pages
Silva, J. da, Internal waves, R eport, O cean f rom S pace, V enice 2 010 (collection o f lectures, presentations, posters, pictures, documents and things ...), 31 pages
SPREP Secretariat of the Pacific Regional Environment Programme, Chapman, B; et al (2010): Reviewing Weather and Climate Services in the Pacific. Unpublished report to the Secretariat of the Pacific Regional Environment Programme (SPREP). Apia, Fiji
The methods of oceanography, Report, Ocean from Space, Venice 2010 (collection of lectures, presentations, posters, pictures, documents and things ...), 61 pages
TIGER S u, Z ., TIGER or DRAGON: Capacity Building in Earth Observation of Water Resources Systems as a backbone for Informed Water Resources Management. Presentation at ITC Seminar Water management in Africa, Enschede, the Netherlands, 2008
TIGER V ekerdy, Z . et a l, TIGER capacity building facility: growing from projects to professional community. Presentation at SPRS Mid-Term Symposium Commission VI, Enschede, 2010
UN, Economic Commission for Europe, Guidance on Water and Adaptation to Climate Change, Climate Europe Report 2010, Convention on the protection and use of transboundary watercourses and international lakes, 2010, 144 pages
UN-FAO Water monitoring; mapping existing global systems & initiatives. Background document, Aug. 2006
Velde, van der, R., Z. Su, and P. van Oevelen (2010) Soil moisture remote sensing using active microwaves and land surface modelling, P hD Theses, E nschede, University of Twente Faculty of Geo-Information and Earth Observation ITC, 2010. ITC Dissertation 176, 192 p. ISBN: 978-90-6164-296-1.
Wind over the sea, R eport, Ocean f rom S pace, V enice 2 010 (collection o f l ectures, presentations, posters, pictures, documents and things ...), 25 pages
WMO Drought monitoring and early warning: concepts, progress and future challenges
WMO Workshop on the redesign and optimization of the spacebased GOS: Observation strategy for ocean surface topography and sea state. Geneva Switzerland, June 2007
WMO-No. 1006 2006, World Meteorological Organization, ISBN 92-63-11006-9
Weather
Bougeault P. et al, (2009), The Thorpex Interactive Grand Global Ensemble (TIGGE), article
Cloché, S. et al, The Megha-Tropiques vision - MT Overview, Helsinki, Finland, June 2010
CNES, Earth, environment & climate, brochure
Commission for Atmospheric Sciences, International Core Steering Committee for Thorpex, final report, eighth session, Offenbach, Germany, 2-4 November 2009
DevCoCast GEONETCast applications for and by developing countries, brochure
DMI, The Forecasting Services Department in society, Denmark, brochure
ECMWF, Källén E. (2010) ECMWF research and development activities, presentation for the NCEP Seminar, February 2010
Eumetsat, Verschuur H. (2009) GEONETcast dissemination concept and services serving the world, presentation, Enschede, The Netherlands
EUMETSAT, Wolf L. (2007) GEONETCast Global design document, document number: EUM/OPS/DOC/06/1799
GEO Task WE-06-03, presentation f or t he User Interface C ommittee ( UIC) M eeting, Boulder, Colorado, USA, September 2008
GEONETCast Americas Product List (2010)
GEONETcast Delivering environmental data to users worldwide, presentation for ADC-10 Stresa, May 2009
Hou A . Y., The global precipitation measurement (GPM) mission: an overview, presentation for the 2006 EUMETSAT Meteorological Satellite Conference Helsinki, Finland, 12-16 June 2006
Huang, A. (2010) Options and Choices for Meteorological Satellite Direct Broadcast Users in Real-Time Applications Presentation User Engagement Session GEO-VII Plenary
ITC, Maathuis B. (2009) ILWIS 3.6 Open GEONETCast Toolbox Plug-in User Manual, part 1, version 1
ITC, Maathuis B., C. Mannaerts et al (2008) The ITC GEONETcast-toolbox approach for less developed countries, article ISPRS Beijing, China
Lenaerts, J., M. van den Broeke, S. Déry, G. Kőnig-Langlo, J. Ettema, and P. Munneke. (2010) Modelling snowdrift sublimation on an Antarctic ice shelf. The Cryosphere, 4, 179–190, 2010
Pal P.K., Megha-Tropiques, presentation
WMO, Caughey J., TIGGE (THORPEX Interactive Grand Global Ensemble) WWRP – THORPEX TIGGE, (2008) The THORPEX Interactive Grand Global Ensemble, brochure


![Eliminating Bottlenecks with KaiNexus [Webinar]](https://img.pdfslide.us/doc/110x75/55c4c89ebb61eb03358b45a6/eliminating-bottlenecks-with-kainexus-webinar.jpg)