Embed Size (px)
Citation preview
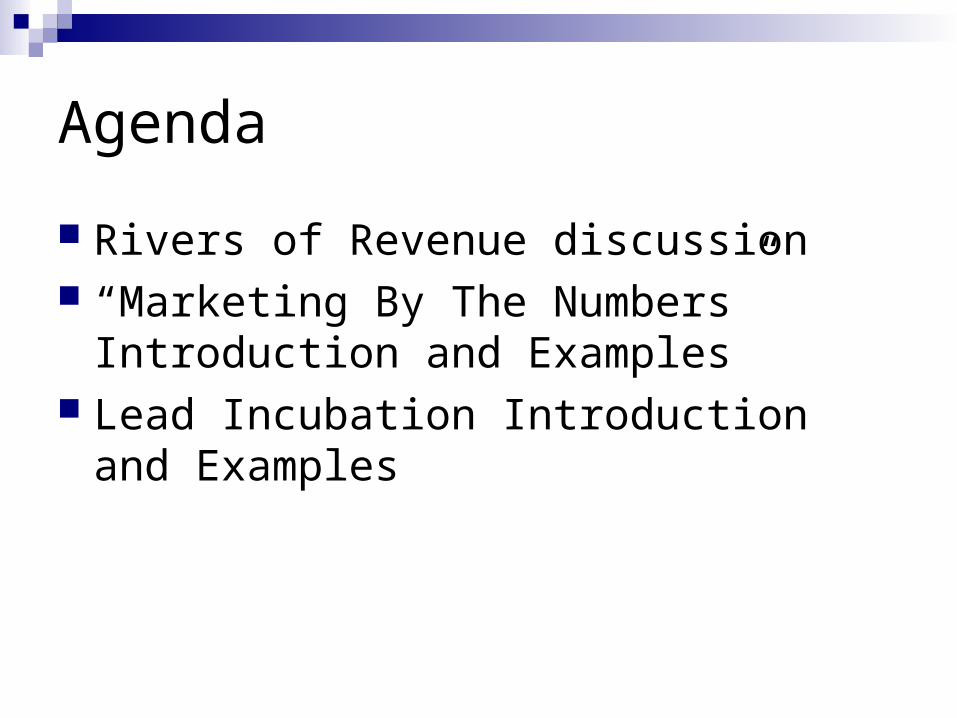
Agenda
Rivers of Revenue discussion “Marketing By The Numbers” Introduction
and Examples Lead Incubation Introduction and
Examples
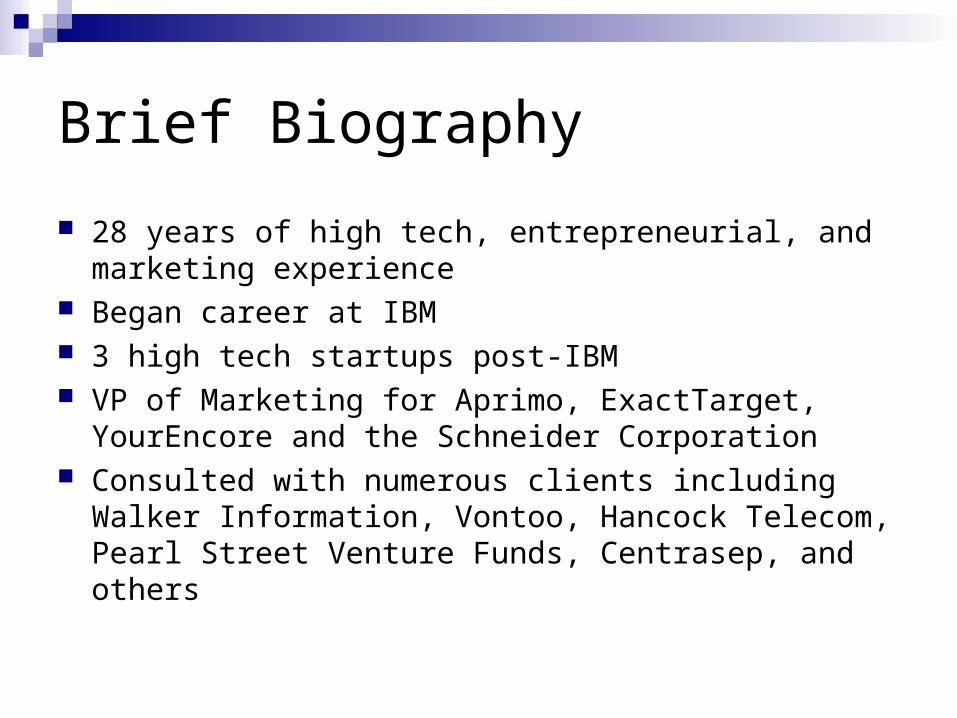
Brief Biography
28 years of high tech, entrepreneurial, and marketing experience
Began career at IBM 3 high tech startups post-IBM VP of Marketing for Aprimo, ExactTarget, YourEncore
and the Schneider Corporation Consulted with numerous clients including Walker
Information, Vontoo, Hancock Telecom, Pearl Street Venture Funds, Centrasep, and others
Rivers of Revenue
Your current river is drying up. Or, you just need to find new sources of income, so your company can grow.
Whatever the cause, it's time for you to identify new rivers of revenue and start making sales.
2004

Marketing By The Numbers
Ensure that the marketing plan/strategy that you put in place supports the key business targets
Business targets can be revenue, number of customers, number of sales appointments, etc.
You will need to make some assumptions first time around. Fine-tune over time.
If you can’t measure it, don’t do it.

Marketing By The Numbers
Number of total leads needed
% of leads that qualified
% of prospects to meet with
% of proposals that close
Number of new customers/revenue
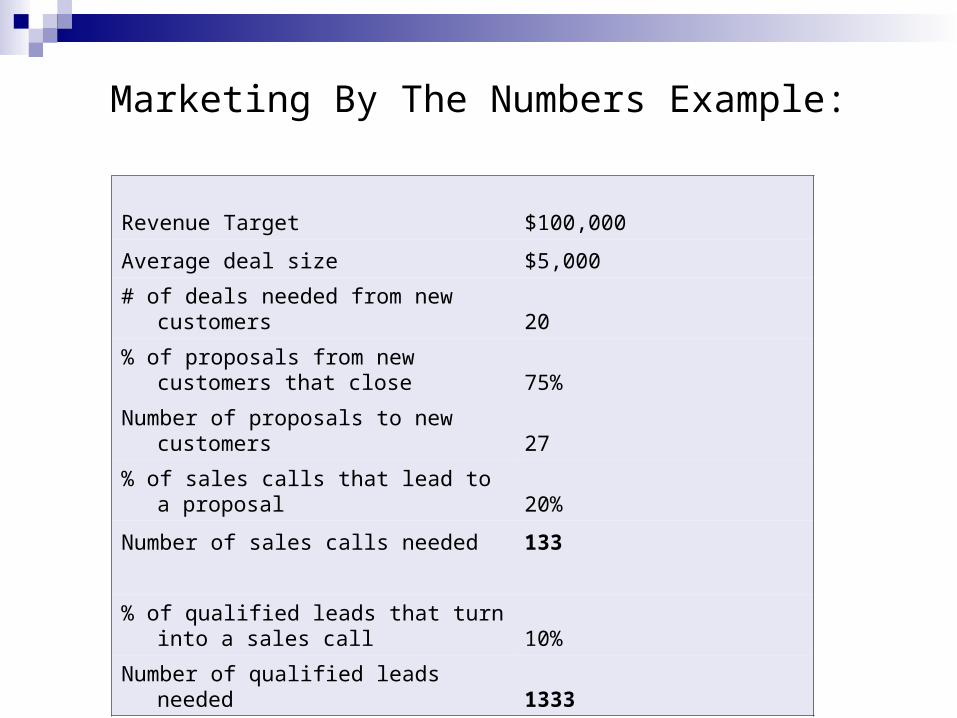
Marketing By The Numbers Example:
Revenue Target $100,000
Average deal size $5,000
# of deals needed from new customers 20
% of proposals from new customers that close 75%
Number of proposals to new customers 27
% of sales calls that lead to a proposal 20%
Number of sales calls needed 133
% of qualified leads that turn into a sales call 10%
Number of qualified leads needed 1333
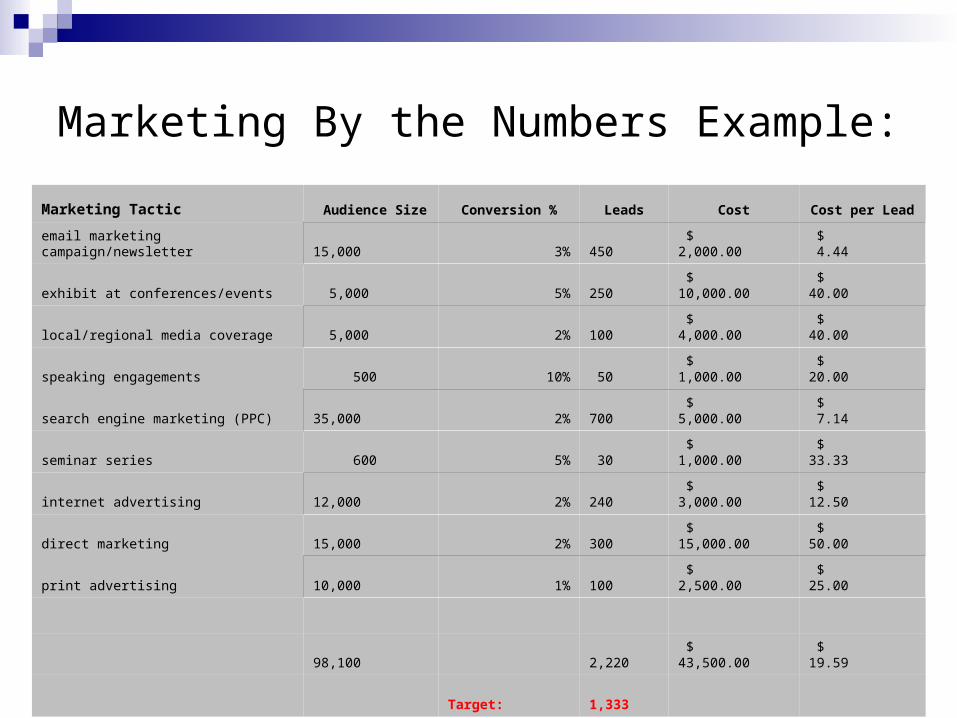
Marketing By the Numbers Example:
Marketing Tactic Audience Size Conversion % Leads Cost Cost per Lead
email marketing campaign/newsletter 15,000 3% 450 $ 2,000.00 $ 4.44
exhibit at conferences/events 5,000 5% 250 $ 10,000.00 $ 40.00
local/regional media coverage 5,000 2% 100 $ 4,000.00 $ 40.00
speaking engagements 500 10% 50 $ 1,000.00 $ 20.00
search engine marketing (PPC) 35,000 2% 700 $ 5,000.00 $ 7.14
seminar series 600 5% 30 $ 1,000.00 $ 33.33
internet advertising 12,000 2% 240 $ 3,000.00 $ 12.50
direct marketing 15,000 2% 300 $ 15,000.00 $ 50.00
print advertising 10,000 1% 100 $ 2,500.00 $ 25.00
98,100 2,220 $ 43,500.00 $ 19.59
Target: 1,333

Marketing By the Numbers Example:
Marketing Tactic Audience Size Conversion % Leads Cost Cost per Lead
email marketing campaign/newsletter 15,000 3% 450 $ 2,000.00 $ 4.44
exhibit at conferences/events 5,000 5% 250 $ 10,000.00 $ 40.00
local/regional media coverage 5,000 2% 100 $ 4,000.00 $ 40.00
speaking engagements 500 10% 50 $ 1,000.00 $ 20.00
search engine marketing (PPC) 35,000 2% 700 $ 5,000.00 $ 7.14
seminar series 600 5% 30 $ 1,000.00 $ 33.33
internet advertising 12,000 2% 240 $ 3,000.00 $ 12.50
direct marketing 15,000 2% 300 $ 15,000.00 $ 50.00
print advertising 10,000 1% 100 $ 2,500.00 $ 25.00
1,330 $ 43,500.00 to
$11,500 $ 19.59 to
$8.04
Target: 1,333

Client Example:
Planned Actual
January - 15% growth 900 1290 143%
February - 15% growth 1035 985 95%
March - 15% growth 1190 1530 129%
April - 15% growth 1369 1201 88%
May - 15% growth 1574 1758 112%
June - 15% growth 1810 1881 104%
July - 10% growth 1991 1796 90%
August - 5% growth 2091 1756 84%
September - 5% growth 2195 1925 88%
October - 5% growth 2305 1941 84%
November - 10% growth 2535 2135 84%
December - 10% growth 2789 1490 53%
21784 19688

Client Example: Multiple P/L Centers P/L 1 P/L 2 P/L 3 P/L 4 P/L 5 P/L 6
Revenue Goal 1000 2000 3000 2000 3000 3000
Backlog 0 0 0 0 0 0
Recurring Revenue 1000
Revenue Target 1000 2000 3000 2000 2000 3000
Average Deal Size 100 100 300 50 50 100
Number of deals Needed 10 20 10 40 40 30
% of Opptys that Close 40% 10% 10% 50% 20% 50%
Number of Opptys Needed 25 200 100 80 200 60
% of leads > to Opptys 10% 10% 15% 50% 20% 50%
Number of leads Needed 250 2000 667 160 1000 120
% of leads needed from Mtkg 10% 10% 10% 0% 50% 10%
Number of Mktg leads needed 25 200 67 0 500 12 804
Number of leads/month 2 17 6 0 42 1 67
Cost per qualified lead $ 80.00
Discretionary Mktg Budget $64,293.33

Client Example: Multiple P/L Centers
Date/Marketing Tactic Date AudienceForecast
Leads Cost P/L 1 P/L 2 P/L 3 P/L 4 P/L 5 P/L 6Jan-10
Email Newsletter - January Edition 2nd Tuesday 4500 50 50.00$ X X X X X XEmail Newsletter - January Special Edition 3rd Tuesday 2000 50 25.00$ X X X X X Xemail campaign 1 TBD 500 15 10.00$ X Xemail campaign 2 TBD 500 15 10.00$ X Xemail campaign 3 TBD 500 15 10.00$ X Xemail campaign 4 TBD 500 15 10.00$ X XPress Release: TBD TBD General 10 1,000.00$ X X X X X XProduct Campaign 1 TBD 500 10 10.00$ X X XProduct Campaign 2 TBD 500 10 10.00$ X XWebinar A TBD 500 10 -$ X XWebinar B TBD 500 10 -$ X X X X X
Feb-10Email Newsletter - Feb Edition 2nd Tuesday 4500 50 50.00$ X X X X X XEmail Newsletter - Feb Special Edition 3rd Tuesday 2000 50 25.00$ X X X X X Xemail campaign 1 TBD 500 15 10.00$ X Xemail campaign 2 TBD 500 15 10.00$ X Xemail campaign 3 TBD 500 15 10.00$ X Xemail campaign 4 TBD 500 15 10.00$ X XPress Release: TBD TBD General 10 1,000.00$ X X X X X XProduct Campaign 1 TBD 500 10 10.00$ X X XProduct Campaign 2 TBD 500 10 10.00$ X XWebinar A TBD 500 10 -$ X XWebinar B TBD 500 10 -$ X X X X X
Mar-10Email Newsletter - March Edition 2nd Tuesday 4500 50 50.00$ X X X X X XEmail Newsletter - March Special Edition 3rd Tuesday 2000 50 25.00$ X X X X X Xemail campaign 1 TBD 500 15 10.00$ X Xemail campaign 2 TBD 500 15 10.00$ X Xemail campaign 3 TBD 500 15 10.00$ X Xemail campaign 4 TBD 500 15 10.00$ X XPress Release: TBD TBD General 10 1,000.00$ X X X X X XProduct Campaign 1 TBD 500 10 10.00$ X X XProduct Campaign 2 TBD 500 10 10.00$ X XWebinar A TBD 500 10 -$ X X
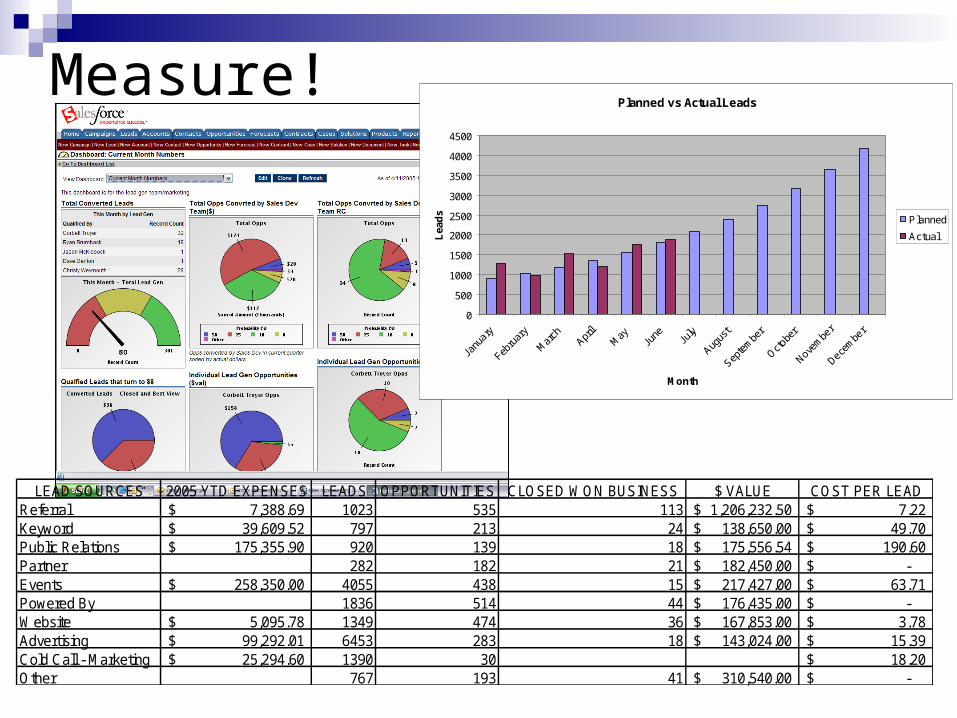
Measure! Planned vs Actual Leads
0
500
1000
1500
2000
2500
3000
3500
4000
4500
Janu
ary
Febru
ary
Mar
chApr
ilM
ayJu
ne July
Augus
t
Septe
mbe
r
Octobe
r
Novem
ber
Decem
ber
Month
Lea
ds Planned
Actual
LEAD SOURCES 2005 YTD EXPENSES LEADS OPPORTUNITIES CLOSED WON BUSINESS $ VALUE COST PER LEADReferral 7,388.69$ 1023 535 113 1,206,232.50$ 7.22$ Keyword 39,609.52$ 797 213 24 138,650.00$ 49.70$ Public Relations 175,355.90$ 920 139 18 175,556.54$ 190.60$ Partner 282 182 21 182,450.00$ -$ Events 258,350.00$ 4055 438 15 217,427.00$ 63.71$ Powered By 1836 514 44 176,435.00$ -$ Website 5,095.78$ 1349 474 36 167,853.00$ 3.78$ Advertising 99,292.01$ 6453 283 18 143,024.00$ 15.39$ Cold Call - Marketing 25,294.60$ 1390 30 18.20$ Other 767 193 41 310,540.00$ -$

How Do You Measure Success?OCTOBER 22, 2009 Custom content good for ROINearly three-quarters of companies have guidelines to measure the success of their marketing programs, and for one-half such measurements are a requirement for obtaining marketing funding, according to the King Fish Media “2009 Survey on Marketing, Media and Measurement,” conducted in partnership with HubSpot, Junta42 and the Upshot Institute. The No. 1 metric of success for the marketing and sales managers polled was the number of new customers acquired. Lead generation and increased sales were also tracked by more than two-thirds of respondents.

Lead Incubation
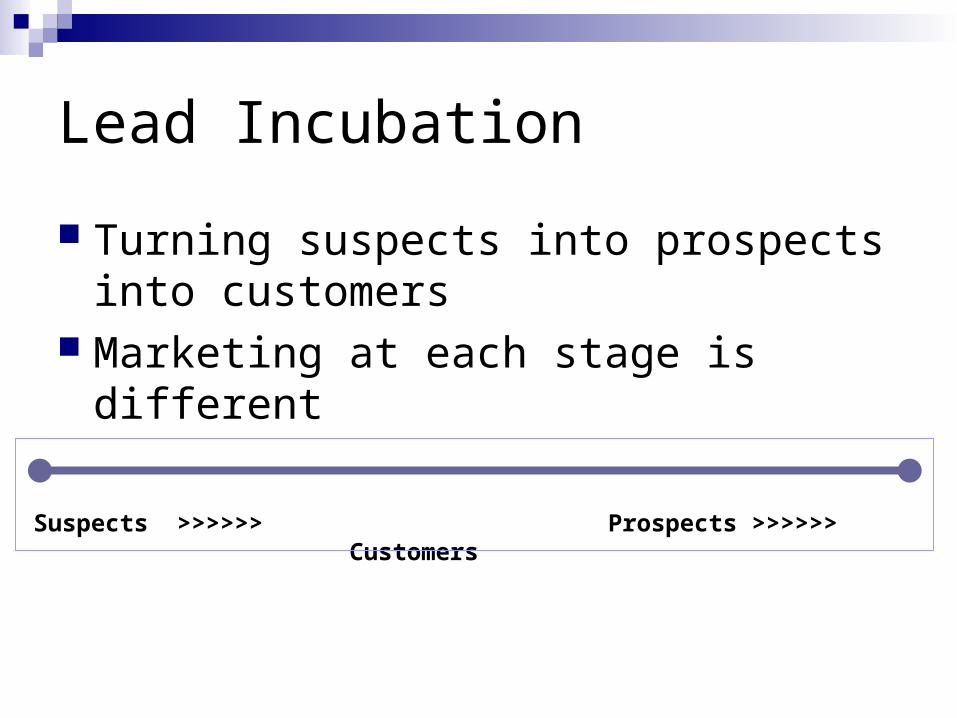
Lead Incubation
Turning suspects into prospects into customers
Marketing at each stage is different
Suspects >>>>>> Prospects >>>>>> Customers

Lead Incubation
Tradeshows Phone-ins Conferences
Print Advertisements Email campaigns Loyalty programs
Yellow Page Ads Inside Sales/Telemarketing Newsletters
Banner Ads Targeted direct marketing Upgrade offers
Public Relations Seminar Attendees Exclusive offerings
Television/Radio Advertising Invite to special events
White Papers
Suspects >>>>>> Prospects >>>>>> Customers
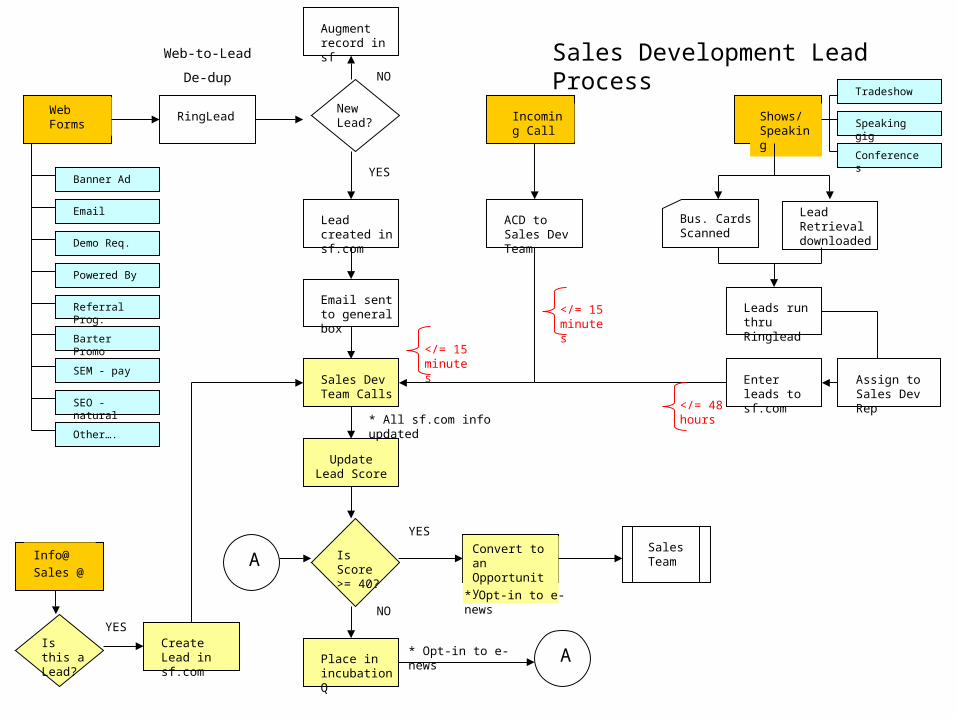
Web Forms
RingLead
Email sent to general box
Place in incubation Q
Update Lead Score
Sales Dev Team Calls
Lead created in sf.com
Web-to-Lead
De-dup
New Lead?
YES
</= 15 minutes
Is Score >= 40?
YES
Enter leads to sf.com
Convert to an Opportunity
Sales Team
NO
* Opt-in to e-news
* Opt-in to e-news
A
A
Incoming Call
Leads run thru Ringlead
Lead Retrieval downloaded
ACD to Sales Dev Team
</= 15 minutes
* All sf.com info updated
Shows/ Speaking
Bus. Cards Scanned
</= 48 hours
Sales Development Lead Process
Banner Ad
Demo Req.
Powered By
Referral Prog.
Barter Promo
SEM - pay
SEO - natural
Other….
Tradeshow
Speaking gig
Conferences
Assign to Sales Dev Rep
Info@
Sales @
Is this a Lead?
Create Lead in sf.com
YES
NO
Augment record in sf