Embed Size (px)
Citation preview
Marketing AnalyticsPullman MBA
Strategize. Analyze. Lead
Mauricio Featherman, Ph.D.
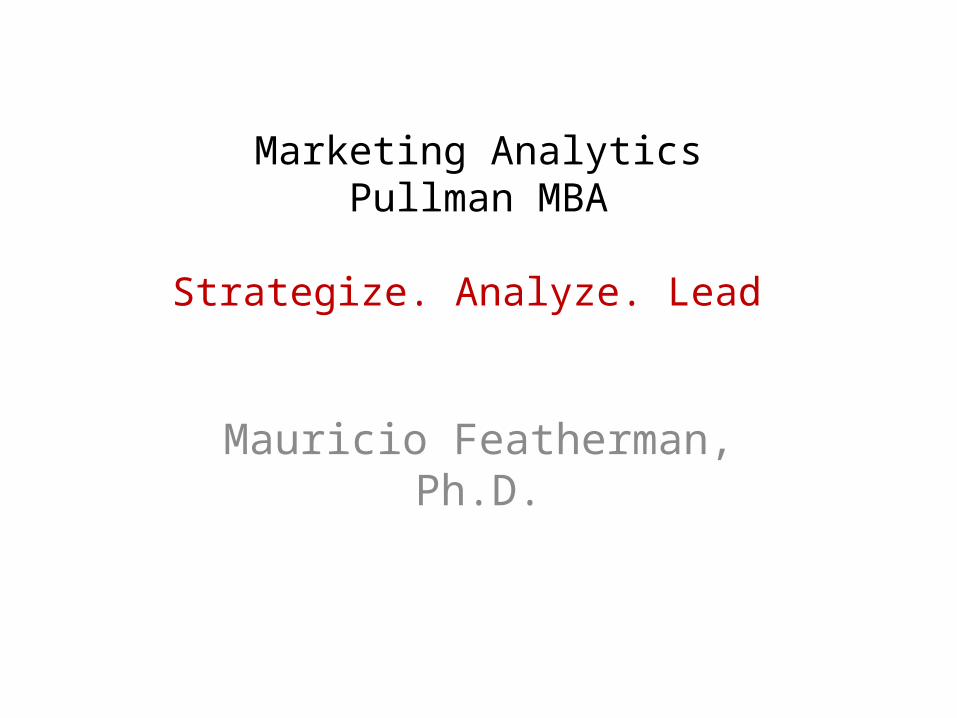
Marketing Analytics:Transforming Data into Decisions
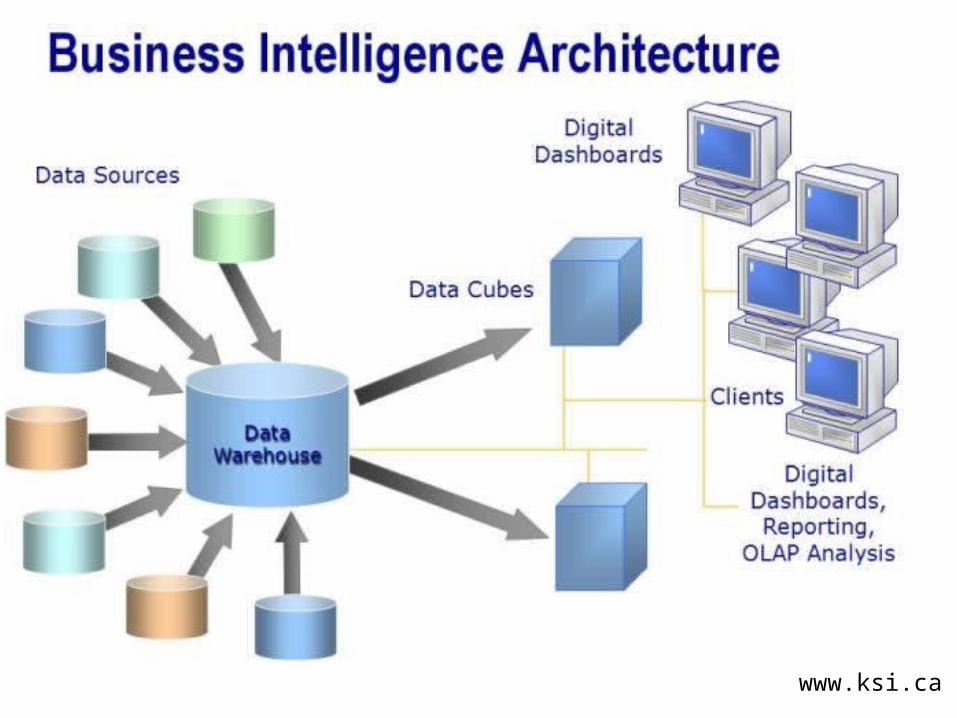
We go thru the process of retrieving, integrating and copying data into a data warehouse.
Next we use Visual Statistics and analytics programs to analyze the datasets
Next recommend management action.
$$
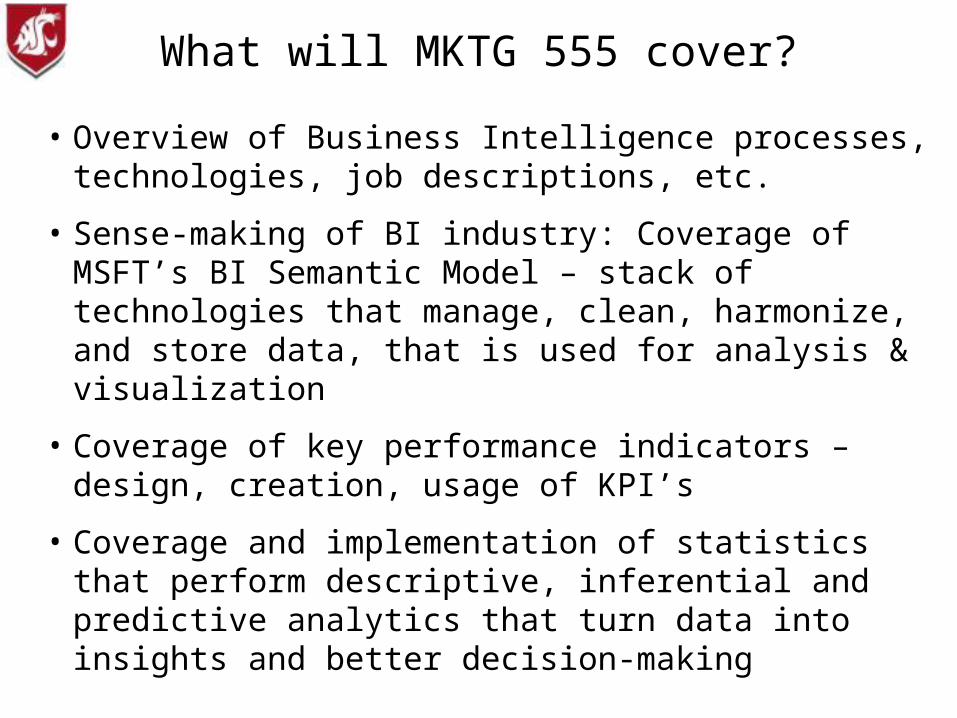
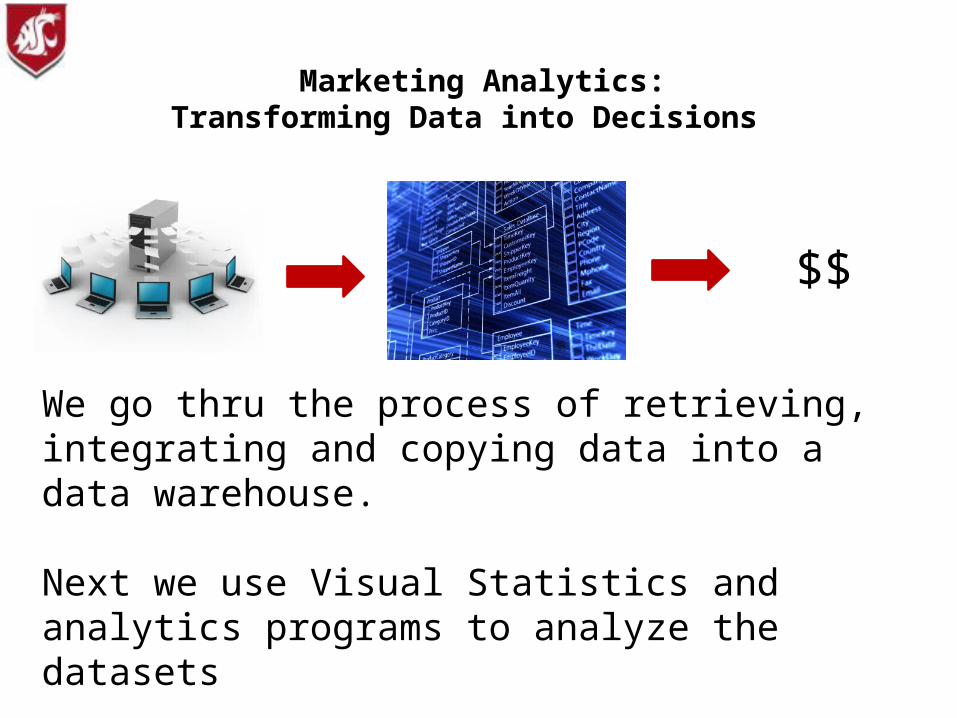
What will MKTG 555 cover?
• Overview of Business Intelligence processes, technologies, job descriptions, etc.
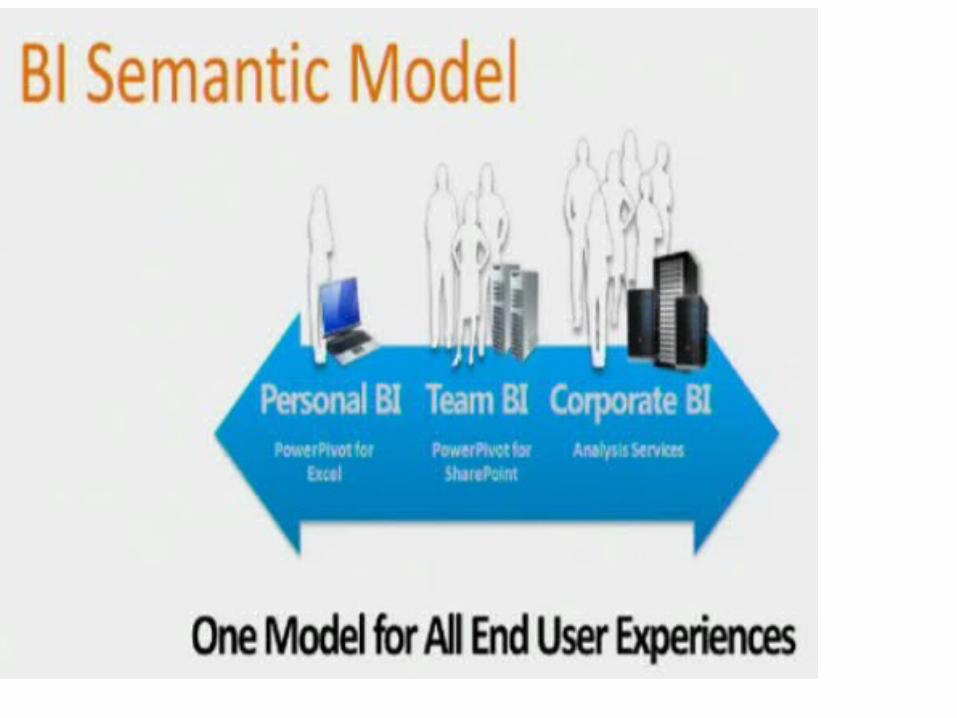
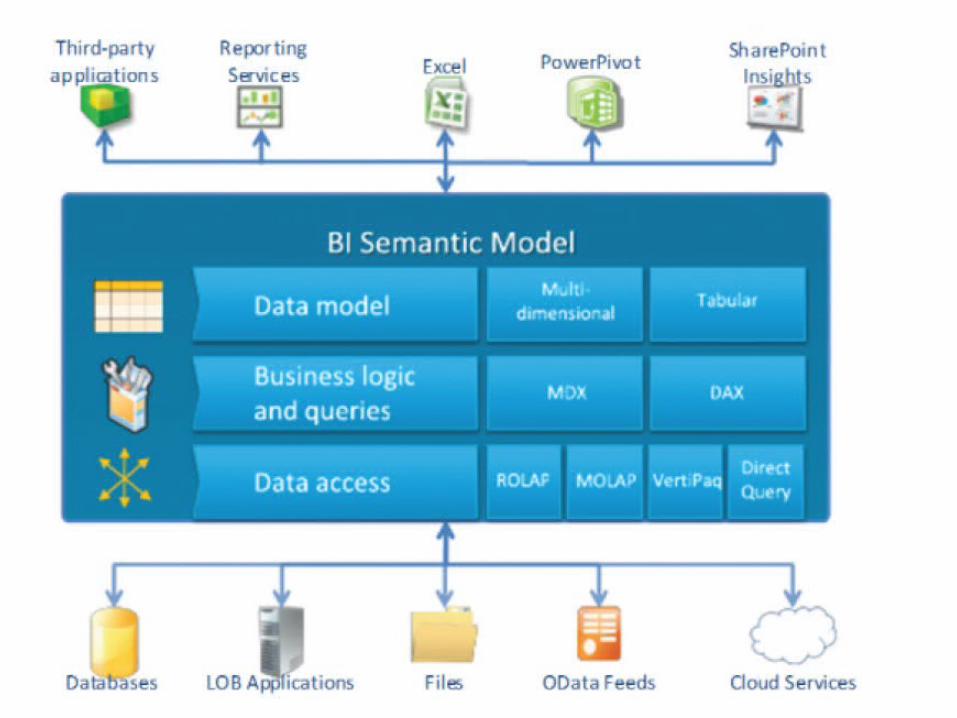
• Sense-making of BI industry: Coverage of MSFT’s BI Semantic Model – stack of technologies that manage, clean, harmonize, and store data, that is used for analysis & visualization
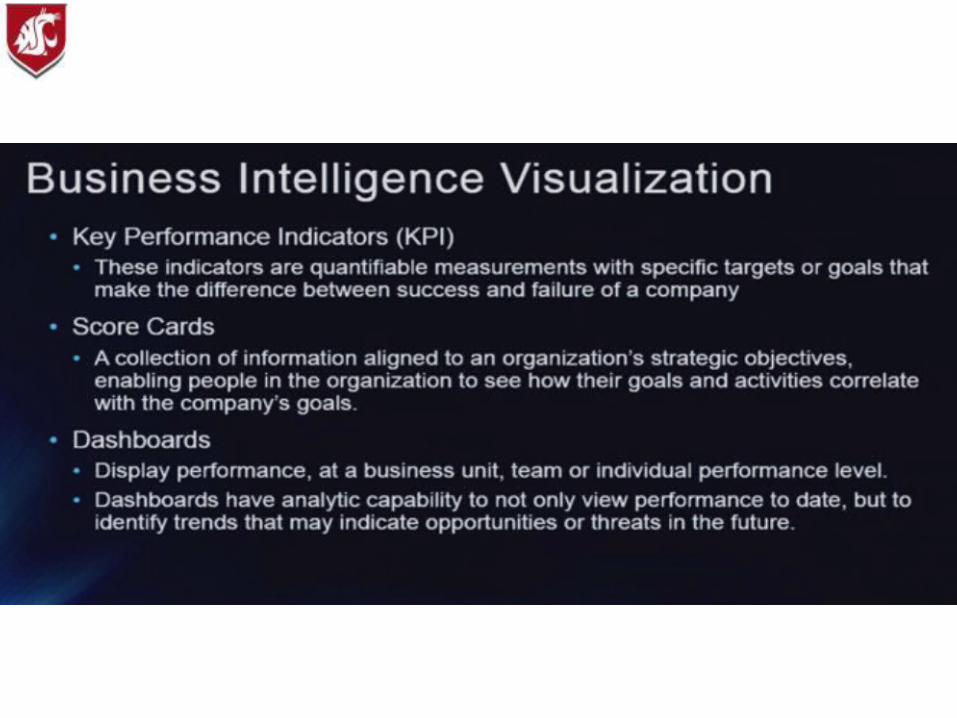
• Coverage of key performance indicators – design, creation, usage of KPI’s
• Coverage and implementation of statistics that perform descriptive, inferential and predictive analytics that turn data into insights and better decision-making
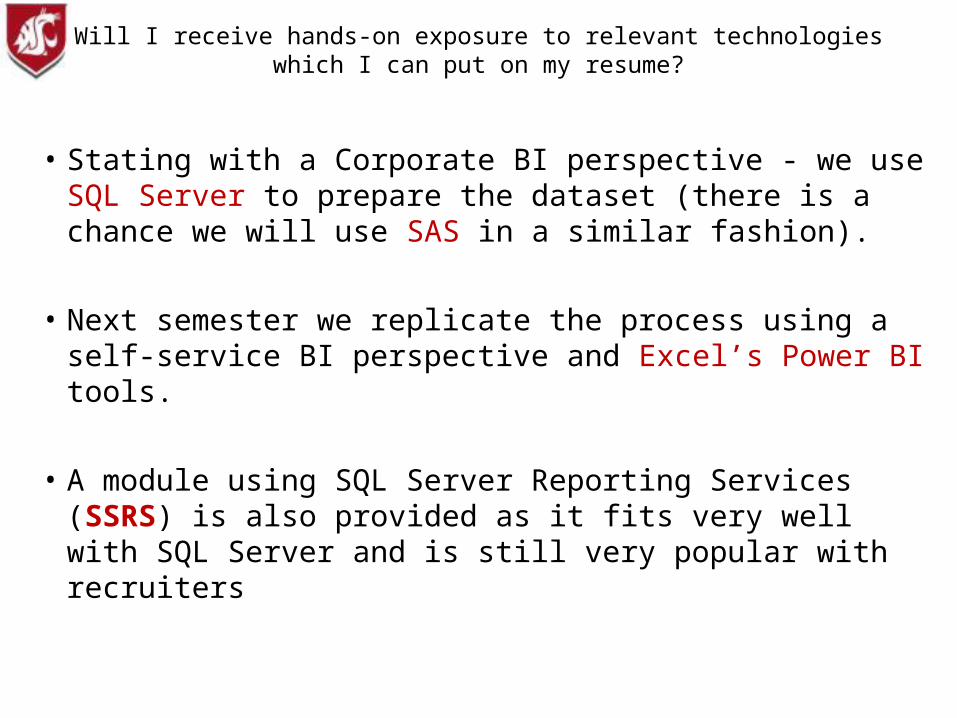
Will I receive hands-on exposure to relevant technologies which I can put on my resume?
• Stating with a Corporate BI perspective - we use SQL Server to prepare the dataset (there is a chance we will use SAS in a similar fashion).
• Next semester we replicate the process using a self-service BI perspective and Excel’s Power BI tools.
• A module using SQL Server Reporting Services (SSRS) is also provided as it fits very well with SQL Server and is still very popular with recruiters
Will I receive hands-on exposure to relevant technologies which I can put on my resume?
• We perform statistics and data mining using SAS
• We perform data visualization with SAS or Tableau.
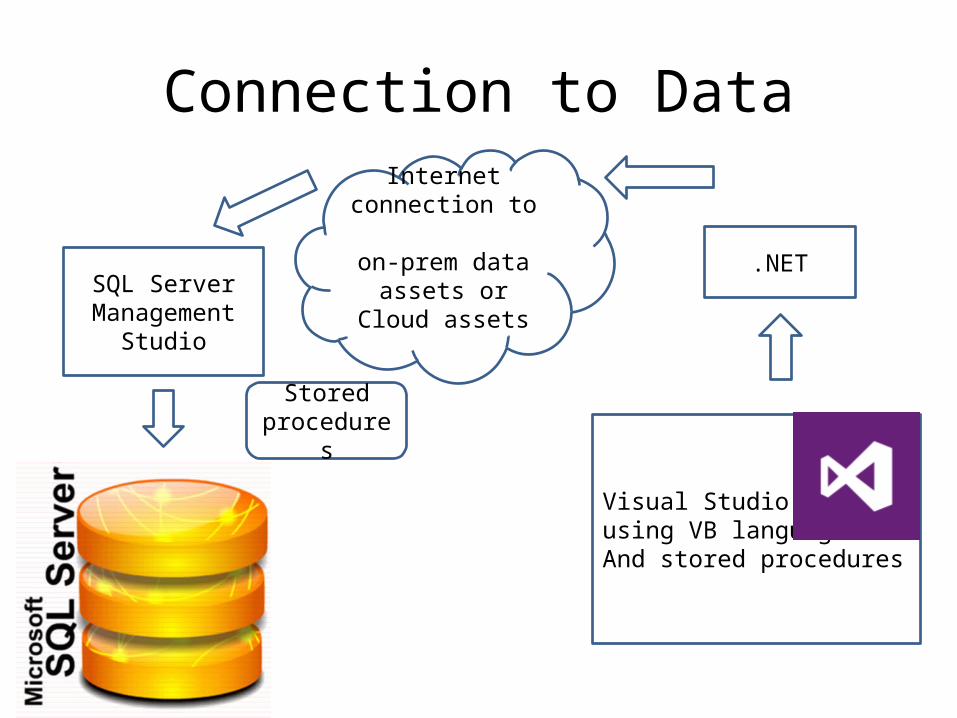
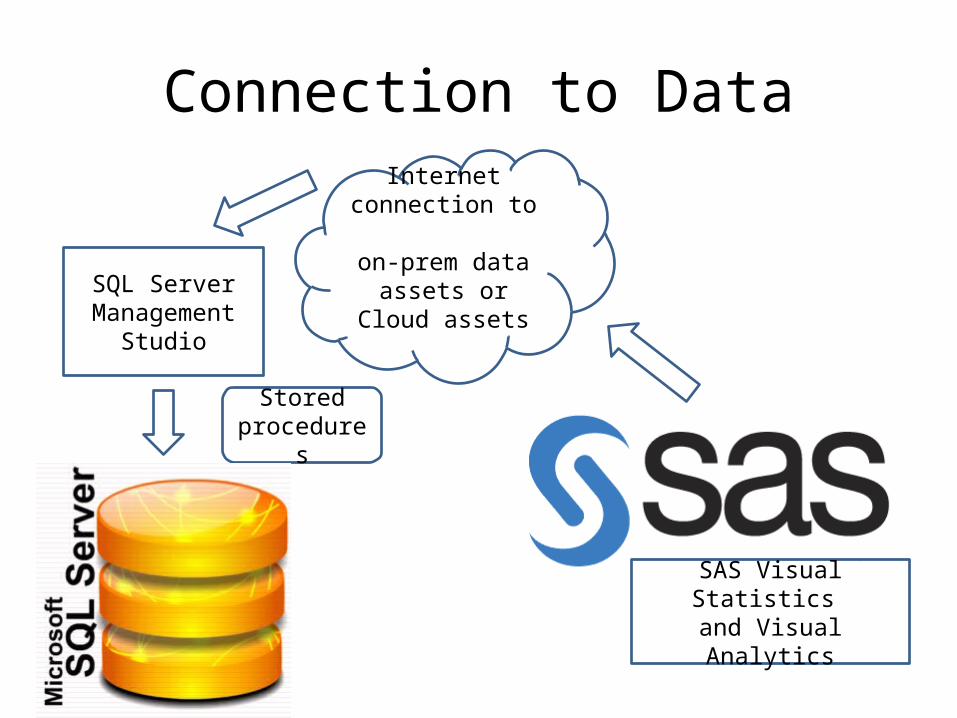
Connection to Data
SQL Server Management
Studio
Stored procedures
Internet connection to on-prem data
assets or Cloud assets
.NET
Visual Studiousing VB languageAnd stored procedures
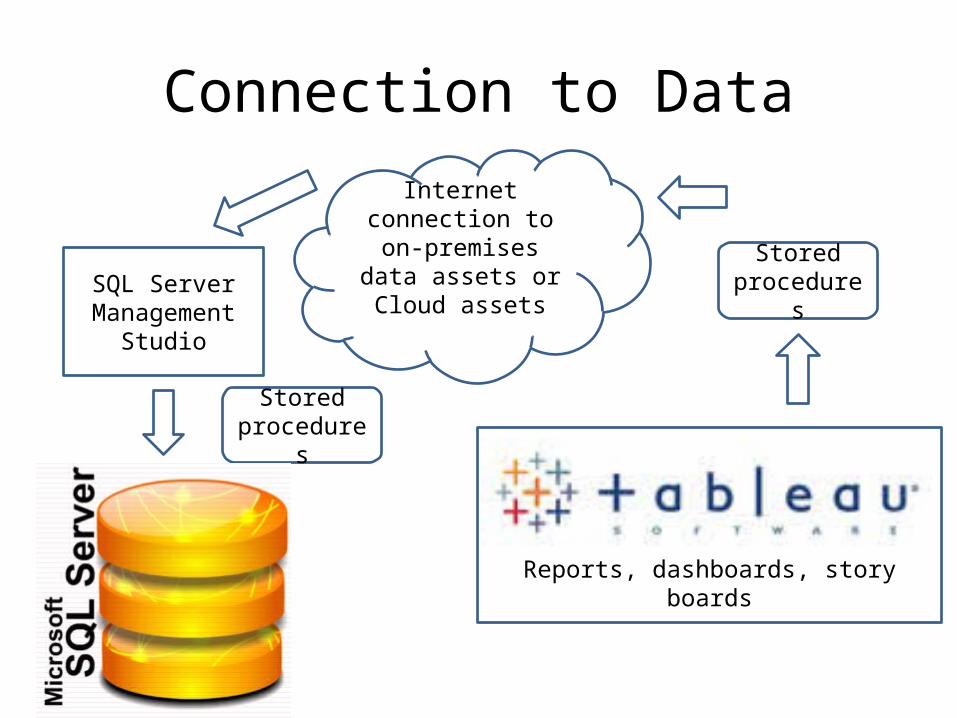
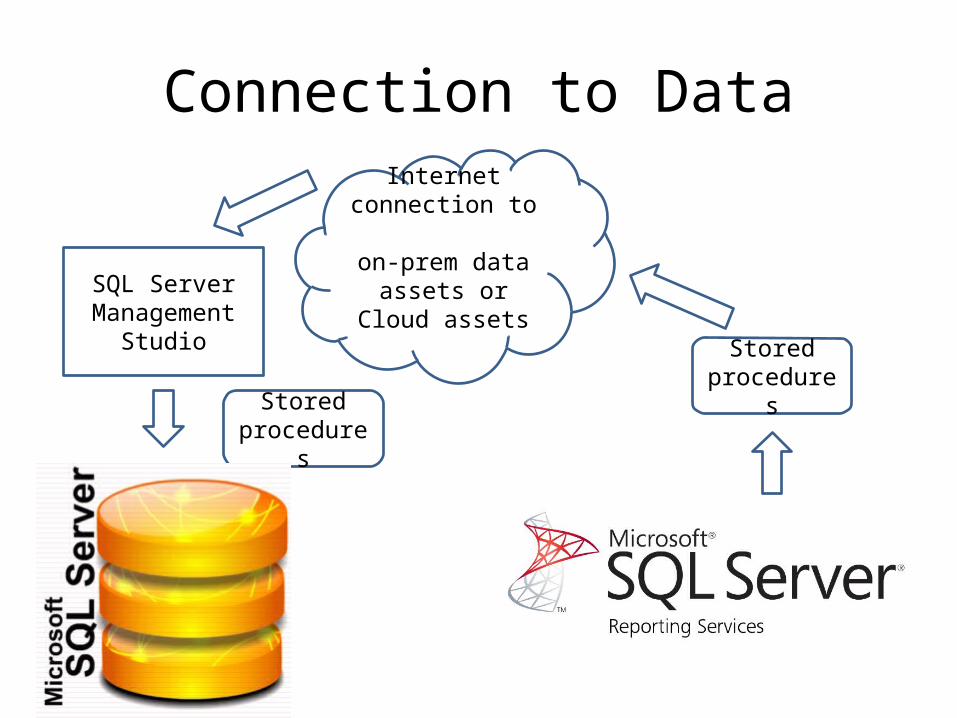
Connection to Data
SQL Server Management
Studio
Stored procedures
Internet connection to on-premises data
assets or Cloud assets
Reports, dashboards, story boards
Stored procedures
Connection to Data
SQL Server Management
Studio
Stored procedures
Internet connection to on-prem data
assets or Cloud assets
SAS Visual Statistics and Visual Analytics
Connection to Data
SQL Server Management
Studio
Stored procedures
Internet connection to on-prem data
assets or Cloud assets
Stored procedures
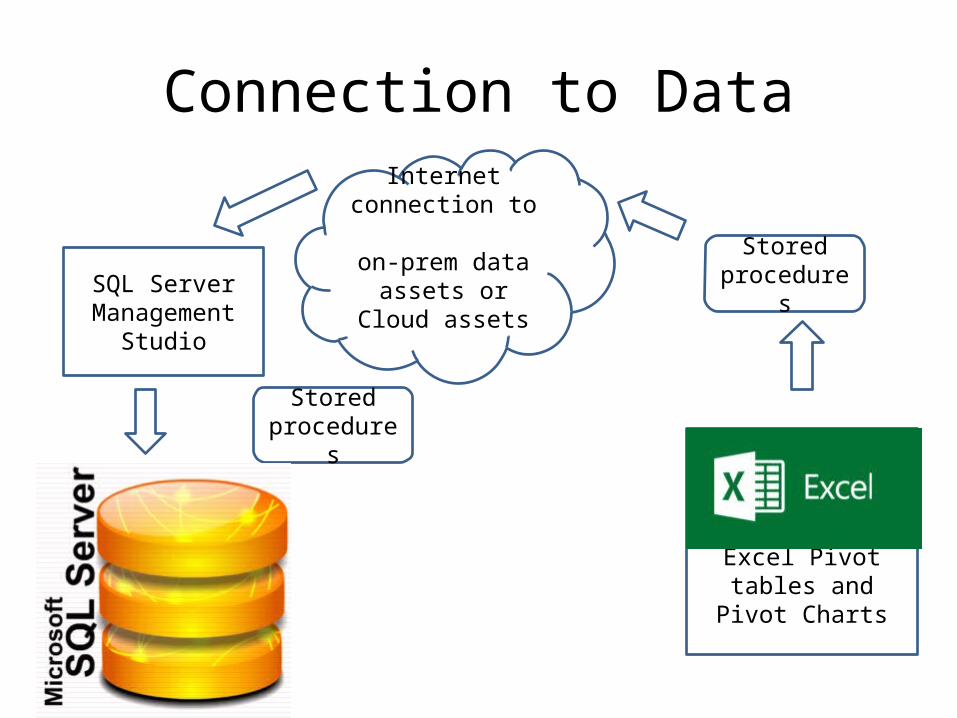
Connection to Data
SQL Server Management
Studio
Stored procedures
Internet connection to on-prem data
assets or Cloud assets
Excel Pivot tables and Pivot Charts
Stored procedures
Why so many IT approaches?• The more technologies you are familiar with
the more you understand the overall BI Architecture picture and can lead a project
• A mastery over technical tools fuels your ability to be a competent analyst
• The more tools you have under your belt, the more likely you will NOT get an entry-level BI or analyst position (rather rise in stature)
Will I receive hands-on exposure to relevant technologies which I can put on my resume?
blogs.lessthandot.com
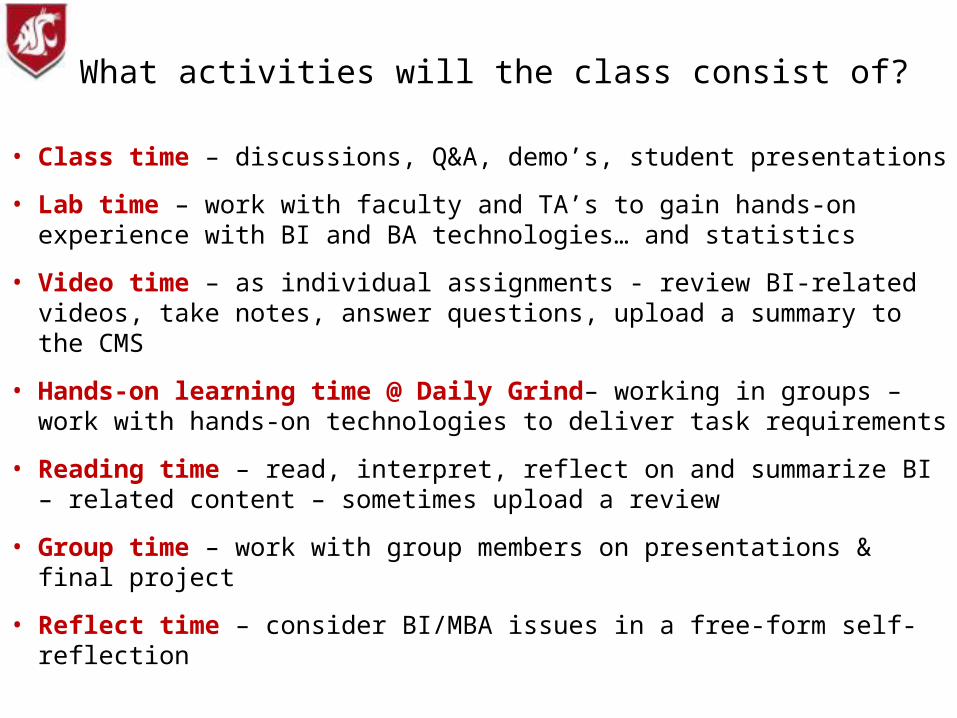
What activities will the class consist of?
• Class time – discussions, Q&A, demo’s, student presentations
• Lab time – work with faculty and TA’s to gain hands-on experience with BI and BA technologies… and statistics
• Video time – as individual assignments - review BI-related videos, take notes, answer questions, upload a summary to the CMS
• Hands-on learning time @ Daily Grind– working in groups – work with hands-on technologies to deliver task requirements
• Reading time – read, interpret, reflect on and summarize BI – related content – sometimes upload a review
• Group time – work with group members on presentations & final project
• Reflect time – consider BI/MBA issues in a free-form self-reflection
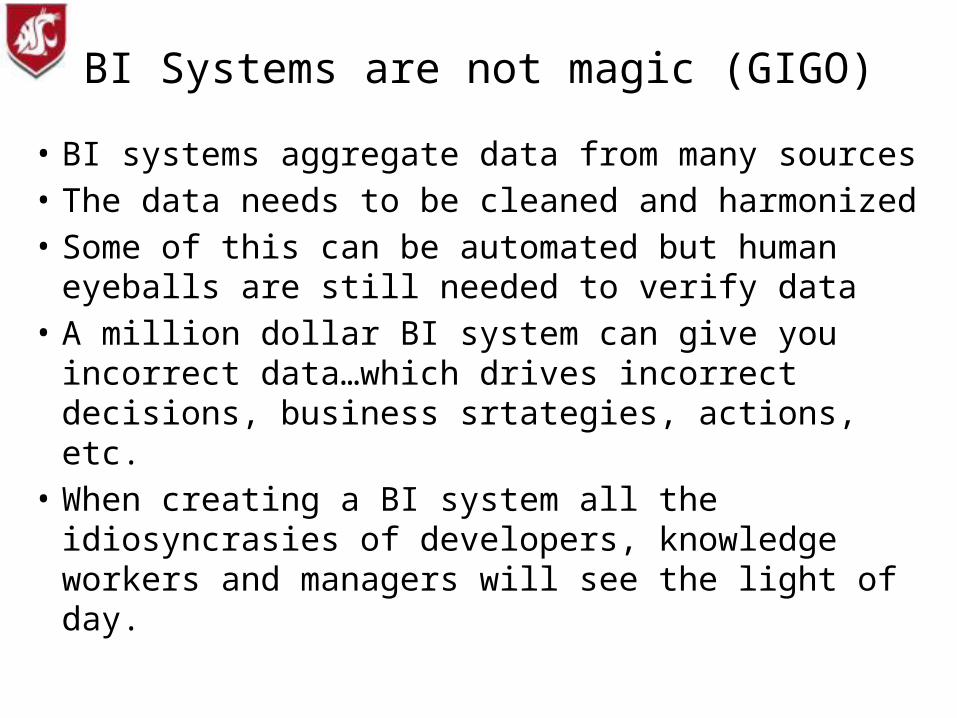
BI Systems are not magic (GIGO)
• BI systems aggregate data from many sources• The data needs to be cleaned and harmonized• Some of this can be automated but human
eyeballs are still needed to verify data• A million dollar BI system can give you incorrect
data…which drives incorrect decisions, business srtategies, actions, etc.
• When creating a BI system all the idiosyncrasies of developers, knowledge workers and managers will see the light of day.
www.ksi.ca
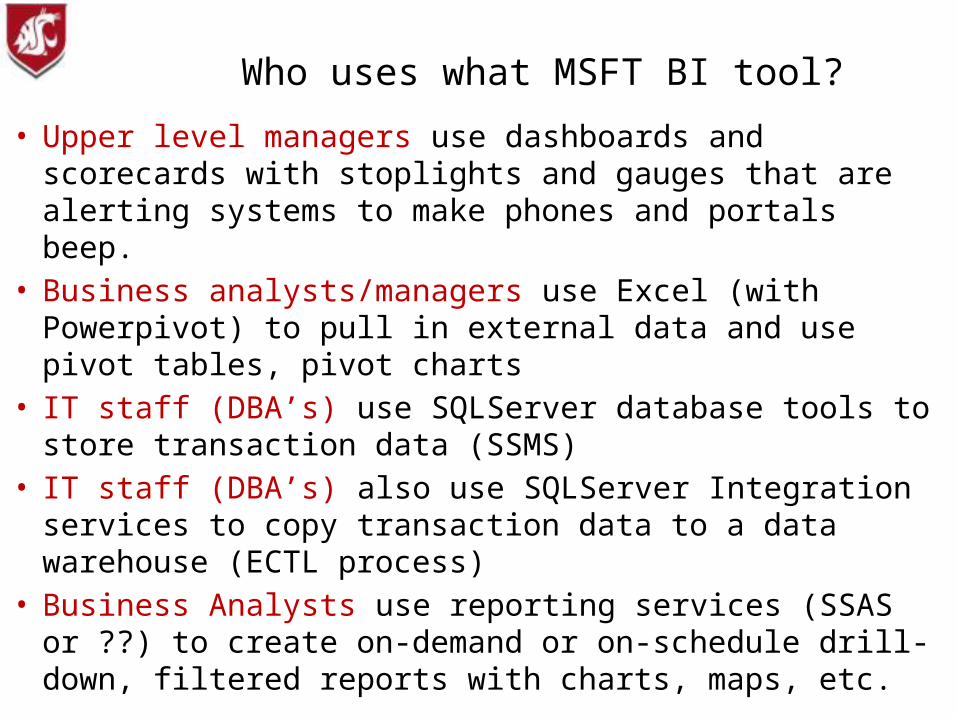
Who uses what MSFT BI tool?
• Upper level managers use dashboards and scorecards with stoplights and gauges that are alerting systems to make phones and portals beep.
• Business analysts/managers use Excel (with Powerpivot) to pull in external data and use pivot tables, pivot charts
• IT staff (DBA’s) use SQLServer database tools to store transaction data (SSMS)
• IT staff (DBA’s) also use SQLServer Integration services to copy transaction data to a data warehouse (ECTL process)
• Business Analysts use reporting services (SSAS or ??) to create on-demand or on-schedule drill-down, filtered reports with charts, maps, etc.
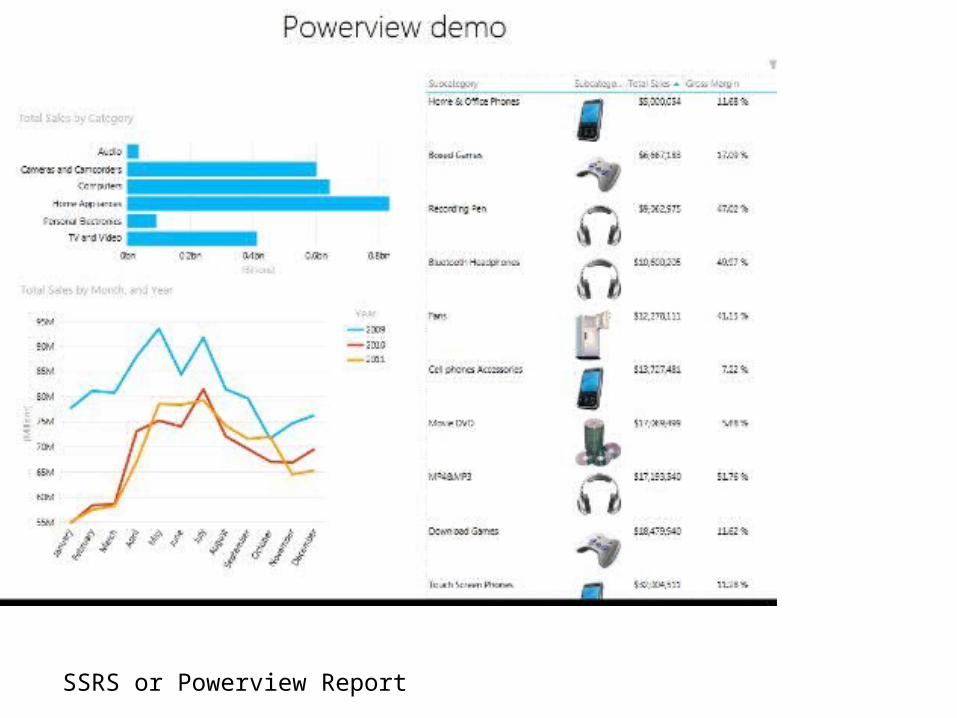
SSRS or Powerview Report
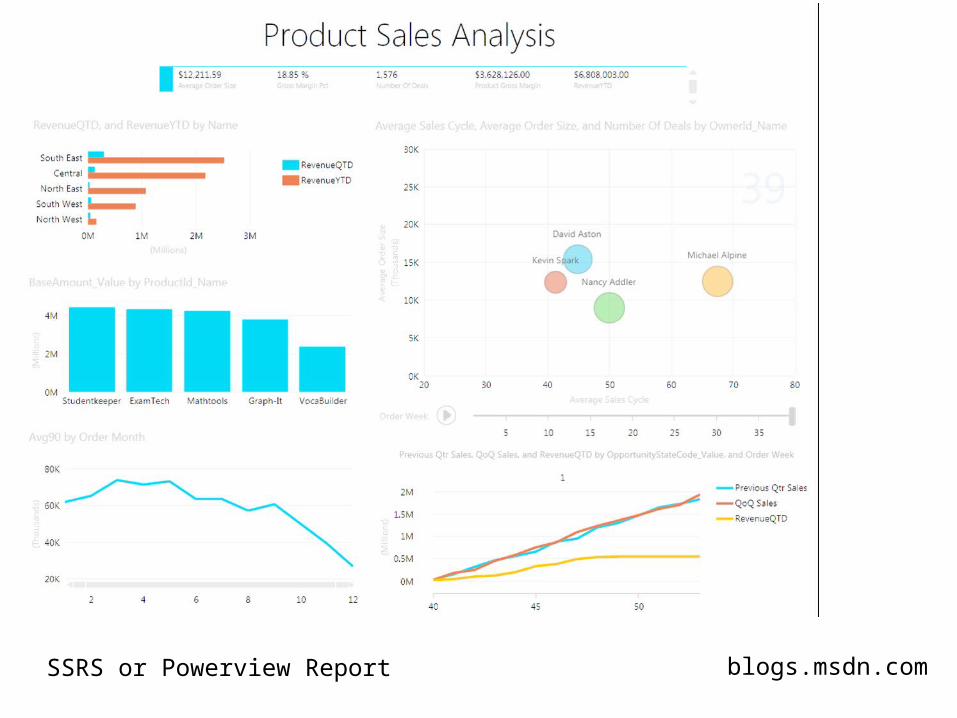
blogs.msdn.com SSRS or Powerview Report
blogs.technet.com
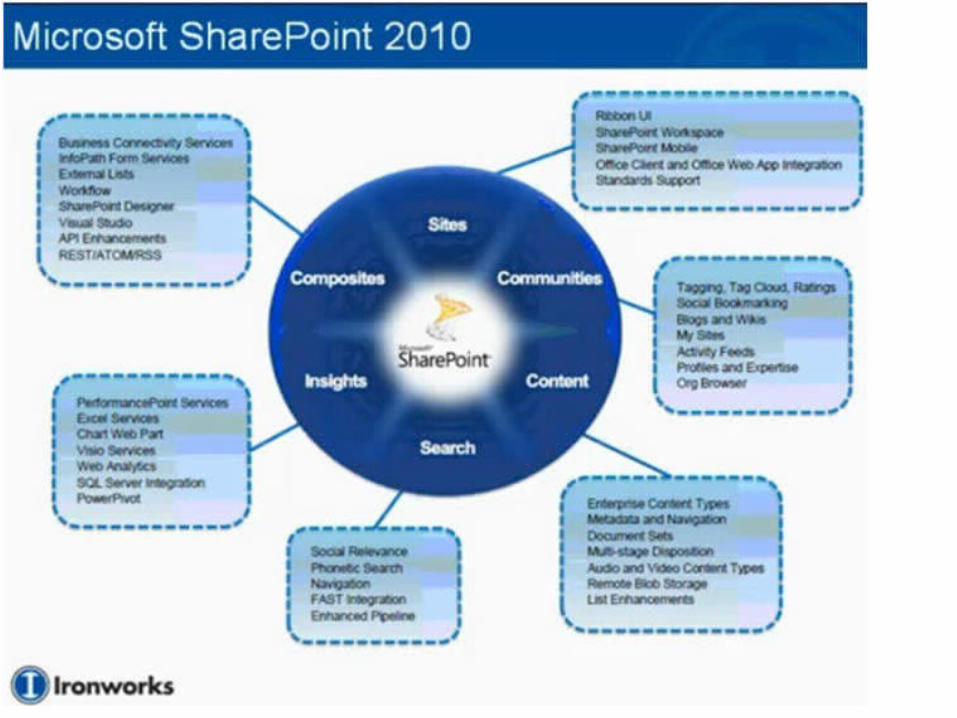
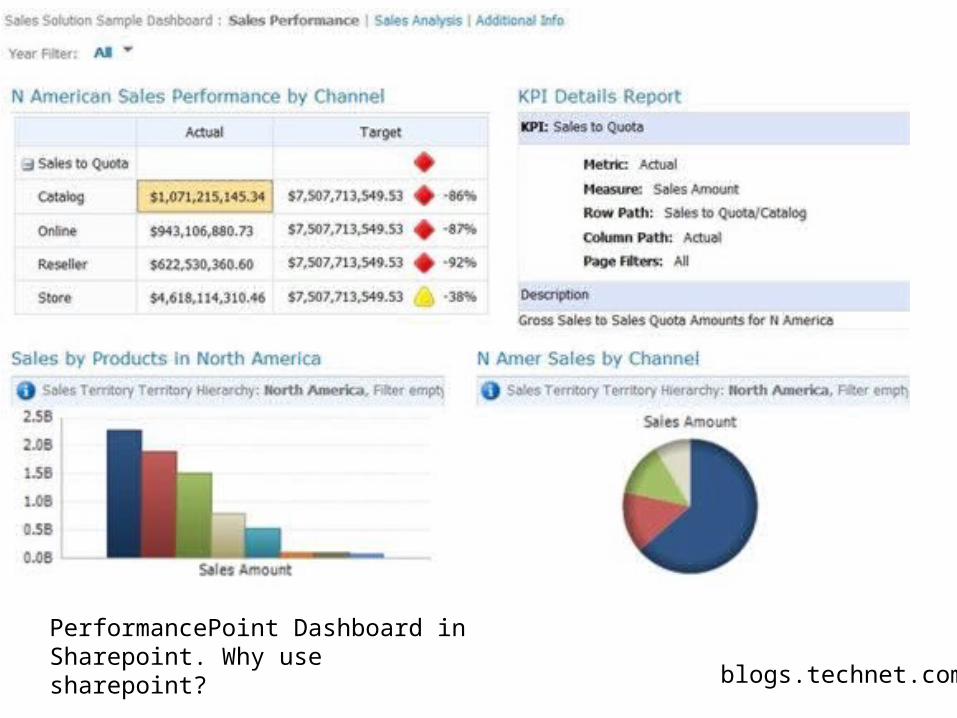
PerformancePoint Dashboard in Sharepoint. Why use sharepoint?
blogs.technet.com
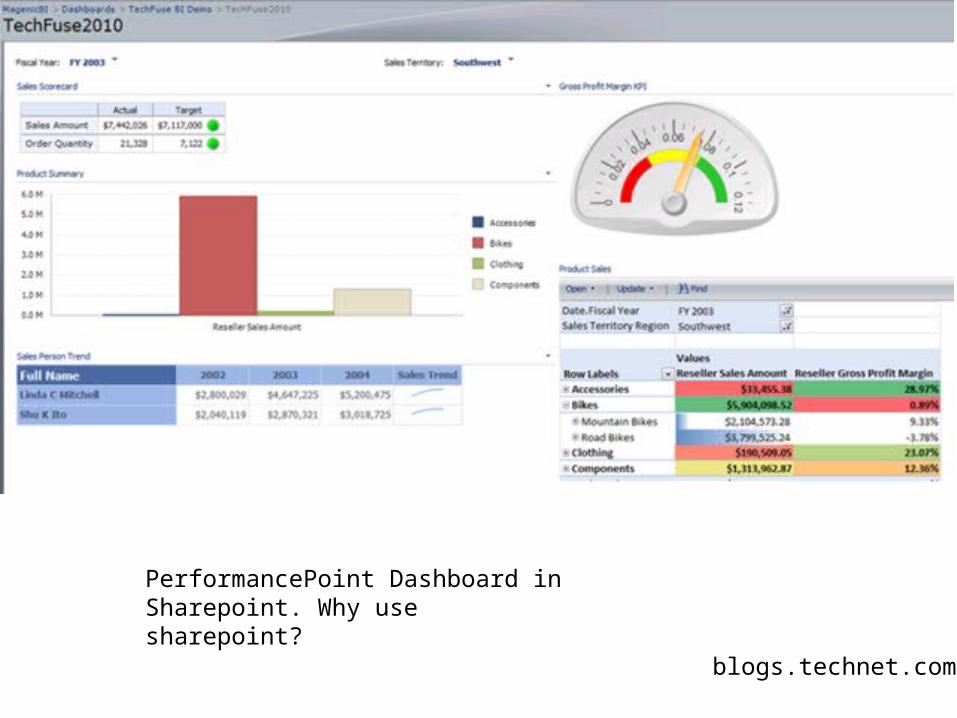
PerformancePoint Dashboard in Sharepoint. Why use sharepoint?
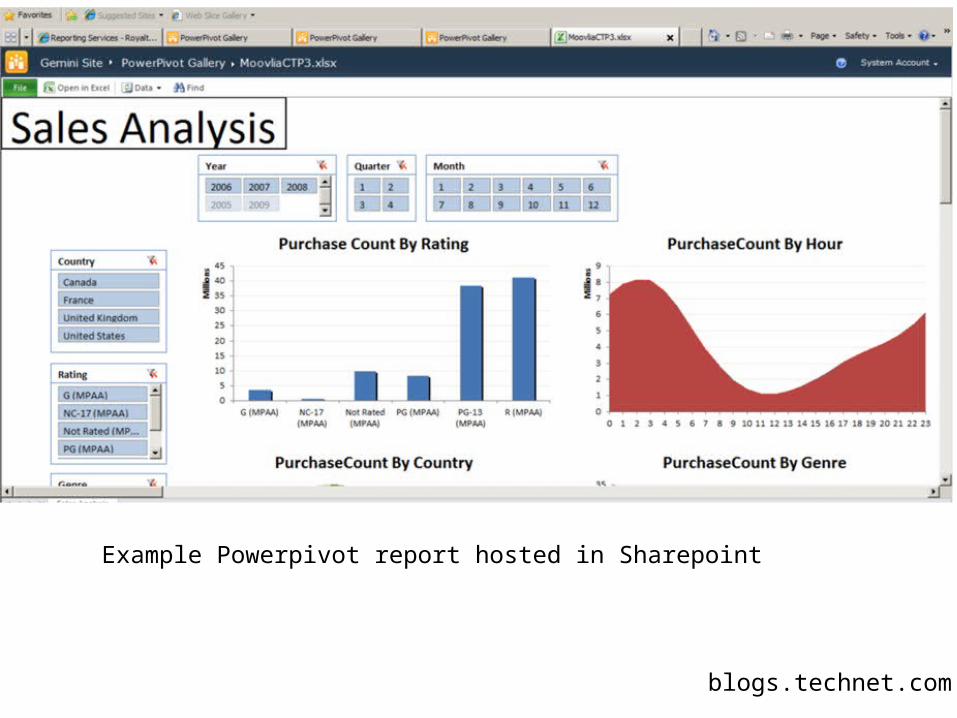
Example Powerpivot report hosted in Sharepoint
blogs.technet.com

You must merge with the machine
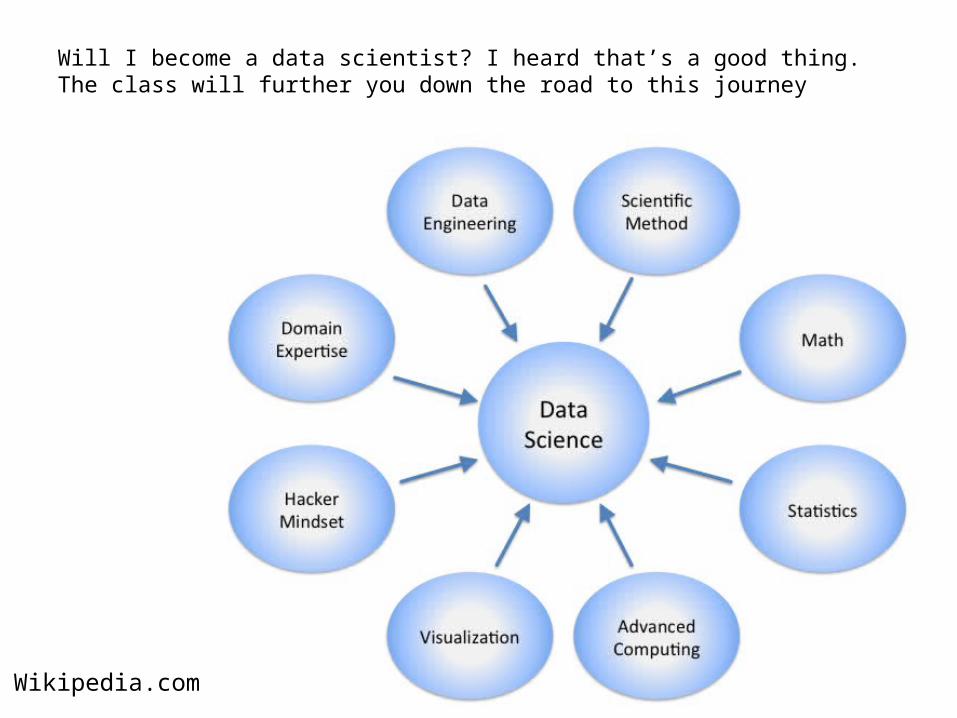
Will I become a data scientist? I heard that’s a good thing.The class will further you down the road to this journey
Wikipedia.com
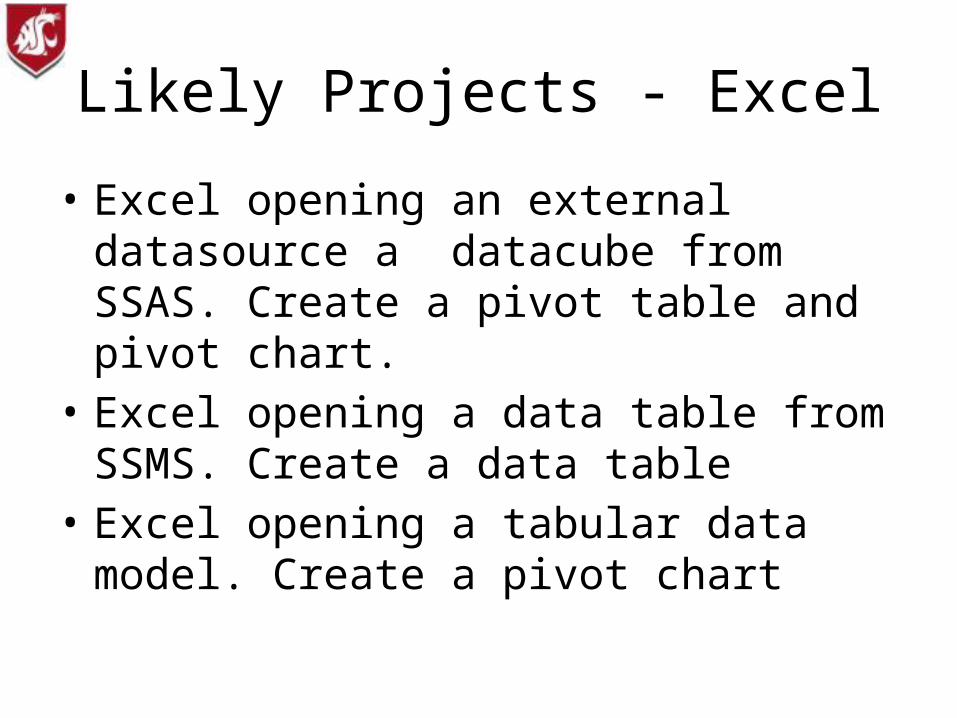
Likely Projects - Excel
• Excel opening an external datasource a datacube from SSAS. Create a pivot table and pivot chart.
• Excel opening a data table from SSMS. Create a data table
• Excel opening a tabular data model. Create a pivot chart
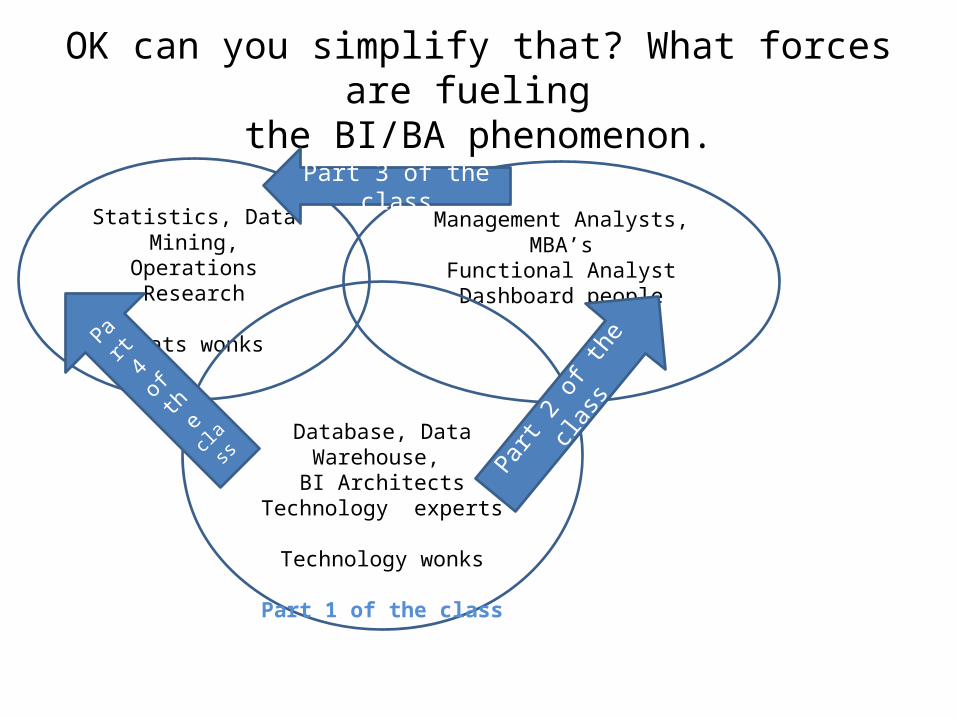
OK can you simplify that? What forces are fueling the BI/BA phenomenon.
Statistics, Data Mining, Operations Research
Stats wonks
Management Analysts, MBA’sFunctional AnalystDashboard people
Database, Data Warehouse, BI Architects
Technology experts
Technology wonks
Part 1 of the class
Part
2 of t
he cl
ass
Part
4 of
the
class
Part 3 of the class
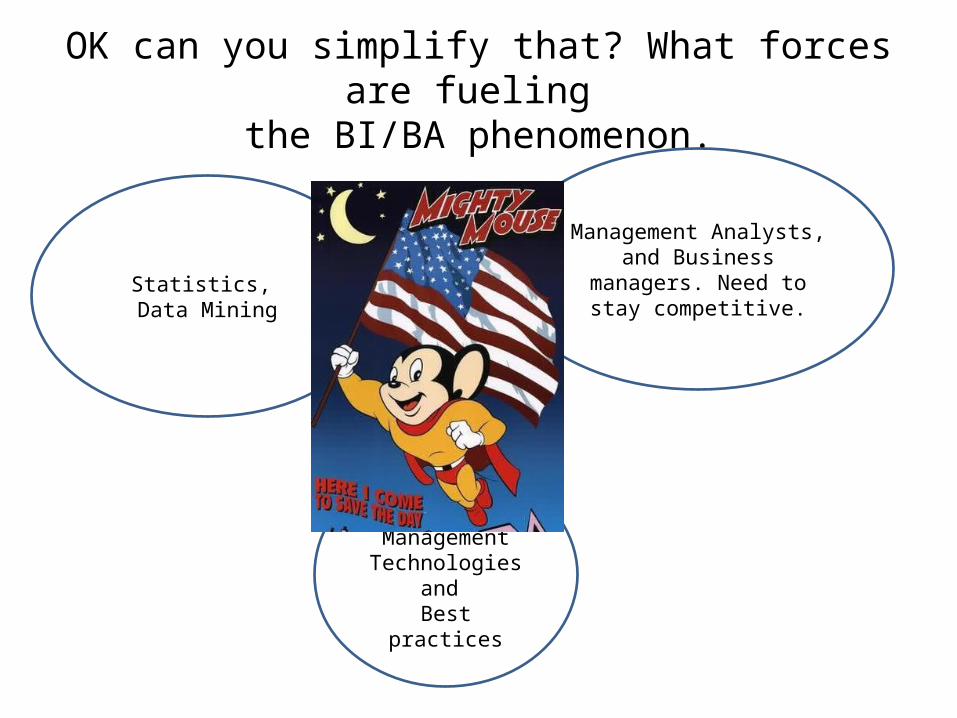
OK can you simplify that? What forces are fueling the BI/BA phenomenon.
Statistics, Data Mining
Management Analysts, and Business managers. Need to
stay competitive.
Data Management Technologies and
Best practices
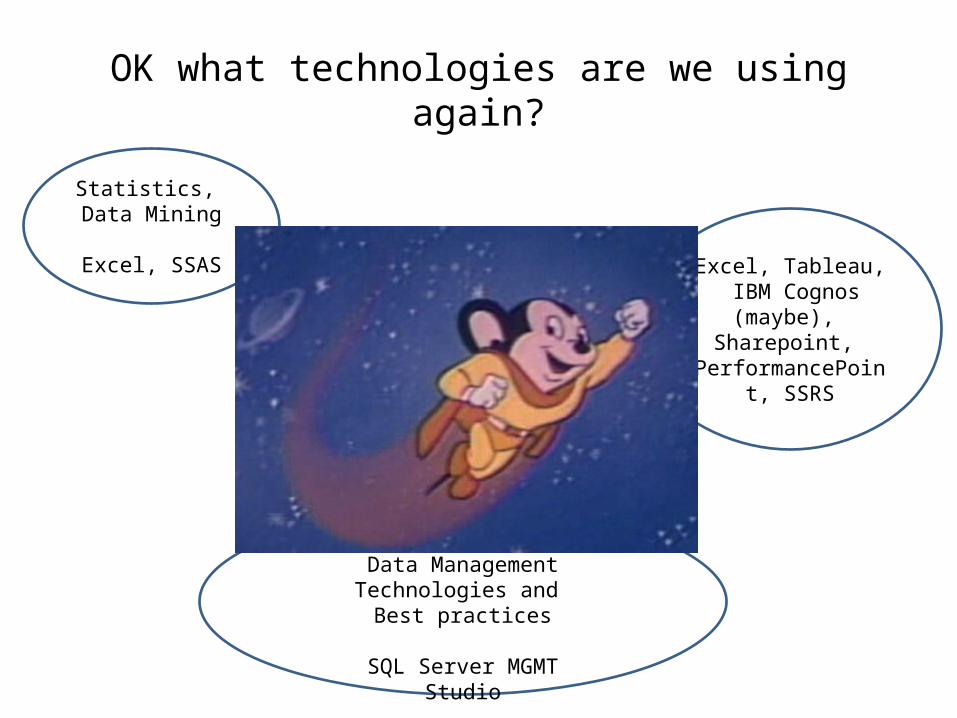
OK what technologies are we using again?
Statistics, Data Mining
Excel, SSASExcel, Tableau,
IBM Cognos (maybe), Sharepoint,
PerformancePoint, SSRS
Data Management Technologies and Best practices
SQL Server MGMTStudio
Likely Projects - Excel\Sharepoint• Excel opening an external datasource a
datacube from SSAS. Create a pivot table and pivot chart. Upload workbook to Sharepoint Excel services.
• Excel opening a data table from SSMS. Create a data table – upload workbook to Sharepoint
• Excel opening a tabular data model. Create a pivot chart. Add 2 slicers on 2 dimensions. Upload named pivot chart to excel
Likely Projects - PowerPivot
• Use powerpivot to connect to external datasource – related tables
• Use powerpivot to create tabular model• Add KPI’s to tabular model.
Likely Projects – Excel/PowerPivot
• Use powerpivot to connect to external datasource – dataviews
• Use powerpivot to create tabular model• You will have to create all the FK relationships• Add KPI’s to tabular model• Use tabular model in Performance point –
using KPI’s in scorecard