Embed Size (px)
Citation preview

Follow us on:
Aluminum Highlights
Week Ending: February 16, 2018An update on industry activity and economic indicators
Market View
There is rarely a dull moment in the aluminium market, and recently we have seen significant inflows of metal into LME warehouses, as metal has moved from off-warrant to on warrant. Exchange warehouse stocks saw the first daily inflow of over 100,000t since 2014 on 12 February, with 158,550t put on warrant into Port Klang. In total 166,225t of stocks were delivered as LME warrants. Over the past week, total Port Klang inflows stood at 201,900t. Inflows of exchange stocks indicate higher selling activity.
After the start of the inflows on 9 February, LME three-month prices fell from $2,170/t to just below $2,120/t. CRU believes that the rise in stock levels contributed to aluminium’s weaker price performance compared to other LME metals over the past week. However, despite stocks continuing to be brought onto the exchange, prices have since recovered and are rallying alongside the rest of the LME complex.
CRU understands that more aluminum stocks are expected to arrive on warrant in Port Klang over the next week. Most of the stock inflow are ingots, and this reduces the likelihood of delivery to the US.
The big inflow of stocks on the LME does not indicate any change in the underlying fundamentals of the market, as the stock movement is merely a shift in how the stock that was in the market is being stored. Indeed, we expect the world ex. China market to record a deficit of 450,000 tonnes in Q1, with consumption growing 3.2%, and primary production outside China growing moderately at 0.6%.
This report is based on information reported to the Association by participants, which is aggregated by the Association. While the Association believes that its statistical procedures and methods are reliable, it does not warrant the accuracy or completeness of the data. All data contained herein are subject to revision. For further information, contact Ryan Olsen, V.P. Business Information and Statistics at 1-703-358-2984 or email [email protected]. © The Aluminum Association, Inc. All rights reserved.
By: Paul Williams, Head of Aluminium – CRU AnalysisThe views expressed in the “Market View” are those of the author and do not necessarily represent the views of the Aluminum Association
The Aluminum Association
2Industry Activity
February 16, 2018
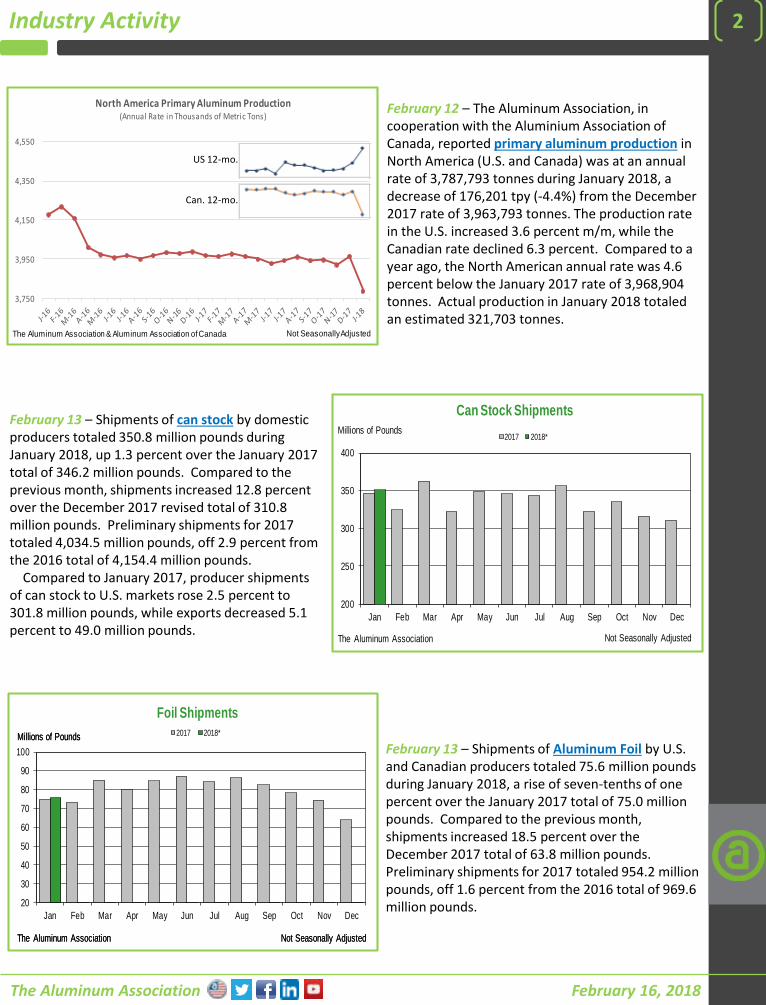
February 12 – The Aluminum Association, in cooperation with the Aluminium Association of Canada, reported primary aluminum production in North America (U.S. and Canada) was at an annual rate of 3,787,793 tonnes during January 2018, a decrease of 176,201 tpy (-4.4%) from the December 2017 rate of 3,963,793 tonnes. The production rate in the U.S. increased 3.6 percent m/m, while the Canadian rate declined 6.3 percent. Compared to a year ago, the North American annual rate was 4.6 percent below the January 2017 rate of 3,968,904 tonnes. Actual production in January 2018 totaled an estimated 321,703 tonnes.
February 13 – Shipments of can stock by domestic producers totaled 350.8 million pounds during January 2018, up 1.3 percent over the January 2017 total of 346.2 million pounds. Compared to the previous month, shipments increased 12.8 percent over the December 2017 revised total of 310.8 million pounds. Preliminary shipments for 2017 totaled 4,034.5 million pounds, off 2.9 percent from the 2016 total of 4,154.4 million pounds.
Compared to January 2017, producer shipments of can stock to U.S. markets rose 2.5 percent to 301.8 million pounds, while exports decreased 5.1 percent to 49.0 million pounds.
February 13 – Shipments of Aluminum Foil by U.S. and Canadian producers totaled 75.6 million pounds during January 2018, a rise of seven-tenths of one percent over the January 2017 total of 75.0 million pounds. Compared to the previous month, shipments increased 18.5 percent over the December 2017 total of 63.8 million pounds. Preliminary shipments for 2017 totaled 954.2 million pounds, off 1.6 percent from the 2016 total of 969.6 million pounds.
3,750
3,950
4,150
4,350
4,550
North America Primary Aluminum Production(Annual Rate in Thousands of Metric Tons)
The Aluminum Association & Aluminum Association of Canada Not Seasonally Adjusted
US 12-mo.
Can. 12-mo.
200
250
300
350
400
Jan Feb Mar Apr May Jun Jul Aug Sep Oct Nov Dec
Can Stock Shipments
2017 2018*
The Aluminum Association Not Seasonally Adjusted
Millions of Pounds
20
30
40
50
60
70
80
90
100
Jan Feb Mar Apr May Jun Jul Aug Sep Oct Nov Dec
Foil Shipments
2017 2018*
The Aluminum Association Not Seasonally Adjusted
Millions of Pounds
The Aluminum Association Not Seasonally Adjusted
Millions of Pounds

The Aluminum Association
3Industry Activity Continued…
February 16, 2018
February 13 – Estimated net shipments of Aluminum Sheet and Plate by U.S. and Canadian producers totaled 710.9 million pounds during January 2018, up 1.3 percent over the January 2017 total of 701.8 million pounds. Compared to the previous month, shipments increased 12.3 percent over the December 2017 revised total of 632.8 million pounds. Preliminary shipments for 2017 totaled 8,506.8 million pounds, up 1.4 percent over the 2016 total of 8,390.0 million pounds.
Shipments of Can Stock totaled 350.8 million pounds during January 2018, a rise of 1.3 percent over the January 2017 total of 346.2 million pounds, while shipments of Non-heat Treatable Sheet(excluding Can Stock) were up 1.2 percent to 222.0 million pounds and shipments of All Other Sheet and Plate rose 1.4 percent to 138.2 million pounds.
February 15 – New can stock (class) scrap receiptstotaled 54.3 million pounds during January 2018, off 1.5 percent from the January 2017 total of 55.1 million pounds. Compared to the previous month, receipts increased 11.0 percent over the December 2017 total of 48.9 million pounds. Preliminary receipts for 2017 totaled 667.1 million pounds, down 2.6 percent from the 2016 total of 685.1 million pounds.
February 15 – Shipments of Aluminum Powder and Paste to domestic markets by domestic producers, including imports by domestic producers, totaled 6.28 million pounds during January 2018, a rise of three-tenths of one percent over the January 2017 total of 6.27 million pounds. Compared to the previous month, shipments decreased 5.7 percent from the December 2017 total of 6.66 million pounds. Preliminary shipments for 2017 totaled 78.01 million pounds, up 3.8 percent over the 2016 total of 75.15 million pounds.
Compared to January 2017, shipments of powderto domestic markets rose three-tenths of one percent to 5.22 million pounds, while shipments of paste were up one-tenth of one percent to 1.06 million pounds.
400
450
500
550
600
650
700
750
800
Jan Feb Mar Apr May Jun Jul Aug Sep Oct Nov Dec
Sheet and Plate Shipments
2017 2018*
The Aluminum Association Not Seasonally Adjusted
Millions of Pounds
30
40
50
60
70
Jan Feb Mar Apr May Jun Jul Aug Sep Oct Nov Dec
New Can Stock Scrap Receipts
2017 2018*
The Aluminum Association Not Seasonally Adjusted
Millions of Pounds
0
3
6
9
Jan Feb Mar Apr May Jun Jul Aug Sep Oct Nov Dec
Domestic Shipments of Powder and Paste
2017 2018*
The Aluminum Association, Inc. Not Seasonally Adjusted
Millions of Pounds
The Aluminum Association, Inc. Not Seasonally Adjusted
Millions of Pounds
The Aluminum Association
4Economic Activity
February 16, 2018
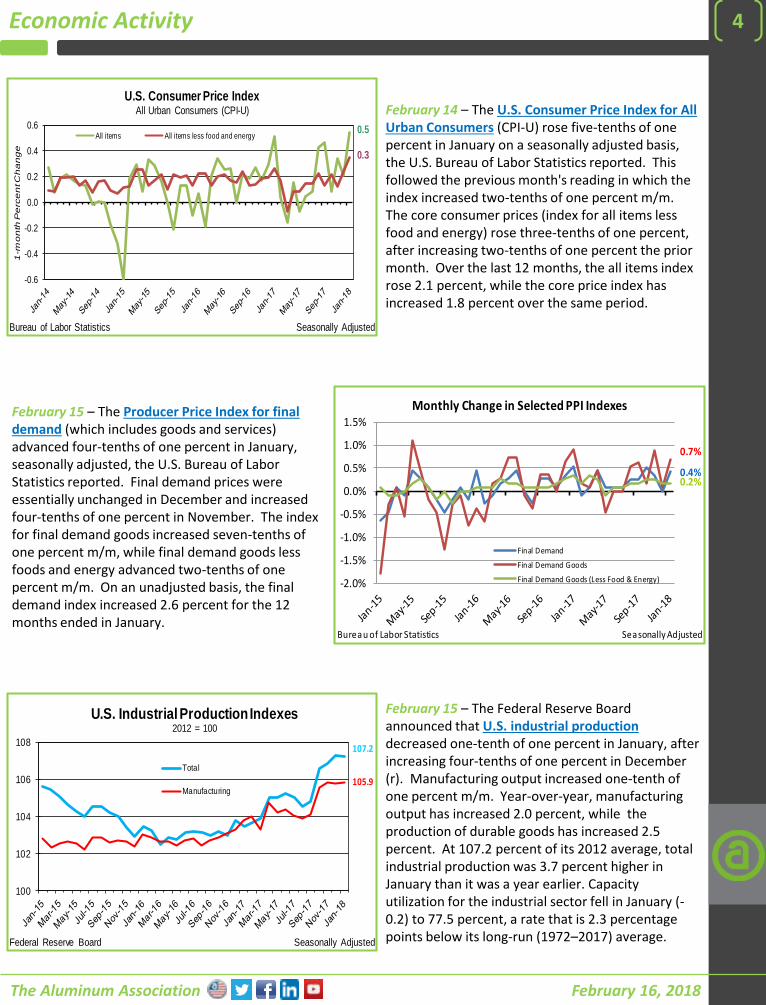
February 14 – The U.S. Consumer Price Index for All Urban Consumers (CPI-U) rose five-tenths of one percent in January on a seasonally adjusted basis, the U.S. Bureau of Labor Statistics reported. This followed the previous month's reading in which the index increased two-tenths of one percent m/m. The core consumer prices (index for all items less food and energy) rose three-tenths of one percent, after increasing two-tenths of one percent the prior month. Over the last 12 months, the all items index rose 2.1 percent, while the core price index has increased 1.8 percent over the same period.
0.5
0.3
-0.6
-0.4
-0.2
0.0
0.2
0.4
0.6
1-m
on
th P
erc
en
t C
ha
ng
e
U.S. Consumer Price IndexAll Urban Consumers (CPI-U)
All items All items less food and energy
Bureau of Labor Statistics Seasonally Adjusted
February 15 – The Producer Price Index for final demand (which includes goods and services) advanced four-tenths of one percent in January, seasonally adjusted, the U.S. Bureau of Labor Statistics reported. Final demand prices were essentially unchanged in December and increased four-tenths of one percent in November. The index for final demand goods increased seven-tenths of one percent m/m, while final demand goods less foods and energy advanced two-tenths of one percent m/m. On an unadjusted basis, the final demand index increased 2.6 percent for the 12 months ended in January.
0.4%
0.7%
0.2%
-2.0%
-1.5%
-1.0%
-0.5%
0.0%
0.5%
1.0%
1.5%
Monthly Change in Selected PPI Indexes
Final Demand
Final Demand Goods
Final Demand Goods (Less Food & Energy)
Bureau of Labor Statistics Seasonally Adjusted
February 15 – The Federal Reserve Board announced that U.S. industrial productiondecreased one-tenth of one percent in January, after increasing four-tenths of one percent in December (r). Manufacturing output increased one-tenth of one percent m/m. Year-over-year, manufacturing output has increased 2.0 percent, while the production of durable goods has increased 2.5 percent. At 107.2 percent of its 2012 average, total industrial production was 3.7 percent higher in January than it was a year earlier. Capacity utilization for the industrial sector fell in January (-0.2) to 77.5 percent, a rate that is 2.3 percentage points below its long-run (1972–2017) average.
107.2
105.9
100
102
104
106
108
U.S. Industrial Production Indexes2012 = 100
Total
Manufacturing
Federal Reserve Board Seasonally Adjusted
The Aluminum Association
5Economic Activity Continued…
February 16, 2018
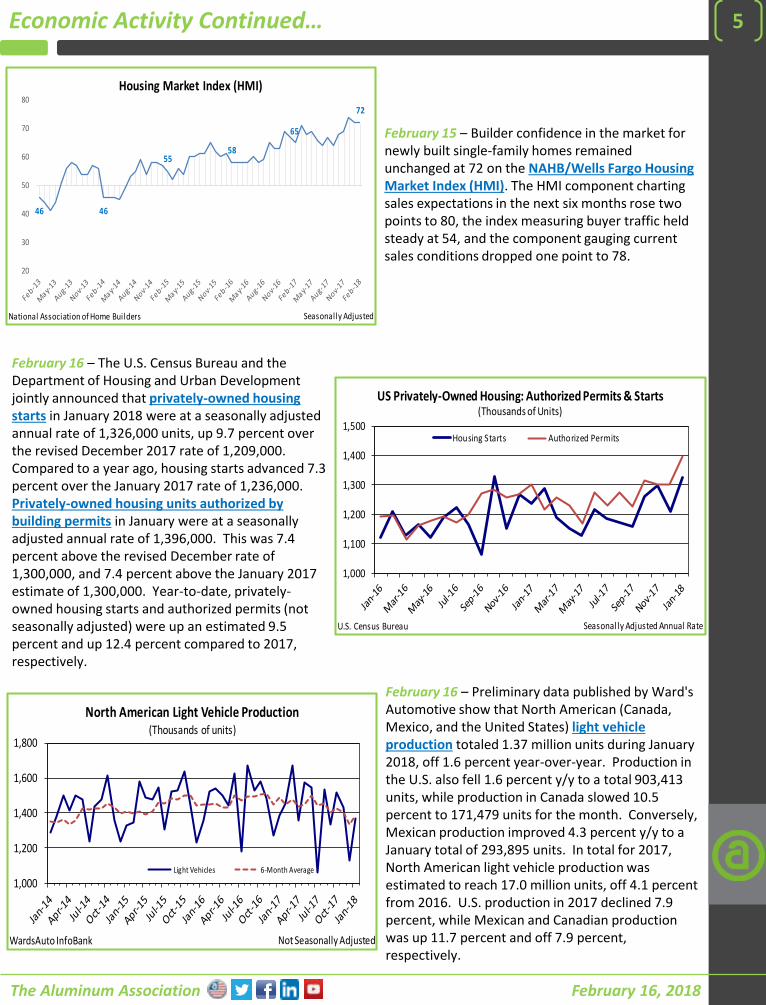
February 16 – The U.S. Census Bureau and the Department of Housing and Urban Development jointly announced that privately-owned housing starts in January 2018 were at a seasonally adjusted annual rate of 1,326,000 units, up 9.7 percent over the revised December 2017 rate of 1,209,000. Compared to a year ago, housing starts advanced 7.3 percent over the January 2017 rate of 1,236,000. Privately-owned housing units authorized by building permits in January were at a seasonally adjusted annual rate of 1,396,000. This was 7.4 percent above the revised December rate of 1,300,000, and 7.4 percent above the January 2017 estimate of 1,300,000. Year-to-date, privately-owned housing starts and authorized permits (not seasonally adjusted) were up an estimated 9.5 percent and up 12.4 percent compared to 2017, respectively.
1,000
1,100
1,200
1,300
1,400
1,500
US Privately-Owned Housing: Authorized Permits & Starts(Thousands of Units)
Housing Starts Authorized Permits
U.S. Census Bureau Seasonally Adjusted Annual Rate
February 15 – Builder confidence in the market for newly built single-family homes remained unchanged at 72 on the NAHB/Wells Fargo Housing Market Index (HMI). The HMI component charting sales expectations in the next six months rose two points to 80, the index measuring buyer traffic held steady at 54, and the component gauging current sales conditions dropped one point to 78.
46 46
5558
65
72
20
30
40
50
60
70
80
Housing Market Index (HMI)
National Association of Home Builders Seasonally Adjusted
February 16 – Preliminary data published by Ward's Automotive show that North American (Canada, Mexico, and the United States) light vehicle production totaled 1.37 million units during January 2018, off 1.6 percent year-over-year. Production in the U.S. also fell 1.6 percent y/y to a total 903,413 units, while production in Canada slowed 10.5 percent to 171,479 units for the month. Conversely, Mexican production improved 4.3 percent y/y to a January total of 293,895 units. In total for 2017, North American light vehicle production was estimated to reach 17.0 million units, off 4.1 percent from 2016. U.S. production in 2017 declined 7.9 percent, while Mexican and Canadian production was up 11.7 percent and off 7.9 percent, respectively.
1,000
1,200
1,400
1,600
1,800
North American Light Vehicle Production(Thousands of units)
Light Vehicles 6-Month Average
WardsAuto InfoBank Not Seasonally Adjusted
The Aluminum Association
6Energy
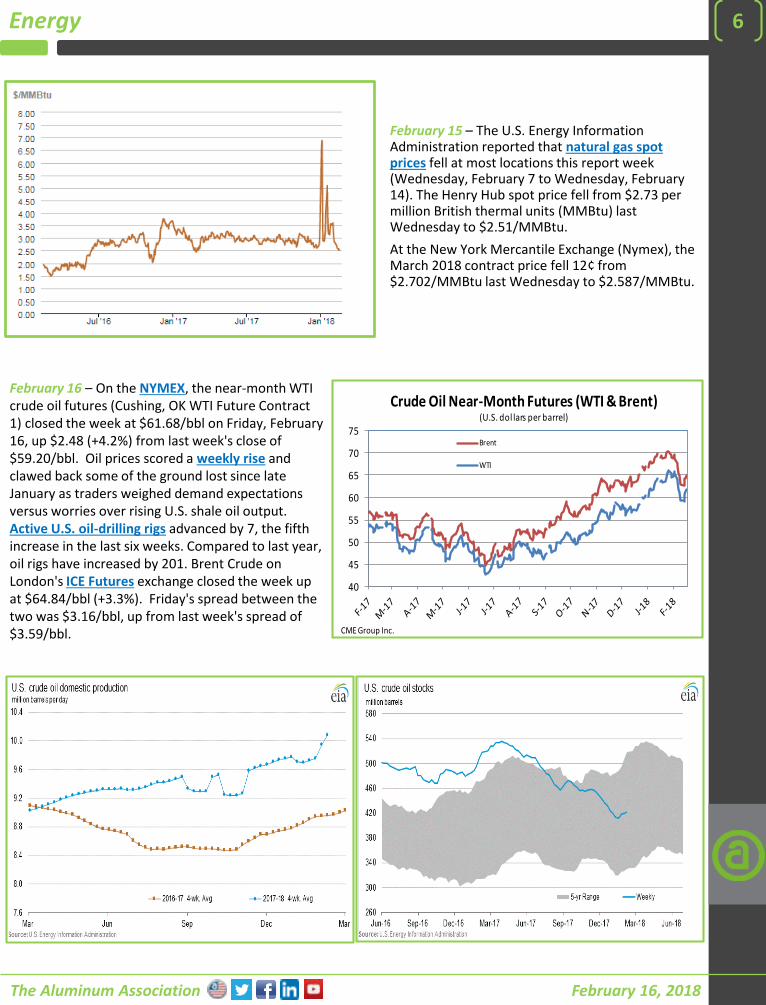
February 15 – The U.S. Energy Information Administration reported that natural gas spot prices fell at most locations this report week (Wednesday, February 7 to Wednesday, February 14). The Henry Hub spot price fell from $2.73 per million British thermal units (MMBtu) last Wednesday to $2.51/MMBtu.
At the New York Mercantile Exchange (Nymex), the March 2018 contract price fell 12¢ from $2.702/MMBtu last Wednesday to $2.587/MMBtu.
February 16, 2018
40
45
50
55
60
65
70
75
Crude Oil Near-Month Futures (WTI & Brent)(U.S. dol lars per barrel)
Brent
WTI
CME Group Inc.
February 16 – On the NYMEX, the near-month WTI crude oil futures (Cushing, OK WTI Future Contract 1) closed the week at $61.68/bbl on Friday, February 16, up $2.48 (+4.2%) from last week's close of $59.20/bbl. Oil prices scored a weekly rise and clawed back some of the ground lost since late January as traders weighed demand expectations versus worries over rising U.S. shale oil output. Active U.S. oil-drilling rigs advanced by 7, the fifth increase in the last six weeks. Compared to last year, oil rigs have increased by 201. Brent Crude on London's ICE Futures exchange closed the week up at $64.84/bbl (+3.3%). Friday's spread between the two was $3.16/bbl, up from last week's spread of $3.59/bbl.
The Aluminum Association
7U.S. Dollar
February 16, 2018
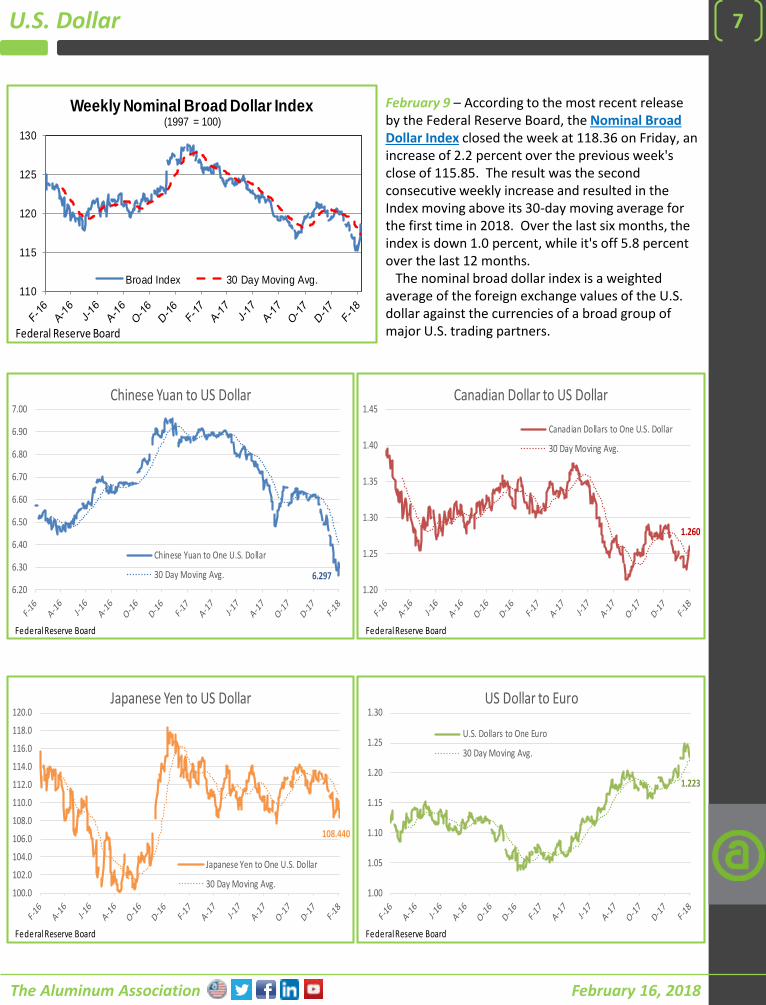
February 9 – According to the most recent release by the Federal Reserve Board, the Nominal Broad Dollar Index closed the week at 118.36 on Friday, an increase of 2.2 percent over the previous week's close of 115.85. The result was the second consecutive weekly increase and resulted in the Index moving above its 30-day moving average for the first time in 2018. Over the last six months, the index is down 1.0 percent, while it's off 5.8 percent over the last 12 months.
The nominal broad dollar index is a weighted average of the foreign exchange values of the U.S. dollar against the currencies of a broad group of major U.S. trading partners.
6.297
6.20
6.30
6.40
6.50
6.60
6.70
6.80
6.90
7.00Chinese Yuan to US Dollar
Chinese Yuan to One U.S. Dollar
30 Day Moving Avg.
Federal Reserve Board
1.260
1.20
1.25
1.30
1.35
1.40
1.45Canadian Dollar to US Dollar
Canadian Dollars to One U.S. Dollar
30 Day Moving Avg.
Federal Reserve Board
108.440
100.0
102.0
104.0
106.0
108.0
110.0
112.0
114.0
116.0
118.0
120.0Japanese Yen to US Dollar
Japanese Yen to One U.S. Dollar
30 Day Moving Avg.
Federal Reserve Board
1.223
1.00
1.05
1.10
1.15
1.20
1.25
1.30US Dollar to Euro
U.S. Dollars to One Euro
30 Day Moving Avg.
Federal Reserve Board
110
115
120
125
130
Weekly Nominal Broad Dollar Index(1997 = 100)
Broad Index 30 Day Moving Avg.
Federal Reserve Board

The Aluminum Association
8The Aluminum Association, founded in 1933, works globally to aggressively promote aluminum as the most sustainable and recyclable automotive, packaging and construction material in today’s market. The Association represents North America and foreign-based primary producers of aluminum, aluminum recyclers, producers of semi-fabricated products and foundries as well as suppliers to the industry or distributors or jobbers.
The Aluminum Association's statistical programs provide industry information on primary aluminum production, new orders of mill products, industry shipments, end use market estimates, inventories, recycling and foreign trade on a monthly, quarterly and annual basis. Special surveys provide data on specific subjects such as primary capacity, flat roll capacity, inventories and castings shipments. Custom reports are available on a for-fee basis. Web briefings are also available upon request.
Industry OverviewAluminum Statistical Review (Annual Fact Book)Aluminum Highlights (Weekly)Aluminum Situation (Monthly)Summary of Producer Shipments and Inventories (Monthly)
Primary AluminumPrimary Aluminum Production – U.S. and Canada (Monthly)Primary Installed Capacity (Annual)Shipments of Primary Aluminum by Form (Quarterly)
Mill ProductsIndex of Net New Order Receipts for Aluminum Mill Products (Monthly)Can Stock Shipments (Monthly)Electrical Conductor Shipments (Monthly)Extruded Products Shipments and Press Utilization (Monthly)Flat Roll Capacity (Annual)Foil Shipments (Monthly)Forging and Impacts Shipments (Monthly)Rod, Bar, and Wire Shipments (Monthly)Sheet and Plate Shipments (Monthly)
End UseExtrusion Shipments by End Use (Quarterly)Fin Stock Shipments by End Use (Quarterly)Foil Shipments by End Use (Monthly)Sheet and Plate Shipments by End Use (Quarterly)
CastingsU.S. Foundry Castings Shipments (Quarterly)Canada Foundry Castings Shipments (Annual)
RecyclingNew Can Stock (Class) Scrap Receipts (Monthly)Used Beverage Can Reclamation (Annual)
Foreign Trade (based on government customs data)Summary of U.S., Canada and Mexico Imports and Exports (by Commodity), MonthlyForeign Trade Online Database - U.S., Canada and Mexico Exports & Imports of Aluminum (By Commodity, by Country)
For a complete list of statistical publications and reports visit our bookstore.
February 16, 2018