Embed Size (px)
Citation preview
Click here for download
2019MARCH
MARKETUPDATE AND
FUND REVIEW
ASSETMANAGEMENT
PRIVATEWEALTH MANAGEMENT
MY WEALTHMANAGEMENT
MARKET BRIEF BY NDB WEALTH
Indika De SilvaFund Manager
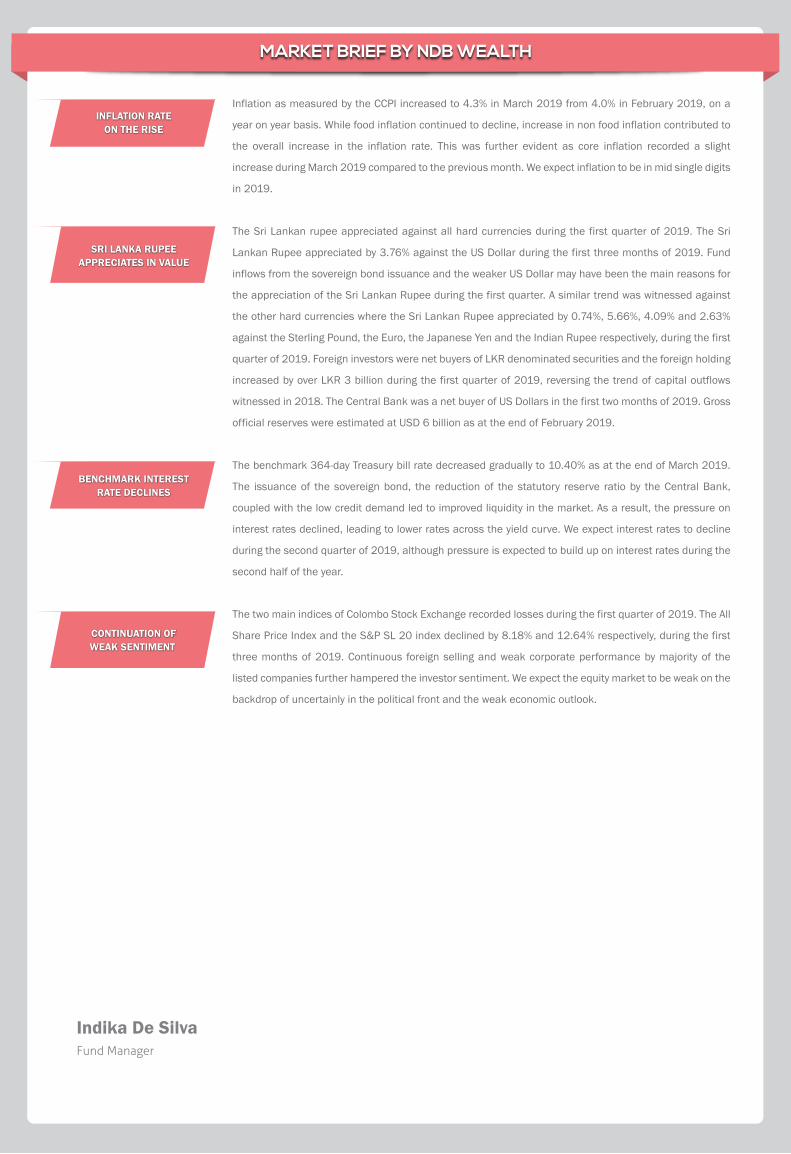
Inflation as measured by the CCPI increased to 4.3% in March 2019 from 4.0% in February 2019, on a
year on year basis. While food inflation continued to decline, increase in non food inflation contributed to
the overall increase in the inflation rate. This was further evident as core inflation recorded a slight
increase during March 2019 compared to the previous month. We expect inflation to be in mid single digits
in 2019.
The Sri Lankan rupee appreciated against all hard currencies during the first quarter of 2019. The Sri
Lankan Rupee appreciated by 3.76% against the US Dollar during the first three months of 2019. Fund
inflows from the sovereign bond issuance and the weaker US Dollar may have been the main reasons for
the appreciation of the Sri Lankan Rupee during the first quarter. A similar trend was witnessed against
the other hard currencies where the Sri Lankan Rupee appreciated by 0.74%, 5.66%, 4.09% and 2.63%
against the Sterling Pound, the Euro, the Japanese Yen and the Indian Rupee respectively, during the first
quarter of 2019. Foreign investors were net buyers of LKR denominated securities and the foreign holding
increased by over LKR 3 billion during the first quarter of 2019, reversing the trend of capital outflows
witnessed in 2018. The Central Bank was a net buyer of US Dollars in the first two months of 2019. Gross
official reserves were estimated at USD 6 billion as at the end of February 2019.
The benchmark 364-day Treasury bill rate decreased gradually to 10.40% as at the end of March 2019.
The issuance of the sovereign bond, the reduction of the statutory reserve ratio by the Central Bank,
coupled with the low credit demand led to improved liquidity in the market. As a result, the pressure on
interest rates declined, leading to lower rates across the yield curve. We expect interest rates to decline
during the second quarter of 2019, although pressure is expected to build up on interest rates during the
second half of the year.
The two main indices of Colombo Stock Exchange recorded losses during the first quarter of 2019. The All
Share Price Index and the S&P SL 20 index declined by 8.18% and 12.64% respectively, during the first
three months of 2019. Continuous foreign selling and weak corporate performance by majority of the
listed companies further hampered the investor sentiment. We expect the equity market to be weak on the
backdrop of uncertainly in the political front and the weak economic outlook.
CONTINUATION OFWEAK SENTIMENT
SRI LANKA RUPEEAPPRECIATES IN VALUE
INFLATION RATEON THE RISE
BENCHMARK INTERESTRATE DECLINES
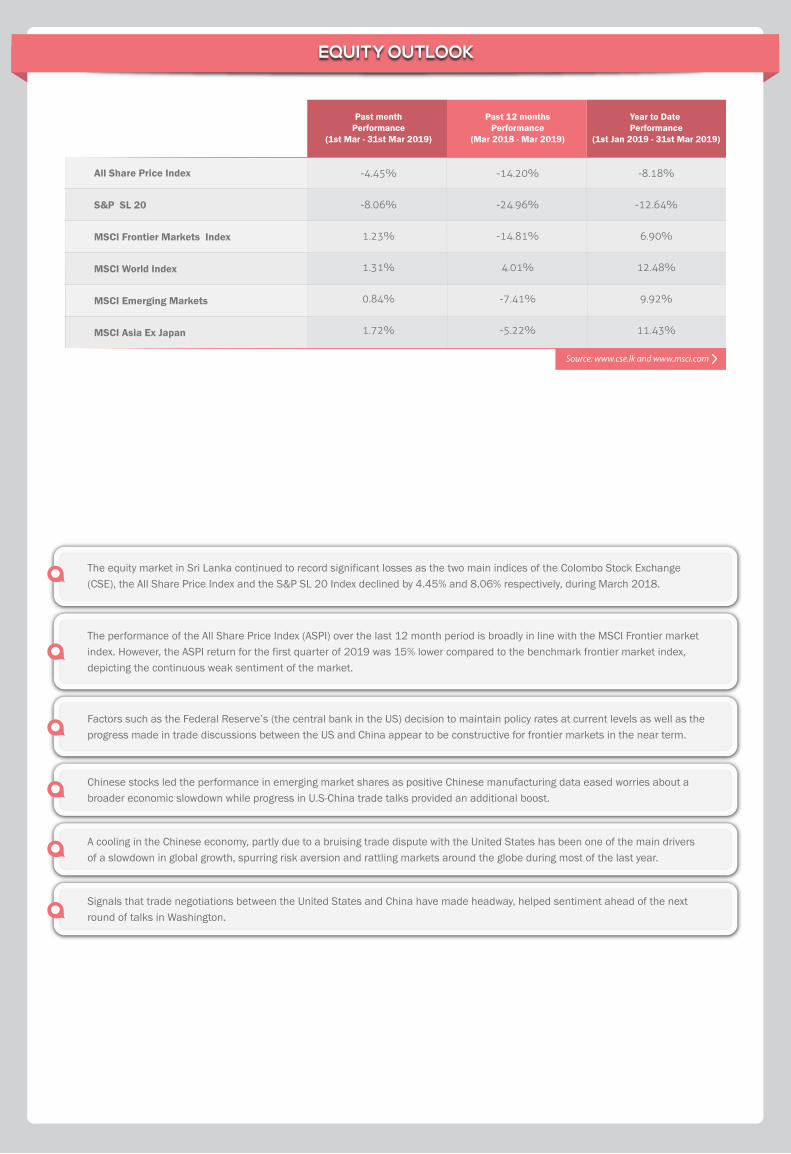
The equity market in Sri Lanka continued to record significant losses as the two main indices of the Colombo Stock Exchange (CSE), the All Share Price Index and the S&P SL 20 Index declined by 4.45% and 8.06% respectively, during March 2018.
The performance of the All Share Price Index (ASPI) over the last 12 month period is broadly in line with the MSCI Frontier market index. However, the ASPI return for the first quarter of 2019 was 15% lower compared to the benchmark frontier market index, depicting the continuous weak sentiment of the market.
Signals that trade negotiations between the United States and China have made headway, helped sentiment ahead of the next round of talks in Washington.
Chinese stocks led the performance in emerging market shares as positive Chinese manufacturing data eased worries about a broader economic slowdown while progress in U.S-China trade talks provided an additional boost.
A cooling in the Chinese economy, partly due to a bruising trade dispute with the United States has been one of the main drivers of a slowdown in global growth, spurring risk aversion and rattling markets around the globe during most of the last year.
Factors such as the Federal Reserve’s (the central bank in the US) decision to maintain policy rates at current levels as well as the progress made in trade discussions between the US and China appear to be constructive for frontier markets in the near term.
All Share Price Index
S&P SL 20
MSCI Frontier Markets Index
MSCI World Index
MSCI Emerging Markets
MSCI Asia Ex Japan
-4.45%
-8.06%
1.23%
1.31%
0.84%
1.72%
-14.20%
-24.96%
-14.81%
4.01%
-7.41%
-5.22%
Past monthPerformance
(1st Mar - 31st Mar 2019)
Source: www.cse.lk and www.msci.com
Past 12 monthsPerformance
(Mar 2018 - Mar 2019)
-8.18%
-12.64%
6.90%
12.48%
9.92%
11.43%
Year to Date Performance
(1st Jan 2019 - 31st Mar 2019)
EQUITY OUTLOOK
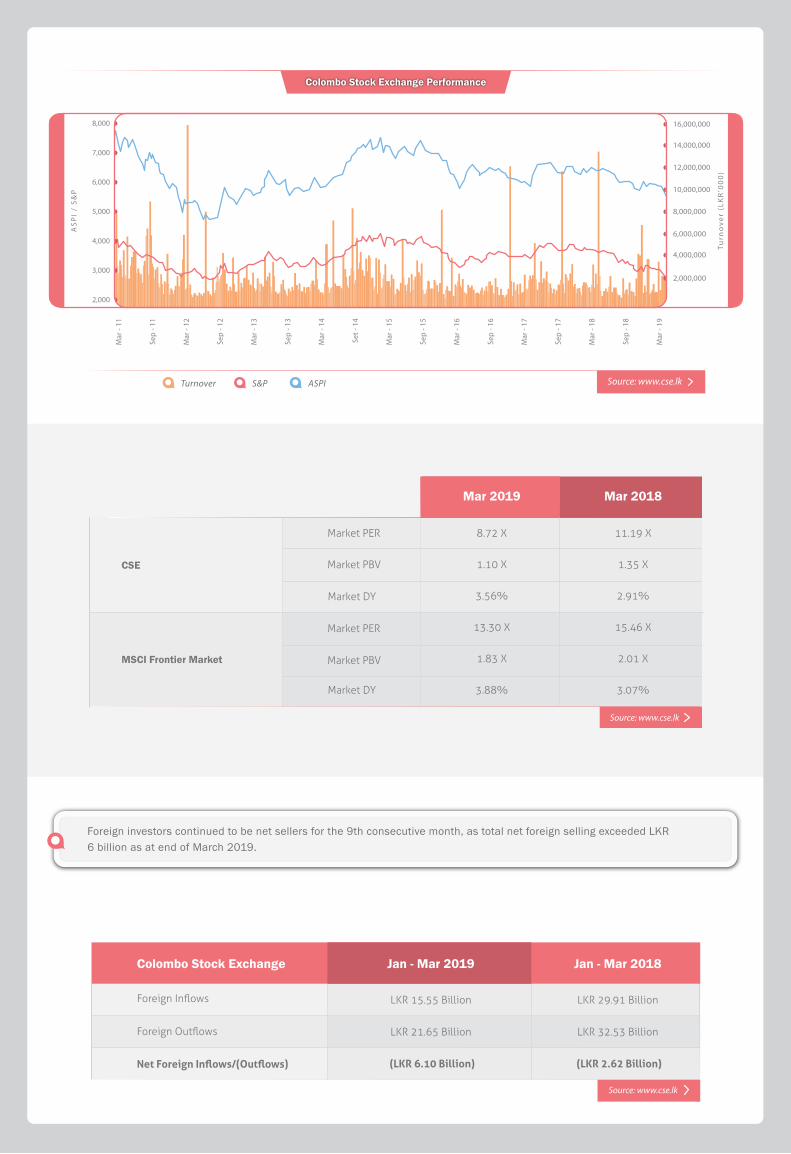
Foreign Inflows
Foreign Outflows
Net Foreign Inflows/(Outflows)
LKR 15.55 Billion
LKR 21.65 Billion
(LKR 6.10 Billion)
LKR 29.91 Billion
LKR 32.53 Billion
(LKR 2.62 Billion)
Source: www.cse.lk
Jan - Mar 2019Colombo Stock Exchange Jan - Mar 2018
Colombo Stock Exchange Performance
Source: www.cse.lkTurnover S&P ASPI
Mar
- 11
Sep
- 11
Mar
- 12
Sep
- 12
Mar
- 13
Sep
- 13
Mar
- 14
Set -
14
Mar
- 15
Sep
- 15
Mar
- 16
Sep
- 16
Mar
- 17
Sep
- 17
Mar
- 18
Sep
- 18
Mar
- 19
AS
PI
/ S
&P
8,000
7,000
6,000
5,000
4,000
3,000
2,000
Turn
ove
r (L
KR
’00
0)
8,000,000
16,000,000
14,000,000
12,000,000
10,000,000
6,000,000
4,000,000
2,000,000
Mar 2019 Mar 2018
CSE
MSCI Frontier Market
Market PER
Market PBV
Market DY
Market PER
Market PBV
Market DY
8.72 X
1.10 X
3.56%
13.30 X
1.83 X
3.88%
11.19 X
1.35 X
2.91%
15.46 X
2.01 X
3.07%
Source: www.cse.lk
Foreign investors continued to be net sellers for the 9th consecutive month, as total net foreign selling exceeded LKR 6 billion as at end of March 2019.

I NEVER TRY TO PREDICT THE MARKETWarren Buffet

The Central Bank of Sri Lanka (CBSL) maintained its key policy rates stable in February holding the Standing Lending Facility Rate (the rate CBSL lends to commercial banks) and the Standing Deposit Facility Rate (the rate which commercial banks place their excess cash with CBSL) at 9.00% and 8.00% respectively.
INTEREST RATES IN SRI LANKA
364 Day T-bill
5-Year Bond
1-Year Finance CompanyFixed Deposit Ceiling Rate
10.67%
11.11%
14.22%
Feb 19
10.40%
10.93%
14.22%
Mar 19
9.69%
10.06%
12.11%
Mar 18
11.20%
11.56%
12.46%
Dec 18
Source: Central Bank of Sri Lanka* Gross Rates provided. Net returns earned on Government Securities would vary depending on the individual’s tax bracket whileFixed Deposits will be subject to a ¬final WHT of 5% for individuals.
Treasury Bill rates decreased across the board with the benchmark 364-day T-Bill rate falling to 10.40% and the 91-day and 182-day T-Bill closing the month at 9.39% and 9.67% respectively.
Broad money (M2b) growth slowed to 11.5% year-on-year in January, from the previous month’s 13% whilst growth in credit extended to the private sector tapered to 14.8% year-on-year in January 2019 from 15.9% recorded in December 2018.
During the month of January, private sector credit disbursements declined by LKR 4.3 Bn (-0.1% m-o-m), the first time credit to private borrowers turned negative in nearly five years, in the backdrop of import restrictions introduced by the government towards latter part of 2018, to curtail vehicle and other non-essential imports.
AWDR: Average Weighted Deposit Rate | AWFDR: Average Weighted Fixed Deposit Rate | AWLR: Average Weighted Lending Rate | AWPR: Average Weighted Prime Lending rate
Mar-18 Mar -19 Source: Central Bank of Sri Lanka
YIELD CURVE - LKR TREASURIES
Time to Maturity
7%
8%
12%
11%
10%
9%
3 6 12 24 36 48 60
R a t e
0
5
10
15
20
25
R a t e %
Jan
- 08
Jun
- 08
Nov
- 08
Apr
- 09
Sep
- 09
Feb
- 10
Jul -
10
Dec
- 10
May
- 11
Oct
- 11
Mar
- 12
Aug
- 12
Jan
- 13
Jun
- 13
Nov
- 13
Apr
- 14
Sep
- 14
Feb
- 15
Jul -
15
Dec
- 15
May
- 16
Oct
- 16
Mar
- 17
Aug
- 17
Jan
- 18
Jun
- 18
Nov
- 18
AVERAGE LENDING & DEPOSIT RATES
AWDR (%) AWFDR (%) AWLR (%) AWPR (%)
FIXED INCOME OUTLOOK
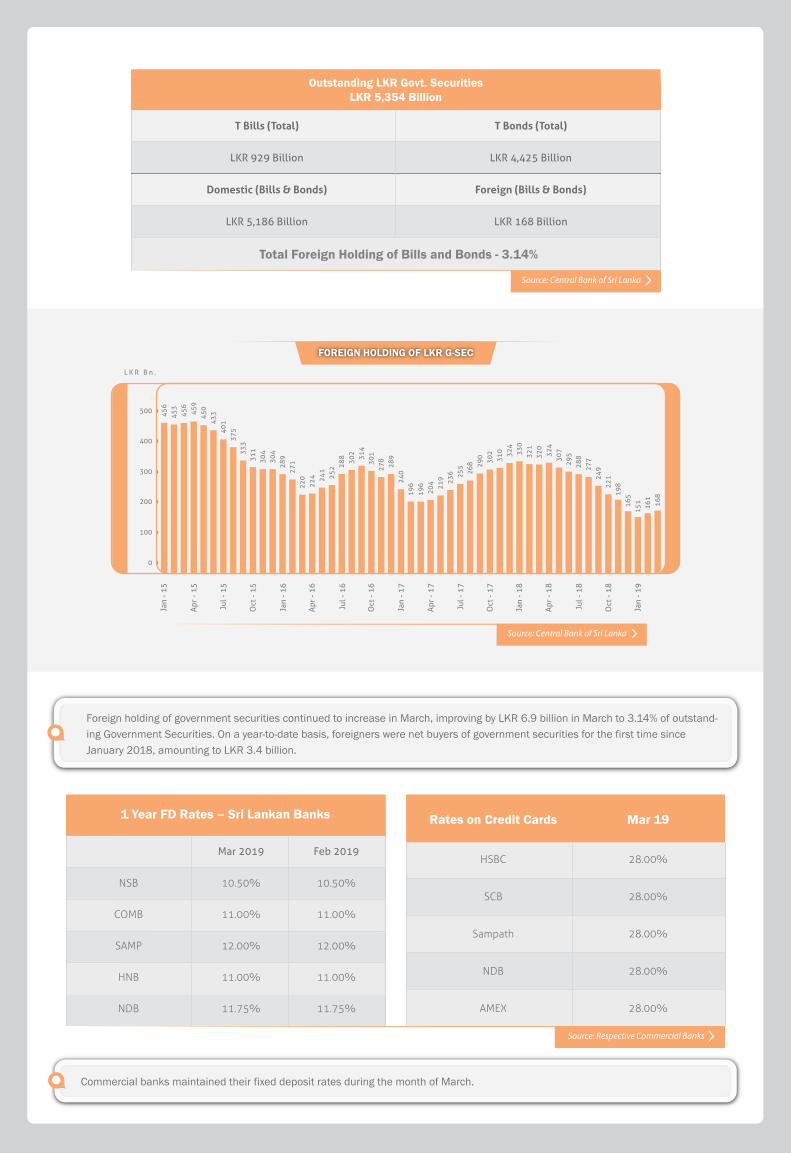
Foreign holding of government securities continued to increase in March, improving by LKR 6.9 billion in March to 3.14% of outstand-ing Government Securities. On a year-to-date basis, foreigners were net buyers of government securities for the first time since January 2018, amounting to LKR 3.4 billion.
FOREIGN HOLDING OF LKR G-SEC
Jan
- 15
Apr
- 15
Jul -
15
Oct
- 15
Jan
- 16
Apr
- 16
Jul -
16
Oct
- 16
Jan
- 17
Apr
- 17
Jul -
17
Oct
- 17
Jan
- 18
Apr
- 18
Jul -
18
Oct
- 18
Jan
- 19
0
100
200
300
400
500
L K R B n .
456
453
456
459
450
433
401
375
333
311
304
304
289
271
220
224 24
125
2
302 31
430
127
8
240
196
198
165
151
161
16819
620
4 219 23
6 255
268 29
030
231
0 324
321
324
330
320
307
295
288
277
249
221
289
288
Source: Central Bank of Sri Lanka
1 Year FD Rates – Sri Lankan Banks Rates on Credit Cards Mar 19
Mar 2019
10.50%
11.00%
12.00%
11.00%
11.75%
Feb 2019
10.50%
11.00%
12.00%
11.00%
11.75%
28.00%
28.00%
28.00%
28.00%
28.00%
HSBC
SCB
Sampath
NDB
AMEX
NSB
COMB
SAMP
HNB
NDB
Source: Respective Commercial Banks
Outstanding LKR Govt. SecuritiesLKR 5,354 Billion
Total Foreign Holding of Bills and Bonds - 3.14%
T Bills (Total)
LKR 929 Billion
Domestic (Bills & Bonds)
LKR 5,186 Billion
T Bonds (Total)
LKR 4,425 Billion
Foreign (Bills & Bonds)
LKR 168 Billion
Source: Central Bank of Sri Lanka
Commercial banks maintained their fixed deposit rates during the month of March.
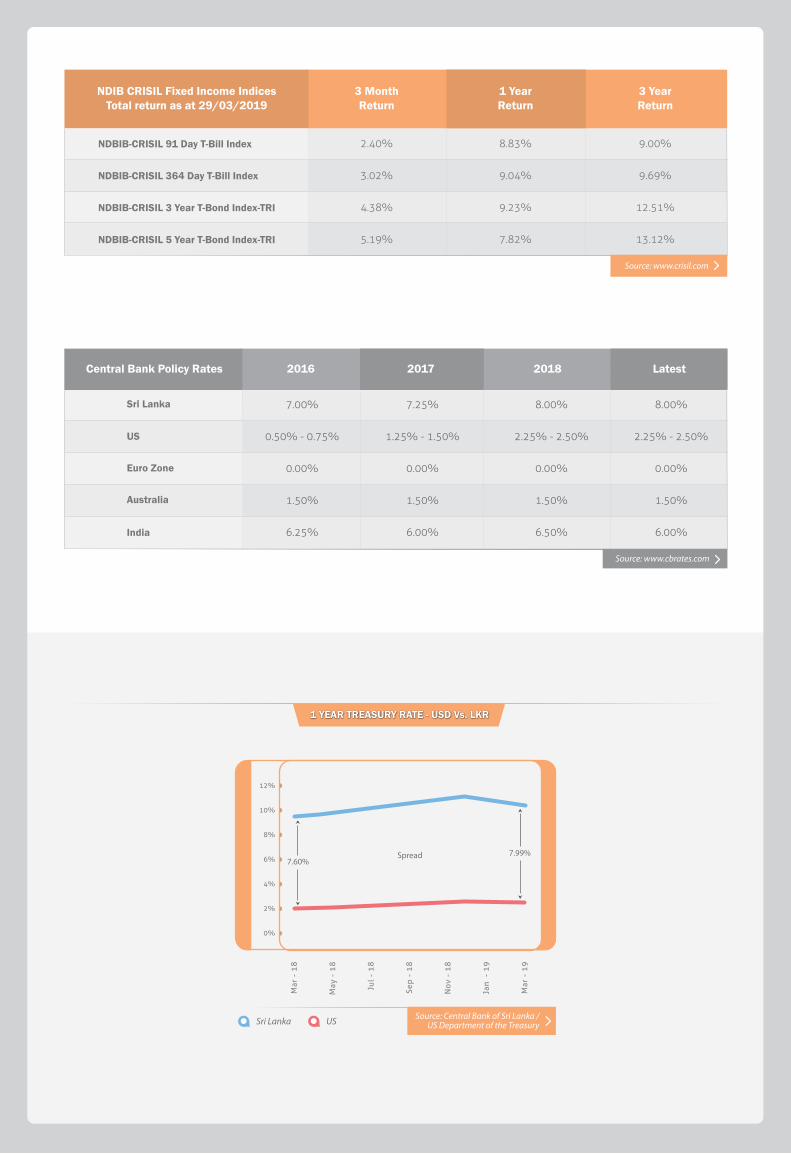
3 MonthReturn
1 YearReturn
3 YearReturn
NDBIB-CRISIL 91 Day T-Bill Index
NDBIB-CRISIL 364 Day T-Bill Index
NDBIB-CRISIL 3 Year T-Bond Index-TRI
NDBIB-CRISIL 5 Year T-Bond Index-TRI
NDIB CRISIL Fixed Income IndicesTotal return as at 29/03/2019
2.40%
3.02%
4.38%
5.19%
8.83%
9.04%
9.23%
7.82%
9.00%
9.69%
12.51%
13.12%
Source: www.crisil.com
2016 2017 2018 LatestCentral Bank Policy Rates
Australia
India
Sri Lanka
US
Euro Zone
Source: www.cbrates.com
7.00%
0.50% - 0.75%
0.00%
1.50%
6.25%
7.25%
1.25% - 1.50%
0.00%
1.50%
6.00%
8.00%
2.25% - 2.50%
0.00%
1.50%
6.50%
8.00%
2.25% - 2.50%
0.00%
1.50%
6.00%
1 YEAR TREASURY RATE - USD Vs. LKR
Sri Lanka US Source: Central Bank of Sri Lanka / US Department of the Treasury
0%
2%
8%
6%
4%
12%
10%
Mar
- 1
9
Nov
- 1
8
Jan
- 1
9
Jul
- 1
8
Sep
- 1
8
Mar
- 1
8
May
- 1
8
Spread 7.99%7.60%
Source: Respective Central Banks
Mar 18364 Day Treasury Bill Rate
Sri Lanka
India
US
Euro Zone
9.69%
6.49%
2.09%
-0.70%
Dec 18
11.20%
6.94%
2.63%
-0.75%
Feb 19
10.67%
6.55%
2.54%
-0.57%
Mar 19
10.40%
6.39%
2.41%
-0.61%
Rates on Savings Accounts Mar 2019
Sri Lanka
US
Euro Zone
Australia
India
4.00%
0.03%
0.11%
1.65%
3.50%
Source: Respective Commercial Banks
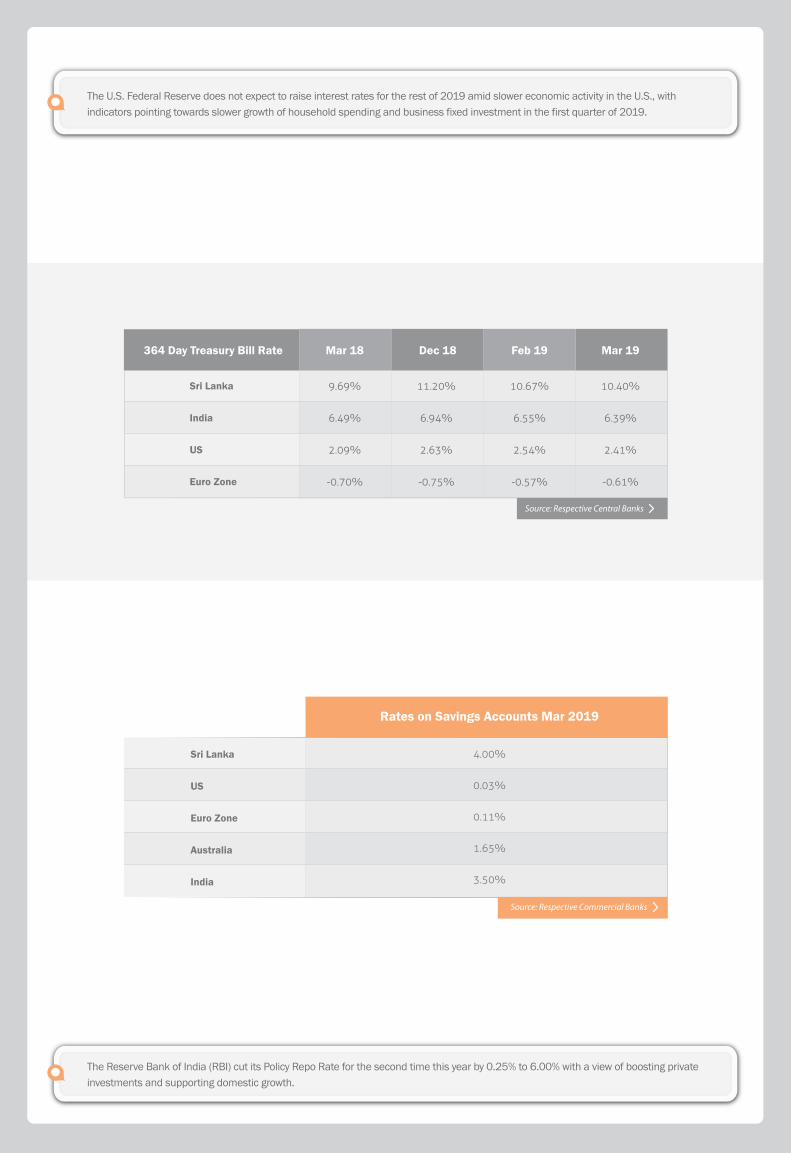
The Reserve Bank of India (RBI) cut its Policy Repo Rate for the second time this year by 0.25% to 6.00% with a view of boosting private investments and supporting domestic growth.
The U.S. Federal Reserve does not expect to raise interest rates for the rest of 2019 amid slower economic activity in the U.S., with indicators pointing towards slower growth of household spending and business fixed investment in the first quarter of 2019.
NDB Wealth
A GOOD FINANCIAL PLAN IS A ROAD MAP THATSHOWS US WHERE WE COULD END UP IN THE FUTURE
Mar 18Country
Sri Lanka
US
Euro Zone
India
Dec 18
2.77%
1.91%
1.52%
2.11%
Feb 19
4.02%
1.52%
1.49%
2.57%
Mar 19
4.28%
1.52%*
1.49%*
2.57%*
4.21%
2.36%
1.40%
4.28%
Source: Department of Census and Statistics - Sri Lanka, http://www.inflation.eu/, https://tradingeconomics.com/
* Feb 2019
INFLATION - POINT TO POINT CHANGE - CCPI VS. NCPI
2%
4%
0%
-2%
6%
8%
10%
Jan
- 15
Mar
- 15
May
- 15
Jul -
15
Sep
- 15
Nov
- 15
Jan
- 16
Mar
- 16
May
- 16
Jul -
16
Sep
- 16
Nov
- 16
Jan
- 17
Mar
- 17
May
- 17
Jul -
17
Sep
- 17
Nov
- 17
Jan
- 18
Mar
- 18
May
- 18
Jul -
18
Sep
- 18
Nov
- 18
Jan
- 19
Mar
- 19
CCPI NCPISource: Department of
Census and Statistics Sri Lanka
GLOBAL INFLATION RATES
Jan
- 15
Apr
- 15
Jul -
15
Oct
- 15
Jan
- 16
Apr
- 16
Jul -
16
Oct
- 16
Jan
- 17
Apr
- 17
Jul -
17
Oct
- 17
Jan
- 18
Apr
- 18
Jul -
18
Oct
- 18
Jan
- 19
-2%
-1%
0%
1%
2%
4%
3%
6%
7%
9%
8%
5%
Sri Lanka US
Euro zone India
Source: http://www.in�ation.eu/
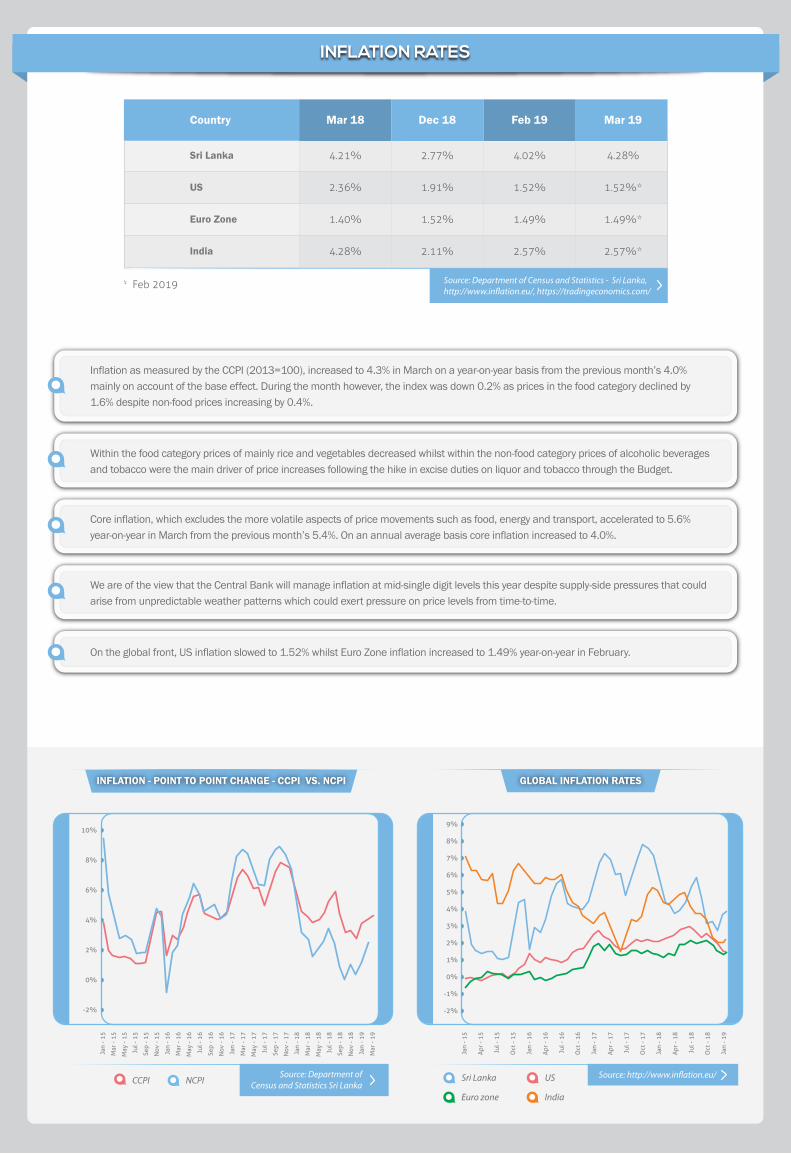
Inflation as measured by the CCPI (2013=100), increased to 4.3% in March on a year-on-year basis from the previous month’s 4.0% mainly on account of the base effect. During the month however, the index was down 0.2% as prices in the food category declined by 1.6% despite non-food prices increasing by 0.4%.
Within the food category prices of mainly rice and vegetables decreased whilst within the non-food category prices of alcoholic beverages and tobacco were the main driver of price increases following the hike in excise duties on liquor and tobacco through the Budget.
We are of the view that the Central Bank will manage inflation at mid-single digit levels this year despite supply-side pressures that could arise from unpredictable weather patterns which could exert pressure on price levels from time-to-time.
Core inflation, which excludes the more volatile aspects of price movements such as food, energy and transport, accelerated to 5.6% year-on-year in March from the previous month’s 5.4%. On an annual average basis core inflation increased to 4.0%.
On the global front, US inflation slowed to 1.52% whilst Euro Zone inflation increased to 1.49% year-on-year in February.
INFLATION RATES
USD PER 1 EURO MOVEMENT
Source: http://www.x-rates.com/
Jan
- 09
Jul -
10
Oct
- 09
Apr -
11
Jan
- 12
Oct
- 12
Jul -
13
Apr-
14
Jan
- 15
Oct
- 15
Jul -
16
Apr -
17
Jan
- 18
Oct
- 18
1.60
1.40
1.50
1.30
1.20
1.10
1.00
Mar 18Exchange
Rates Vs. LKR
155.97
219.54
192.22
1.46
119.36
120.72
2.39
413.64
24.75
Dec 18
182.75
231.86
208.99
1.65
128.87
134.08
2.61
484.78
26.57
Dec 171 Year
App/(Dep) LKR
-11.44%
-4.61%
-2.82%
-7.94%
-4.41%
-7.96%
-5.99%
-11.46%
-5.40%
YTDApp/(Dep) LKR
3.76%
0.74%
5.66%
3.79%
3.21%
2.23%
2.51%
3.76%
1.55%
USD
GBP
EURO
YEN
AUD
CAD
INR
BHD
CNY
Source: Central Bank of Sri Lanka
Mar 19
176.13
230.16
197.80
1.59
124.87
131.16
2.55
467.19
26.16
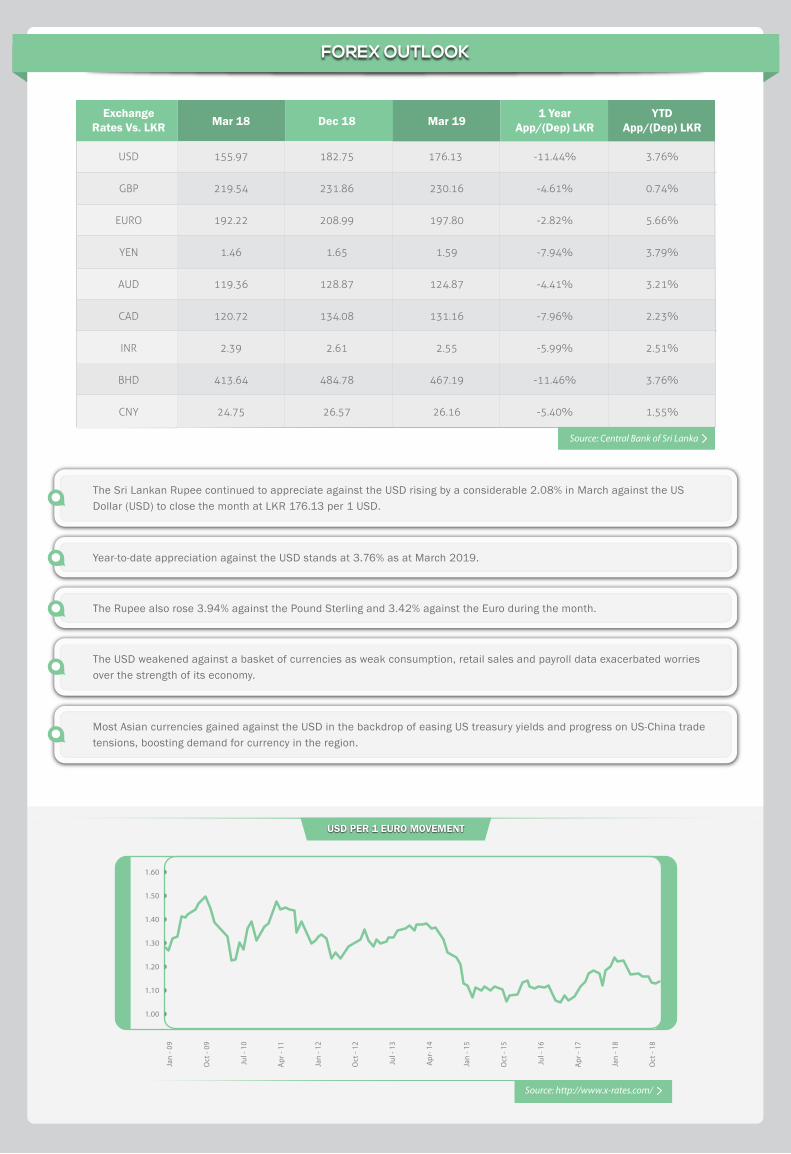
Year-to-date appreciation against the USD stands at 3.76% as at March 2019.
The Rupee also rose 3.94% against the Pound Sterling and 3.42% against the Euro during the month.
The USD weakened against a basket of currencies as weak consumption, retail sales and payroll data exacerbated worries over the strength of its economy.
Most Asian currencies gained against the USD in the backdrop of easing US treasury yields and progress on US-China trade tensions, boosting demand for currency in the region.
The Sri Lankan Rupee continued to appreciate against the USD rising by a considerable 2.08% in March against the US Dollar (USD) to close the month at LKR 176.13 per 1 USD.
FOREX OUTLOOK
2011
2012
2013
2014
2015
2016
2017
2018
2019
Jan
- Mar
2010
0.00%
10.00%
-10.00%
-20.00%
-30.00%
-40.00%
-50.00%
20.00%
30.00%
40.00%
50.00%
Gold Source: NDB Wealth ResearchDJUBS Oil Tea
Commodity Price Movements
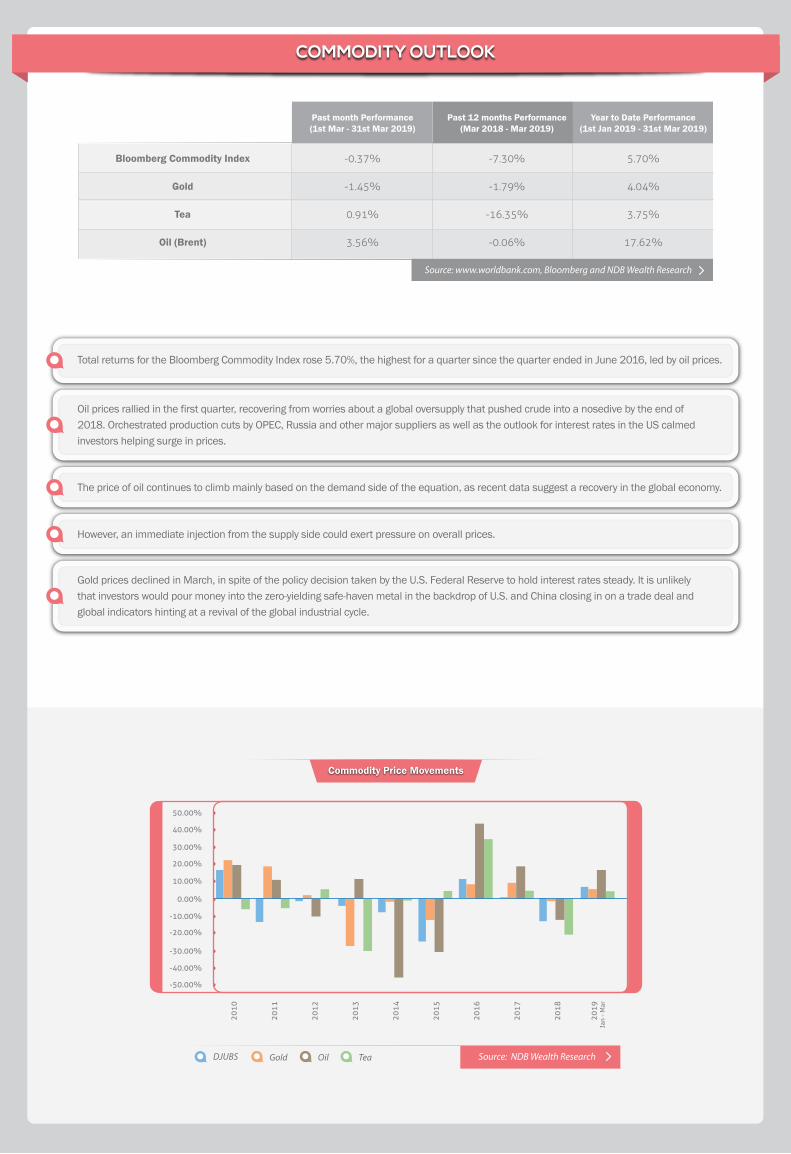
However, an immediate injection from the supply side could exert pressure on overall prices.
The price of oil continues to climb mainly based on the demand side of the equation, as recent data suggest a recovery in the global economy.
Gold prices declined in March, in spite of the policy decision taken by the U.S. Federal Reserve to hold interest rates steady. It is unlikely that investors would pour money into the zero-yielding safe-haven metal in the backdrop of U.S. and China closing in on a trade deal and global indicators hinting at a revival of the global industrial cycle.
Oil prices rallied in the first quarter, recovering from worries about a global oversupply that pushed crude into a nosedive by the end of 2018. Orchestrated production cuts by OPEC, Russia and other major suppliers as well as the outlook for interest rates in the US calmed investors helping surge in prices.
Total returns for the Bloomberg Commodity Index rose 5.70%, the highest for a quarter since the quarter ended in June 2016, led by oil prices.
COMMODITY OUTLOOK
Bloomberg Commodity Index
Gold
Tea
Oil (Brent)
-0.37%
-1.45%
0.91%
3.56%
-7.30%
-1.79%
-16.35%
-0.06%
Past month Performance(1st Mar - 31st Mar 2019)
Past 12 months Performance(Mar 2018 - Mar 2019)
5.70%
4.04%
3.75%
17.62%
Year to Date Performance(1st Jan 2019 - 31st Mar 2019)
Source: www.worldbank.com, Bloomberg and NDB Wealth Research
PROPERTY OUTLOOK
Some companies not meeting their revenue targets under the current economic conditions may be reluctant to spend on higher grade office space and experts believe firms will move from high-end office buildings to residential units within or outside Colombo as they get hit with a sluggish economy and political uncertainty.
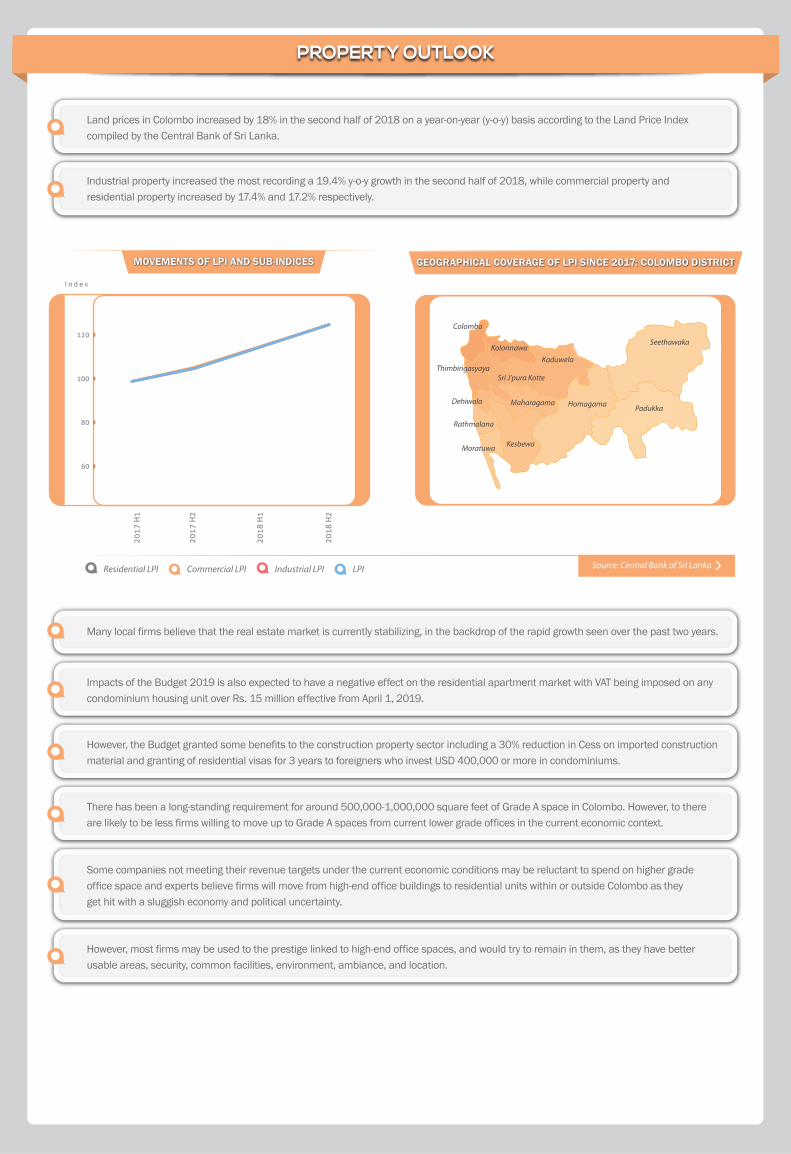
Industrial property increased the most recording a 19.4% y-o-y growth in the second half of 2018, while commercial property and residential property increased by 17.4% and 17.2% respectively.
Land prices in Colombo increased by 18% in the second half of 2018 on a year-on-year (y-o-y) basis according to the Land Price Index compiled by the Central Bank of Sri Lanka.
Impacts of the Budget 2019 is also expected to have a negative effect on the residential apartment market with VAT being imposed on any condominium housing unit over Rs. 15 million effective from April 1, 2019.
However, the Budget granted some benefits to the construction property sector including a 30% reduction in Cess on imported construction material and granting of residential visas for 3 years to foreigners who invest USD 400,000 or more in condominiums.
There has been a long-standing requirement for around 500,000-1,000,000 square feet of Grade A space in Colombo. However, to there are likely to be less firms willing to move up to Grade A spaces from current lower grade offices in the current economic context.
Many local firms believe that the real estate market is currently stabilizing, in the backdrop of the rapid growth seen over the past two years.
However, most firms may be used to the prestige linked to high-end office spaces, and would try to remain in them, as they have better usable areas, security, common facilities, environment, ambiance, and location.
Source: Central Bank of Sri Lanka
GEOGRAPHICAL COVERAGE OF LPI SINCE 2017: COLOMBO DISTRICT
Colombo
Kolonnawa
Thimbirigasyaya
Dehiwala
Rathmalana
Moratuwa
Sri J’pura Kotte
Kaduwela
Maharagama
Kesbewa
Homagama Padukka
Seethawaka
MOVEMENTS OF LPI AND SUB-INDICES
60
80
120
100
2017
H1
2017
H2
2018
H1
2018
H2
I n d e x
Residential LPI Commercial LPI Industrial LPI LPI
ISLAMIC FINANCE INDUSTRY
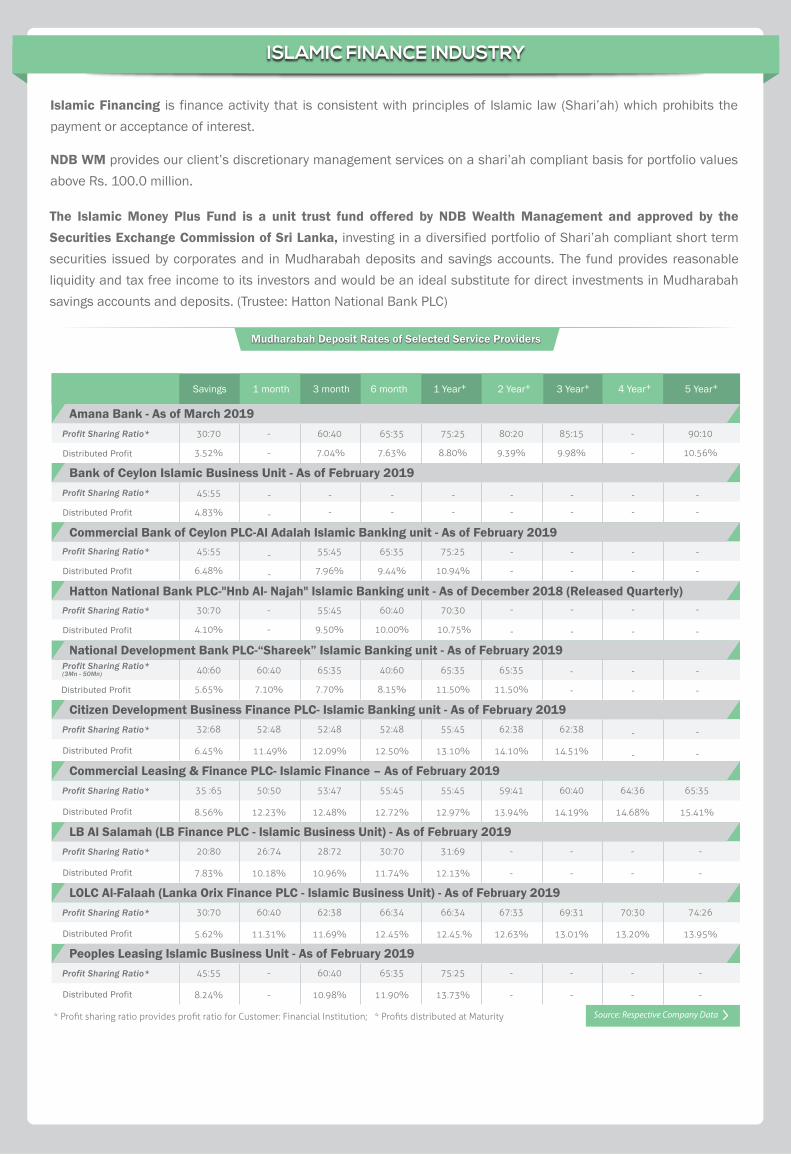
* Profit sharing ratio provides profit ratio for Customer: Financial Institution; �* Profits distributed at Maturity
Mudharabah Deposit Rates of Selected Service Providers
Source: Respective Company Data
Savings 1 month 3 month 6 month 1 Year+ 2 Year+ 3 Year+ 4 Year+ 5 Year+
Hatton National Bank PLC-"Hnb Al- Najah" Islamic Banking unit - As of December 2018 (Released Quarterly)30:70
4.10%
-
-
55:45
9.50%
60:40
10.00%
70:30
10.75%Distributed Profit
Profit Sharing Ratio* -
-
-
-
-
-
-
-
Bank of Ceylon Islamic Business Unit - As of February 201945:55
4.83%Distributed Profit
Profit Sharing Ratio* -
-
-
-
-
-
-
-
-
-
-
-
-
-
-
-
Commercial Bank of Ceylon PLC-Al Adalah Islamic Banking unit - As of February 201945:55
6.48%Distributed Profit
Profit Sharing Ratio* 55:45
7.96%
65:35
9.44%
75:25
10.94%
-
-
-
-
-
-
-
-
-
-
Distributed Profit
Amana Bank - As of March 2019Profit Sharing Ratio* 30:70
3.52%
60:40
7.04%
65:35
7.63%
75:25
8.80%
80:20
9.39%
85:15
9.98%
90:10
10.56%
-
-
-
-
Citizen Development Business Finance PLC- Islamic Banking unit - As of February 2019
Distributed Profit
Profit Sharing Ratio* 52:48
11.49%
52:48
12.09%
32:68
6.45%
52:48
12.50%
55:45
13.10%
62:38
14.10%
62:38
14.51%
-
-
-
-
Commercial Leasing & Finance PLC- Islamic Finance – As of February 2019
Distributed Profit
Profit Sharing Ratio* 53:47
12.48%
35 :65
8.56%
50:50
12.23%
55:45
12.72%
55:45
12.97%
65:35
15.41%
64:36
14.68%
60:40
14.19%
59:41
13.94%
LB Al Salamah (LB Finance PLC - Islamic Business Unit) - As of February 2019
Distributed Profit
Profit Sharing Ratio* 28:72
10.96%
20:80
7.83%
26:74
10.18%
30:70
11.74%
31:69
12.13%
-
-
-
-
-
-
-
-
LOLC Al-Falaah (Lanka Orix Finance PLC - Islamic Business Unit) - As of February 2019
Distributed Profit
Profit Sharing Ratio* 62:38
11.69%
30:70
5.62%
66:34
12.45%
66:34
12.45.%
74:26
13.95%
70:30
13.20%
69:31
13.01%
67:33
12.63%
60:40
11.31%
Peoples Leasing Islamic Business Unit - As of February 2019
Distributed Profit
Profit Sharing Ratio* 60:40
10.98%
45:55
8.24%
65:35
11.90%
75:25
13.73%
-
-
-
-
-
-
-
-
-
-
National Development Bank PLC-“Shareek” Islamic Banking unit - As of February 2019
Distributed Profit
Profit Sharing Ratio*(3Mn - 50Mn) - -40:60
5.65%
60:40
7.10%
65:35
7.70%
65:35
11.50%
40:60
8.15%
65:35
11.50%
-
- --
NDB WM provides our client’s discretionary management services on a shari’ah compliant basis for portfolio values above Rs. 100.0 million.
The Islamic Money Plus Fund is a unit trust fund offered by NDB Wealth Management and approved by the Securities Exchange Commission of Sri Lanka, investing in a diversified portfolio of Shari’ah compliant short term securities issued by corporates and in Mudharabah deposits and savings accounts. The fund provides reasonable liquidity and tax free income to its investors and would be an ideal substitute for direct investments in Mudharabah savings accounts and deposits. (Trustee: Hatton National Bank PLC)
Islamic Financing is finance activity that is consistent with principles of Islamic law (Shari’ah) which prohibits the payment or acceptance of interest.
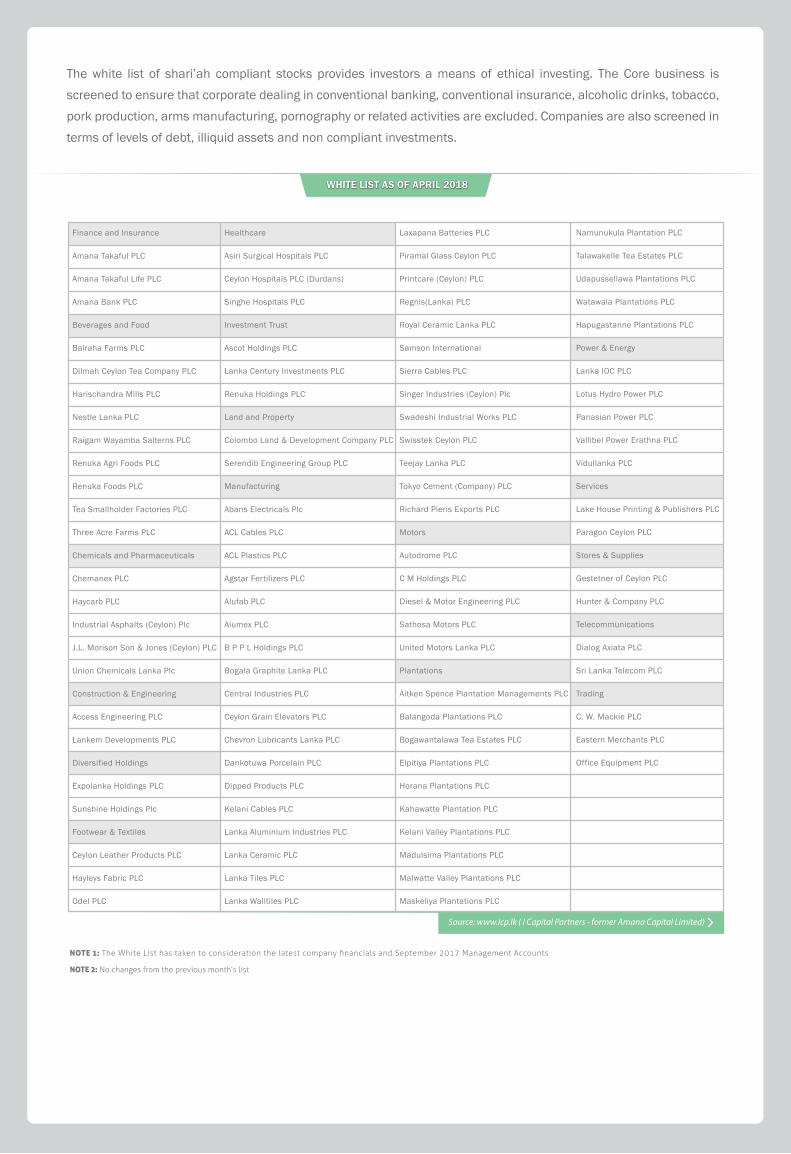
The white list of shari’ah compliant stocks provides investors a means of ethical investing. The Core business is screened to ensure that corporate dealing in conventional banking, conventional insurance, alcoholic drinks, tobacco, pork production, arms manufacturing, pornography or related activities are excluded. Companies are also screened in terms of levels of debt, illiquid assets and non compliant investments.
WHITE LIST AS OF APRIL 2018
Source: www.icp.lk ( I Capital Partners - former Amana Capital Limited)
Finance and Insurance
Amana Takaful PLC
Amana Takaful Life PLC
Amana Bank PLC
Beverages and Food
Bairaha Farms PLC
Dilmah Ceylon Tea Company PLC
Harischandra Mills PLC
Nestle Lanka PLC
Raigam Wayamba Salterns PLC
Renuka Agri Foods PLC
Renuka Foods PLC
Tea Smallholder Factories PLC
Three Acre Farms PLC
Chemicals and Pharmaceuticals
Chemanex PLC
Haycarb PLC
Industrial Asphalts (Ceylon) Plc
J.L. Morison Son & Jones (Ceylon) PLC
Union Chemicals Lanka Plc
Construction & Engineering
Access Engineering PLC
Lankem Developments PLC
Diversified Holdings
Expolanka Holdings PLC
Sunshine Holdings Plc
Footwear & Textiles
Ceylon Leather Products PLC
Hayleys Fabric PLC
Odel PLC
Healthcare
Asiri Surgical Hospitals PLC
Ceylon Hospitals PLC (Durdans)
Singhe Hospitals PLC
Investment Trust
Ascot Holdings PLC
Lanka Century Investments PLC
Renuka Holdings PLC
Land and Property
Colombo Land & Development Company PLC
Serendib Engineering Group PLC
Manufacturing
Abans Electricals Plc
ACL Cables PLC
ACL Plastics PLC
Agstar Fertilizers PLC
Alufab PLC
Alumex PLC
B P P L Holdings PLC
Bogala Graphite Lanka PLC
Central Industries PLC
Ceylon Grain Elevators PLC
Chevron Lubricants Lanka PLC
Dankotuwa Porcelain PLC
Dipped Products PLC
Kelani Cables PLC
Lanka Aluminium Industries PLC
Lanka Ceramic PLC
Lanka Tiles PLC
Lanka Walltiles PLC
Laxapana Batteries PLC
Piramal Glass Ceylon PLC
Printcare (Ceylon) PLC
Regnis(Lanka) PLC
Royal Ceramic Lanka PLC
Samson International
Sierra Cables PLC
Singer Industries (Ceylon) Plc
Swadeshi Industrial Works PLC
Swisstek Ceylon PLC
Teejay Lanka PLC
Tokyo Cement (Company) PLC
Richard Pieris Exports PLC
Motors
Autodrome PLC
C M Holdings PLC
Diesel & Motor Engineering PLC
Sathosa Motors PLC
United Motors Lanka PLC
Plantations
Aitken Spence Plantation Managements PLC
Balangoda Plantations PLC
Bogawantalawa Tea Estates PLC
Elpitiya Plantations PLC
Horana Plantations PLC
Kahawatte Plantation PLC
Kelani Valley Plantations PLC
Madulsima Plantations PLC
Malwatte Valley Plantations PLC
Maskeliya Plantations PLC
Namunukula Plantation PLC
Talawakelle Tea Estates PLC
Udapussellawa Plantations PLC
Watawala Plantations PLC
Hapugastanne Plantations PLC
Power & Energy
Lanka IOC PLC
Lotus Hydro Power PLC
Panasian Power PLC
Vallibel Power Erathna PLC
Vidullanka PLC
Services
Lake House Printing & Publishers PLC
Paragon Ceylon PLC
Stores & Supplies
Gestetner of Ceylon PLC
Hunter & Company PLC
Telecommunications
Dialog Axiata PLC
Sri Lanka Telecom PLC
Trading
C. W. Mackie PLC
Eastern Merchants PLC
Office Equipment PLC
NOTE 1: The White List has taken to consideration the latest company financials and September 2017 Management Accounts
NOTE 2: No changes from the previous month’s list
UNIT TRUST FUNDSOFFERED BY NDB WM
NDB Wealth Growth Fund
NDB Wealth Growth & Income Fund
NDB Wealth Income Fund
NDB Wealth Income Plus Fund
NDB Wealth Money Fund
NDB Wealth Money Plus Fund
NDB Wealth Islamic Money Plus Fund
NDB Wealth Gilt Edged Fund
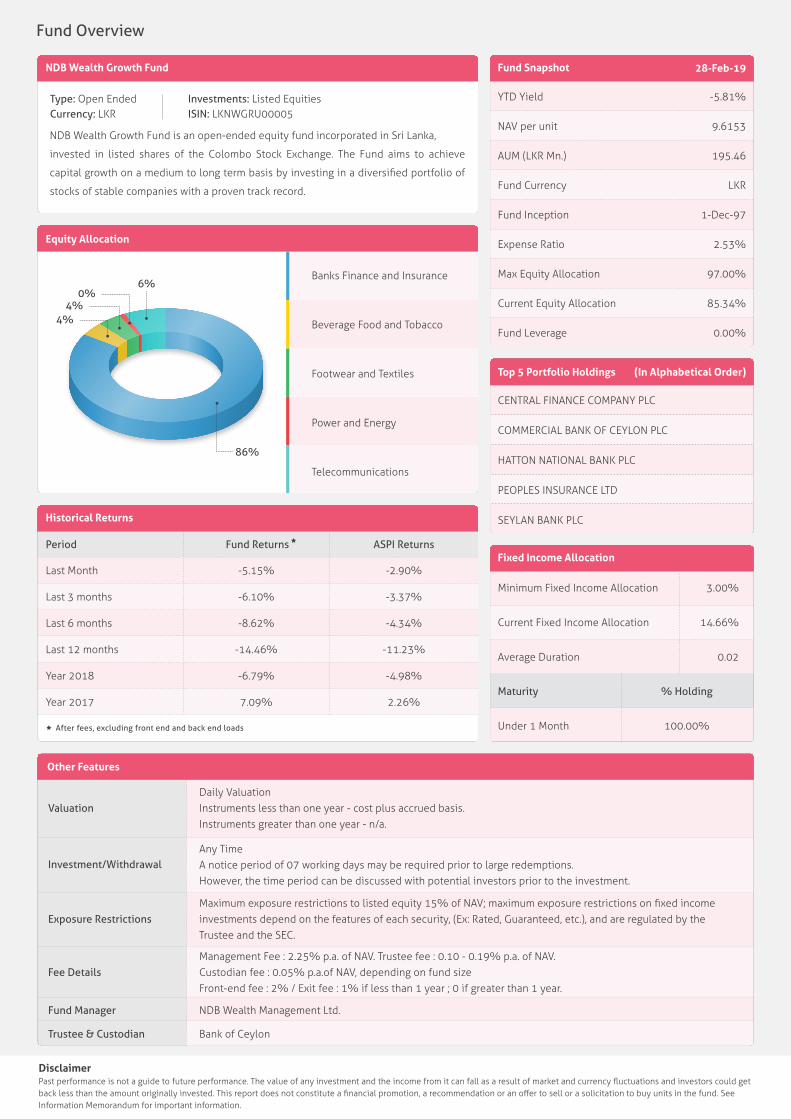
NDB Wealth Growth Fund
NDB Wealth Growth Fund is an open-ended equity fund incorporated in Sri Lanka,
invested in listed shares of the Colombo Stock Exchange. The Fund aims to achieve
capital growth on a medium to long term basis by investing in a diversified portfolio of
stocks of stable companies with a proven track record.
Type: Open EndedCurrency: LKR
Investments: Listed EquitiesISIN: LKNWGRU00005
Fund Snapshot 28-Feb-19
YTD Yield
NAV per unit
AUM (LKR Mn.)
Fund Currency
Fund Inception
Expense Ratio
Max Equity Allocation
Current Equity Allocation
Fund Leverage
-5.81%
9.6153
195.46
LKR
1-Dec-97
2.53%
97.00%
85.34%
0.00%
Fixed Income Allocation
Maturity
Under 1 Month
Minimum Fixed Income Allocation
Current Fixed Income Allocation
Average Duration
3.00%
14.66%
0.02
% Holding
100.00%
Top 5 Portfolio Holdings (In Alphabetical Order)
CENTRAL FINANCE COMPANY PLC
COMMERCIAL BANK OF CEYLON PLC
HATTON NATIONAL BANK PLC
PEOPLES INSURANCE LTD
SEYLAN BANK PLC
Daily ValuationInstruments less than one year - cost plus accrued basis. Instruments greater than one year - n/a.
Any TimeA notice period of 07 working days may be required prior to large redemptions.However, the time period can be discussed with potential investors prior to the investment.
Management Fee : 2.25% p.a. of NAV. Trustee fee : 0.10 - 0.19% p.a. of NAV.Custodian fee : 0.05% p.a.of NAV, depending on fund sizeFront-end fee : 2% / Exit fee : 1% if less than 1 year ; 0 if greater than 1 year.
Valuation
Other Features
Investment/Withdrawal
Fee Details
Maximum exposure restrictions to listed equity 15% of NAV; maximum exposure restrictions on fixed income investments depend on the features of each security, (Ex: Rated, Guaranteed, etc.), and are regulated by the Trustee and the SEC.
Exposure Restrictions
NDB Wealth Management Ltd.Fund Manager
Bank of CeylonTrustee & Custodian
DisclaimerPast performance is not a guide to future performance. The value of any investment and the income from it can fall as a result of market and currency fluctuations and investors could get back less than the amount originally invested. This report does not constitute a financial promotion, a recommendation or an offer to sell or a solicitation to buy units in the fund. See Information Memorandum for important information.
Fund Overview
Equity Allocation
0%4%
4%
6%
86%
Banks Finance and Insurance
Beverage Food and Tobacco
Footwear and Textiles
Power and Energy
Telecommunications
Historical Returns
After fees, excluding front end and back end loads
Last Month
Last 3 months
Last 6 months
Last 12 months
Year 2018
Year 2017
-5.15%
-6.10%
-8.62%
-14.46%
-6.79%
7.09%
Period
-2.90%
-3.37%
-4.34%
-11.23%
-4.98%
2.26%
ASPI ReturnsFund Returns
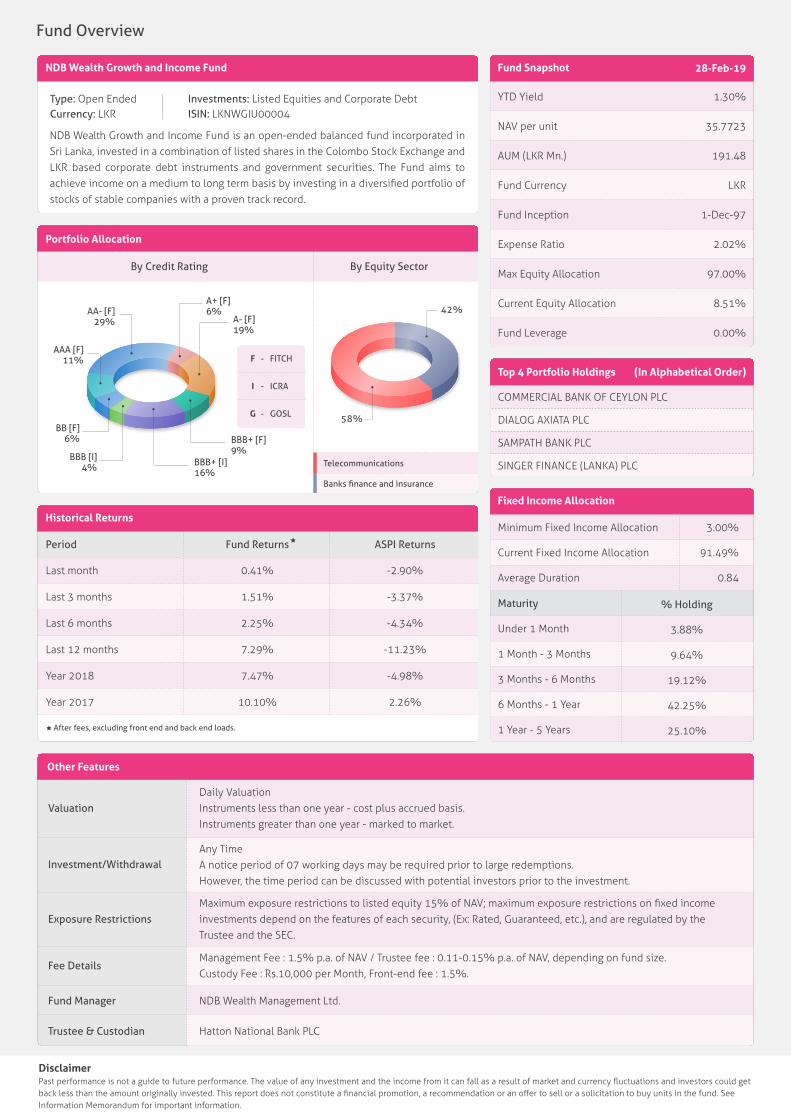
NDB Wealth Growth and Income Fund
NDB Wealth Growth and Income Fund is an open-ended balanced fund incorporated in Sri Lanka, invested in a combination of listed shares in the Colombo Stock Exchange and LKR based corporate debt instruments and government securities. The Fund aims to achieve income on a medium to long term basis by investing in a diversified portfolio of stocks of stable companies with a proven track record.
Type: Open EndedCurrency: LKR
Investments: Listed Equities and Corporate DebtISIN: LKNWGIU00004
Fund Snapshot 28-Feb-19
YTD Yield
NAV per unit
AUM (LKR Mn.)
Fund Currency
Fund Inception
Expense Ratio
Max Equity Allocation
Current Equity Allocation
Fund Leverage
1.30%
35.7723
191.48
LKR
1-Dec-97
2.02%
97.00%
8.51%
0.00%
Fixed Income Allocation
Maturity
Under 1 Month
1 Month - 3 Months
3 Months - 6 Months
6 Months - 1 Year
1 Year - 5 Years
Minimum Fixed Income Allocation
Current Fixed Income Allocation
Average Duration
3.00%
91.49%
0.84
% Holding
3.88%
9.64%
19.12%
42.25%
25.10%
Top 4 Portfolio Holdings (In Alphabetical Order)
COMMERCIAL BANK OF CEYLON PLC
DIALOG AXIATA PLC
SAMPATH BANK PLC
SINGER FINANCE (LANKA) PLC
Daily ValuationInstruments less than one year - cost plus accrued basis. Instruments greater than one year - marked to market.
Any TimeA notice period of 07 working days may be required prior to large redemptions.However, the time period can be discussed with potential investors prior to the investment.
Management Fee : 1.5% p.a. of NAV / Trustee fee : 0.11-0.15% p.a. of NAV, depending on fund size.Custody Fee : Rs.10,000 per Month, Front-end fee : 1.5%.
Valuation
Other Features
Investment/Withdrawal
Fee Details
Maximum exposure restrictions to listed equity 15% of NAV; maximum exposure restrictions on fixed income investments depend on the features of each security, (Ex: Rated, Guaranteed, etc.), and are regulated by the Trustee and the SEC.
Exposure Restrictions
NDB Wealth Management Ltd.Fund Manager
Hatton National Bank PLCTrustee & Custodian
DisclaimerPast performance is not a guide to future performance. The value of any investment and the income from it can fall as a result of market and currency fluctuations and investors could get back less than the amount originally invested. This report does not constitute a financial promotion, a recommendation or an offer to sell or a solicitation to buy units in the fund. See Information Memorandum for important information.
Portfolio Allocation
58%
42%AA- [F]29%
AAA [F]11%
A- [F]19%
BBB+ [I]16%
BBB+ [F]9%
BBB [I]4%
BB [F]6%
A+ [F]6%
Telecommunications
Banks finance and insurance
By Equity SectorBy Credit Rating
F
I
G
FITCH
ICRA
GOSL
-
-
-
Historical Returns
Last month
Last 3 months
Last 6 months
Last 12 months
Year 2018
Year 2017
0.41%
1.51%
2.25%
7.29%
7.47%
10.10%
Period Fund Returns
-2.90%
-3.37%
-4.34%
-11.23%
-4.98%
2.26%
ASPI Returns
After fees, excluding front end and back end loads.
Fund Overview
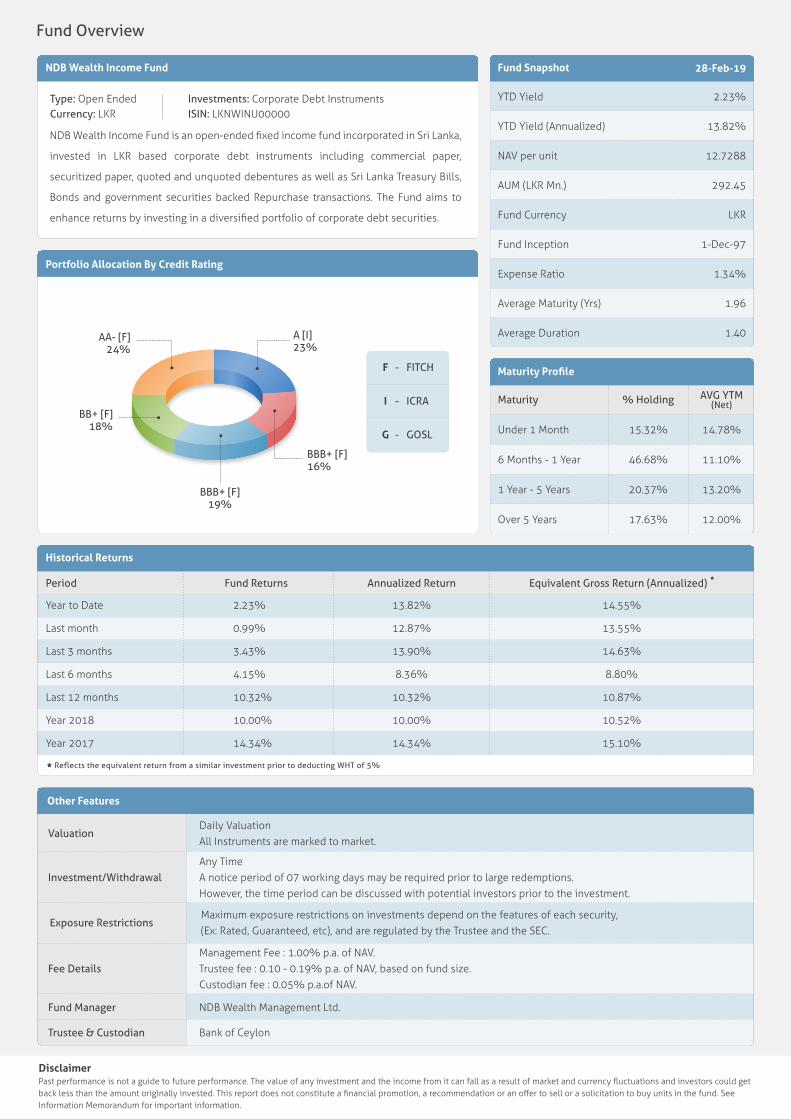
NDB Wealth Income Fund
NDB Wealth Income Fund is an open-ended fixed income fund incorporated in Sri Lanka,
invested in LKR based corporate debt instruments including commercial paper,
securitized paper, quoted and unquoted debentures as well as Sri Lanka Treasury Bills,
Bonds and government securities backed Repurchase transactions. The Fund aims to
enhance returns by investing in a diversified portfolio of corporate debt securities.
Type: Open EndedCurrency: LKR
Investments: Corporate Debt Instruments ISIN: LKNWINU00000
Fund Snapshot 28-Feb-19
YTD Yield
YTD Yield (Annualized)
NAV per unit
AUM (LKR Mn.)
Fund Currency
Fund Inception
Expense Ratio
Average Maturity (Yrs)
Average Duration
2.23%
13.82%
12.7288
292.45
LKR
1-Dec-97
1.34%
1.96
1.40
DisclaimerPast performance is not a guide to future performance. The value of any investment and the income from it can fall as a result of market and currency fluctuations and investors could get back less than the amount originally invested. This report does not constitute a financial promotion, a recommendation or an offer to sell or a solicitation to buy units in the fund. See Information Memorandum for important information.
Fund Overview
Portfolio Allocation By Credit Rating
AA- [F]24%
BB+ [F]18%
A [I]23%
BBB+ [F]16%
BBB+ [F]19%
F
I
G
FITCH
ICRA
GOSL
-
-
-
Maturity Profile
Under 1 Month
6 Months - 1 Year
1 Year - 5 Years
Over 5 Years
Maturity
15.32%
46.68%
20.37%
17.63%
% Holding
14.78%
11.10%
13.20%
12.00%
AVG YTM(Net)
Daily ValuationAll Instruments are marked to market.
Any TimeA notice period of 07 working days may be required prior to large redemptions.However, the time period can be discussed with potential investors prior to the investment.
Management Fee : 1.00% p.a. of NAV.Trustee fee : 0.10 - 0.19% p.a. of NAV, based on fund size.Custodian fee : 0.05% p.a.of NAV.
Valuation
Other Features
Investment/Withdrawal
Fee Details
Maximum exposure restrictions on investments depend on the features of each security, (Ex: Rated, Guaranteed, etc), and are regulated by the Trustee and the SEC.
Exposure Restrictions
NDB Wealth Management Ltd.Fund Manager
Bank of CeylonTrustee & Custodian
Historical Returns
Reflects the equivalent return from a similar investment prior to deducting WHT of 5%
Year to Date
Last month
Last 3 months
Last 6 months
Last 12 months
Year 2018
Year 2017
2.23%
0.99%
3.43%
4.15%
10.32%
10.00%
14.34%
14.55%
13.55%
14.63%
8.80%
10.87%
10.52%
15.10%
Period Fund Returns
13.82%
12.87%
13.90%
8.36%
10.32%
10.00%
14.34%
Annualized Return Equivalent Gross Return (Annualized)
NDB Wealth Income Plus Fund
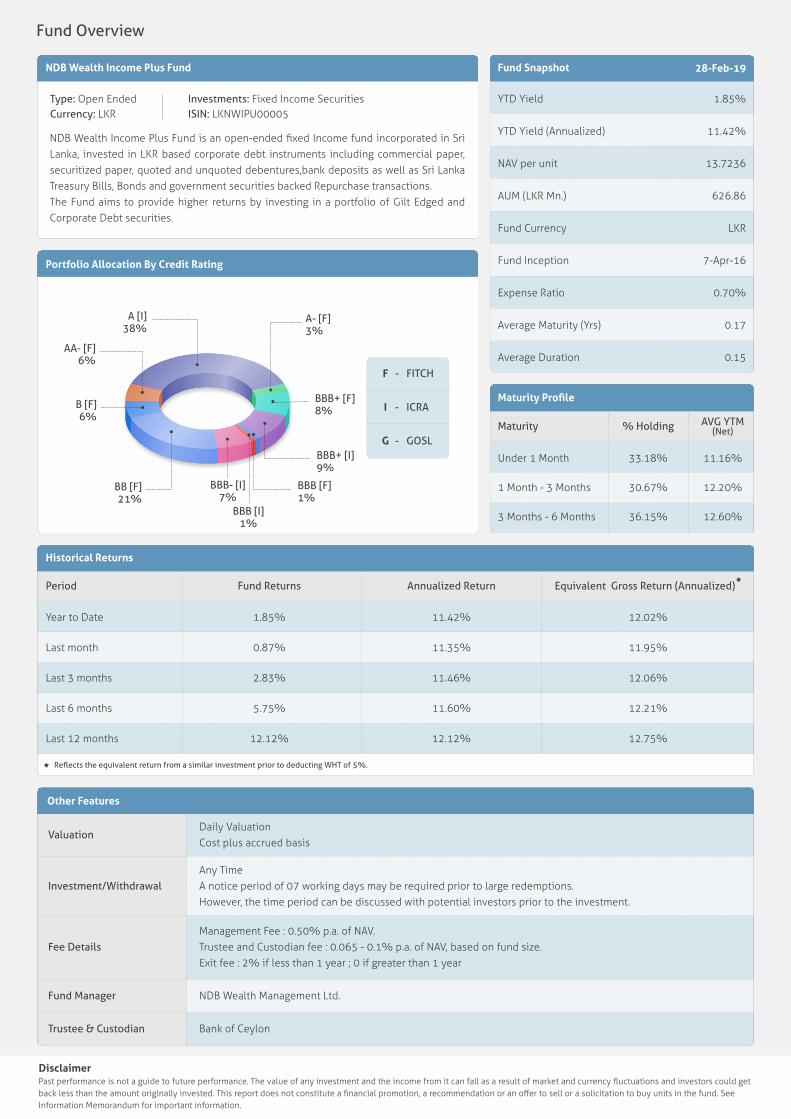
NDB Wealth Income Plus Fund is an open-ended fixed Income fund incorporated in Sri Lanka, invested in LKR based corporate debt instruments including commercial paper, securitized paper, quoted and unquoted debentures,bank deposits as well as Sri Lanka Treasury Bills, Bonds and government securities backed Repurchase transactions. The Fund aims to provide higher returns by investing in a portfolio of Gilt Edged and Corporate Debt securities.
Type: Open EndedCurrency: LKR
Investments: Fixed Income Securities ISIN: LKNWIPU00005
Fund Snapshot 28-Feb-19
YTD Yield
YTD Yield (Annualized)
NAV per unit
AUM (LKR Mn.)
Fund Currency
Fund Inception
Expense Ratio
Average Maturity (Yrs)
Average Duration
1.85%
11.42%
13.7236
626.86
LKR
7-Apr-16
0.70%
0.17
0.15
Maturity Profile
Under 1 Month
1 Month - 3 Months
3 Months - 6 Months
Maturity
33.18%
30.67%
36.15%
% Holding
11.16%
12.20%
12.60%
AVG YTM(Net)
Daily ValuationCost plus accrued basis
Any TimeA notice period of 07 working days may be required prior to large redemptions.However, the time period can be discussed with potential investors prior to the investment.
Management Fee : 0.50% p.a. of NAV.Trustee and Custodian fee : 0.065 - 0.1% p.a. of NAV, based on fund size.Exit fee : 2% if less than 1 year ; 0 if greater than 1 year
Valuation
Other Features
Investment/Withdrawal
Fee Details
NDB Wealth Management Ltd.Fund Manager
Bank of CeylonTrustee & Custodian
DisclaimerPast performance is not a guide to future performance. The value of any investment and the income from it can fall as a result of market and currency fluctuations and investors could get back less than the amount originally invested. This report does not constitute a financial promotion, a recommendation or an offer to sell or a solicitation to buy units in the fund. See Information Memorandum for important information.
Fund Overview
Portfolio Allocation By Credit Rating
BBB [I]1%
BBB- [I]7%
A [I]38%
BBB+ [F]8%
BBB+ [I]9%
BBB [F]1%
BB [F]21%
AA- [F]6%
B [F]6%
A- [F]3%
F
I
G
FITCH
ICRA
GOSL
-
-
-
Historical Returns
Year to Date
Last month
Last 3 months
Last 6 months
Last 12 months
1.85%
0.87%
2.83%
5.75%
12.12%
12.02%
11.95%
12.06%
12.21%
12.75%
Period Fund Returns
11.42%
11.35%
11.46%
11.60%
12.12%
Annualized Return
Reflects the equivalent return from a similar investment prior to deducting WHT of 5%.
Equivalent Gross Return (Annualized)
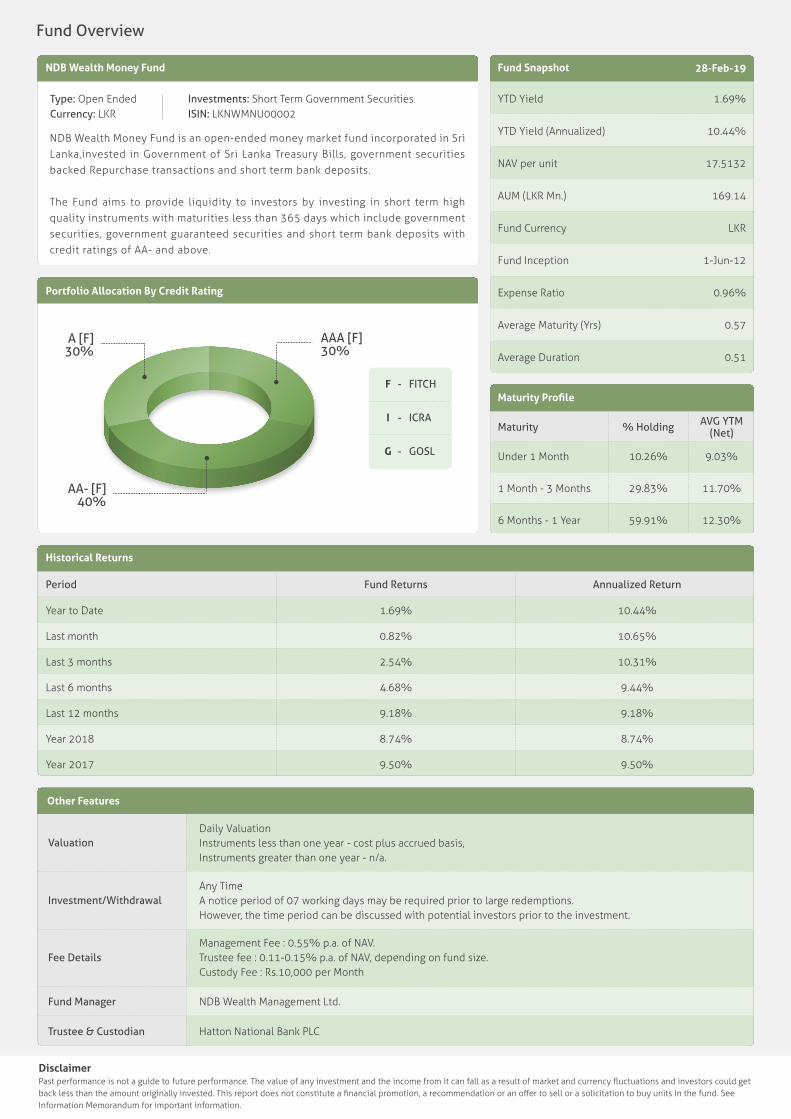
NDB Wealth Money Fund
NDB Wealth Money Fund is an open-ended money market fund incorporated in Sri Lanka,invested in Government of Sri Lanka Treasury Bills, government securities backed Repurchase transactions and short term bank deposits. The Fund aims to provide liquidity to investors by investing in short term high quality instruments with maturities less than 365 days which include government securities, government guaranteed securities and short term bank deposits with credit ratings of AA- and above.
Type: Open EndedCurrency: LKR
Investments: Short Term Government Securities ISIN: LKNWMNU00002
Fund Snapshot 28-Feb-19
YTD Yield
YTD Yield (Annualized)
NAV per unit
AUM (LKR Mn.)
Fund Currency
Fund Inception
Expense Ratio
Average Maturity (Yrs)
Average Duration
1.69%
10.44%
17.5132
169.14
LKR
1-Jun-12
0.96%
0.57
0.51
Maturity Profile
Under 1 Month
1 Month - 3 Months
6 Months - 1 Year
Maturity
10.26%
29.83%
59.91%
% Holding
9.03%
11.70%
12.30%
AVG YTM(Net)
Daily ValuationInstruments less than one year - cost plus accrued basis,Instruments greater than one year - n/a.
Any TimeA notice period of 07 working days may be required prior to large redemptions.However, the time period can be discussed with potential investors prior to the investment.
Management Fee : 0.55% p.a. of NAV.Trustee fee : 0.11-0.15% p.a. of NAV, depending on fund size.Custody Fee : Rs.10,000 per Month
Valuation
Other Features
Investment/Withdrawal
Fee Details
NDB Wealth Management Ltd.Fund Manager
Hatton National Bank PLCTrustee & Custodian
DisclaimerPast performance is not a guide to future performance. The value of any investment and the income from it can fall as a result of market and currency fluctuations and investors could get back less than the amount originally invested. This report does not constitute a financial promotion, a recommendation or an offer to sell or a solicitation to buy units in the fund. See Information Memorandum for important information.
Fund Overview
Portfolio Allocation By Credit Rating
A [F]30%
AA- [F]40%
AAA [F]30%
F
I
G
FITCH
ICRA
GOSL
-
-
-
Historical Returns
Year to Date
Last month
Last 3 months
Last 6 months
Last 12 months
Year 2018
Year 2017
1.69%
0.82%
2.54%
4.68%
9.18%
8.74%
9.50%
Period Fund Returns
10.44%
10.65%
10.31%
9.44%
9.18%
8.74%
9.50%
Annualized Return
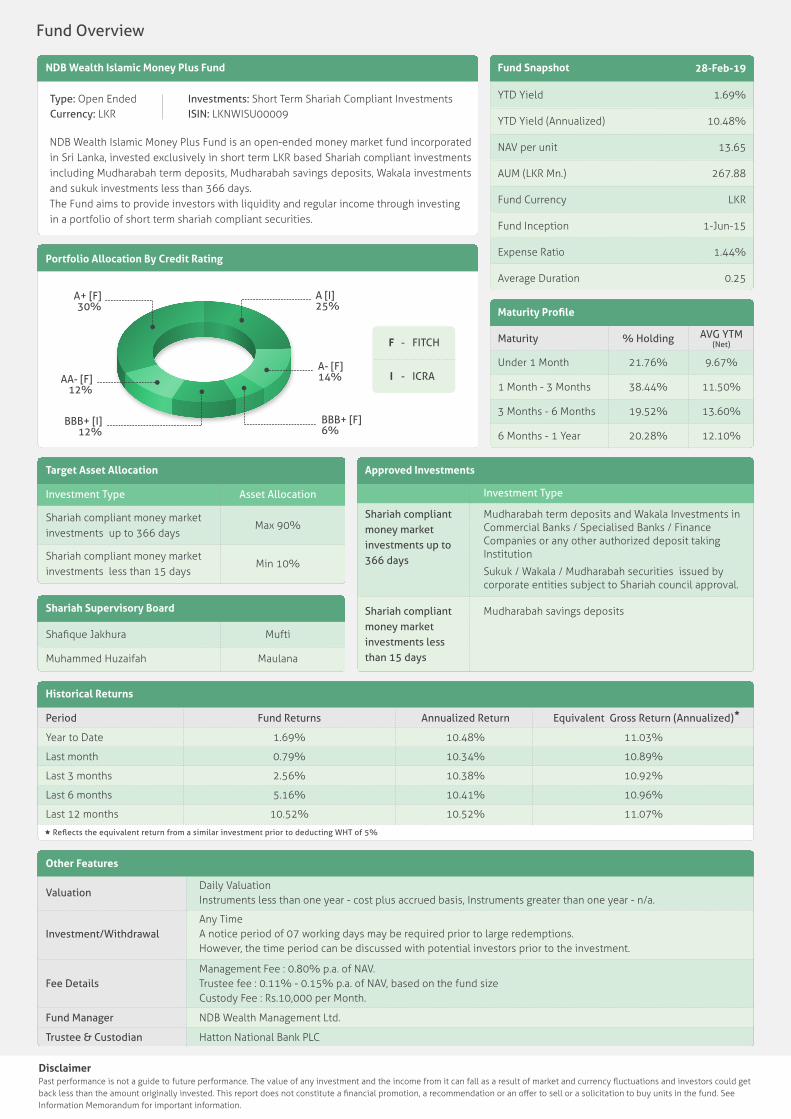
NDB Wealth Islamic Money Plus Fund
NDB Wealth Islamic Money Plus Fund is an open-ended money market fund incorporated in Sri Lanka, invested exclusively in short term LKR based Shariah compliant investments including Mudharabah term deposits, Mudharabah savings deposits, Wakala investments and sukuk investments less than 366 days.The Fund aims to provide investors with liquidity and regular income through investing in a portfolio of short term shariah compliant securities.
Type: Open EndedCurrency: LKR
Investments: Short Term Shariah Compliant InvestmentsISIN: LKNWISU00009
Fund Snapshot 28-Feb-19
YTD Yield
YTD Yield (Annualized)
NAV per unit
AUM (LKR Mn.)
Fund Currency
Fund Inception
Expense Ratio
Average Duration
1.69%
10.48%
13.65
267.88
LKR
1-Jun-15
1.44%
0.25
Maturity Profile
Under 1 Month
1 Month - 3 Months
3 Months - 6 Months
6 Months - 1 Year
Maturity
21.76%
38.44%
19.52%
20.28%
% Holding
9.67%
11.50%
13.60%
12.10%
AVG YTM(Net)
Historical Returns
Reflects the equivalent return from a similar investment prior to deducting WHT of 5%
Year to Date
Last month
Last 3 months
Last 6 months
Last 12 months
1.69%
0.79%
2.56%
5.16%
10.52%
10.48%
10.34%
10.38%
10.41%
10.52%
11.03%
10.89%
10.92%
10.96%
11.07%
Period Fund Returns Annualized Return Equivalent Gross Return (Annualized)
Target Asset Allocation
Shariah compliant money market investments up to 366 days
Shariah compliant money market investments less than 15 days
Investment Type
Max 90%
Min 10%
Asset Allocation
Approved Investments
Shariah compliant money market investments up to 366 days
Investment Type
Mudharabah term deposits and Wakala Investments in Commercial Banks / Specialised Banks / Finance Companies or any other authorized deposit taking Institution
Shariah compliant money market investments less than 15 days
Mudharabah savings deposits
Sukuk / Wakala / Mudharabah securities issued by corporate entities subject to Shariah council approval.
Shariah Supervisory Board
Shafique Jakhura
Muhammed Huzaifah
Mufti
Maulana
Daily ValuationInstruments less than one year - cost plus accrued basis, Instruments greater than one year - n/a.
Any TimeA notice period of 07 working days may be required prior to large redemptions.However, the time period can be discussed with potential investors prior to the investment.
Management Fee : 0.80% p.a. of NAV.Trustee fee : 0.11% - 0.15% p.a. of NAV, based on the fund sizeCustody Fee : Rs.10,000 per Month.
Valuation
Other Features
Investment/Withdrawal
Fee Details
NDB Wealth Management Ltd.Fund Manager
Hatton National Bank PLCTrustee & Custodian
DisclaimerPast performance is not a guide to future performance. The value of any investment and the income from it can fall as a result of market and currency fluctuations and investors could get back less than the amount originally invested. This report does not constitute a financial promotion, a recommendation or an offer to sell or a solicitation to buy units in the fund. See Information Memorandum for important information.
Portfolio Allocation By Credit Rating
AA- [F]12%
A- [F]14%
A [I]25%
BBB+ [F]6%
BBB+ [I]12%
A+ [F]30%
F
I
FITCH
ICRA
-
-
Fund Overview
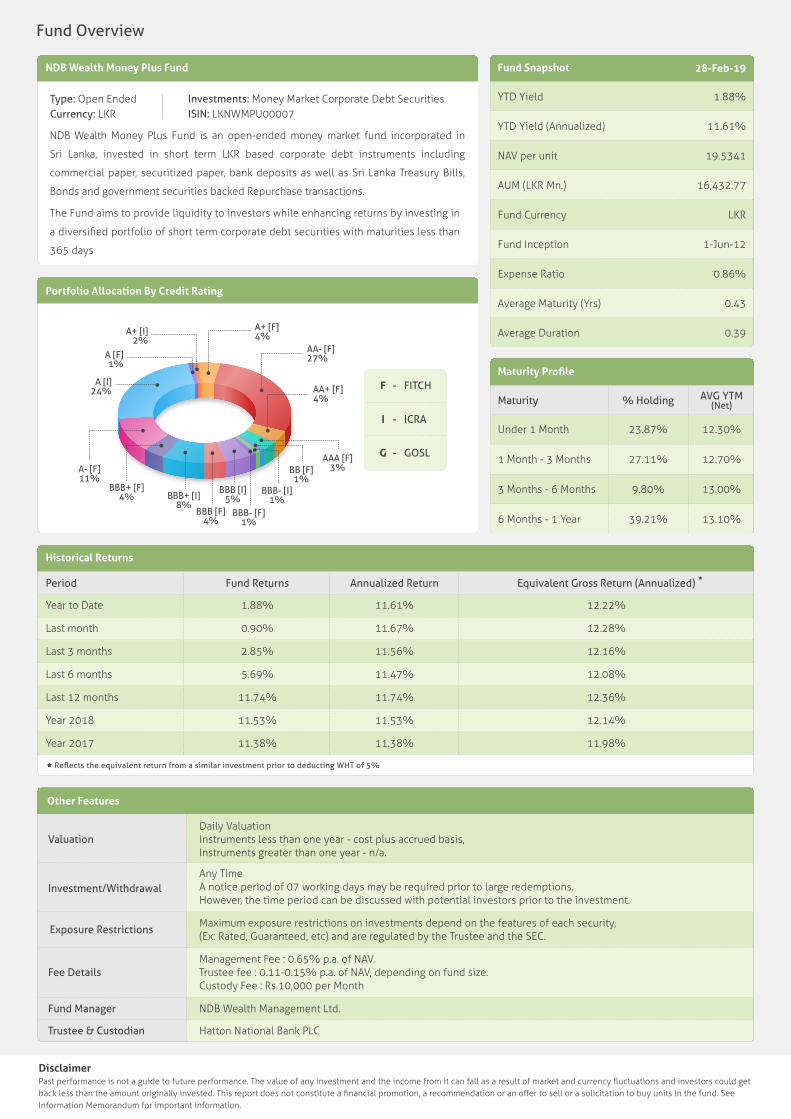
NDB Wealth Money Plus Fund
NDB Wealth Money Plus Fund is an open-ended money market fund incorporated in
Sri Lanka, invested in short term LKR based corporate debt instruments including
commercial paper, securitized paper, bank deposits as well as Sri Lanka Treasury Bills,
Bonds and government securities backed Repurchase transactions.
The Fund aims to provide liquidity to investors while enhancing returns by investing in
a diversified portfolio of short term corporate debt securities with maturities less than
365 days
Type: Open EndedCurrency: LKR
Investments: Money Market Corporate Debt SecuritiesISIN: LKNWMPU00007
Fund Snapshot 28-Feb-19
YTD Yield
YTD Yield (Annualized)
NAV per unit
AUM (LKR Mn.)
Fund Currency
Fund Inception
Expense Ratio
Average Maturity (Yrs)
Average Duration
1.88%
11.61%
19.5341
16,432.77
LKR
1-Jun-12
0.86%
0.43
0.39
Maturity Profile
Under 1 Month
1 Month - 3 Months
3 Months - 6 Months
6 Months - 1 Year
Maturity
23.87%
27.11%
9.80%
39.21%
% Holding
12.30%
12.70%
13.00%
13.10%
AVG YTM(Net)
Daily ValuationInstruments less than one year - cost plus accrued basis,Instruments greater than one year - n/a.
Any TimeA notice period of 07 working days may be required prior to large redemptions.However, the time period can be discussed with potential investors prior to the investment.
Management Fee : 0.65% p.a. of NAV.Trustee fee : 0.11-0.15% p.a. of NAV, depending on fund size.Custody Fee : Rs.10,000 per Month
Valuation
Other Features
Investment/Withdrawal
Fee Details
Maximum exposure restrictions on investments depend on the features of each security,(Ex: Rated, Guaranteed, etc) and are regulated by the Trustee and the SEC.
Exposure Restrictions
NDB Wealth Management Ltd.Fund Manager
Hatton National Bank PLCTrustee & Custodian
DisclaimerPast performance is not a guide to future performance. The value of any investment and the income from it can fall as a result of market and currency fluctuations and investors could get back less than the amount originally invested. This report does not constitute a financial promotion, a recommendation or an offer to sell or a solicitation to buy units in the fund. See Information Memorandum for important information.
Fund Overview
Portfolio Allocation By Credit Rating
A+ [F]4%
AA- [F]27%
AA+ [F]4%
A- [F]11%
BBB+ [F]4%
AAA [F]3%BB [F]
1%BBB- [I]
1%BBB- [F]
1%
BBB [I]5%
BBB [F]4%
BBB+ [I]8%
A+ [I]2%
A [F]1%
A [I]24% F
I
G
FITCH
ICRA
GOSL
-
-
-
Historical Returns
Reflects the equivalent return from a similar investment prior to deducting WHT of 5%
Year to Date
Last month
Last 3 months
Last 6 months
Last 12 months
Year 2018
Year 2017
1.88%
0.90%
2.85%
5.69%
11.74%
11.53%
11.38%
12.22%
12.28%
12.16%
12.08%
12.36%
12.14%
11.98%
Period Fund Returns
11.61%
11.67%
11.56%
11.47%
11.74%
11.53%
11.38%
Annualized Return Equivalent Gross Return (Annualized)
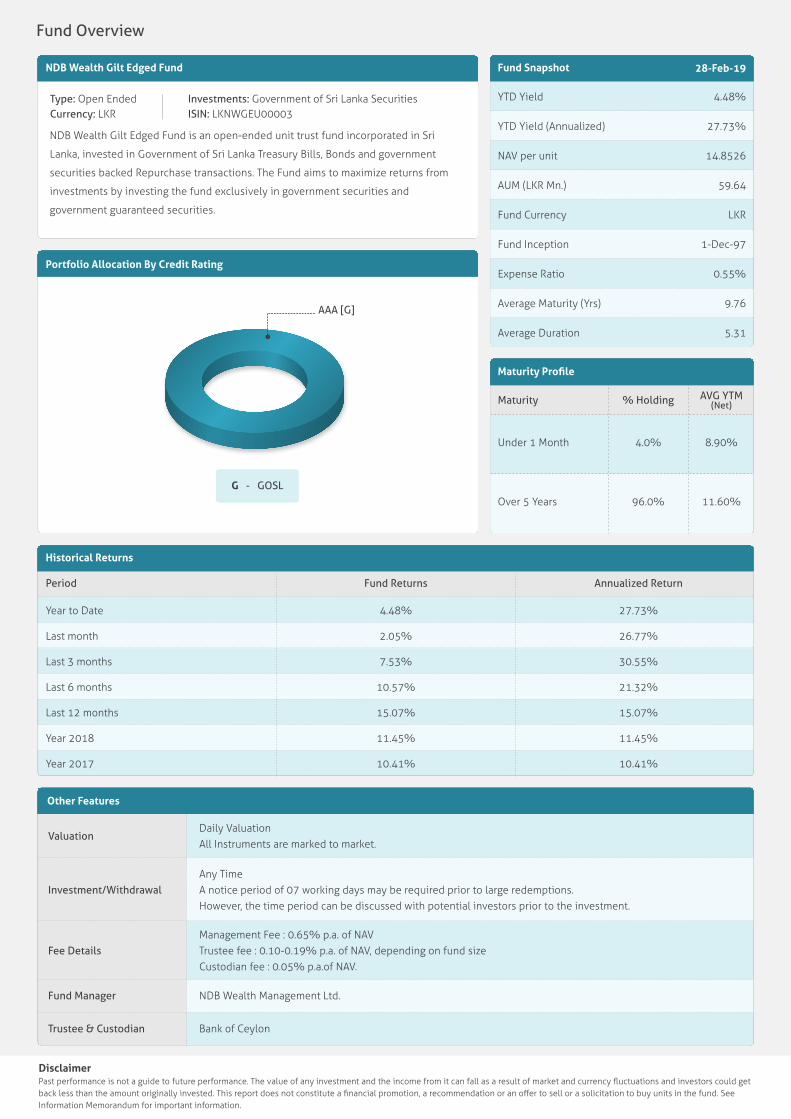
NDB Wealth Gilt Edged Fund
NDB Wealth Gilt Edged Fund is an open-ended unit trust fund incorporated in Sri
Lanka, invested in Government of Sri Lanka Treasury Bills, Bonds and government
securities backed Repurchase transactions. The Fund aims to maximize returns from
investments by investing the fund exclusively in government securities and
government guaranteed securities.
Type: Open EndedCurrency: LKR
Investments: Government of Sri Lanka SecuritiesISIN: LKNWGEU00003
Fund Snapshot 28-Feb-19
YTD Yield
YTD Yield (Annualized)
NAV per unit
AUM (LKR Mn.)
Fund Currency
Fund Inception
Expense Ratio
Average Maturity (Yrs)
Average Duration
4.48%
27.73%
14.8526
59.64
LKR
1-Dec-97
0.55%
9.76
5.31
Maturity Profile
Under 1 Month
Over 5 Years
Maturity
4.0%
96.0%
% Holding
8.90%
11.60%
AVG YTM(Net)
Daily ValuationAll Instruments are marked to market.
Any TimeA notice period of 07 working days may be required prior to large redemptions. However, the time period can be discussed with potential investors prior to the investment.
Management Fee : 0.65% p.a. of NAVTrustee fee : 0.10-0.19% p.a. of NAV, depending on fund sizeCustodian fee : 0.05% p.a.of NAV.
Valuation
Other Features
Investment/Withdrawal
Fee Details
NDB Wealth Management Ltd.Fund Manager
Bank of CeylonTrustee & Custodian
DisclaimerPast performance is not a guide to future performance. The value of any investment and the income from it can fall as a result of market and currency fluctuations and investors could get back less than the amount originally invested. This report does not constitute a financial promotion, a recommendation or an offer to sell or a solicitation to buy units in the fund. See Information Memorandum for important information.
Fund Overview
Portfolio Allocation By Credit Rating
AAA [G]
G - GOSL
Historical Returns
Year to Date
Last month
Last 3 months
Last 6 months
Last 12 months
Year 2018
Year 2017
4.48%
2.05%
7.53%
10.57%
15.07%
11.45%
10.41%
Period Fund Returns
27.73%
26.77%
30.55%
21.32%
15.07%
11.45%
10.41%
Annualized Return

This document is compiled by NDB Wealth Management Limited (NDBWealth) for the use of its clients, and should not be construed as an offer or solicitation of an offer
to buy/sell any securities or assets. This document is for the personal information of the authorized recipient and is not for public distribution. This should not be
reproduced or redistributed to any other person or in any form. All information has been compiled using information from news sources, available documentation and
NDBWealth’s own research material and relates to current and historical information, but do not guarantee its accuracy or completeness. In compiling this report,
NDBWealth has made every endeavour to ensure its accuracy, but cannot hold NDBWealth or its employees for any error that maybe found herein. Neither NDBWealth
nor its employees can accept responsibility for any loss or damage caused due to any decisional action made by the investors based on such information or any options,
conclusions or recommendations herein whether that loss or damage is caused by any fault or negligence on the part of NDBWealth.
NDB WEALTH MANAGEMENT LTDNDB Capital Building, Level G, No: 135, Bauddhaloka Mawatha, Colombo 4, Sri Lanka
Tel ( +94 ) 77 744 8888 | ( +94 ) 11 230 3232
E-mail : [email protected] | Web : www.ndbwealth.com
DISCLAIMER


![LZHU LPb SURfeVVLRaOV WhaW eaPLeV cRPPR aPSXWaWLRQV … · 2021. 7. 1. · UeYaVcXOaUL]aWLR UeVWRUeV aUWeULaO bRRd fRZ WR Whe ORZeU e[WUePLW\. CRS\ULgh JdL GRRWNL 2020 15 TheUaSeXWLc](https://img.pdfslide.us/doc/110x75/6146d350f4263007b1356d42/lzhu-lpb-surfevvlraov-whaw-eaplev-crppr-apsxwawlrqv-2021-7-1-ueyavcxoaulawlr.jpg)