Embed Size (px)
Citation preview

Market Technical Analysis REPORT
using Integrated Pitchfork Analysis
by Dr Mircea Dologa, MD, CTA
MORNING of May 14th – 2007
The traders must progressively monitor the conditions of the market movements that validate or invalidate the recommended forecasts. The market forecasts of this study have a very high probability, but they might not be exact. An astute trader, always trades the market behaviour, not only the forecasts. Go with the market, let it be your guide and never impose anything on its behaviour.
Our research strongly suggests a “top-down” market analysis rather than other procedure. In our opinion, the performed studies with Cash Index data are more illustrative than those with Futures Index data. However, due to our Futures trading preference, we will use every time, the best available data and the most adequate, for that specific traded vehicle.
1. Dow Jones Industrial Average Cash Index – DJIA
Monthly Chart – As the traders use to say “the Dow is the maker of the World Markets”. I couldn’t more agree with it, due to indice’s ubiquitous influence. The market flow is continuing its healthy up-sloping trend. The last bar’s close was exactly on the upper 12.5% Fibonacci line, a Gann ratio. The fast trespassing of the median line of the major pitchfork, highly suggests an up-move continuation.
Copyright 2007 by www.pitchforktrader.com ALL RIGHTS RESERVED

Copyright 2007 by www.pitchforktrader.com ALL RIGHTS RESERVED
2 Weekly Chart – W. D. Gann always said that the weekly chart, especially the 2-week swing chart, is the best indicator of the trend. With the straight 6 green bars, in a row, the market flow confirms its strength. The Fibonacci Momentum count forecasts a probable momentum reversal when the total number of bars is one of the Fibonacci numbers: 5, 8, 13,etc.
Daily Chart – The up-sloping trend is cruising vigorously towards the upper-median line of the major pitchfork. It will probably enter the confluence zone (U-MLH & wl-01) at 13426-30 level. The minor pitchfork has the merit to perfectly describe the local market flow and assists the trader to identify one of the possible confluence zones, which will pinpoint a reversal, or on the contrary, an acceleration of the trend. The set of the three emas (C) efficiently reveals the weekly’s up-sloping trend, in spite of Thursday’s (05/10/07) anguishing event (see huge red bar). If you are not already in, it would be wise to wait, at least, for the breakout of Thursday‘s high at 13360 level. The more conservative traders, will wait until the breakout of the highest high at 13369 level.

Copyright 2007 by www.pitchforktrader.com ALL RIGHTS RESERVED
3 240min Chart – The ascending channel already helped the market to reach the common value of wave 3 (W3=1.618*W1) at 13351 level. It is very probable that the market flow will breakout the highest high at 13369 level, thus extending the wave 3 to farther targets. The up sloping continuation of the market flow will force the RSI to perform the following behavioural steps: the penetration into the under-overbought zone (60%-80%), the breakout of TL-01 and TL-02, and finally the trespassing into the overbought zone, above 80% level. Every step of this development can be associated with an Add-On procedure (scale-in) coupled with an adequate stop loss.
120min Chart – The Elliott Wave channels efficiently show the up-sloping pathway of the contextual market. The next probable W3 target will be at the 13384 level where W3=2.00*W1. If this level is exceeded, the trader should expect that the W3 extension might jump progressively to 13602, 13669 or 13736 levels, corresponding to the 2.382, 2.50 and 2.618 Fibonacci ratio extension levels (not shown on the chart).
Copyright 2007 by www.pitchforktrader.com ALL RIGHTS RESERVED
4
2. S&P 500 Cash Index
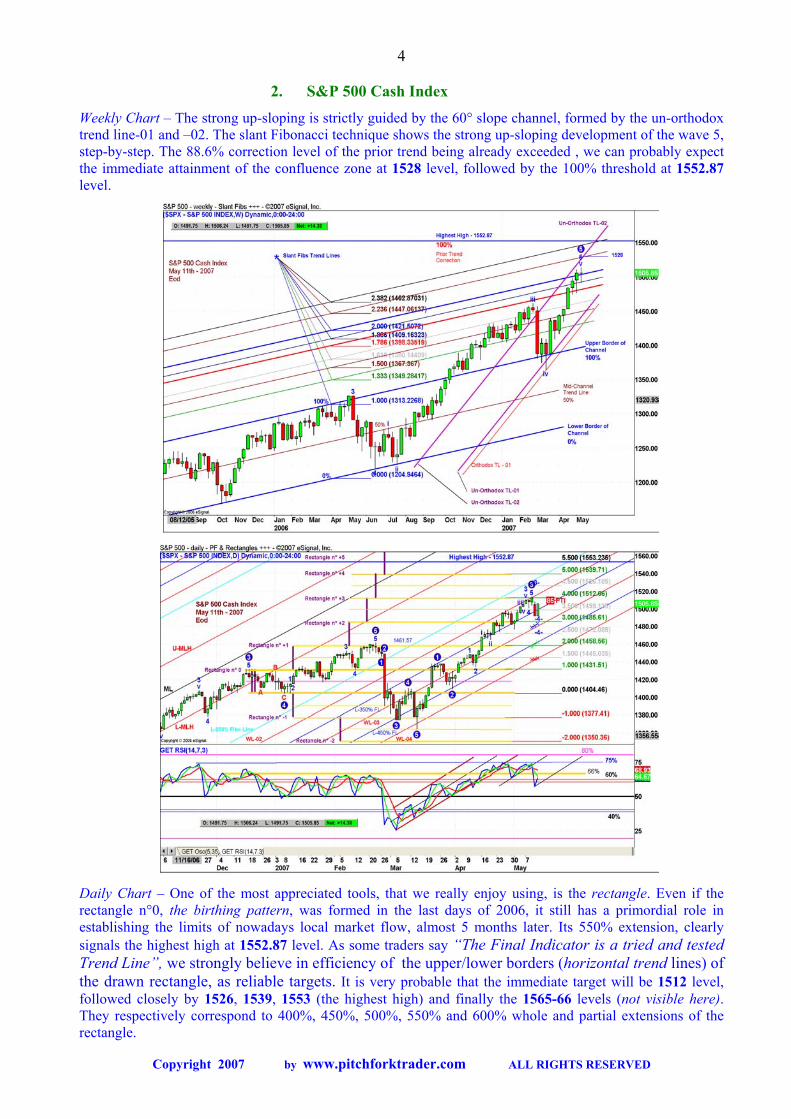
Weekly Chart – The strong up-sloping is strictly guided by the 60° slope channel, formed by the un-orthodox trend line-01 and –02. The slant Fibonacci technique shows the strong up-sloping development of the wave 5, step-by-step. The 88.6% correction level of the prior trend being already exceeded , we can probably expect the immediate attainment of the confluence zone at 1528 level, followed by the 100% threshold at 1552.87 level.
Daily Chart – One of the most appreciated tools, that we really enjoy using, is the rectangle. Even if the rectangle n°0, the birthing pattern, was formed in the last days of 2006, it still has a primordial role in establishing the limits of nowadays local market flow, almost 5 months later. Its 550% extension, clearly signals the highest high at 1552.87 level. As some traders say “The Final Indicator is a tried and tested Trend Line”, we strongly believe in efficiency of the upper/lower borders (horizontal trend lines) of the drawn rectangle, as reliable targets. It is very probable that the immediate target will be 1512 level, followed closely by 1526, 1539, 1553 (the highest high) and finally the 1565-66 levels (not visible here). They respectively correspond to 400%, 450%, 500%, 550% and 600% whole and partial extensions of the rectangle.

Copyright 2007 by www.pitchforktrader.com ALL RIGHTS RESERVED
5
3. Russell 2000 e-mini Futures
Daily Chart – The up-sloping trend mimics the tendency of the other US markets. The market flow is on its way to the upper-median line. However, before attaining this level it must deal with the confluence zone at 837 level where the upper 50% Fibs lines intersect with the resistance of the highest high level.
120min Chart – As we mentioned in our last week report, the pile-up of ATR(14) bars gave us the 840.80 level (see March 7th – 2007 Report in Archives). If the trader would have been satisfied with exercising only a break-even stop loss, without any trails, the trade would have been profitable, with an exit at 840.80 level. A close observation of the above chart shows that the choice of the pivots was efficient because the up-sloping pitchfork optimally describes the market flow. This edge gave the trader the chance of re-entering the market in a long trade (trading with the trend) when the price tested the L-MLH. The following ascending double bottom signalled not only the high probability of a long trade, but gave the trader a golden opportunity to add contracts (scale-in or add-on), thus increasing the trade’s potential.

Copyright 2007 by www.pitchforktrader.com ALL RIGHTS RESERVED
6
4. Euro/Usd Futures - Major Currency Daily Chart – The market flow seems to have already finished W3 correction at 38.2% level. It is very probable that the impact of the two mirror bars at 1.34820 level will catapult the market flow to form the W5. The first Futures price-target will probably be the 1.37150 level. The strong up-sloping momentum could bring the Eur/Usd currency to 1.3672 level.
5. FTSE 100 Cash Index
120min Chart – In spite of the 2-4 base line piercing, the market flow could not terminate the ongoing impulsive pattern. As long as this trend line is not violated the W5 did not commence yet, and the W4 is still in progress. The market price found support exactly at the 6448 level, corresponding to the 27.20% correction level of the wave W3. On the Futures FTSE 100 chart, the first target would be 6723, followed by 6903 level.

Copyright 2007 by www.pitchforktrader.com ALL RIGHTS RESERVED
7
6. German Dax 30 Futures Index Weekly Chart – The up-sloping market flow finally reached the 100% limit at 7577 level where wave C is equal to wave A. The classic size of a wave C within a zigzag pattern is usually equal to 2.618 of wave A. Nevertheless it certainly represents a key level for the market flow in the process of developing the up-sloping pattern. As we have mentioned, in our last week report, this week’s 8th momentum bar could halt the eight-green-bar-in-a-row irreproachable movement (8 being a Fibonacci number). And… it did! The most probable immediate target would be the 7667 level (wave C=1.5 of wave B). Then, if the market will conserve its strong momentum, it could reach the first Fibonacci ratio level at 7736 level where wave C is equal to 1.146 of wave A. We certainly can’t certify the size of the future market momentum, but the close of week’s last bar being in its upper 20%, corroborates this scenario.
Daily Chart – This daily chart efficiently illustrates the intricacy of the major and minor pitchforks in their process of optimally describing the contextual and also the local market flows. The high steam momentum breakout of the un-orthodox trend line (TL) certainly suggests a strong momentum that could break-up the 7578 highest high level.

Copyright 2007 by www.pitchforktrader.com ALL RIGHTS RESERVED
8 120min Chart – The imminent reversal, mentioned last week (please see May 7th – 2007 Report in Archives) really took place, at the end of the last wave of the diagonal triangle (wave e). The wave e formed an over-throw pattern and ended at the 7578 level. The nearness of the ML influenced the local market and formed a 7 narrow bar ascending pattern. A market drop suddenly followed, all the way down to the support of the wave d of the diagonal triangle at the 7373 level. The approximate 60% down-oriented tail of the big red bar splendidly revealed that the bears lost the battle, and that the market would reverse, in spite of the huge piercing reaching the 7333 level. We should mention that the reversal was induced by the strong confluence of the lower 150% Fibonacci line and the 7373 support trend line.
60min Chart – The beauty of trading rectangles is obvious on the above chart. After the reversal of 05/11/07, the market price stumbled almost on every level of the pattern 0%, 50%, 150% and 200%. The latter level promptly halted the up-sloping swing. But the RSI’s ascending pitchfork, cruising the overbought zone (> 80% zone) signalled that there is more to come…

Copyright 2007 by www.pitchforktrader.com ALL RIGHTS RESERVED
9 5min Chart – This low time frame chart is frequently used for entries & exits. The synergy between the pitchfork on RSI, with the chart’s Gann angles and floor pivots really pinpoints the profitable trade decisions.
Multiple Time Frame Floor Pivots TABLE - These key levels are calculated ahead of the market opening, and they really place the trader farther away from the crowd. It not only illustrates the key levels but also the probable trading range for the incoming day, which usually fluctuates between the S2 and R2.