Embed Size (px)
Citation preview
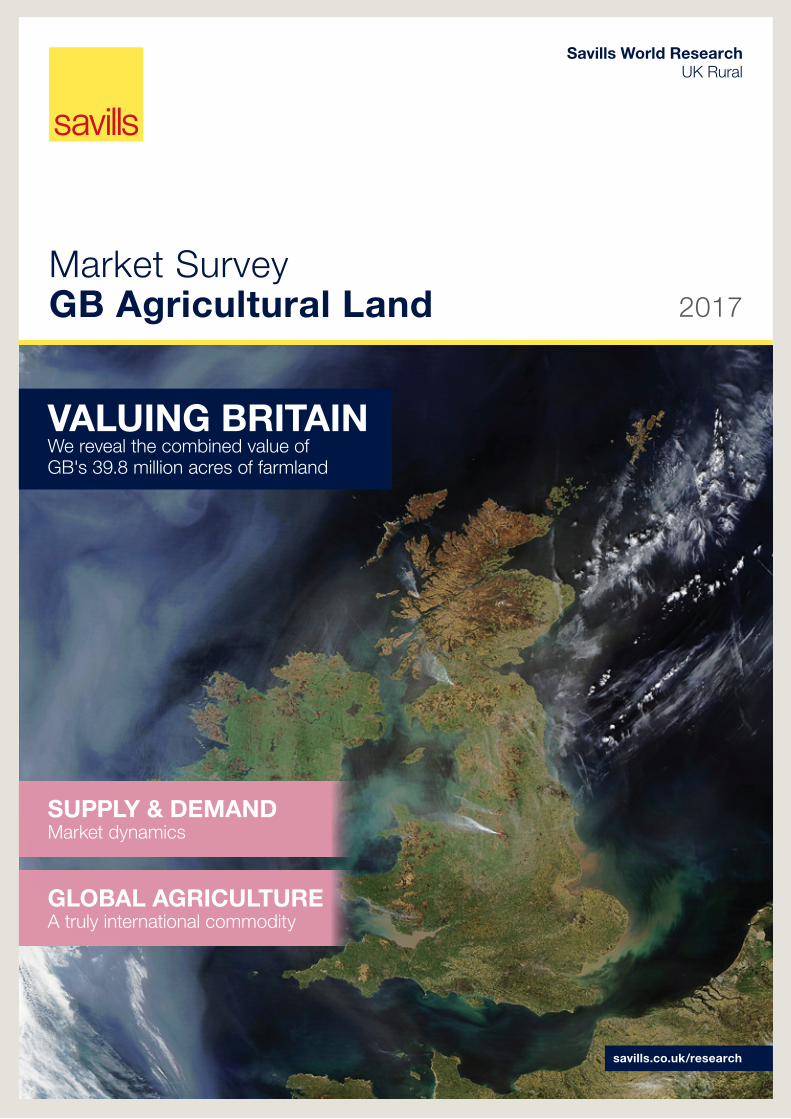
Market SurveyGB Agricultural Land 2017
Savills World Research UK Rural
VALUING BRITAINWe reveal the combined value of GB's 39.8 million acres of farmland
savills.co.uk/research
SUPPLY & DEMANDMarket dynamics
GLoBAL AGRIcULTUREA truly international commodity
GB farmland is a valuable commodity, so much so that its combined worth in 2016, all 39.8 million acres of it, has been valued at £185.7 billion. But what does the future hold?
ForewordThE VALUE of GB fARMLAND
D espite the extraordinary political developments of the last 12 months and speculation about
the economic consequences, last year much of the farmland market in Great Britain proved incredibly resilient and performed well.
Just over 180,000 acres of farmland were publicly marketed across GB during the year. This acreage, despite the uncertainty prior to the EU Referendum, was very similar to the area advertised in 2015, although market activity was mainly concentrated in the second half of the year – notably in September.
The overall picture, according to the Savills Farmland Value Survey, was of a marginal drop in value year on year (just over 3% in England and GB as a whole), but the results of the sales of a handful of estates each over 1,000 acres, launched in August onwards was very positive – with competitive bidding and guide prices well exceeded.
The supply and demand profile in 2016 changed very little on previous years although there were a few exceptions including:
n the proportion of farmers selling in 2016 was lower than in 2015; with a number of potential factors contributing including a softening in farmland values in the short term, uncertainty surrounding Brexit and the short term prospect of an increase in subsidy as a result of the weak pound.
n a higher proportion of ‘new’ non-farmer (lifestyle) buyers – those who were purchasing farmland for the first time, although existing lifestyle landowners appeared to have been less competitive in 2016.
n an increased use of borrowed money for farm purchases, 30% of all buyers compared with 23% in 2015, suggesting that buyers
Market Survey | GB Agricultural Land
02
may be taking the opportunity to use ‘cheap’ money while base rates are at a historical low.
Our 2017 Agricultural Land Market Survey includes some new research – we have valued farmland Britain. The combined value of GB's 39.8 million acres is £185.7 billion – equivalent to 3% of the total value of GB’s housing stock, which is worth £6.69 trillion.
As an investment the current pressure on average farmland values should be set in context against long term performance. The total value of GB farmland and woodland has increased 149% over the past 10 years.
Looking ahead, we anticipate a continuation of the wide variance in results for the best and poorest, with a flight to quality. Barring any major economic or fiscal changes, we do not anticipate significant price rises or falls in the coming years (5.5% overall growth for the next five years) and a return to sustained, steady growth in the longer term.
In addition to assets in GB, it is increasingly realistic to hold a diverse portfolio within the global agricultural sector, offering farmland investors the opportunity to spread risk and maximise returns – we look at some opportunities on pages 8 and 9. n
“Looking ahead, we anticipate a continuation of the wide variance in results for the best and poorest, with a flight to quality” Savills Research
Alex LawsonDirector020 7409 [email protected]
savills.co.uk/research 03
2017
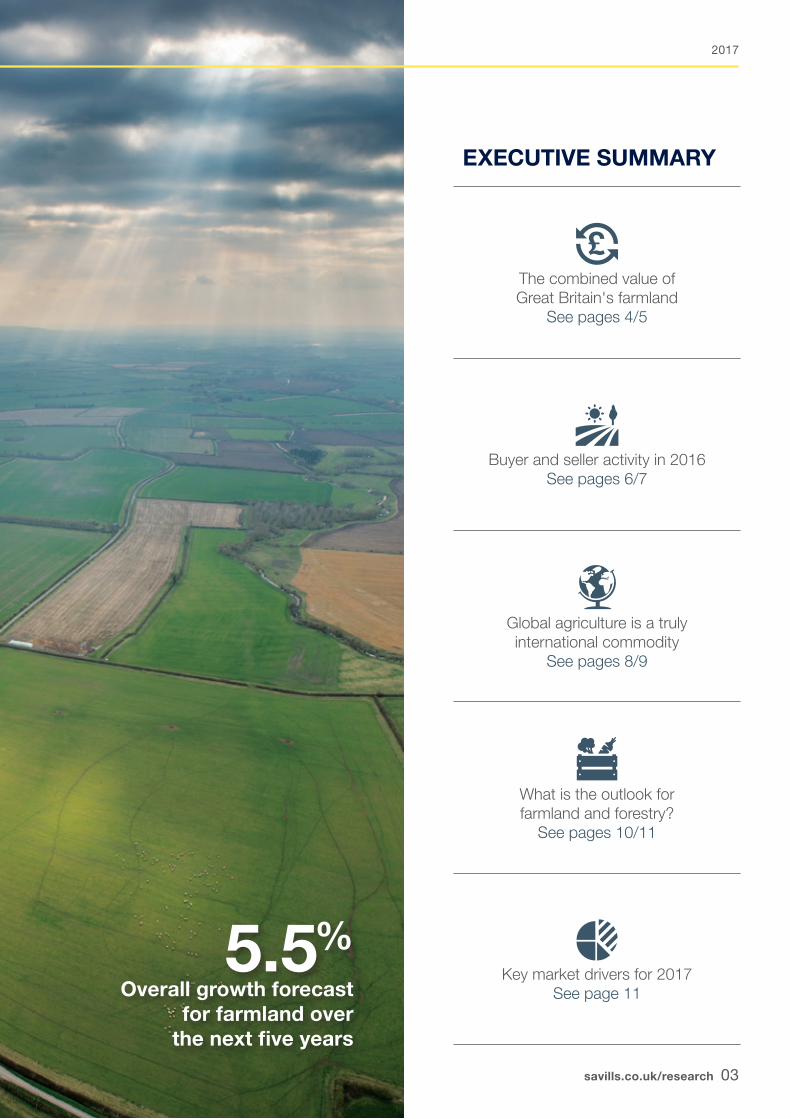
ExEcUTIVE SUMMARY
The combined value of Great Britain's farmland
See pages 4/5
Buyer and seller activity in 2016 See pages 6/7
Global agriculture is a truly international commodity
See pages 8/9
What is the outlook for farmland and forestry?
See pages 10/11
Key market drivers for 2017 See page 11
5.5%Overall growth forecast
for farmland over the next five years
Market Survey | GB Agricultural Land
04
GB FarmlandVALUINGBRITAIN
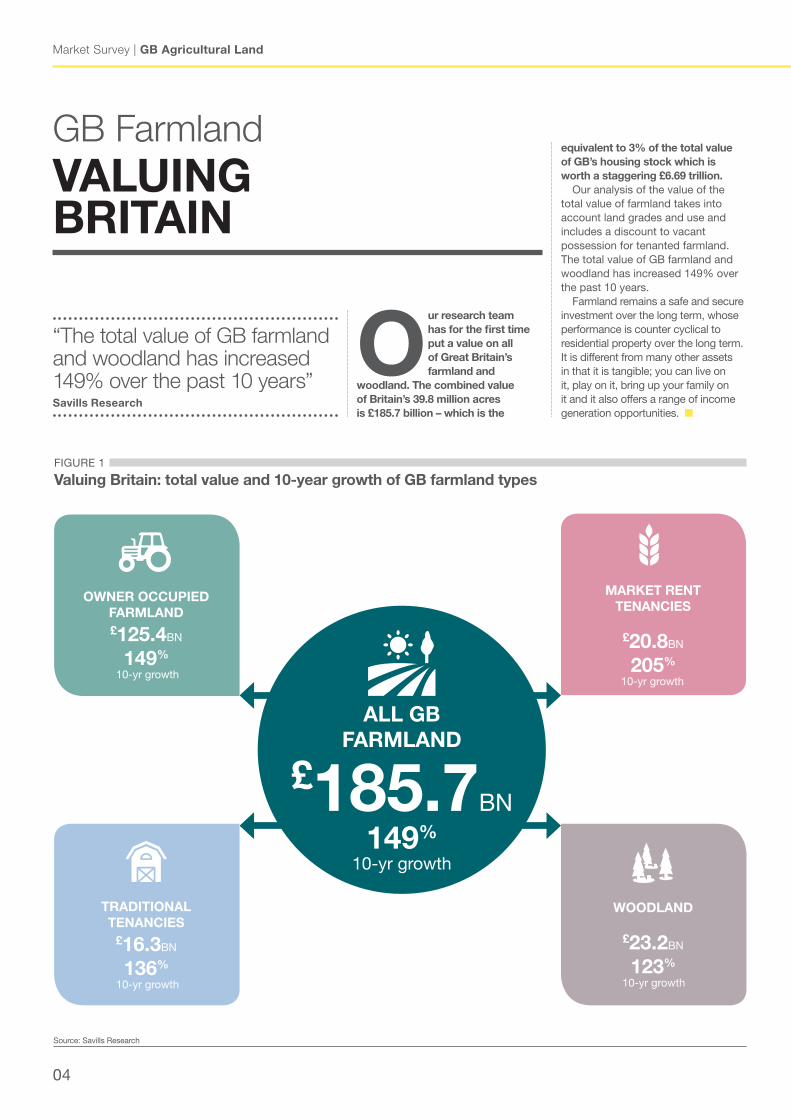
“The total value of GB farmland and woodland has increased 149% over the past 10 years” Savills Research
our research team has for the first time put a value on all of Great Britain’s farmland and
woodland. The combined value of Britain’s 39.8 million acres is £185.7 billion – which is the
equivalent to 3% of the total value of GB’s housing stock which is worth a staggering £6.69 trillion.
Our analysis of the value of the total value of farmland takes into account land grades and use and includes a discount to vacant possession for tenanted farmland. The total value of GB farmland and woodland has increased 149% over the past 10 years.
Farmland remains a safe and secure investment over the long term, whose performance is counter cyclical to residential property over the long term. It is different from many other assets in that it is tangible; you can live on it, play on it, bring up your family on it and it also offers a range of income generation opportunities. n
FIGURE 1
Valuing Britain: total value and 10-year growth of GB farmland types
Source: Savills Research
oWNER occUPIED
fARMLAND £125.4Bn
149% 10-yr growth
TRADITIoNAL TENANcIES
£16.3Bn
136% 10-yr growth
MARkET RENT TENANcIES
£20.8Bn
205%
10-yr growth
WooDLAND
£23.2Bn
123% 10-yr growth
ALL GB fARMLAND
£185.7Bn
149%
10-yr growth
2017
savills.co.uk/research 05
Source: Defra, Scottish & Welsh Governments, natural England (ALC), The Macaulay Land Use Research Institute (LCA) and Savills Research
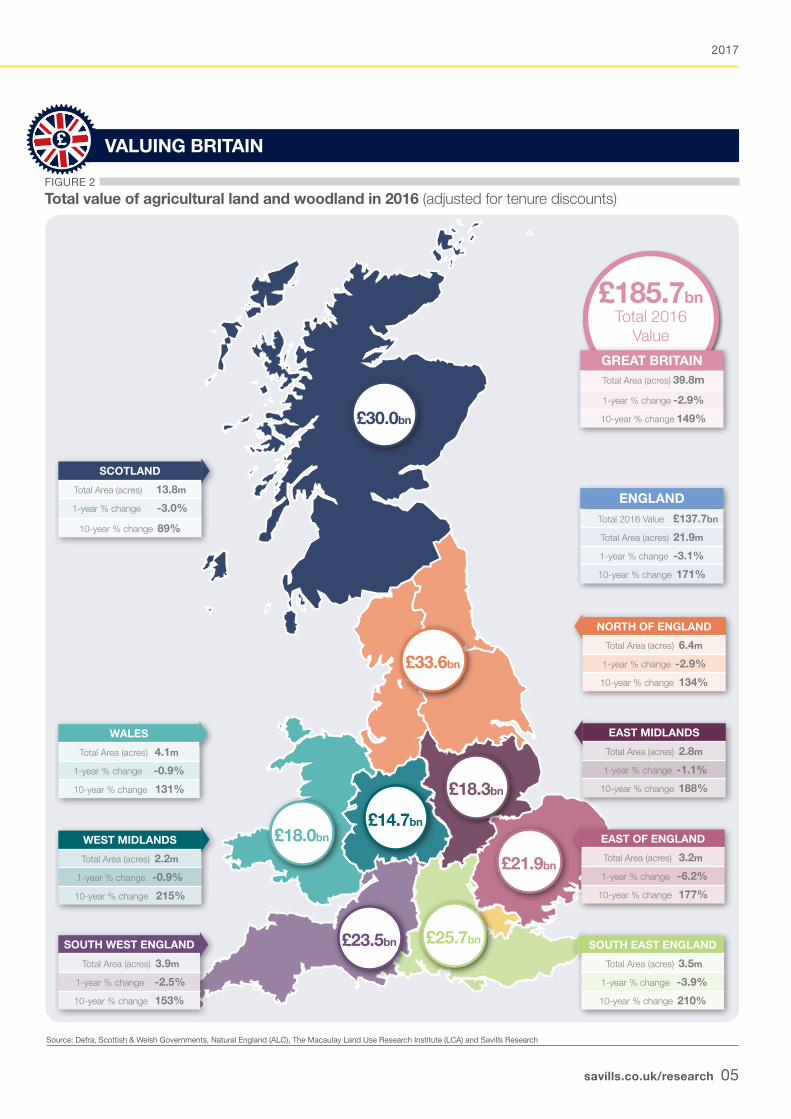
FIGURE 2
Total value of agricultural land and woodland in 2016 (adjusted for tenure discounts)
£185.7bn Total 2016
Value
GREAT BRITAIN Total Area (acres) 39.8m
1-year % change -2.9%
10-year % change 149%£30.0bn
EAST of ENGLAND
Total Area (acres) 3.2m
1-year % change -6.2%
10-year % change 177%
WEST MIDLANDS
Total Area (acres) 2.2m
1-year % change -0.9%
10-year % change 215%
SoUTh EAST ENGLAND
Total Area (acres) 3.5m
1-year % change -3.9%
10-year % change 210%
SoUTh WEST ENGLAND
Total Area (acres) 3.9m
1-year % change -2.5%
10-year % change 153%
WALES
Total Area (acres) 4.1m
1-year % change -0.9%
10-year % change 131%
NoRTh of ENGLAND
Total Area (acres) 6.4m
1-year % change -2.9%
10-year % change 134%
EAST MIDLANDS
Total Area (acres) 2.8m
1-year % change -1.1%
10-year % change 188%
ScoTLAND
Total Area (acres) 13.8m
1-year % change -3.0%
10-year % change 89%
£ VALUING BRITAIN
ENGLAND Total 2016 Value £137.7bn
Total Area (acres) 21.9m
1-year % change -3.1%
10-year % change 171%
£33.6bn
£18.0bn
£14.7bn
£18.3bn
£21.9bn
£25.7bn£23.5bn
Market Survey | GB Agricultural Land
06
Market dynamicsSUPPLY AND DEMAND
Despite market uncertainty, 2016 witnessed a similar set of results to the previous year J
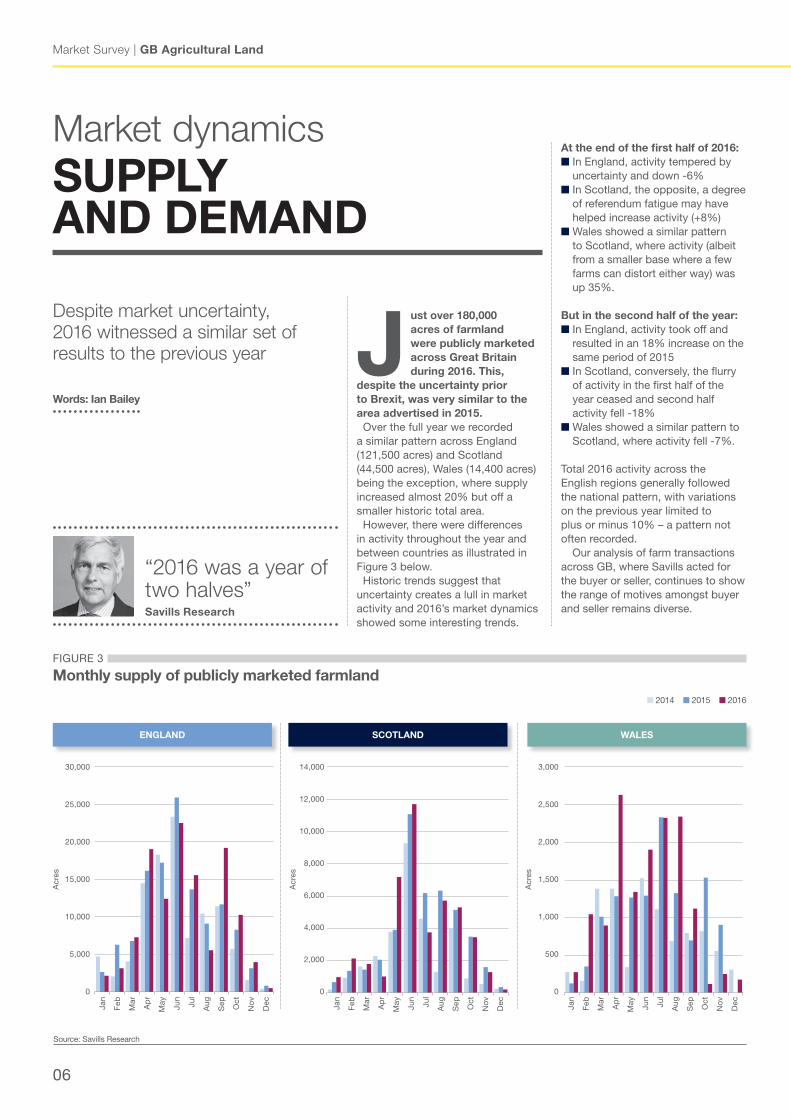
ust over 180,000 acres of farmland were publicly marketed across Great Britain during 2016. This,
despite the uncertainty prior to Brexit, was very similar to the area advertised in 2015. Over the full year we recorded a similar pattern across England (121,500 acres) and Scotland (44,500 acres), Wales (14,400 acres) being the exception, where supply increased almost 20% but off a smaller historic total area. However, there were differences in activity throughout the year and between countries as illustrated in Figure 3 below. Historic trends suggest that uncertainty creates a lull in market activity and 2016’s market dynamics showed some interesting trends.
Words: Ian Bailey
At the end of the first half of 2016:n In England, activity tempered by
uncertainty and down -6%n In Scotland, the opposite, a degree
of referendum fatigue may have helped increase activity (+8%)
n Wales showed a similar pattern to Scotland, where activity (albeit from a smaller base where a few farms can distort either way) was up 35%.
But in the second half of the year:n In England, activity took off and
resulted in an 18% increase on the same period of 2015
n In Scotland, conversely, the flurry of activity in the first half of the year ceased and second half activity fell -18%
n Wales showed a similar pattern to Scotland, where activity fell -7%.
Total 2016 activity across the English regions generally followed the national pattern, with variations on the previous year limited to plus or minus 10% – a pattern not often recorded.
Our analysis of farm transactions across GB, where Savills acted for the buyer or seller, continues to show the range of motives amongst buyer and seller remains diverse.
FIGURE 3
Monthly supply of publicly marketed farmland
Source: Savills Research
30,000
25,000
20,000
15,000
10,000
5,000
0
Acr
es
Jan
Feb
Mar
Ap
r
May
Jun
Jul
Aug
Sep Oct
no
v
Dec
14,000
12,000
10,000
8,000
6,000
4,000
2,000
0
Acr
es
Jan
Feb
Mar
Ap
r
May
Jun
Jul
Aug
Sep Oct
no
v
Dec
3,000
2,500
2,000
1,500
1,000
500
0
Acr
es
Jan
Feb
Mar
Ap
r
May
Jun
Jul
Aug
Sep Oct
no
v
Dec
ENGLAND ScoTLAND WALES
n 2014 n 2015 n 2016
“2016 was a year of two halves” Savills Research
2017
savills.co.uk/research 07
Buyers2016 recorded no significant change on previous years in terms of buyer profile with the exception of a higher proportion of ‘new’ non-farmer (lifestyle) buyers – those who are purchasing farmland for the first time, although existing lifestyle landowners appeared to have little appetite to add to their holdings. We believe interest from non-farmers (lifestyle buyers) as the economy picks up may well rise, but our records show that their activity is still significantly below the levels pre Global Financial Crisis (GFC).
Figure 4 shows expansion remains the most significant reason (48%) to purchase farmland and over 80% of farmer buyers are expanding; similar to figures recorded in previous years.
Residential/sporting and buying for investment, are cited by 25% and 18% of buyers respectively. The weak pound has not yet led to a return of overseas buyers in the numbers seen pre the GFC, when 20% of the market came from abroad, but enquiry numbers have increased and it may be deals take place in 2017.
Our analysis of the principal sources of funds used to buy farmland shows there has been an increased use of borrowed money for farm purchases, 30% of all buyers compared with 23% in 2015, suggesting buyers may be taking the opportunity to use ‘cheap’
money while base rates are at a historical low.
The proportion of buyers (7%) using rollover as the principal source of funds was similar to 2015 and is still a long way off levels pre the GFC of over 25%. We expect this source to become more significant as housebuilding increases following improvement in the development sector and government incentives.
Sellers The proportion of farmers selling in 2016 was lower than in 2015; with a number of potential factors contributing including a softening in farmland values in the short term, uncertainty surrounding Brexit and the short term prospect of an increase in subsidy as a result of the weak pound.
This reduction is balanced by an increased proportion of non-farmer and institutional/corporate sellers. These do not have the same sentimental attachment and tend to sell more regularly as circumstances change.
Figure 5 shows the proportion of sellers citing debt related reasons as the main reason to sell is similar to 2015 but an increasing proportion are selling to retire – a significant 28% in 2016. However, digging deeper into the data shows over 40% of farmers cite retirement as a reason for selling and an additional 20% for debt related reasons. n FIGURE 5
Sellers
Source: Savills Research
Seller Type 2016change on 2015
farmer 46%
Non-farmer 40%
Institution / corporate 14%
other 0%
Seller Reason 2016change on 2015
Debt 20%
Relocation 16%
Investment 23%
Retirement 28%
Death / Personal 13%
FIGURE 4
Buyers
Source: Savills Research
Buyer Type 2016change on 2015
farmer 46%
Existing Non-farmer 25%
New Non-farmer 20%
Institution / corporate 8%
other 1%
Buyer Reason 2016change on 2015
Relocation 6%
Expansion 48%
Investment 18%
New farm Entrant 1%
Sitting Tenant 3%
Resi/Sporting 25%
Market Survey | GB Agricultural Land
08
“Farmland values have shown less volatility than other key commodities”
Savills Research
InternationalThE GLoBAL MARkET
Agricultural commodities and assets are now truly global markets
Words: Ian Bailey
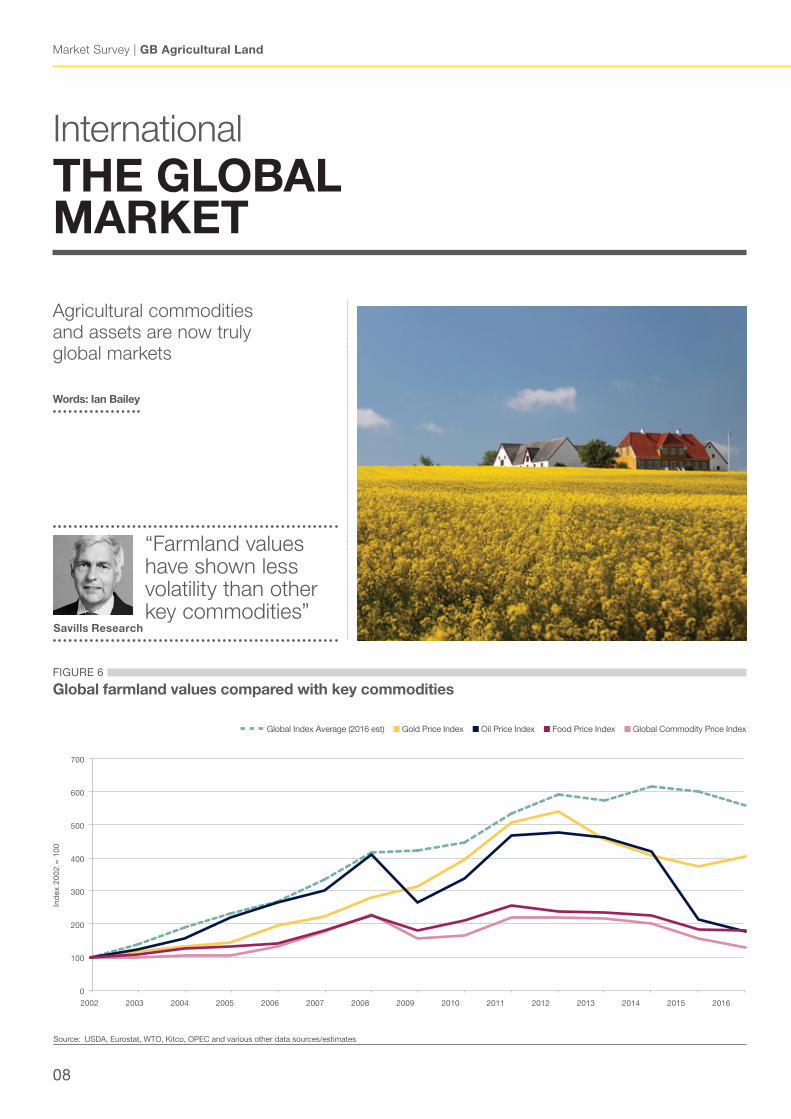
FIGURE 6
Global farmland values compared with key commodities
Source: USDA, Eurostat, WTO, Kitco, OPEC and various other data sources/estimates
Ind
ex 2
002
= 1
00
700
600
500
400
300
200
100
0
2002 2003 2004 2005 2006 2007 2008 2009 2010 2011 2012 2013 2014 2015 2016
Global Index Average (2016 est) n Gold Price Index n Oil Price Index n Food Price Index n Global Commodity Price Index
2017
savills.co.uk/research 09
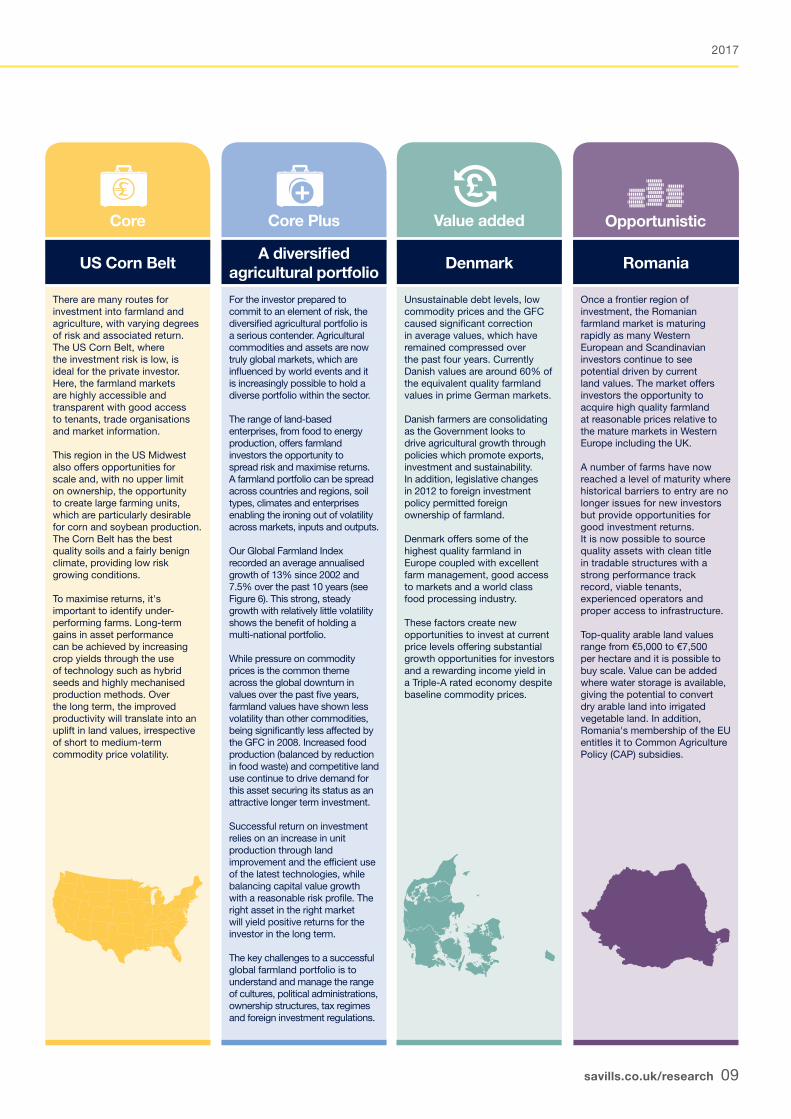
core Plus Value added opportunisticcore
US corn BeltA diversified
agricultural portfolioDenmark Romania
There are many routes for investment into farmland and agriculture, with varying degrees of risk and associated return. The US Corn Belt, where the investment risk is low, is ideal for the private investor. Here, the farmland markets are highly accessible and transparent with good access to tenants, trade organisations and market information.
This region in the US Midwest also offers opportunities for scale and, with no upper limit on ownership, the opportunity to create large farming units, which are particularly desirable for corn and soybean production. The Corn Belt has the best quality soils and a fairly benign climate, providing low risk growing conditions.
To maximise returns, it's important to identify under-performing farms. Long-term gains in asset performance can be achieved by increasing crop yields through the use of technology such as hybrid seeds and highly mechanised production methods. Over the long term, the improved productivity will translate into an uplift in land values, irrespective of short to medium-term commodity price volatility.
For the investor prepared to commit to an element of risk, the diversified agricultural portfolio is a serious contender. Agricultural commodities and assets are now truly global markets, which are influenced by world events and it is increasingly possible to hold a diverse portfolio within the sector.
The range of land-based enterprises, from food to energy production, offers farmland investors the opportunity to spread risk and maximise returns. A farmland portfolio can be spread across countries and regions, soil types, climates and enterprises enabling the ironing out of volatility across markets, inputs and outputs.
Our Global Farmland Index recorded an average annualised growth of 13% since 2002 and 7.5% over the past 10 years (see Figure 6). This strong, steady growth with relatively little volatility shows the benefit of holding a multi-national portfolio.
While pressure on commodity prices is the common theme across the global downturn in values over the past five years, farmland values have shown less volatility than other commodities, being significantly less affected by the GFC in 2008. Increased food production (balanced by reduction in food waste) and competitive land use continue to drive demand for this asset securing its status as an attractive longer term investment.
Successful return on investment relies on an increase in unit production through land improvement and the efficient use of the latest technologies, while balancing capital value growth with a reasonable risk profile. The right asset in the right market will yield positive returns for the investor in the long term.
The key challenges to a successful global farmland portfolio is to understand and manage the range of cultures, political administrations, ownership structures, tax regimes and foreign investment regulations.
Unsustainable debt levels, low commodity prices and the GFC caused significant correction in average values, which have remained compressed over the past four years. Currently Danish values are around 60% of the equivalent quality farmland values in prime German markets.
Danish farmers are consolidating as the Government looks to drive agricultural growth through policies which promote exports, investment and sustainability. In addition, legislative changes in 2012 to foreign investment policy permitted foreign ownership of farmland.
Denmark offers some of the highest quality farmland in Europe coupled with excellent farm management, good access to markets and a world class food processing industry.
These factors create new opportunities to invest at current price levels offering substantial growth opportunities for investors and a rewarding income yield in a Triple-A rated economy despite baseline commodity prices.
Once a frontier region of investment, the Romanian farmland market is maturing rapidly as many Western European and Scandinavian investors continue to see potential driven by current land values. The market offers investors the opportunity to acquire high quality farmland at reasonable prices relative to the mature markets in Western Europe including the UK.
A number of farms have now reached a level of maturity where historical barriers to entry are no longer issues for new investors but provide opportunities for good investment returns. It is now possible to source quality assets with clean title in tradable structures with a strong performance track record, viable tenants, experienced operators and proper access to infrastructure.
Top-quality arable land values range from €5,000 to €7,500 per hectare and it is possible to buy scale. Value can be added where water storage is available, giving the potential to convert dry arable land into irrigated vegetable land. In addition, Romania's membership of the EU entitles it to Common Agriculture Policy (CAP) subsidies.
Market Survey | GB Agricultural Land
10
5.5% Five-year forecast value
for GB farmland
32% Five-year forecast value
for UK forestry
OutlookfARMLAND & foRESTRY
Average value of farmland is likely to remain under some pressure in the short run T
he average value of farmland across Great Britain is likely to remain under some pressure in the short
term due to low commodity prices (see Driver 1 – opposite) despite the fall in output costs and increased subsidy receipts due to the weak value of sterling.
This price pressure will be tempered by a continued low supply (see Driver 2), which will help to underpin prices in the medium to long term. In addition, we expect increasing rollover and general economic improvement in the
Words: Ian Bailey
“Price pressure will be tempered by a continued low supply”
Savills Research
medium term to support demand and therefore prices as shown in Figure 7.
Brexit may create uncertainty in the farmland market during the next few years impacting on the amount of land coming to the market (see Driver 3).
In conclusion, we expect average values to increase by a total of 5.5% across GB over the next five years, although there will continue to be distinct local variations and the price gap between the best and poorest land is likely to widen.
As we note when we ‘valued Britain’ there is a significant area of tenanted farmland and in the event of a significant reduction in farm subsidies and therefore incomes, the negative effect is likely to be greater on rents than land values, as the relationship between rents and agricultural profitability is stronger than for land values. However, we expect the scarcity of land to rent will moderate any downward pressure on market rents (see Driver 4). n
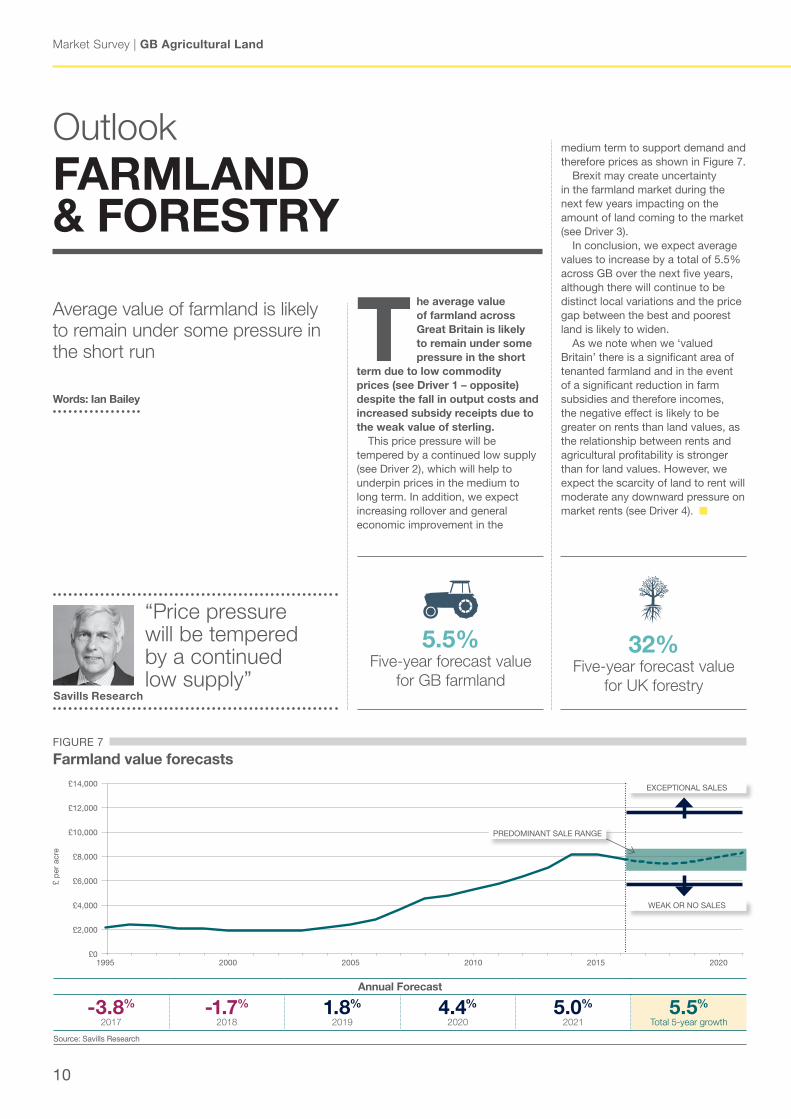
FIGURE 7
farmland value forecasts
Source: Savills Research
Annual forecast
-3.8%
2017-1.7%
20181.8%
20194.4%
20205.0%
20215.5%
Total 5-year growth
£ p
er a
cre
£14,000
£12,000
£10,000
£8,000
£6,000
£4,000
£2,000
£01995 2000 2005 2010 2015 2020
PREDOMInAnT SALE RAnGE
EXCEPTIOnAL SALES
WEAK OR nO SALES
2017
savills.co.uk/research 11
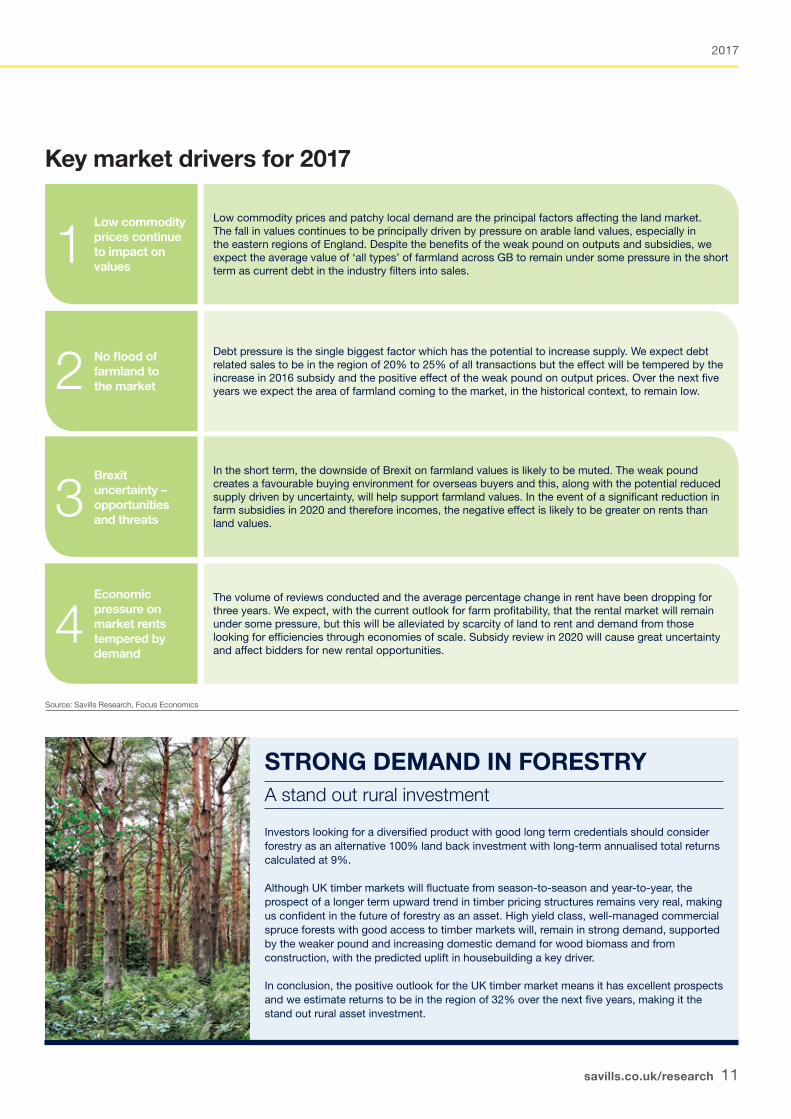
key market drivers for 2017
Low commodity prices and patchy local demand are the principal factors affecting the land market. The fall in values continues to be principally driven by pressure on arable land values, especially in the eastern regions of England. Despite the benefits of the weak pound on outputs and subsidies, we expect the average value of ‘all types’ of farmland across GB to remain under some pressure in the short term as current debt in the industry filters into sales.
Debt pressure is the single biggest factor which has the potential to increase supply. We expect debt related sales to be in the region of 20% to 25% of all transactions but the effect will be tempered by the increase in 2016 subsidy and the positive effect of the weak pound on output prices. Over the next five years we expect the area of farmland coming to the market, in the historical context, to remain low.
The volume of reviews conducted and the average percentage change in rent have been dropping for three years. We expect, with the current outlook for farm profitability, that the rental market will remain under some pressure, but this will be alleviated by scarcity of land to rent and demand from those looking for efficiencies through economies of scale. Subsidy review in 2020 will cause great uncertainty and affect bidders for new rental opportunities.
In the short term, the downside of Brexit on farmland values is likely to be muted. The weak pound creates a favourable buying environment for overseas buyers and this, along with the potential reduced supply driven by uncertainty, will help support farmland values. In the event of a significant reduction in farm subsidies in 2020 and therefore incomes, the negative effect is likely to be greater on rents than land values.
Low commodity prices continue to impact on values
No flood of farmland to the market
Economic pressure on market rents tempered by demand
Brexit uncertainty – opportunities and threats
1
2
4
3
Source: Savills Research, Focus Economics
Investors looking for a diversified product with good long term credentials should consider forestry as an alternative 100% land back investment with long-term annualised total returns calculated at 9%.
Although UK timber markets will fluctuate from season-to-season and year-to-year, the prospect of a longer term upward trend in timber pricing structures remains very real, making us confident in the future of forestry as an asset. High yield class, well-managed commercial spruce forests with good access to timber markets will, remain in strong demand, supported by the weaker pound and increasing domestic demand for wood biomass and from construction, with the predicted uplift in housebuilding a key driver.
In conclusion, the positive outlook for the UK timber market means it has excellent prospects and we estimate returns to be in the region of 32% over the next five years, making it the stand out rural asset investment.
STRoNG DEMAND IN foRESTRYA stand out rural investment
12
Market Survey | GB Agricultural Land
Please contact us for further information
Savills farm Agency
Savills plcSavills is a leading global real estate service provider listed on the London Stock Exchange. The company established in 1855, has a rich heritage with unrivalled growth. It is a company that leads rather than follows, and now has over 700 offices and associates throughout the Americas, Europe, Asia Pacific, Africa and the Middle East.
This report is for general informative purposes only. It may not be published, reproduced or quoted in part or in whole, nor may it be used as a basis for any contract, prospectus, agreement or other document without prior consent. Whilst every effort has been made to ensure its accuracy, Savills accepts no liability whatsoever for any direct or consequential loss arising from its use. The content is strictly copyright and reproduction of the whole or part of it in any form is prohibited without written permission from Savills Research.
Additional Research
Ian BaileyHead of Agricultural Research020 7299 [email protected]
NationalAlex Lawson020 7409 [email protected]
NationalGiles Wordsworth020 7075 [email protected]
central/West/WalesRichard Binning01865 269 [email protected]
MidlandsAndrew Pearce01522 508 [email protected]
Eastchristopher Miles01603 229 [email protected]
Scotlandcharles Dudgeon0131 247 [email protected]
SouthDavid cross01722 426 [email protected]
South WestPenny Dart01392 455 [email protected]
South Eastchris Spofforth01444 446 [email protected]
NorthAndrew Black01904 617 [email protected]
Julie BaxterResearch Analyst 01483 203 492 [email protected]