Embed Size (px)
Citation preview

MarketSentiment Survey
H2 2014

Portfolio–RICS–ELTINGAMarket Sentiment Survey | H2 2014
01 Highlights 02 Explanation 03 Index 05 Office sector 09 Retail sector 13 Industrial sector 16 General sentiment

Portfolio–RICS–ELTINGA Market Sentiment Survey | H2 2014
1
– Responses from this round of the Sentiment Survey have underpinned the improved situation
on both the investment and occupational markets. This is mainly driven by the office sector.
Tangible results in the retail and industrial sectors remain to be seen, however the situation is
clearly bottoming out in these sectors as well.
– According to RICS professionals, the Hungarian commercial real estate sector has become more
valuable as a result of the last six months. It is even better news that 79% of the respondents
expect investment appetite to improve further. Optimism permeates the office and retail sec-
tors, too.
– The Budapest Commercial Property Index has registered an increase of over 4 points since H1,
resulting from both rental growth and a slight yield compression reported by respondents.
– Office yield levels have shifted inwards by at least 25 basis points in all office categories, thus
reaching the softest yields in the history of this survey (from H2 2011). Typical rents in the
office sector are almost stable.
– The retail sector has shown improvement in the sentiment towards yield expectations and bot-
toming out towards rents. For Mall-type retail parks and Big Box retail we have observed yield
compression, but the resulting yields have rather caught up with H2 2013 levels.
– The optimism characterising the core markets is not observable in the industrial sector.
– More than two thirds of the respondents expect yield compression in the next 3-6 months
across.
Highlights
Yield (%)Rent (€/sqm/month)
Typical Minimum Maximum
Top CBD office building 7.3 14.0 12.5 18.0
Prime non-CBD office building 7.8 12.0 10.3 13.5
Good quality non-central office building 8.4 10.0 9.0 12.0
Prime out-of-town logistics center 9.0 3.1 2.5 4.0
Small Business Unit 9.0 4.0 3.5 4.5
Top 5 shopping malls 7.3 40.0 25.0 55.0
Mall-type retail park 8.3 10.0 8.0 13.0
Big box retail 8.4 7.0 5.5 9.0
All median figures for H2 2014

H2 2014 | Portfolio–RICS–ELTINGA Market Sentiment Survey
2
Rent (€ / sqm / month)
Distribution oftypical rent responses
median of typicalrent responses
median of maximumrent responses
median of minimumrent responses
Rati
o of
res
pons
es (
%)
Explanatory example chart
The most important output resulting from our research is the rental rates and yields data
(presented in charts similar to the one below). As this publication is based on the opinions
of individuals, these charts reflect the distribution of responses received in respect to a given
variable, i.e. rental rates or yields related to a type of property. Extreme values were removed
and the ranges of the remaining answers were then divided into subsections. The charts
indicate the percentage of responses falling into each subsection, with the median value
marked with a red vertical line (the median is the middle value of the data set when it has
been arranged in ascending order, i.e. the numeric value separating the higher half of the data
from the lower half).
The survey included questions regarding the realistic minimum, maximum, and typical
rental rates in respect to a particular type of property. While we also present all of these in
a tabular format, the rate charts only include the responses to the question of typical rental
rate levels.
Explanation

Portfolio–RICS–ELTINGA Market Sentiment Survey | H2 2014
3
The starting value of the Buda-
pest Commercial Property
Index was set to 100.00 based
on survey data collected in
the second half of 2011. By
H1 2013, it had decreased to
the region of 90.00, where it
has been floating ever since.
However, H2 2014 brought
a positive change: the Index
rose by over 4 points within
the last half-year period. The
index is made up of a com-
pound value that traces senior
real estate professionals’
assessments of current yields
and rental rates for the com-
mercial real estate market. A
measure of value is created
by dividing the median typi-
cal yearly rent by the current
yield for each of the eight sub-
segments present in the sur-
vey, and attributing weights to
these values in order to reflect
the relative volume of each
sub-segment. The results are
then added up and compared
against the other surveys. The
overall decrease since 2011
has been produced by a com-
bination of rents perceived to
be shrinking and yields seen
as growing. Similarly, the cur-
rent improvement is a result
of both factors partially coun-
tering their earlier changes at
the same time. Rents made a
stronger impact than yields in
both cases. The market sector
to have made the most sig-
nificant impact on the Index
in the last six months is the
Top-5 Malls where a slight
increase in yields was not suf-
ficient to counter a perceived
rental growth. All other sub-
markets have contributed pos-
itively to a lesser extent with
the exception of Top CBD
Offices. The overall picture
since 2011 is more colourful:
Big-Box and Mall-Type Retail
have driven the Index down
along with Prime Logistics,
while the Top-5 Malls made a
positive contribution over the
entire period..
BCP Index
93.74
BCP Index(H2 2011=100)
H2 2014 93.74
H1 2014 89.67
H2 2013 90.74
H1 2013 90.35
H2 2012 96.53
H1 2012 95.21
H2 2011 100

H2 2014 | Portfolio–RICS–ELTINGA Market Sentiment Survey
4
The survey uses eight hypothetical properties intended to represent major segments of the
Budapest commercial property market. Their descriptions include typical characteristics in
terms of location, quality, size, and occupancy, making them suitable investment products.
When asking about rental rates, hypothetical lease transactions were defined to reflect an
average exchange on the given market in terms of both size and basic conditions. The pho-
tos accompanying each detailed description of buildings are of properties that do not actu-
ally exist on the Hungarian market. However, they have been selected to create the right
impressions of the scenario at hand and to ensure that all respondents consider the same
property categories when answering the questions.
1. Top CBD office building
2. Prime non-CBD office building
3. Good quality non-central office building
4. One of the Top 5shopping malls
5. Mall-type retail park
6. Big box retail
7. Prime out-of-town logistics center
8. Small Business Unit
Categories

Portfolio–RICS–ELTINGA Market Sentiment Survey | H2 2014
5
In comparison with the
results of the previous sur-
veys, yield levels have
shifted inwards by at least
25 basis points in all office
categories, thus reaching
the softest yields in the his-
tory of this survey (since H2
2011). This shows an opti-
mistic view of how the mar-
ket has evolved in the last 6
months and reflects the lat-
est transactional evidence.
Rents show a more complex
picture. Typical rents for the
‘Top CBD Office’ category
decreased by 1 euro after a
peak in H1 2014, while typ-
ical rents in the other two
categories remained the
same. The biggest change is
also shown in the ‘Top CBD
Office’ category where max-
imum rents decreased by
1.75 euros after a peak in
H1 2014. Interestingly, sen-
timent towards minimum
rents has increased by 0.5
euro in this office category.
We have to note that the
variance in the responses is
relatively high in the first
office category with a high
number of responses falling
into the 15-18 euro range.
However, as a result of the
observed movements in all
office categories, rent lev-
els have not moved signifi-
cantly from the level they
were at in H1 2011. On
average, typical rents still
continue to displaya ten-
dency of approximating
minimum rents.
Office sector
Yield levels have decreased by at least 25 basis points in all office categories.

H2 2014 | Portfolio–RICS–ELTINGA Market Sentiment Survey
6
1. Top CBD office 2. Prime non-CBD office
20%
0%
4%
8%
12%
16%
5-6
7-8
9-10
11-1
2
13-1
4
15-1
6
17-1
8
19-2
0
21-2
2
23-2
4
median=14
0% 4% 8%
12% 16% 20% 24%
6-7
8-9
10-1
1
12-1
3
14-1
5
16-1
7
18-1
9
20-2
1
22-2
3
24-2
5
median=12
Rent opinions (€/sqm/m)Rent opinions (€/sqm/m)
0% 5%
10% 15% 20% 25% 30% 35% 40%
5-5.
25
5.5-
5.75
6-
6.25
6.
5-6.
75
7-7.
25
7.5-
7.75
8-
8.25
8.
5-8.
75
9-9.
25
9.5-
9.75
10
-10.
25
10.5
-10.
75
11-1
1.25
median = 7.25
0% 5%
10% 15% 20% 25% 30% 35%
5.25
-5.5
5.75
-6
6.25
-6.5
6.75
-7
7.25
-7.5
7.75
-8
8.25
-8.5
8.75
-9
9.25
-9.5
9.75
-10
10.2
5-10
.5
10.7
5-11
median = 7.75
Yield opinions (%)Yield opinions (%)
A-category (according to BRF) office building
located within the CBD of Budapest:
– represents the highest standard in
the market in terms of technical
specifications and prestige
– It has an underground garage
– The building is at least 95% let to
multiple tenants,
– at least 80% of the tenants are
international companies
– the average unexpired lease term
is at least 4 years
Market headline rental rate for a specific
letting transaction:
– 500 sqm office space
– 5-year lease term
– strong international tenant
A-category (according to BRF) office building
located in an established, but non-CBD office
location:
– represents high standard in the market
in terms of technical specifications and
prestige
– it has an underground garage
– the building is at least 95% let to
multiple tenants
– at least 80% of the tenants are
international companies
– the average unexpired lease term is at
least 4 years
Market headline rental rate for a specific letting
transaction:
– 500 sqm office space
– 5-year lease term
– strong international tenant

Portfolio–RICS–ELTINGA Market Sentiment Survey | H2 2014
7
6%
12%
18%
24%
30%
6-7
8-9
10-1
1
12-1
3
14-1
5
16-1
7
18-1
9
20-2
1
22-2
3
24-2
5
median = 10 Rent opinions (€/sqm/m)
0%
5%
10%
15%
20%
25%
5.25
-5.5
5.75
-6
6.25
-6.5
6.75
-7
7.25
-7.5
7.75
-8
8.25
-8.5
8.75
-9
9.25
-9.5
9.75
-10
10.2
5-10
.5
10.7
5-11
median = 8.375 Yield opinions (%)
A-category (according to BRF) office building
located in a non-central office location:
– built no more than 10 years ago
– it has an underground garage
– good public transportation
– the building is at least 95% let to
multiple tenants, not necessarily of
international covenant
– the average unexpired lease term is at
least 3 years
Market headline rental rate for a specific
letting transaction:
– 500 sqm office space
– 4-year lease term
– reliable and financially stable tenant
3. Good quality non-central offices
Strong interest from owner occupiers
and more liquidity from local HUF
funds. Banks are willing to borrow.
Increased state interest in strategic
real estate assets with continual
investment into infrastructure. Poten-
tial for office vacancy to drop further.
Growing interest from foreign funds
to consider Hungary but global uncer-
tainty as such could cool the market
quite quickly.
Hamish White MRICS, CIB Bank
Occupational markets are showing
healthy improvements, however
Q2 results were more optimistic than
Q3 results.
Jaroslav Kopac MRICS, JLL

H2 2014 | Portfolio–RICS–ELTINGA Market Sentiment Survey
8
Distribution of responses in 'CBD office rent' category
Distribution of responses in 'Prime Non-CBD office rent' category
0%
2%
4%
6%
8%
10%
12%
14% 6-
7
7-8
8-9
9-10
10-1
1
11-1
2
12-1
3
13-1
4
14-1
5
15-1
6
16-1
7
17-1
8
18-1
9
19-2
0
20-2
1
21-2
2
22-2
3
23-2
4
Typical rent frequency (2014 H2) (MA) Typical rent frequency (2014 H1) (MA)
0%
2%
4%
6%
8%
10%
12%
14%
16%
18%
20%
5-6
6-7
7-8
8-9
9-10
10-1
1
11-1
2
12-1
3
13-1
4
14-1
5
15-1
6
16-1
7
17-1
8
18-1
9
19-2
0
Typical rent frequency (2014 H2) (MA) Typical rent frequency (2014 H1) (MA)

Portfolio–RICS–ELTINGA Market Sentiment Survey | H2 2014
9
Compared to the last results,
the retail sector has shown
improvement in sentiment
towards yield expectations
and a stability/bottoming
out towards rents. Yields for
Top-5 Malls have been oscil-
lating in the 7-7.25% range
since the introduction of this
survey, and therefore the
outward movement of 25bp
in this round should be per-
ceived as stable. For Mall-
type Retail Parks and Big-
Box Retail we have observed
yield compression, but the
resulting yields have rather
caught up with H2 2013 lev-
els. Rents are stable.
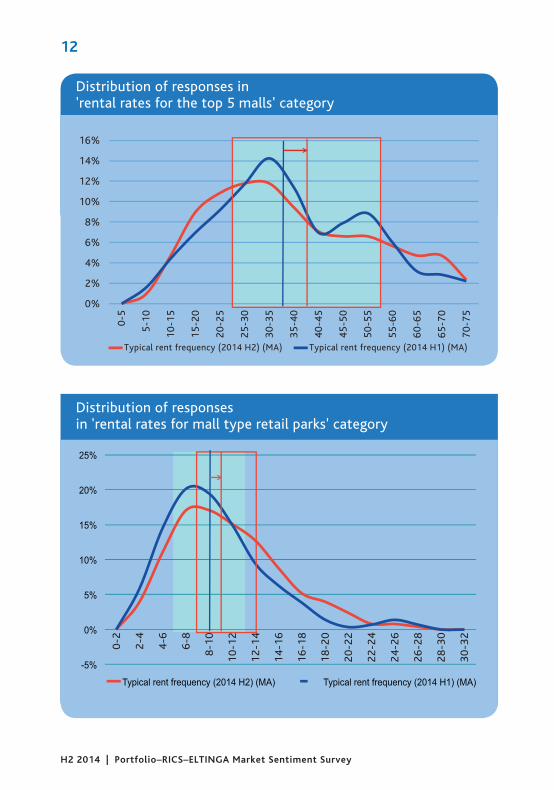
Retail sector
The results of the survey are supportingthe general news on improved activity among investors as well as reports on rising retail sales volumes.

H2 2014 | Portfolio–RICS–ELTINGA Market Sentiment Survey
10
4. One of the Top 5 shopping malls
0%
4%
8%
12%
16%
20%
0-5
10-1
5
20-2
5
30-3
5
40-4
5
50-5
5
60-6
5
70-7
5
80-8
5
90-9
5
100-
105
median = 40
0%
5%
10%
15%
20%
25%
30%
35%
5-5.
25
5.5-
5.75
6-6.
25
6.5-
6.75
7-7.
25
7.5-
7.75
8-8.
25
8.5-
8.75
9-9.
25
9.5-
9.75
10-1
0.25
10.5
-10.
75
11-1
1.25
median = 7.25
Prime shopping center located in Budapest,
at a metro station or central location:
– GLA is at least 40,000 sqm, no vacancy
– the property accommodates at least
2 major anchor tenants
– the average unexpired lease term is
at least 5 years
Market headline rental rate for a specific
letting transaction:
– 200 sqm retail unit
– 5-7 year lease term
– strong international brand
– well-positioned unit within the centre
5%
10%
15%
20%
25%
30%
0-2
2-4
4-6
6-8
8-10
10
-12
12-1
4 14
-16
16-1
8 18
-20
20-2
2 22
-24
24-2
6 26
-28
28-3
0 30
-32
median = 10
0%
5%
10%
15%
20%
25%
5.25
-5.5
5.75
-6
6.25
-6.5
6.75
-7
7.25
-7.5
7.75
-8
8.25
-8.5
8.75
-9
9.25
-9.5
9.75
-10
10.2
5-10
.5
10.7
5-11
median = 8.25
Retail park located in Budapest, in an
established location:
– GLA is approx. 12,000 sqm, no
vacancy
– the property accommodates at
least 1 major anchor tenant
– the average unexpired lease term is
at least 5 years
Market headline rental rate for a specific
letting transaction:
– 300-400 sqm
– 5-year lease term
– local company / strong international
brand
5. Mall-type retail parks
Rent opinions (€/sqm/m)
Yield opinions (%)
Rent opinions (€/sqm/m)
Yield opinions (%)

Portfolio–RICS–ELTINGA Market Sentiment Survey | H2 2014
11
0%
2%
4%
6%
8%
10%
12%
14%
16%
18%
5-5.
25
5.5-
5.75
6-
6.25
6.
5-6.
75
7-7.
25
7.5-
7.75
8-
8.25
8.
5-8.
75
9-9.
25
9.5-
9.75
10
-10.
25
10.5
-10.
75
11-1
1.25
median = 8.375
0%
5%
10%
15%
20%
25%
30%
0-1
1-2
2-3
3-4
4-5
5-6
6-7
7-8
8-9
9-10
10
-11
11-1
2 12
-13
13-1
4 14
-15
15-1
6
median = 7
Stand alone hypermarket located within
an established retail park:
– GLA is at least 5,000 sqm and
single let to a reliable and
financially stable tenant
– the remaining lease duration is at
least 10 years
Market headline rental rate for a specific
letting transaction:
– 5,000 sqm big-box, 10-year lease term
– reliable and financially stable tenant
6. Big box retail
Yield opinions (%)
Rent opinions (€/sqm/m)
There is increasing invest-
ment activity mostly from
Hungarian investors but also
on behalf of international
companies who already have
a local track record. Both core
and value-added products are
sought after. Rents are still
under pressure which mostly
translates into the provision
of big incentives.
György Lindwurm MRICS,DTZ Hungary
Low risk opportunities now
attract increasing interest
resulting in a phenomenon
that was rarely seen in recent
years: competitive situa-
tions gradually driving yields
down. However, financing
remains tight and Hungary
must continue to be seen as
a cheap investment location
- these factors limit the room
for yield compression in the
foreseeable future.
Krisztián Hornok MRICS,Indotek Group
H2 2014 | Portfolio–RICS–ELTINGA Market Sentiment Survey
12
Distribution of responses in 'rental rates for mall type retail parks' category
Distribution of responses in'rental rates for the top 5 malls' category
0%
2%
4%
6%
8%
10%
12%
14%
16%
0-5
5-10
10-1
5
15-2
0
20-2
5
25-3
0
30-3
5
35-4
0
40-4
5
45-5
0
50-5
5
55-6
0
60-6
5
65-7
0
70-7
5
Typical rent frequency (2014 H2) (MA) Typical rent frequency (2014 H1) (MA)
-5%
0%
5%
10%
15%
20%
25%
0-2
2-4
4-6
6-8
8-1
0
10
-12
12
-14
14
-16
16
-18
18
-20
20
-22
22
-24
24
-26
26
-28
28
-30
30
-32
Typical rent frequency (2014 H2) (MA) Typical rent frequency (2014 H1) (MA)

Portfolio–RICS–ELTINGA Market Sentiment Survey | H2 2014
13
The optimism characteris-
ing the core markets is not
observable in the indus-
trial sector. Respondents are
still cautious when consider-
ing rents. The results of the
survey show hesitation in
each category with a slight
increase compared to the
June figures, but rather pres-
sure compared to prior esti-
mates. Typical rents are a
little above €3 per square
metre per month in the case
of logistics schemes and
around €4 in the case of SBU.
There has been no transac-
tion in this sector to influ-
ence yield opinions, conse-
quently the 9% has remained
unchanged ever since the
survey started. Confidence in
this sector is still low, both as
development and as invest-
ment products.
Industrial sector
Still no sign of optimism in the industrial sector.

H2 2014 | Portfolio–RICS–ELTINGA Market Sentiment Survey
14
7. Small Business Units
0% 5%
10% 15% 20% 25% 30% 35% 40% 45% 50% 55%
0-0.
5 0.
5-1
1-1.
5 1.
5-2
2-2.
5 2.
5-3
3-3.
5 3.
5-4
4-4.
5 4.
5-5
5-5.
5 5.
5-6
6-6.
5 6.
5-7
7-7.
5 7.
5-8
median = 3.125
Rent opinions (€/sqm/m)
0%
5%
10%
15%
20%
25%
30%
35%
40%
5.25
-5.5
5.75
-6
6.25
-6.5
6.75
-7
7.5-
7.75
8-8.
25
8.5-
8.75
9-9.
25
9.5-
9.75
10-1
0.25
0.5-
10.7
5
11-1
1.25
median = 9
Yield opinions (%)
A-category industrial property located within
Budapest, close to main arterial road:
– GLA is at least 10,000 sqm (could be in
multiple buildings)
– the property is approx. 100% let to
multiple tenants
– the average unexpired lease term is at
least 3 years
Market headline rental rates for a specific
letting transaction:
– 500 sqm warehouse space
– 3-year lease term
– reliable and financially stable tenant
A-category industrial property located
approx 5 minutes from a motorway:
– GLA is at least 25,000 sqm (could be in
multiple buildings)
– The property is approx. 100% let to
multiple tenants
– the average unexpired lease term is at
least 4 years
Market headline rental rates for a specific
letting transaction:
– 3,000 sqm warehouse space
– 5-year lease term
– strong international tenant
8. Prime out-of-town logistics centers
0% 3% 6% 9%
12% 15% 18% 21% 24% 27% 30%
0-0.
5 0.
5-1
1-1.
5 1.
5-2
2-2.
5 2.
5-3
3-3.
5 3.
5-4
4-4.
5 4.
5-5
5-5.
5 5.
5-6
6-6.
5 6.
5-7
7-7.
5 7.
5-8
median = 4
Rent opinions (€/sqm/m)
0%
5%
10%
15%
20%
25%
30%
35%
40%
45%
5.5-
5.75
6-
6.25
6.
5-6.
75
7-7.
25
7.5-
7.75
8-
8.25
8.
5-8.
75
9-9.
25
9.5-
9.75
10
-10.
25
0.5-
10.7
5 11
-11.
25
median = 9 Yield opinions (%)

Portfolio–RICS–ELTINGA Market Sentiment Survey | H2 2014
15
Distribution of responses in category 'rent of out-of-town logistics buildings'
0%
5%
10%
15%
20%
25%
0-0.
5
0.5-
1
1-1.
5
1.5-
2
2-2.
5
2.5-
3
3-3.
5
3.5-
4
4-4.
5
4.5-
5
5-5.
5
5.5-
6
6-6.
5
6.5-
7
Typical rent frequency (2014 H2) (MA) Typical rent frequency (2014 H1) (MA)
It really seems like that the ice is
finally melting in our markets as
well!
Valter Kalaus MRICS, VLK Consulting
I expect only a slight yield
compression.
László Vas, Diófa Asset Management
New movemenents on the hori-
zon: Asian investors are active in
the industrial sector.
Name not given

H2 2014 | Portfolio–RICS–ELTINGA Market Sentiment Survey
16
Which commercial segment do you think currently offers the best conditions for an Investor?
How do you think investment appetite for property will change over the next six months?
Which commercial segment do you think currently offers the best conditions for a Developer?
Office 60%
Retail 21%
Industrial 11%
Other 2%
I don't know 6%
Office 60%
Retail 15%
Industrial
13%
Other 8%
I don't know 4%
Improve 79%
Same 13%
Worse 0%
I don’t know 8%
General sentiment
A majority now expects yield compression for the next 3-6 months across sectors.
Do you expect yield compression for the next 3-6 months across sectors?
no 29%
yes 71%

Portfolio–RICS–ELTINGA Market Sentiment Survey | H2 2014
17
Median yields (%)
Top CBD offices, rents (euro / sqm / month)
7
7.25
7.5
7.75
8
8.25
8.5
8.75
9
9.25
9.5
2011H2
2012H1
2012H2
2013H1
2013H2
2014H1
2014H2
SMALL BUSINESS UNIT
PRIME OUT OF TOWNLOGISTICS
GOOD QUALITYNON-CENTRAL OFFICE
MALL TYPE RETAIL PARK
BIG BOX RETAIL
PRIME NON-CBD OFFICE
TOP CBD OFF
TOP 5 MALL
0
5
10
15
20
25
2011 H2 2012 H1 2012 H2 2013 H1 2013 H2 2014 H1 2014 H2
typical
maximum
minimum

H2 2014 | Portfolio–RICS–ELTINGA Market Sentiment Survey
18
Out of town logistics, rents (euro / sqm / month)
Top five malls, rents (euro / sqm / month)
0
1
2
3
4
5
6
2011 H2 2012 H1 2012 H2 2013 H1 2013 H2 2014 H1 2014 H2
typical
maximum
minimum
0
5
10
15
20
25
30
35
40
45
50
55
60
65
2011 H2 2012 H1 2012 H2 2013 H1 2013 H2 2014 H1 2014 H2
typical
maximum
minimum

Portfolio–RICS–ELTINGA Market Sentiment Survey | H2 2014
19
A biannual publication, the Market Sentiment Survey is a collaboration between the ELT-
INGA Centre for Real Estate Research, Portfolio and RICS Hungary. It has been designed to
provide a clear picture of how Hungary’s senior real estate professionals see current yield
and rental rates, as well as general market expectations. The purpose of the Market Senti-
ment Survey is to improve transparency on the Hungarian real estate market by establish-
ing a benchmark for sentiment drawing on a wide professional basis. All Hungarian RICS
members (both full members and candidates for membership) were invited to fill in a ques-
tionnaire prepared by RICS and Portfolio.hu. They were asked for their opinions on current
market yields and rental rates, as well as on future market expectations. A total of nearly 50
real estate professionals participated actively in the current Market Sentiment Survey. Of
the respondents, 70% were full RICS members and more than 75% have over 10 years of
professional experience. The completed surveys indicate that around 65% of respondents
work for international companies. Respondents were asked to provide information on their
industry and their personal specialty within their organisation. Nearly 60% of respondents
work for consultancy firms. However, developers and asset management professionals also
weighed in heavily within the survey. The respondents’ fields of specialisation were fairly
diverse: valuation, investment, development and asset management were the best repre-
sented categories in the survey.
About the survey
Ratio of respondents own work specialism
0%
5%
10%
15%
20%
25%
30%
35%
Assetmanagement
Develop-ment
Financing Investment Valuation Letting Research Other

H2 2014 | Portfolio–RICS–ELTINGA Market Sentiment Survey
20
Definitions
Market Yield: The current net annual income divided by the purchase price received by the
Vendor in a transaction where the asset has been traded at Market Value as of today. Mar-
ket Value is the estimated amount for which a property should exchange on a certain date;
between a willing buyer and a willing seller; in an arm’s length transaction; after proper mar-
keting; when both parties had each acted knowledgeably, prudently and without compulsion.
Market Headline Rent: The estimated amount for which a property, or part of a property
should lease on appropriate lease terms between a willing landlord and a willing tenant; on
a certain date; in an arm’s length transaction; after proper marketing; when both parties had
each acted knowledgeably, prudently and without compulsion.
Category ‘A’: A building that either conforms to all the „hard criteria“ and at least 6 of the
„soft criteria“ or certified by Breeam / LEED. Hard criteria: modern cable management, a mod-
ern air handling system, adequate provision of secure dedicated parking (at least parking ratio
of 1/75 not applying to refurbishments and periphery sub-market), a high quality standard
finish, 24-hour access and security. Soft criteria: high speed modern lifts, clear ceiling
height of at least 2.70 m, prestige/quality reception area, flexible partitioning, high quality
architectural design, services in the building / immediate vicinity, power-supply back-up, dou-
ble-glazed windows / anti-glare glass, restaurant/canteen, quality finish to working areas.
Budapest Research Forum (BRF): It was established in 2000 and currently include the fol-
lowing members: CB Richard Ellis, Colliers, Cushman & Wakefield, DTZ, Eston, GVA Robertson,
Jones Lang LaSalle. The aim of BRF is to represent a regulated framework where the leading
property advisors can discuss the problems related to the Budapest property market, share
and analyse market information.

RIRIRICSCSCS ––– tttthehehehe RRRRoyoyoyoyoyalalalalal IIIIInsnsnsnsnstitititititutututututititt on of f Chhararartetetetetererererer ddddd SuSuSuSuSurrrveyororororors s s s s –– was created in 181818686868 iiinnn thttheee UnUnUnititittedededee KKKKKinininningdgdgdgdgdomoomomom. ItItt receceiiveveved d d d d a a a a a rorororooyayyyy l l l chchchchcharaaaa ter in 1881.
RIRIRICSCSCS mmmemememmbebebebersrsrsrs aaaaarerererere kkkkknononononownwnwnwnw aaaaasss s s chchchhhaararara teteterereeddd suuuurvrvrvvveyeyeyeyeyororororors,s,s, and are recececece ogogogogogogninininin sesesesesesedddddddbybyby ttthehehe dddesesesigigignanananatitittionononn aaaaftftftf ererer tttheheheeeiriririr nnnnnamamamamame ee ––– FRFRFRICICICS S S (f(f(f(f(fororororo FFFFFeleeeelloloow ww w w ofofofofof RRRRRICICICICCS)S)S)S)S) or MRMRMRICICICS S S (f(f(fororor MMMMemememembebebebeer rrrr ofofofff RRICCCS)S)S)...
ToToTodadaday y y RIRIRICSCSCS iiisss aaa glglglglobobobbal pprororororopepepertrrrr y profoffffesesesesessisisisis onononoo alaa bboddody y y y y wwiwiwiw ththththth 110000 ,000quququalalalifififieieied d d mememembmbmbererers ss ininin oovevevevever r rr 10100000 cooountrrrtrrieieeieesss.ss TTThehehe kkkeyeyey rrrrrolololololeseseses ooooof ff RICS are tototo rrregegegulululatatatee e anananddd pprp omomomomototototteeeee tthththt e prprprofesesessis ononononon, , , mamamamm ininintataaininn ttthehehehehe hhhhhigigigiggheheheheheststststt eeeeedududududu---cacacatititionononalalal aaandndnd ppprororofefefessssssioioioionanananallll stststandards, ppprororororotetetetetectctct ccclililienee tststss aaaandndndndnd ccconononononsus mersthththrororougugugh h h a a a stststriririctctct cccododode e e off eeeethththt ici s and dd prrovvovovvididdiddeeeee imimimpapapartrtrtiaii l adadadddvivvivivicecececec , ,, , , anaaaa alysis anananddd guguguidididananancecece
ChChChararartetetererereddd sususurvrvrveyeyeyorororss s hehehelpplp ttttoo sususuusuststss aiaiaia nnn ththhthheeee ususussse e e e e ofofof lllanannd dd ana d d unnnnunlololololockckckkk the lololongngng tttererermmm vavavalululueee ofofof ppprororopepepertrtrty.y. TTThehehehehey yy y y arararrreeeee kkekekekey y y totototoo eeeffffficicciieientn mmarkeeetststss iiiin nnn nlalalandndnd, , , prprpropopopererertytyty aaandndnd ttthehehe eeenvnvnvirrrrononononmemeemementntntntnt wwwwwiititithohohoutututtt wwhihh ch importantntn wwwwworororororldldldldld ecece onononomomomieieies s s wowowoulululddd nononot tt bebebe aaablblblb e eee totototo ffffunununununctctctcc ioioionnn efefeffeffefefffectc ivvely.yy
AnAnA nanana OOOrcrcrcsisisik,k,k, RRRegegegioioionananal l l MaMaManananagegeg r r r ––– RIRIRIRICSCSCSS CCCCenenenee trtrtrttralalaalal & Eastern EuropeE:E:E aaaororo cscssikikk@r@[email protected] g g W:W:W: wwwwwwwww.r.r.ricicicsss.orororg/g//eueueuurororopepepepep
Portfolio.hu–RICS–ELTINGA Market Sentiment Survey | H2 2014

• Csanád Csűrös – Portfolio, Business Development Director
• Krisztián Hornok MRICS – Transaction Director, Indotek Group
• Áron Horváth – ELTINGA
• Jaroslav Kopac MRICS – Jones Lang LaSalle Kft. National Director – Head of Valuation Hungary
• György Lindwurm MRICS – DTZ Hungary Kft. Associate Director – Investment
• Aliz McLean – ELTINGA
• Edina Winkler MRICS – DTZ Hungary Kft. Senior Surveyor – Valuation, RICS Hungary Board Member
Contributors