Embed Size (px)
Citation preview

[12:29 10/8/2017 RFS-hhx010.tex] Page: 2972 2972–3008
Market Segmentation and DifferentialReactions of Local and Foreign Investors toAnalyst Recommendations
Chunxin JiaGuanghua School of Management, Peking University
Yaping WangGuanghua School of Management, Peking University
Wei XiongPrinceton University, CUHK Shenzhen, and NBER
This paper uses segmented dual-class shares of Chinese firms—A shares traded in mainlandChina by local investors and H shares traded in Hong Kong by foreign investors—todocument a rich pattern in the differential reactions of local and foreign investors toanalyst recommendations. This pattern reveals that social connections between analysts andinvestors affect investor reactions to analyst recommendations. Because of the investors’differential reactions, analyst recommendations may exacerbate, rather than attenuate, themarket segmentation between the two share classes. (JEL G02, G15)
Received January 28, 2016; editorial decision October 23, 2016 by Editor Robin Greenwood.
A large literature in international finance documents persistent and substantialprice deviations between dual-class shares issued by the same firms to localand foreign investors in segmented markets, for example, Bailey and Jagtiani(1994) and Stulz and Wasserfallen (1995). A common explanation of such pricedeviations is the difference in discount rates of local and foreign investorsdue to their different risk exposures and preferences. In this paper, we exploredifferential reactions of local and foreign investors to analyst recommendationsas a new explanation to the price deviations between dual-class shares.
We would like to thank Snehal Banerjee, Feng Li, Roger Loh, Christopher Parsons, Jun Qian, Nancy Qian,Paola Sapienza, Andrei Shleifer, Rene Stulz, and Luigi Zingales and the seminar participants at AmericanEconomic Association Meetings, CKGSB, Hong Kong University, Mitsui Finance Symposium at Universityof Michigan, NBER Behavioral Finance Meeting, NBER Conference on Chinese Economy, Peking University,SAC, Stanford China Conference, and Tulane for helpful comments and encouragement. We are particularlygrateful to Robin Greenwood (the editor) and two anonymous referees for numerous constructive commentsand suggestions. Chunxin Jia and Yaping Wang acknowledge financial support from Natural Science Foundationof China (71673006 and 71272037). Please send correspondence to Wei Xiong, Bendheim Center for Finance,Princeton University, Princeton, NJ 08540; telephone: 609-258-0282. E-mail: [email protected].
© The Author 2017. Published by Oxford University Press on behalf of The Society for Financial Studies.All rights reserved. For Permissions, please e-mail: [email protected]:10.1093/rfs/hhx010 Advance Access publication March 11, 2017
Downloaded from https://academic.oup.com/rfs/article-abstract/30/9/2972/3056946/Market-Segmentation-and-Differential-Reactions-ofby Princeton University useron 08 September 2017

[12:29 10/8/2017 RFS-hhx010.tex] Page: 2973 2972–3008
Market Segmentation and Differential Reactions
Our study is also motivated by the growing strand of the finance literaturethat argues investors may agree to disagree about the same public informationand react differently. Building on this premise, this literature, for example,Harris and Raviv (1993), Kandel and Pearson (1995), Scheinkman and Xiong(2003), Dumas, Kurshev, and Uppal (2009), Cao and Ou-yang (2009), andDumas, Lewis, and Osambela (2016), develops a series of models to explain ahost of asset market phenomena, such as speculative bubbles, excessive trading,excessive asset price volatility, and volatile international equity flow.1 However,what causes investors to react to public information differently remains elusive.
This paper takes advantage of a unique setting of segmented dual-classshares issued by a set of Chinese firms to analyze differential reactions oftwo groups of investors to analyst recommendations, as well as how analystrecommendations affect the market segmentation of the share classes. Severaldozen Chinese firms have simultaneously listed their shares in mainland China(i.e., China, excluding Hong Kong, Macau, and Taiwan) in the Shanghaiand Shenzhen Stock Exchanges and outside in the Stock Exchange of HongKong (SEHK). While Hong Kong officially returned to China in 1997 fromBritish colonization, it has an autonomous government and a financial systemindependent of the mainland’s. China’s capital controls prevent capital fromfreely moving between the mainland and outside (including Hong Kong). Thecapital controls result in segmentation of A and H shares and make the SEHKa hub for investment in Chinese stocks by foreign investors.
We refer to A share investors, who are primarily residents of the mainland, as“local” and H share investors, who are a mix of investors from Hong Kong andother parts of the world, as “foreign.” As the A and H shares have the same cashflow and voting rights, their prices separately reflect the beliefs and preferencesof the local and foreign investors. These dually listed shares are also coveredby financial analysts of brokerage houses in and out of mainland China, whichwe refer to as local and foreign houses, respectively.
This setting allows us to examine how social connections between investorsand analysts can affect investor reactions to analyst recommendations. Local(foreign) analysts are socially closer to local (foreign) investors and thusmay have an advantage in catering to local (foreign) investors by betterrelating their reports to particular concerns and excitements of local (foreign)investors. Such catering behavior in turn breeds trust among local (foreign)investors for the recommendations made by local (foreign) analysts. Theseintermingled mechanisms can work together and jointly lead to a socialconnection effect—local investors more strongly react than foreign investors tothe recommendations provided by local analysts, while foreign investors morestrongly react than local investors to the recommendations provided by foreignanalysts.
1 See Hong and Stein (2007) and Xiong (2012) for more detailed reviews of this literature.
2973
Downloaded from https://academic.oup.com/rfs/article-abstract/30/9/2972/3056946/Market-Segmentation-and-Differential-Reactions-ofby Princeton University useron 08 September 2017

[12:29 10/8/2017 RFS-hhx010.tex] Page: 2974 2972–3008
The Review of Financial Studies / v 30 n 9 2017
The following example illustrates the relevance of this social connectioneffect. In June 2011, American analysts of Muddy Waters Research and CitronResearch released a series of reports on a number of Chinese firms, includingSino Forest Corporation listed on Toronto Stock Exchange and Harbin Electriclisted on NASDAQ, accusing them of accounting frauds. These reports hadled to not only large stock price crashes of the firms being accused but alsosubstantial price declines of all Chinese stocks listed on NASDAQ by as muchas 15% in June 2011. In sharp contrast to the dramatic reaction of NASDAQinvestors, investors in China hardly reacted to these reports, which were widelycirculated by financial news media in China. Many Chinese investors believedthat these overseas analysts were vicious and had exaggerated their cases againstthe Chinese firms.2 As a result, stock prices traded in China barely budgedduring this period.
We use an event-study approach to compare daily price reactions of the duallylisted A and H shares to a large sample of recommendation changes made byanalysts of local and foreign houses. To guide our analysis, we also develop asimple framework, which incorporates not only the social connection effect butalso two additional effects previously emphasized by the literature. One is thatlocal investors are better informed than foreign investors about home assets dueto their superior private information, for example, Gehrig (1993) and Brennanand Cao (1997), and the other is that local analysts have better informationquality than foreign analysts due to their lower information collection cost, forexample, Bae, Stulz, and Tan (2008) and Du, Yu, and Yu (2014).
We find rich patterns in the differential reactions of A share and H shareinvestors. For example, A share prices have significantly stronger reactionsto recommendation changes made by analysts of local houses than those byanalysts of foreign houses, which is driven by the joint effect of A shareinvestors having closer connections to local analysts than to foreign analystsand local analysts having better information than foreign analysts. We also findthat H share prices have significantly stronger reactions than A share prices torecommendation changes made by analysts of foreign houses, which is drivenby the joint effect of H share investors having closer connections than A shareinvestors to foreign analysts and H share investors being less informed than Ashare investors about Chinese firms.
To isolate the social connection effect from the other effects, we adopt adifference-in-differences approach. Specifically, by comparing the differentialreactions of A share and H share investors to recommendations made by localand foreign analysts, we are able to control the effects of A share investorsbeing better informed and local analysts having better information quality. We
2 Lee, Li, and Zhang (2015) systematically examine the financial health and performance of Chinese reverse mergerfirms on the U.S. stock markets between 2001 and 2010, the main targets in these accusations, and find that theytend to be more mature and less speculative than either their U.S. counterparts or a group of exchange-industrysize-matched firms. As a group, Chinese reverse merger firms outperformed their matched peers from inceptionthrough the end of 2013, even after including most of the firms accused of accounting fraud.
2974
Downloaded from https://academic.oup.com/rfs/article-abstract/30/9/2972/3056946/Market-Segmentation-and-Differential-Reactions-ofby Princeton University useron 08 September 2017

[12:29 10/8/2017 RFS-hhx010.tex] Page: 2975 2972–3008
Market Segmentation and Differential Reactions
find that the differential reactions of A share investors to recommendationsmade by local and foreign analysts is indeed significantly greater than thedifferential reactions of H share investors, which supports the presence ofthe social connection effect in driving the differential reactions of A shareand H share investors to the analyst recommendations. This finding thus addsa new mechanism to the understanding of investors’ heterogeneous beliefsin asset markets, in addition to heterogeneous beliefs caused by investoroverconfidence, for example, Scheinkman and Xiong (2003).
To ensure the robustness of our findings, we use three different price reactionmeasures: (1) cumulative abnormal return; (2) cumulative abnormal returndeflated by idiosyncratic return volatility; and (3) whether a recommendationchange is influential, as suggested by Loh and Stulz (2011). All three measuresgive consistent results across our analyses. We also take advantage of twospecial subsamples of the data to further isolate potential effects caused byunobservable characteristics. First, a subset of the recommendation changes inour sample were paired with one for the A share market and the other for the Hshare market. As these paired recommendations were made by the same housefor the same firm on the same date, they allow us to control for all firm specificand analyst specific characteristics, which may not be fully captured by thecontrol variables used in our main analysis. Second, a set of foreign housesin our sample hired both Chinese and non-Chinese analysts to cover Chinesefirms. By comparing price reactions of A and H shares to recommendationsmade by Chinese and non-Chinese analysts of the same foreign houses, we canfurther control for an argument about A share and H share investors havingdifferential access to reports of local and foreign houses.
Finally, we analyze how analyst recommendations affect the marketsegmentation between the two classes of shares. This effect may depend on twooffsetting forces. On one hand, the information from analyst recommendationsmakes the prices of both share classes closer to the firm fundamentals and thuscomove more with each other; on the other, the differential reactions of A shareand H share investors to analyst recommendations lower the return correlationbetween the two share classes. Interestingly, we find that a firm with moreanalyst recommendations tends to have a lower return correlation between itstwo share classes. In other words, analyst recommendations exacerbate ratherthan attenuate the market segmentation between the two share classes due tothe investors’ differential reactions.
1. Related Literature
Besides the aforementioned literature on heterogeneous beliefs in asset markets,our finding also adds to the understanding of the heterogeneity between localand foreign investors, which is critical for understanding several central issuesin international finance, such as home bias and dynamics of international equity
2975
Downloaded from https://academic.oup.com/rfs/article-abstract/30/9/2972/3056946/Market-Segmentation-and-Differential-Reactions-ofby Princeton University useron 08 September 2017
[12:29 10/8/2017 RFS-hhx010.tex] Page: 2976 2972–3008
The Review of Financial Studies / v 30 n 9 2017
flow.3 French and Poterba (1991) and Shiller, Kon-Ya, and Tsutsui (1991)attribute home bias to local investors’ optimism about home equity returns.Dornbusch and Park (1995) and Radelet and Sachs (2000) argue that foreigninvestors tend to overreact to changes in local fundamentals and the resultingcapital inflows and outflows can destabilize local economies. Our analysishighlights social connections as a new factor, in addition to the well-knowninformation asymmetry between local and foreign investors, in determiningthe optimism of local investors and the overreactions of foreign investors.
An extensive empirical literature analyzes the price differentials of twinshares and dual-class shares. Froot and Dabora (1999) highlight market-sentiment shocks as an explanation of persistent and substantial price deviationsbetween twin shares issued by three companies. Stulz and Wasserfallen (1995)and Bailey and Jagtiani (1994) examine price deviations of dual-class sharesissued by Swiss and Thai firms to local and foreign investors, and emphasizedifferences between the risk exposures of local and foreign investors as akey driver of the price deviations. Several prior studies, for example, Fernaldand Rogers (2002), Chen and Xiong (2002), Karolyi and Li (2003), Chan,Menkveld, andYang (2008), and Mei, Scheinkman, and Xiong (2009), have alsoexamined the substantial price deviations between different classes of sharesissued by Chinese firms to local and foreign investors. These studies attributethe price deviations to differences in investment opportunity sets, liquidity,and speculative trading motives of local and foreign investors. In contrast tothese studies, which are primarily concerned with the differential price levelsof twin shares and dual-class shares, we use an event-study approach to analyzedifferential price reactions ofAand H shares to analyst recommendations. In thisregard, our analysis also differs from the literature on the improved informationenvironment of individual stocks induced by cross listing, for example, Baker,Nofsinger, and Weaver (2002), Lang, Lins, and Miller (2003), and Bailey,Karolyi, and Salva (2006).
Our analysis also differs in emphasis from the literature that highlightsproximity as an important determinant of the accuracy of analyst earningsforecast. Bae, Stulz, and Tan (2008) find that analysts reside in a country makemore precise earnings forecasts for firms in that country than analysts whoare not resident in that country. Furthermore, Du, Yu, and Yu (2014) findthat among U.S. analysts who cover Chinese firms listed in the U.S. stockmarkets, analysts with Chinese ethnic origin provide more accurate forecaststhan analysts without Chinese origin. In contrast, our analysis compares thereactions of local and foreign investors after controlling for the differentialinformation between local and foreign analysts.
3 See Lewis (2011) and Coeurdacier and Rey (2012) for reviews of the extensive literature related to these issues.
2976
Downloaded from https://academic.oup.com/rfs/article-abstract/30/9/2972/3056946/Market-Segmentation-and-Differential-Reactions-ofby Princeton University useron 08 September 2017
[12:29 10/8/2017 RFS-hhx010.tex] Page: 2977 2972–3008
Market Segmentation and Differential Reactions
2. Segmented Pairs of A and H Shares
2.1 Institutional backgroundChina established the Shanghai Stock Exchange and the Shenzhen StockExchange in 1990 and 1991, respectively, to list stocks issued by Chinesefirms. Since then, the Chinese stock markets have had rapid growth. By the endof 2013, these two stock exchanges listed stocks issued by 2489 firms, witha total market capitalization of 23.9 trillion RMB (3.92 trillion U.S. dollars),which represented 41% of China’s GDP in 2013. The vast majority (2468 outof the 2489) of the firms issued the so-called “A shares,” which were traded inRMB and only by Chinese residents.4
Many Chinese firms have also chosen to list their stocks outside mainlandChina, in places such as Hong Kong, New York, Singapore, and London. Due toits geographical proximity to the mainland, the Stock Exchange of Hong Kong(SEHK) is often the first choice when a Chinese firm decides to list overseas.Shares issued by Chinese firms in the SEHK are often called H shares. H shareswere first listed by a Chinese firm in 1993. By the end of 2013, 181 Chinesefirms had listed their H shares, with a total market value of 4.91 trillion HongKong dollars, accounting for 20.4% of the market capitalization of the SEHK.
Interestingly, a set of firms issued both A and H shares. These dually listedshares are the main sample of our analysis. A and H shares of these firms offerthe same voting and cash-flow rights. The three stock exchanges involved inlisting these shares all required the firms to disclose identical information toinvestors, including those in and out of mainland China.
During our sample period, China imposed stringent capital controls, whichprevented local and foreign investors from freely moving capital across itsborders. As a result, local investors could not simply move capital to HongKong to trade H shares; neither could foreign investors move capital to themainland to trade A shares. As A shares were traded only in the mainlandand H shares were not traded in Mainland China, the capital controls had ledto segmentation of the dually listed A and H shares, which, in turn, made itdifficult for people to arbitrage any price deviation between them.5 Instead, the
4 Only a small fraction of these firms (106 out of the full set of 2,489 firms) issued the so-called “B shares,” whichwere traded in foreign currency, specifically in US dollars on the Shanghai Stock Exchange and in Hong Kongdollars on the Shenzhen Stock Exchange. Before February 2001,Ashares were restricted to Chinese residents, andB shares were restricted to foreign investors. After February 2001, the Chinese government relaxed the restrictionon B shares by allowing Chinese residents with foreign currency to legally trade B shares, while maintaining therestriction on A shares. Also note that some firms issued both A and B shares. See Mei, Scheinkman, and Xiong(2009) for a study of the price differential between A and B shares issued by these firms.
5 Several exceptions to the capital controls exist. In 2002, China introduced a program called Qualified ForeignInstitutional Investors (QFIIs), which allowed a selected group of foreign institutions to invest in financial assetsin mainland China, subject to quotas set by the China Securities Regulatory Commission (CSRC). In 2011,China introduced RMB QFII, which mainly allowed Chinese firms collecting RMB outside China to invest inthe mainland securities market. By the end of 2013, the number of QFIIs and RQFIIs totaled 251 and 61, witha total investment value of 49.7 billion U.S. dollars, and 157.5 billion RMB, respectively, which were minorrelative to the market capitalization of China’s securities markets. In 2007, China launched another programcalled Qualified Domestic Institutional Investors (QDIIs), which allowed a group of domestic institutions to
2977
Downloaded from https://academic.oup.com/rfs/article-abstract/30/9/2972/3056946/Market-Segmentation-and-Differential-Reactions-ofby Princeton University useron 08 September 2017
[12:29 10/8/2017 RFS-hhx010.tex] Page: 2978 2972–3008
The Review of Financial Studies / v 30 n 9 2017
prices of A and H shares reflected risk preferences and beliefs of two groups ofinvestors in and out of mainland China.
Investors in mainland China were predominantly local individuals orinstitutions. In contrast, investors in the SEHK came from all over the world.Based on the survey data released by Hong Kong Exchange Clearing Limited(HKEx), which owned the SEHK, during the 12-month period from October2010 to September 2011, investors from Hong Kong contributed to only 42%of the SEHK’s total trading volume, among which 20% was from institutionalinvestors and 22% was from retail investors, while investors from outside HongKong contributed to 46% of the trading volume, among which 42% was frominstitutional investors and 4% was from retail investors.6 The remaining 12%of the trading volume was by dealers. Within the trading volume by overseasinvestors, the fractions of investors from the United States, the United Kingdom,continental Europe, and mainland China were 28%, 27%, 14%, and 10%,respectively.7 The relatively minor contribution of investors from mainlandChina reflected China’s restrictive capital controls that prevented its residentsfrom trading shares listed in Hong Kong.
2.2 Summary statisticsOur data sample spans January 1, 2007 to October 31, 2014. We choose to startthe sample in 2007 because China completed an important stock market reformin 2006, which allowed previously nontradable state and enterprise shares tobecome tradable. We obtained daily closing stock prices of the pairs of A and Hshares from CSMAR (for A shares) and WIND (for H shares). Figure 1 showsthat the number of A-H pairs increased over time from 37 on January 1, 2007to 86 on October 31, 2014. There is no delisting of any A or H shares in thissample.8
The firms that issued these pairs of A and H shares were typically blue-chip companies from key industries of China, such as energy, electric power,manufacturing, banking, and finance industries. The list of companies includesIndustrial and Commercial Bank of China, China Construction Bank, Bank
invest in securities outside mainland China, including stocks traded in Hong Kong, again subject to quotas setby the CSRC. By the end of 2013, there were 83 QDIIs, with a total net asset value of merely 58.8 billion RMB.After November 2014, the Chinese government further relaxed the capital controls as part of its effort to qualifyRMB for the Special Drawing Rights (SDRs) of International Monetary Fund through various channels, such asestablishing the Hong Kong-Shanghai direct shuttle program. This program allows investors of Stock Exchangeof Hong Kong to buy A shares in Shanghai Stock Exchange and investors of Shanghai Stock Exchange to buyH shares in Stock Exchange of Hong Kong, albeit under certain quotas.
6 See the HKEx Web site at http://www.hkex.com.hk/eng/stat/statrpt/factbook/factbook2011/Documents/32.pdf.
7 Beyond the investment flows to H shares via the QDII program, Hong Kong also hosts a group of mainlandresidents who regularly travel to Hong Kong for business and other purposes and who are thus able to invest inH shares.
8 Among the 86 A-H pairs, 17 listed their A shares on the Shenzhen Stock Exchange and 69 on the Shanghai StockExchange. Furthermore, 62 of them had H shares listed before A shares, 22 had A shares listed before their Hshares, and only 2 had the exact same listing date for both A and H shares.
2978
Downloaded from https://academic.oup.com/rfs/article-abstract/30/9/2972/3056946/Market-Segmentation-and-Differential-Reactions-ofby Princeton University useron 08 September 2017

[12:29 10/8/2017 RFS-hhx010.tex] Page: 2979 2972–3008
Market Segmentation and Differential Reactions
0
10
20
30
40
50
60
70
80
90
100
0
0.2
0.4
0.6
0.8
1
1.2
1.4
1.6
1.8
2
2007/1/1 2008/1/1 2009/1/1 2010/1/1 2011/1/1 2012/1/1 2013/1/1 2014/1/1
A/H price ra�o # of pairs
Figure 1Number of pairs and average price ratio of A shares to H sharesThe dotted line with the scale on the right is the number of pairs of A and H shares issued by Chinese firms. Thesolid line with the scale on the left is the average price ratio of A shares and H shares, weighted across differentpairs by the total market value of each pair’s A and H shares.
of China, and Agricultural Bank of China (the four largest banks), China Lifeand Ping An Insurance (the two largest insurance companies), Petro China andSinopec (the two largest energy companies), China Southern Airlines, ChinaEastern Airlines, and Air China (the three largest airlines).
The prices of these paired A and H shares could substantially deviate fromeach other. Figure 1 plots the average price ratio of A shares to H shares, valueweighted across all available pairs. The average price ratio mostly stayed in arange between 1 and 2 during the sample period. This price deviation reflects theaforementioned segmentation of A and H markets. The literature, as referencedin Section 1, has pointed out that many factors, such as differences in investmentopportunity sets, risk exposure, risk preferences, and sentiment of the A shareand H share investors, might have contributed to this price deviation. Our studyfocuses on analyzing the differential price reactions ofAand H shares to analystrecommendations rather than the differences in their price levels.
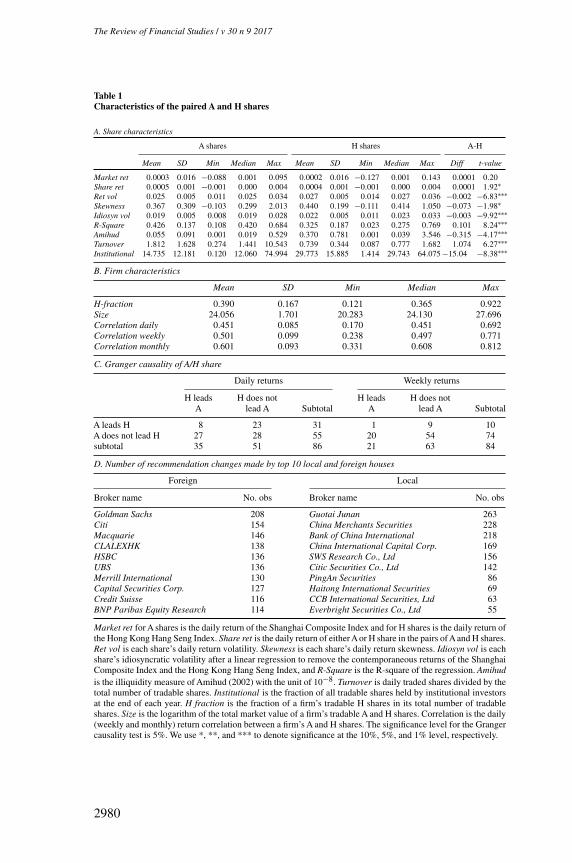
Table 1 reports the summary statistics of the pairs ofAand H shares. There areseveral notable points. First, the daily returns of A shares are less volatile thanthose of the corresponding H shares. Second, the returns of both A and H shareshave positive skewness, with the skewness of H shares significantly larger thanthat of A shares. Third, A shares are more liquid based on two measures ofliquidity: turnover rate and the illiquidity measure of Amihud (2002), which isgiven by absolute value of daily return divided by daily trading volume. Fourth,the fraction of tradable shares held by institutional investors is about 14.74%for A shares, lower than that of 29.77% for H shares.
Panel B of Table 1 shows that the number of tradable H shares is slightly lessthan that of the corresponding A shares, with H shares on average contributing
2979
Downloaded from https://academic.oup.com/rfs/article-abstract/30/9/2972/3056946/Market-Segmentation-and-Differential-Reactions-ofby Princeton University useron 08 September 2017
[12:29 10/8/2017 RFS-hhx010.tex] Page: 2980 2972–3008
The Review of Financial Studies / v 30 n 9 2017
Table 1Characteristics of the paired A and H shares
A. Share characteristics
A shares H shares A-H
Mean SD Min Median Max Mean SD Min Median Max Diff t-value
Market ret 0.0003 0.016 −0.088 0.001 0.095 0.0002 0.016 −0.127 0.001 0.143 0.0001 0.20Share ret 0.0005 0.001 −0.001 0.000 0.004 0.0004 0.001 −0.001 0.000 0.004 0.0001 1.92∗Ret vol 0.025 0.005 0.011 0.025 0.034 0.027 0.005 0.014 0.027 0.036 −0.002 −6.83∗∗∗Skewness 0.367 0.309 −0.103 0.299 2.013 0.440 0.199 −0.111 0.414 1.050 −0.073 −1.98∗Idiosyn vol 0.019 0.005 0.008 0.019 0.028 0.022 0.005 0.011 0.023 0.033 −0.003 −9.92∗∗∗R-Square 0.426 0.137 0.108 0.420 0.684 0.325 0.187 0.023 0.275 0.769 0.101 8.24∗∗∗Amihud 0.055 0.091 0.001 0.019 0.529 0.370 0.781 0.001 0.039 3.546 −0.315 −4.17∗∗∗Turnover 1.812 1.628 0.274 1.441 10.543 0.739 0.344 0.087 0.777 1.682 1.074 6.27∗∗∗Institutional 14.735 12.181 0.120 12.060 74.994 29.773 15.885 1.414 29.743 64.075 −15.04 −8.38∗∗∗
B. Firm characteristics
Mean SD Min Median Max
H-fraction 0.390 0.167 0.121 0.365 0.922Size 24.056 1.701 20.283 24.130 27.696Correlation daily 0.451 0.085 0.170 0.451 0.692Correlation weekly 0.501 0.099 0.238 0.497 0.771Correlation monthly 0.601 0.093 0.331 0.608 0.812
C. Granger causality of A/H share
Daily returns Weekly returns
H leads H does not H leads H does notA lead A Subtotal A lead A Subtotal
A leads H 8 23 31 1 9 10A does not lead H 27 28 55 20 54 74subtotal 35 51 86 21 63 84
D. Number of recommendation changes made by top 10 local and foreign houses
Foreign Local
Broker name No. obs Broker name No. obs
Goldman Sachs 208 Guotai Junan 263Citi 154 China Merchants Securities 228Macquarie 146 Bank of China International 218CLALEXHK 138 China International Capital Corp. 169HSBC 136 SWS Research Co., Ltd 156UBS 136 Citic Securities Co., Ltd 142Merrill International 130 PingAn Securities 86Capital Securities Corp. 127 Haitong International Securities 69Credit Suisse 116 CCB International Securities, Ltd 63BNP Paribas Equity Research 114 Everbright Securities Co., Ltd 55
Market ret for A shares is the daily return of the Shanghai Composite Index and for H shares is the daily return ofthe Hong Kong Hang Seng Index. Share ret is the daily return of either A or H share in the pairs of A and H shares.Ret vol is each share’s daily return volatility. Skewness is each share’s daily return skewness. Idiosyn vol is eachshare’s idiosyncratic volatility after a linear regression to remove the contemporaneous returns of the ShanghaiComposite Index and the Hong Kong Hang Seng Index, and R-Square is the R-square of the regression. Amihudis the illiquidity measure of Amihud (2002) with the unit of 10−8. Turnover is daily traded shares divided by thetotal number of tradable shares. Institutional is the fraction of all tradable shares held by institutional investorsat the end of each year. H fraction is the fraction of a firm’s tradable H shares in its total number of tradableshares. Size is the logarithm of the total market value of a firm’s tradable A and H shares. Correlation is the daily(weekly and monthly) return correlation between a firm’s A and H shares. The significance level for the Grangercausality test is 5%. We use *, **, and *** to denote significance at the 10%, 5%, and 1% level, respectively.
2980
Downloaded from https://academic.oup.com/rfs/article-abstract/30/9/2972/3056946/Market-Segmentation-and-Differential-Reactions-ofby Princeton University useron 08 September 2017

[12:29 10/8/2017 RFS-hhx010.tex] Page: 2981 2972–3008
Market Segmentation and Differential Reactions
to 39% of the total number of tradable A and H shares across all pairs. Thedaily returns of the pairs of A and H shares have an average correlation of0.451, the weekly returns of the pairs of A and H shares have an averagecorrelation of 0.501, and the monthly returns have an average correlation of0.601. The increased correlation over longer horizons suggests that A share andH share prices become more integrated over longer terms despite the marketsegmentation.
In the left section of panel C in Table 1, we report the lead-lag relationshipbetween the daily returns of A and H shares. Among the 86 firms in our sampleand conditional on 5% significance level, 28 firms have no Granger causality ineither direction, 31 firms have A share returns Granger causing H share returns,35 firms have H share returns Granger causing A share returns, and 8 firmshave Granger causality in both directions. The right section of panel C furtherreports the lead-lag relationship in weekly returns: 54 firms with no Grangercausality in either direction, 10 firms with A share returns Granger causing Hshare returns, 21 firms with H share returns Granger causing A share returns,and 1 firm with Granger causality in both directions. Overall, if we interpretGranger causality as a reflection of the direction of information flow, this panelshows that information flows symmetrically between the prices of A and Hshares. Furthermore, the weaker lead-lag relationship in weekly returns thanin daily returns suggests that information flows across the A share and H sharemarkets at a frequency faster than weekly frequency.
3. Data Sample of Analyst Recommendations
The segmented pairs of A and H shares offer a unique opportunity to analyzehow investors in and out of mainland China react to public news. We focuson comparing their reactions to analyst recommendations issued by a set ofbrokerage and research firms, which we simply call houses and which coverboth A share and H share markets.9 We collect analyst recommendations issuedbetween January 1, 2007 and October 31, 2014, for the 86 firms with pairs ofA and H shares from I/B/E/S and Bloomberg. The initial sample has 38867recommendations made by 117 houses.
An analyst report typically contains an earnings forecast for the firm, togetherwith a recommendation to investors regarding whether to buy or sell the firm’sstocks. As each firm in our sample has both A and H shares, traded by two
9 As the information transmitted by these announcements is firm specific, it has minimal implications for investors’aggregate wealth and consumption. That is, it does not affect the discount rates of A share and H share investors.To the extent that A share and H share investors face different investment opportunities and market risks, it ispossible that they use different discount rates to evaluate the same stock investment and that the difference intheir discount rates is an important factor driving the aforementioned large price deviations between the pairsof A and H shares. By comparing price reactions of A and H shares to firm-specific news announcements, weisolate the heterogeneity in the discount rates of A share and H share investors from our analysis of the beliefrevisions induced by the news among the two groups. Furthermore, we ignore the heterogeneity within each ofthese groups by treating both A share and H share investors as homogenous groups.
2981
Downloaded from https://academic.oup.com/rfs/article-abstract/30/9/2972/3056946/Market-Segmentation-and-Differential-Reactions-ofby Princeton University useron 08 September 2017

[12:29 10/8/2017 RFS-hhx010.tex] Page: 2982 2972–3008
The Review of Financial Studies / v 30 n 9 2017
different sets of investors, it is common for a house to issue a report specificallyon one class of shares (say A shares) of a firm, which is targeted to investors ofthe share class. Such a report may or may not be accompanied by a simultaneousreport by the same house on the other share class of the firm. The timing of thereports on the two classes of shares is driven by the needs of the house to serveits clients in the two markets.
By focusing on recommendations issued by houses that cover both A andH shares, we can compare the reactions of A share and H share investors tothe recommendation changes made by the same house. In other words, whenan analyst of a house issues an upgrade to the A share market and anotherupgrade to the H share market, we can compare the price reactions of the twomarkets. We will later discuss a variety of factors that may affect the reactionsof the two markets. In particular, we are interested in examining whether socialconnections between the analyst and investors in A share and H share marketsmay cause them to react differently.
In addition to the heterogeneity between A share and H share investors, wealso explore another dimension of heterogeneity between local and foreignanalysts. Our analysis builds on a simple notion that A share investors havecloser connections to local analysts than foreign analysts, while H shareinvestors have closer connections to foreign analysts than local analysts. Thisnotion motivates us to compare the A share (or H share) price reactions torecommendation changes made by local and foreign analysts, and comparethe price reactions of A and H shares to recommendation changes by local (orforeign) analysts. Furthermore, we will also perform a type of difference-in-differences analysis by examining whether the differential price reactions ofA shares to recommendation changes of local and foreign analysts are greaterthan that of H shares.
We count a house as local if its controlling shareholders are Chinesecorporations, and as foreign otherwise. For most of the analysis, we treatanalysts working for local houses as local analysts and those working for foreignhouses as foreign analysts. In Section 5.4, we will further divide analysts offoreign houses into Chinese and non-Chinese based on their names.
Following the literature, we analyze stock price reaction if there is a change inanalyst recommendation issued to a specific share class. While different brokerswill use different rating scales, Bloomberg and I/B/E/S have standardized therecommendations in five numerical values of 5, 4, 3, 2, and 1, correspondingto strong buy, buy, hold, sell, and strong sell, respectively. We then calculaterecommendation change as the difference of a recommendation relative tothe same analyst’s previous recommendation within one year. If there is notany previous recommendation in one year, we assign the change to be +1if the current recommendation is strong buy (i.e., recommendation = 5) and−1 if the recommendation is sell or strong sell (i.e., recommendation = 2, 1).We adopt this asymmetric treatment because analysts tend to give favorable
2982
Downloaded from https://academic.oup.com/rfs/article-abstract/30/9/2972/3056946/Market-Segmentation-and-Differential-Reactions-ofby Princeton University useron 08 September 2017
[12:29 10/8/2017 RFS-hhx010.tex] Page: 2983 2972–3008
Market Segmentation and Differential Reactions
recommendations. In our sample, the average recommendation is 3.85, whichis closer to buy than the neutral category of hold.
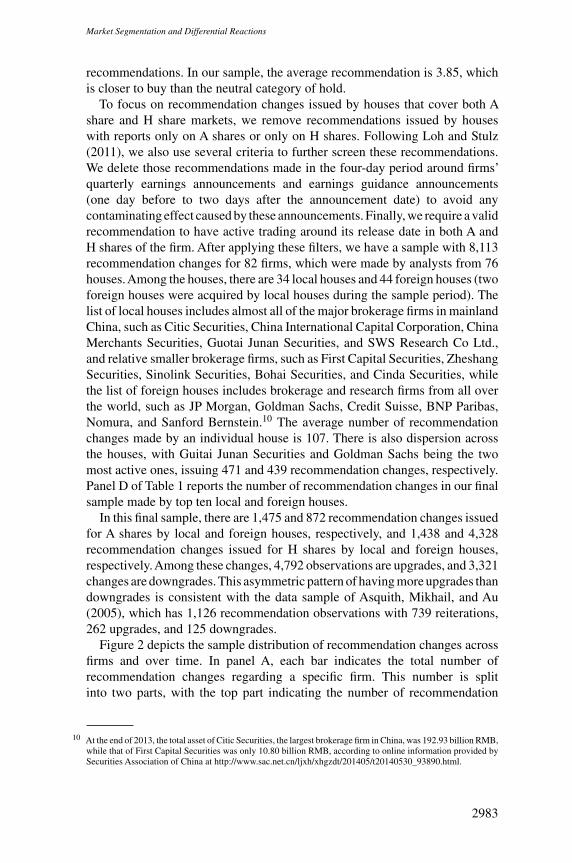
To focus on recommendation changes issued by houses that cover both Ashare and H share markets, we remove recommendations issued by houseswith reports only on A shares or only on H shares. Following Loh and Stulz(2011), we also use several criteria to further screen these recommendations.We delete those recommendations made in the four-day period around firms’quarterly earnings announcements and earnings guidance announcements(one day before to two days after the announcement date) to avoid anycontaminating effect caused by these announcements. Finally, we require a validrecommendation to have active trading around its release date in both A andH shares of the firm. After applying these filters, we have a sample with 8,113recommendation changes for 82 firms, which were made by analysts from 76houses.Among the houses, there are 34 local houses and 44 foreign houses (twoforeign houses were acquired by local houses during the sample period). Thelist of local houses includes almost all of the major brokerage firms in mainlandChina, such as Citic Securities, China International Capital Corporation, ChinaMerchants Securities, Guotai Junan Securities, and SWS Research Co Ltd.,and relative smaller brokerage firms, such as First Capital Securities, ZheshangSecurities, Sinolink Securities, Bohai Securities, and Cinda Securities, whilethe list of foreign houses includes brokerage and research firms from all overthe world, such as JP Morgan, Goldman Sachs, Credit Suisse, BNP Paribas,Nomura, and Sanford Bernstein.10 The average number of recommendationchanges made by an individual house is 107. There is also dispersion acrossthe houses, with Guitai Junan Securities and Goldman Sachs being the twomost active ones, issuing 471 and 439 recommendation changes, respectively.Panel D of Table 1 reports the number of recommendation changes in our finalsample made by top ten local and foreign houses.
In this final sample, there are 1,475 and 872 recommendation changes issuedfor A shares by local and foreign houses, respectively, and 1,438 and 4,328recommendation changes issued for H shares by local and foreign houses,respectively.Among these changes, 4,792 observations are upgrades, and 3,321changes are downgrades. This asymmetric pattern of having more upgrades thandowngrades is consistent with the data sample of Asquith, Mikhail, and Au(2005), which has 1,126 recommendation observations with 739 reiterations,262 upgrades, and 125 downgrades.
Figure 2 depicts the sample distribution of recommendation changes acrossfirms and over time. In panel A, each bar indicates the total number ofrecommendation changes regarding a specific firm. This number is splitinto two parts, with the top part indicating the number of recommendation
10 At the end of 2013, the total asset of Citic Securities, the largest brokerage firm in China, was 192.93 billion RMB,while that of First Capital Securities was only 10.80 billion RMB, according to online information provided bySecurities Association of China at http://www.sac.net.cn/ljxh/xhgzdt/201405/t20140530_93890.html.
2983
Downloaded from https://academic.oup.com/rfs/article-abstract/30/9/2972/3056946/Market-Segmentation-and-Differential-Reactions-ofby Princeton University useron 08 September 2017

[12:29 10/8/2017 RFS-hhx010.tex] Page: 2984 2972–3008
The Review of Financial Studies / v 30 n 9 2017
Figure 2Sample distribution of analyst forecasts across firms and over timeIn panel A, each bar indicates the number of recommendation changes regarding a firm in our sample. In panel B,each bar indicates the number of recommendation changes made in a month. In both panels, the top indicates thenumber of recommendation changes made by local analysts, while the bottom is the number of recommendationchanges made by foreign analysts.
changes issued by local houses, and the bottom part indicating the numberof recommendation changes by foreign houses. There are 82 firms with validrecommendation changes. The number of recommendation changes for a firmranges from 1 to 275. More importantly, the recommendation changes foreach firm are well spread out between local and foreign houses, invalidating aconcern that local houses might follow one set of firms while foreign housesfollow another set. Panel B depicts the sample distribution of recommendation
2984
Downloaded from https://academic.oup.com/rfs/article-abstract/30/9/2972/3056946/Market-Segmentation-and-Differential-Reactions-ofby Princeton University useron 08 September 2017

[12:29 10/8/2017 RFS-hhx010.tex] Page: 2985 2972–3008
Market Segmentation and Differential Reactions
changes over time. The balance of recommendation changes made by local andforeign houses is also stable over time.
4. Hypothesis Development
In this section, we develop a set of hypotheses for analyzing how A share andH share investors react to the recommendations of local and foreign analysts inthe presence of the market segmentation between A share and H share markets.The reaction of group-i investors, where i ∈{A,H } with A referring to A shareinvestors and H to H share investors, to a recommendation made by an analystj ∈{LF }, where L refers to local analysts and F to foreign analysts, may dependon several effects.
First, the literature has long emphasized that local investors might be betterinformed than foreign investors about home firms, for example, Gehrig (1993)and Brennan and Cao (1997). This investor-side effect implies that A shareinvestors are more informed than H share investors about Chinese firms and thusare less responsive to any new information, including analyst recommendations.
Second, the literature has also pointed out the local analysts might havemore accurate information about the firm’s fundamental than foreign analysts,for example, Bae, Stulz, and Tan (2008) and Du, Yu, and Yu (2014). This analystside effect implies stronger reactions to the recommendations of local analyststhan to that of foreign analysts, after controlling for other effects.
Third, investor reaction to analyst recommendation may also depend onthe social connection between the investors and the analyst. Specifically, witha closer connection to A share investors, local analysts have an advantagerelative to foreign analysts in understanding the risk preference and sentimentof A share investors. That is, local analysts may be able to not only providemore informed reports about the business prospect and profitability of Chinesefirms but also better connect their reports to the concerns and sentiment oflocal A share investors. In this sense, local analysts can provide more class-specific information in relation to the local market conditions. Consequently,their recommendations may have better reception than that of foreign analystsamong A share investors. This social connection effect thus implies that A shareinvestors more strongly react to recommendations of local analysts than to thatof foreign analysts, even after controlling for the aforementioned investor andanalyst side effects.
This social connection effect is originated from two distinct yet closelyrelated mechanisms. First, local analysts may be better at catering to A shareinvestors by relating their reports to particular concerns and excitements oflocal investors.11 Second, such catering behavior helps to breed trust of A share
11 As argued by Mullainathan and Shleifer (2005) and Gentzkow and Shapiro (2006), it is a common practice forthe media to slant reports toward the prior beliefs of its customers, and, in contrary to the common wisdom, suchmedia bias helps build, rather than destroy, a media firm’s reputation of quality.
2985
Downloaded from https://academic.oup.com/rfs/article-abstract/30/9/2972/3056946/Market-Segmentation-and-Differential-Reactions-ofby Princeton University useron 08 September 2017

[12:29 10/8/2017 RFS-hhx010.tex] Page: 2986 2972–3008
The Review of Financial Studies / v 30 n 9 2017
investors for local analysts, and similarly trust of H share investors for foreignanalysts.12 As a result, relative to foreign investors, local investors may trustlocal analysts more and regard information provided by local analysts as morereliable.
These aforementioned effects may work along the same or opposite direc-tions in driving the reactions of one group of investors to the recommendationsof one type of analysts. To facilitate our analysis of the investors’ differentialreactions, we adopt a simple linear framework to capture these effects in thereaction of group-i investors to a recommendation of analyst j :
reactioni,j =−α Investori +β Analystj +γ Connectioni,j , (1)
where reactioni,j is the reaction of i-share investors to recommendationprovided by analyst j , Investori is the amount of private information of group-i investors, Analystj is the information quality of analyst j , and Connectioni,j
is a measure of the social distance between investor i and analyst j . Accordingto our earlier discussion, we make the following normalization: Investori=H =0and Investori=A =1, because A share investors are better informed than H shareinvestors. Similarly, we normalize Analystj=L =1 and Analystj=F =0, as therecommendations of local analysts tend to be more informative than those offoreign analysts. Furthermore, we assume that
ConnectionA,L =ConnectionH,F >ConnectionA,F =ConnectionH,L
and normalize the difference between the two levels of social connectionto be one. The standard learning theory would imply that α>0 as H shareinvestors are less informed and have a tendency to more strongly react topublic information, β >0 as local analysts’ recommendations more accurate,and γ >0 as a stronger social connection leads to a stronger reaction.13
Our empirical analysis focuses on comparing the stock price reactions toanalyst recommendations under the four possible investor-analyst pairs in thesegmented market environment for the A and H shares. First, we examine thedifferential reactions of A share investors to the recommendations of local andforeign analysts. By taking the difference of Equation (1) for the reactions of Ashare investors to the recommendations of local and foreign analysts, we obtain
reactionA,L−reactionA,F =β +γ >0. (2)
By taking the difference, the investor side effect is removed. The remaininganalyst side effect and social connection effect work along the same
12 As emphasized by Guiso, Sapienza, and Zingales (2008, 2009) and Gennaioli, Shleifer, and Vishny (2015),social trust is an important factor in many economic transactions, such as trades between countries, individuals’participation in stock markets, and individual’s choices of money managers.
13 In an earlier version of this paper, we developed a more formal Bayesian framework. Through the use of Bayes’rule, this Bayesian framework derives the same three effects in a nonlinear expression, which can be linearizedto give the linear form adopted in (1).
2986
Downloaded from https://academic.oup.com/rfs/article-abstract/30/9/2972/3056946/Market-Segmentation-and-Differential-Reactions-ofby Princeton University useron 08 September 2017
[12:29 10/8/2017 RFS-hhx010.tex] Page: 2987 2972–3008
Market Segmentation and Differential Reactions
direction and jointly imply that A share investors more strongly react to therecommendations made by local analysts than that by foreign analysts.
We also examine the differential reactions of H share investors to the recom-mendations of local and foreign analysts. As before, by taking the differenceof Equation (1) for the reactions of H share investors to the recommendationsof local and foreign analysts, we obtain
reactionH,L−reactionH,F =β−γ. (3)
There are still two remaining effects, the analyst side effect and the socialconnection effect, which now operate on opposite directions. On one hand, therecommendations of foreign analysts are less precise and thus attract weakerreactions. On the other hand, the closer connections of H share investors toforeign analysts cause stronger reactions. These two offsetting effects thusmake the net effect not determined. We summarize these discussions as thefollowing hypothesis:
Hypothesis 1. A share prices more strongly react to the recommendationsmade by local analysts than those by foreign analysts, while H share pricesmay or may not more strongly react to the recommendations made by foreignanalysts.
We also compare the reactions of A share and H share investors to therecommendations by local analysts. By taking the difference of Equation (1)for reactions of A share and H share investors, we have
reactionA,L−reactionH,L =−α+γ. (4)
This expression contains two offsetting forces: The first term captures A shareinvestors having better private information and thus reacting less strongly thanH share investors, and the second term captures A share investors having closerconnections to local analysts and thus reacting more strongly than H shareinvestors. The net effect of these two forces is not determined. Similarly, wecompare the reactions of A share and H share investors to the recommendationsmade by foreign analysts by taking difference of Equation (1) for reactions ofA share and H share investors:
reactionA,F −reactionH,F =−α−γ <0. (5)
The same two forces are still present but along the same direction now.Consequently, H share investors more strongly react than A share investorsto the recommendations by foreign analysts. We summarize these discussionsin the following hypothesis:
Hypothesis 2. H share investors more strongly react than A share investors tothe recommendations made by foreign analysts, althoughAshare investors mayor may not more strongly react than H share investors to the recommendationsby local analysts.
2987
Downloaded from https://academic.oup.com/rfs/article-abstract/30/9/2972/3056946/Market-Segmentation-and-Differential-Reactions-ofby Princeton University useron 08 September 2017

[12:29 10/8/2017 RFS-hhx010.tex] Page: 2988 2972–3008
The Review of Financial Studies / v 30 n 9 2017
In Hypotheses 1 and 2, the social connection effect is entangled withtwo other effects. To further isolate the social connection effect, we usea difference-in-differences strategy, that is, the difference between (2)and (3):
[reactionA,L−reactionA,F
][reactionH,L−reactionH,F
]=2γ >0. (6)
In fact, taking the difference between (4) and (5) gives the same expression.This additional difference allows us to remove the effects of A share investorshaving better private information and local analysts having more preciserecommendations. Consequently, we have the following hypothesis:
Hypothesis 3. The differential reactions of A share investors to therecommendations made by local and foreign analysts are greater than thedifferential reactions of H share investors or, equivalently, the differentialreactions of A share and H share investors to the recommendations by localanalysts are greater than their differential reactions to the recommendations byforeign analysts.
5. Empirical Analysis
In this section, we first present empirical results on testing the threehypotheses outlined in the previous section and then examine how analystrecommendations affect the market segmentation between the two shareclasses.
5.1 Summary statisticsWe use three measures to examine stock price reactions to analystrecommendation changes. The first one is CAR(-1,1), the cumulative abnormalreturn from taking a long position in the recommended share if therecommendation change is favorable and a short position if it is unfavorablefrom one day before to one day after the recommendation announcement. Notethat this measure by design already accounts for whether the recommendationchange is upgrade or downgrade. To calculate CAR(-1,1), we estimate a linearregression of the daily return of each share on the returns of both the ShanghaiComposite Index and the Hong Kong Hang Seng Index. We use data from 365days to 10 days before each recommendation.
The cumulative abnormal return CAR(-1,1) is the main measure of pricereactions in our analysis. We also adopt two other measures for robustness.As some stocks tend to have greater price fluctuations than others, the secondmeasure deflates the cumulative abnormal return, CAR(-1,1), by the share’sidiosyncratic volatility σ . The idiosyncratic volatility is calculated from theaforementioned market model used to calculate CAR(-1,1). dCAR(-1,1) denotesthis measure of deflated cumulative abnormal return.
2988
Downloaded from https://academic.oup.com/rfs/article-abstract/30/9/2972/3056946/Market-Segmentation-and-Differential-Reactions-ofby Princeton University useron 08 September 2017

[12:29 10/8/2017 RFS-hhx010.tex] Page: 2989 2972–3008
Market Segmentation and Differential Reactions
Table 2Price reactions to analyst recommendation changes
A shares H shares A−H
No. obs Mean t-value No. obs Mean t-value Mean t-value
A.CAR(-1,1)
LocalAnalyst 1,475 0.5% 4.53∗∗∗ 1,438 0.5% 4.26∗∗∗ 0.0% 0.12ForeignAnalyst 872 0.2% 1.13 4328 1.2% 17.56∗∗∗ −1.0% −6.9∗∗∗LA - FA 0.3% 1.86∗ −0.7% −5.16∗∗∗
B. dCAR(-1,1)
LocalAnalyst 1,475 24.6% 4.53∗∗∗ 1,438 23.8% 4.43∗∗∗ −0.8% −0.11ForeignAnalyst 872 2.2% 0.28 4,328 58.5% 18.54∗∗∗ −56.3% −6.6∗∗∗LA - FA 22.4% 2.30∗∗ −34.7% −5.58∗∗∗
C. Inf
LocalAnalyst 1,475 6.3% 7.09∗∗∗ 1,438 5.9% 5.72∗∗∗ −0.4% −0.44ForeignAnalyst 872 4.2% 2.44∗∗ 4,328 7.9% 13.06∗∗∗ −3.7% −3.8∗∗∗LA - FA 2.1% 2.21∗∗ −2.0% −2.64∗∗∗
In panel A, CAR(-1,1) is the cumulative abnormal return of a position based on the recommendation change fromone day before to one day after the recommendation announcement, based on a market model with the ShanghaiComposite Index and the Hong Kong Hang Seng Index as the market returns using return data from 365 daysbefore to 10 days before each announcement. In panel B, dCAR(-1,1) is the deflated CAR(-1,1) by the idiosyncraticvolatility generated by the corresponding market model. In panel C, we define a recommendation change to beinfluential (i.e., Inf = 1) if the share’s CAR(-1,1) has the same sign as the direction of the change and an absolutevalue greater than a 2.5% tail of normal distribution with volatility equal to the share’s idiosyncratic volatilityduring the prior year. Local Analysts are analysts of brokerage or research firms with Chinese corporationsas their controlling shareholders. Foreign analysts are analysts of brokerage or research firms without Chinesecorporations as their controlling shareholders. We use *, **, and *** to denote significance at the 10%, 5%, and1% level, respectively.
The third measure follows Loh and Stulz (2011). To deal with the largeamount of noise in an average analyst recommendation, they propose to analyzeinfluential recommendations that visibly move stock prices. Specifically, theydefine a recommendation to be influential if it leads to a statistically significantabnormal stock return in the same direction as the recommendation change.Following their analysis, we define that a recommendation change issued to aparticular share class is influential if the share price reacts in the same directionas the recommendation change and the absolute value of CAR(-1,1) exceeds σ ×√
3×1.96, where σ is the share’s idiosyncratic volatility, 3 is the length of thethree-day return period, and 1.96 corresponds to the 2.5% significance level ofnormal distribution. By this definition, we expect 2.5% of the recommendationchanges to be influential by pure chance.
Table 2 summarizes the price reactions to analyst recommendation changesbased on these three measures. Panel A reports CAR(-1,1). For A shares, thereare 1475 recommendation changes made by local analysts with an averageCAR(-1,1) of 0.5%, which is significant with a t-statistic of 4.53. There are 872recommendation changes by foreign analysts with an average CAR(-1,1) of0.2%, which is insignificant. The differential reaction of 0.3% to these two setsof recommendation changes is positive and significant. This difference is con-sistent with Hypothesis 1, which posits thatAshare prices more strongly react torecommendation changes made by local analysts than those by foreign analysts.
2989
Downloaded from https://academic.oup.com/rfs/article-abstract/30/9/2972/3056946/Market-Segmentation-and-Differential-Reactions-ofby Princeton University useron 08 September 2017

[12:29 10/8/2017 RFS-hhx010.tex] Page: 2990 2972–3008
The Review of Financial Studies / v 30 n 9 2017
For H shares, the average CAR(-1,1) for the 1,438 recommendation changesmade by local analysts is 0.5%, and for the 4328 recommendation changesby foreign analysts is 1.2%. The difference of -0.7% is also statisticallyand economically significant, even though Hypothesis 1 states that H shareprices may or may not more strongly react to recommendation changes madeby foreign analysts. This significantly negative difference indicates that thesocial connection effect dominates the effect of foreign analysts having lowerinformation quality than local analysts.
We can also compare the impact of recommendations made by local analystson A share and H share prices. The reaction of A share prices is almost thesame as that of H share prices. This lack of differential reactions is actuallyconsistent with Hypothesis 2, which states that despite A share investors havingcloser social connections to local analysts, they may or may not more stronglyreact than H share investors to recommendations made by local analysts. Thisis because A share investors also have more private information than H shareinvestors and thus less strongly react to any public information. In responseto recommendations made by foreign analysts, the reaction of A share pricesis 1.0% lower than that of H share prices. This difference is highly significantand is consistent with Hypothesis 2, which also posits that H share investorsshould more strongly react than A share investors to recommendations madeby foreign analysts. This is because H share investors have not only closerconnections to foreign analysts but also less private information relative to Ashare investors.
Panel B of Table 2 reports price reactions based on the deflated abnormalreturn measure dCAR(-1,1). After the normalization, the overall pattern in thedifferential reactions of A share and H share prices remains virtually identical.The normalization also helps to interpret the economic magnitudes of the pricereactions. In particular, during the three-day period around the recommendationannouncements, the stronger reactions of A share prices to recommendationchanges made by local analysts than those by foreign analysts are on averageby 22.4% of the idiosyncratic volatility, and H share prices more strongly reactthan A share prices to recommendation changes of foreign analysts on averageby 56.3% of the idiosyncratic return volatility.
Panel C of Table 2 summarizes the fraction of influential recommendationchanges: 6.3% of the recommendation changes made by local analysts for Ashares are influential, 7.9% of the recommendation changes made by foreignanalysts for H shares are influential, 5.9% of the recommendation changes madeby local analysts for H shares are influential, and 4.2% of the recommendationchanges made by foreign analysts for A shares are influential.14 All of thesefractions are significantly higher than the 2.5% level determined by pure
14 Loh and Stulz (2011) analyze a sample of analyst recommendations for U.S. stocks in the I/B/E/S database andfind the fraction of influential recommendation changes to be around 11%, which is slightly higher than thefractions in our sample.
2990
Downloaded from https://academic.oup.com/rfs/article-abstract/30/9/2972/3056946/Market-Segmentation-and-Differential-Reactions-ofby Princeton University useron 08 September 2017

[12:29 10/8/2017 RFS-hhx010.tex] Page: 2991 2972–3008
Market Segmentation and Differential Reactions
chance. More importantly, in A share markets, the fraction of influentialrecommendation changes by local analysts is significantly higher than that byforeign analysts, while the recommendation changes made by foreign analystsare significantly more influential in H share markets than in A share markets.These differences are both consistent with Hypotheses 1 and 2.
5.2 Regression analysisTo formally compare the differential reactions ofAshare and H share prices, weuse several regression specifications to control for a host of other variables thatmight also affect stock price reactions. Specifically, to examine the differentialprice reactions of A and H shares to the recommendation changes made bylocal (or foreign) analysts, we use the following regression specification in thesubsample of recommendation changes issued to A (or H) shares:
PriceReactioni,j,t,m =β0 +β1LocalAnalysti +β2Controlsi,j,t,m +εi,j,t,m, (7)
where PriceReactioni,j,t,m is the share price reaction to the recommendationchange made by house i to share class m of firm j on date t ; LocalAnalystiis a dummy, which takes the value of one if the recommendation is madeby a local analyst or zero otherwise, and Controlsi,j,t,m represents a host ofcontrol variables, which, as we will discuss later, include the magnitude of therecommendation change. According to Hypothesis 1, we expect the coefficientβ1 to be positive in the subsample of recommendation changes issued to Ashares, and undetermined in the subsample of recommendation changes issuedto H shares. The value of β1 is also a direct measure of the differential pricereactions of the market to recommendation changes made by local and foreignanalysts.
To examine the differential price reactions between A and H sharesto recommendation changes made by local (or foreign) analysts, we usethe following regression specification in the subsample of recommendationchanges made by local (or foreign) analysts:
PriceReactioni,j,t,m=β0 +β1Asharem +β2Controlsi,j,t,m +εi,j,t,m, (8)
where Asharem is a dummy, which takes a value of 1 if the recommendationis issued to A shares or 0 otherwise. According to Hypothesis 2, we expect thecoefficient β1 to be negative in the subsample of recommendation changes madeby foreign analysts, and undetermined in the subsample of recommendationchanges made by local analysts. The value of β1 from this regression is a directmeasure of the differential price reactions of A and H shares to the sample ofrecommendations.
As illustrated by our theoretical framework, the price reactions estimatedfrom regressions (7) and (8) contain not only the social connection effect butalso other alternative effects related to heterogeneous private information ofA share and H share investors and heterogeneous information quality of localand foreign analysts. To isolate the social connection effect, we examine the
2991
Downloaded from https://academic.oup.com/rfs/article-abstract/30/9/2972/3056946/Market-Segmentation-and-Differential-Reactions-ofby Princeton University useron 08 September 2017

[12:29 10/8/2017 RFS-hhx010.tex] Page: 2992 2972–3008
The Review of Financial Studies / v 30 n 9 2017
following difference-in-differences regression motivated by Hypothesis 3 inthe full sample of recommendation changes made by both local and foreignanalysts to both A and H shares:
PriceReactioni,j,t,m =β0 +β1Asharem +β2LocalAnalysti
+β3Asharem∗LocalAnalysti +β4Controlsi,j,t,m +εi,j,t,m
(9)
Hypothesis 3 suggests that the coefficient β3 of the interaction term Asharem∗LocalAnalysti is positive, because its value measures how much the differentialreactions of A share investors to recommendations made by local and foreignanalysts are greater than the differential reactions of H share investors.
In estimating each of the regressions specified in (7), (8), and (9), we useall three aforementioned measures of price reactions. For both CAR(-1,1) anddCAR(-1,1), we use OLS regression; while for Inf, we use logit regression as itis a dummy variable. Because some recommendation changes are made on thesame day or by the same brokerage houses, we cluster errors on announcementdates and firm/house pairs in calculating t-statistics to control for the possiblycorrelated noise among the stock returns around these events.
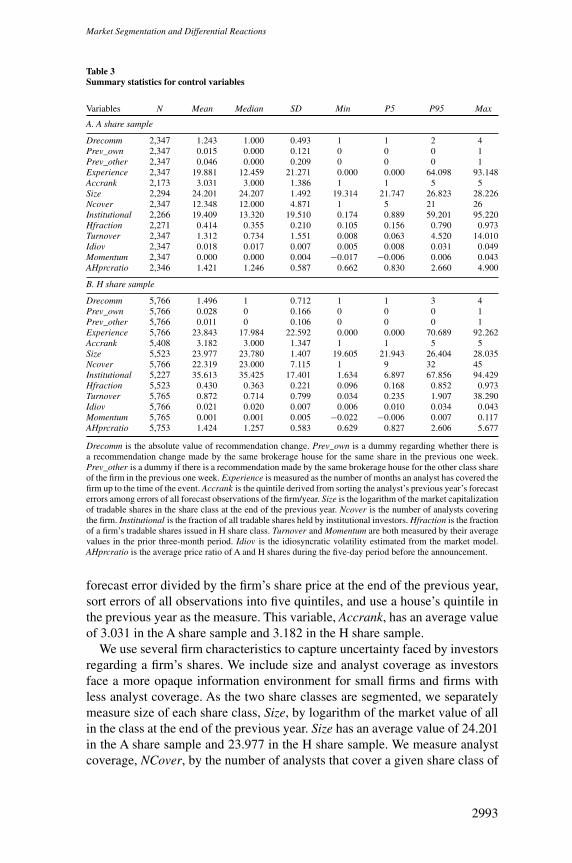
Table 3 reports summary statistics for the control variables used in theregression analysis, separately for subsamples of recommendation changesissued to A and H shares. In the list of control variables, we include fourtypes of other variables: recommendation characteristics, firm characteristics,brokerage house characteristics, and market characteristics.
We use three variables to characterize recommendation changes. First, themagnitude of recommendation change, Drecomm, is simply the absolute valueof a recommendation change. The average change is 1.243 for the A sharesample, while 1.496 for the H share sample. We also include two dummiesPrev_own and Prev_other to measure whether there are other recommendationsissued by the same brokerage house during the prior one week for the sameshare class and the other class of the firm, respectively. If a house has recentlyissued a recommendation for the same firm, the prior recommendation mayhave partially leaked the information in the current recommendation to thepublic. Including these dummies help to control for these nuanced effects. Inthe data, the frequency of having another recommendation in the prior oneweek by the same house for either share class of the same firm is less than 5%in both A share and H share samples.
We use two brokerage house characteristics to capture each house’s ability.We measure a house’s experience, Experience, by the number of quarters thehouse has been covering a firm, which has an average value of 19.881 in theA share sample and 23.843 in the H share sample. We follow Hong and Kubik(2003) to use a ranking method to measure the accuracy of a house’s previousearnings forecasts. Specifically, we collect all EPS forecasts from I/B/E/S andBloomberg, and compute each house’s EPS forecasting errors by the absolute
2992
Downloaded from https://academic.oup.com/rfs/article-abstract/30/9/2972/3056946/Market-Segmentation-and-Differential-Reactions-ofby Princeton University useron 08 September 2017
[12:29 10/8/2017 RFS-hhx010.tex] Page: 2993 2972–3008
Market Segmentation and Differential Reactions
Table 3Summary statistics for control variables
Variables N Mean Median SD Min P5 P95 Max
A. A share sample
Drecomm 2,347 1.243 1.000 0.493 1 1 2 4Prev_own 2,347 0.015 0.000 0.121 0 0 0 1Prev_other 2,347 0.046 0.000 0.209 0 0 0 1Experience 2,347 19.881 12.459 21.271 0.000 0.000 64.098 93.148Accrank 2,173 3.031 3.000 1.386 1 1 5 5Size 2,294 24.201 24.207 1.492 19.314 21.747 26.823 28.226Ncover 2,347 12.348 12.000 4.871 1 5 21 26Institutional 2,266 19.409 13.320 19.510 0.174 0.889 59.201 95.220Hfraction 2,271 0.414 0.355 0.210 0.105 0.156 0.790 0.973Turnover 2,347 1.312 0.734 1.551 0.008 0.063 4.520 14.010Idiov 2,347 0.018 0.017 0.007 0.005 0.008 0.031 0.049Momentum 2,347 0.000 0.000 0.004 −0.017 −0.006 0.006 0.043AHprcratio 2,346 1.421 1.246 0.587 0.662 0.830 2.660 4.900
B. H share sample
Drecomm 5,766 1.496 1 0.712 1 1 3 4Prev_own 5,766 0.028 0 0.166 0 0 0 1Prev_other 5,766 0.011 0 0.106 0 0 0 1Experience 5,766 23.843 17.984 22.592 0.000 0.000 70.689 92.262Accrank 5,408 3.182 3.000 1.347 1 1 5 5Size 5,523 23.977 23.780 1.407 19.605 21.943 26.404 28.035Ncover 5,766 22.319 23.000 7.115 1 9 32 45Institutional 5,227 35.613 35.425 17.401 1.634 6.897 67.856 94.429Hfraction 5,523 0.430 0.363 0.221 0.096 0.168 0.852 0.973Turnover 5,765 0.872 0.714 0.799 0.034 0.235 1.907 38.290Idiov 5,766 0.021 0.020 0.007 0.006 0.010 0.034 0.043Momentum 5,765 0.001 0.001 0.005 −0.022 −0.006 0.007 0.117AHprcratio 5,753 1.424 1.257 0.583 0.629 0.827 2.606 5.677
Drecomm is the absolute value of recommendation change. Prev_own is a dummy regarding whether there isa recommendation change made by the same brokerage house for the same share in the previous one week.Prev_other is a dummy if there is a recommendation made by the same brokerage house for the other class shareof the firm in the previous one week. Experience is measured as the number of months an analyst has covered thefirm up to the time of the event. Accrank is the quintile derived from sorting the analyst’s previous year’s forecasterrors among errors of all forecast observations of the firm/year. Size is the logarithm of the market capitalizationof tradable shares in the share class at the end of the previous year. Ncover is the number of analysts coveringthe firm. Institutional is the fraction of all tradable shares held by institutional investors. Hfraction is the fractionof a firm’s tradable shares issued in H share class. Turnover and Momentum are both measured by their averagevalues in the prior three-month period. Idiov is the idiosyncratic volatility estimated from the market model.AHprcratio is the average price ratio of A and H shares during the five-day period before the announcement.
forecast error divided by the firm’s share price at the end of the previous year,sort errors of all observations into five quintiles, and use a house’s quintile inthe previous year as the measure. This variable, Accrank, has an average valueof 3.031 in the A share sample and 3.182 in the H share sample.
We use several firm characteristics to capture uncertainty faced by investorsregarding a firm’s shares. We include size and analyst coverage as investorsface a more opaque information environment for small firms and firms withless analyst coverage. As the two share classes are segmented, we separatelymeasure size of each share class, Size, by logarithm of the market value of allin the class at the end of the previous year. Size has an average value of 24.201in the A share sample and 23.977 in the H share sample. We measure analystcoverage, NCover, by the number of analysts that cover a given share class of
2993
Downloaded from https://academic.oup.com/rfs/article-abstract/30/9/2972/3056946/Market-Segmentation-and-Differential-Reactions-ofby Princeton University useron 08 September 2017

[12:29 10/8/2017 RFS-hhx010.tex] Page: 2994 2972–3008
The Review of Financial Studies / v 30 n 9 2017
a firm in a given year. This variable has an average value of 12.348 in the Ashare sample and 22.319 in the H share sample. We also include the fractionof tradable shares held by institutional investors, Institutional, as a controlvariable as institutional investors usually subscribe to Bloomberg and othernews portals and have better access to analyst reports than retail investors. Thisfraction has an average value of 19.4% in the A share sample, which is lowerthan the average value of 35.6% in the H share sample, consistent with the factthat there are more institutional investors in the Hong Kong stock market. Wealso include Hfraction, the ratio of tradable H shares to the total number oftradable A and H shares across all the two share classes. This variable has anaverage value of around 0.4 in both A share and H share samples.
We also include several market variables, such as turnover rate Turnover,idiosyncratic return volatility Idiov, and return momentum Momentum. Thesevariables serve to control for timing of analyst recommendations, that is,analysts releasing recommendations during periods of high volatility andhigh sentiment in A share and H share markets. We measure Turnover andMomentum by their average values in the prior three months and Idiov by theaforementioned market model with data in the prior one year. All these marketvariables are share-specific, that is, when the dependent variable observationis a reaction in A market, the observation for Idiov is also based on A market.We also include the price ratio of A to H shares, AHprcratio, as it may containinformation for future price movements. This ratio has an average value of 1.421in the A share sample and 1.424 in the H share sample. The difference in thesevalues is due to the different times when the two samples of recommendationswere made.
Table 4 reports the OLS regression results from using CAR(-1,1) as thedependent variable to separately estimate regressions (7), (8), and (9). Notethat if we do not include any control variables, the univariate analysis ofthese regressions will lead to the summary statistics presented in Table 2.The first and second major columns report results from estimating regression(7) in the samples of recommendation changes issued to A and H shares,respectively. In the first major column for the A share sample, the coefficient ofthe key dummy variable LocalAnalyst has a positive estimate of 0.4% with a t-statistic of 2.26, which confirms that A share investors more strongly reactto recommendations by local analysts, as stated by Hypothesis 1.15 In thesecond major column for the H share sample, the coefficient of LocalAnalysthas a negative estimate of −0.6% with a t-statistic of −4.09. This coefficientsuggests that H share investors more strongly react to recommendations byforeign analysts, despite the countervailing effect of foreign analysts potentiallyhaving lower information quality than local analysts.
15 Because of the availability of several control variables, the number of observations is reduced from 2,347 to2,098, that is, 1,475 recommendation changes by local analysts and 872 by foreign analysts, as summarized inTable 2.
2994
Downloaded from https://academic.oup.com/rfs/article-abstract/30/9/2972/3056946/Market-Segmentation-and-Differential-Reactions-ofby Princeton University useron 08 September 2017

[12:29 10/8/2017 RFS-hhx010.tex] Page: 2995 2972–3008
Market Segmentation and Differential Reactions
Table 4Regression analysis of price reactions measured by CAR
Regression (7) Regression (8) Regression (9)
A share H share Local analyst Foreign analyst FullVariable sample sample sample sample sample
Ashare 0.007∗∗ −0.007∗∗∗ −0.006∗∗∗(2.43) (−3.21) (−3.09)
LocalAnalyst 0.004∗∗ −0.006∗∗∗ −0.006∗∗∗(2.26) (−4.09) (−4.00)
Ashare*LocalAnalyst 0.011∗∗∗(4.60)
Drecomm 0.001 0.003∗∗ 0.005∗∗∗ 0.002 0.002∗∗(0.38) (2.53) (2.93) (1.36) (2.49)
Prev_own −0.013∗ −0.010∗∗ −0.009∗ −0.010∗∗ −0.010∗∗∗(−1.67) (−2.56) (−1.79) (−2.17) (−3.00)
Prev_other 0.005 0.011∗∗ 0.013∗∗ 0.005 0.007∗∗(0.88) (2.24) (2.33) (0.99) (2.00)
Size −0.002∗∗ −0.003∗∗∗ −0.003∗∗∗ −0.002∗∗∗ −0.003∗∗∗(−2.50) (−3.47) (−3.26) (−3.34) (−4.67)
Institutional 0.056 0.076∗ 0.062 0.061 0.061∗(1.22) (1.85) (1.19) (1.53) (1.92)
Hfraction −0.005 0.008∗∗∗ 0.002 0.006∗ 0.004∗(−1.08) (2.60) (0.54) (1.81) (1.91)
Experience −0.008 0.105∗∗∗ 0.027 0.085∗∗∗ 0.065∗∗∗(−0.16) (3.64) (0.68) (2.88) (2.74)
Ncover 0.094 0.107 0.317∗ 0.005 0.115(0.44) (0.89) (1.85) (0.04) (1.10)
Accrank 0.001 0.001∗∗ 0.000 0.001∗∗ 0.001∗∗(0.78) (2.51) (0.71) (2.53) (2.44)
Idiov 0.111 0.078 0.024 0.085 0.070(0.54) (0.48) (0.11) (0.56) (0.56)
Turnover −0.001 −0.003∗∗∗ −0.002 −0.002∗∗ −0.002∗∗(−0.68) (−3.12) (−1.63) (−2.11) (−2.56)
Momentum 0.600∗∗ 0.092 0.377 0.127 0.200(1.99) (0.47) (1.38) (0.63) (1.23)
AHprcratio 0.001 0.001 0.001 0.001 0.001(0.51) (0.56) (0.49) (0.60) (0.88)
Observations 2,098 4,901 2,493 4,506 6,999R2 0.018 0.021 0.018 0.021 0.021F 2.05∗∗ 8.05∗∗∗ 2.99∗∗∗ 8.13∗∗∗ 9.89∗∗∗
The dependent variable is CAR(-1,1), the cumulative abnormal return of a position based on the recommendationchange from one day before to one day after recommendation announcement. Ashare =1 if the recommendationis for A shares. LocalAnalyst = 1 if the recommendation is made by local analysts. Other control variables arethe same as those reported in Table 3. We cluster errors on announcement dates and firm/house pairs, and use*, **, and *** to denote significance at the 10%, 5%, and 1% level, respectively. The coefficient estimate forInstitutional, Experience, and Ncover is multiplied by 1,000.
Among the control variables, the coefficient of absolute recommendationchange magnitude Drecomm is significantly positive in the H share sample,confirming a basic intuition that larger upgrades or downgrades tend to havestronger price impacts. The coefficient of Prev_own is significantly negativefor both samples, consistent with the intuition that a previous recommendationin a recent period reduces the impact of a recommendation. The coefficientof Prev_other is not significant in the A share sample and is positive in the Hshare sample, suggesting that a recent recommendation by the same house to theother share class does not significantly reduce the impact of a recommendation.
2995
Downloaded from https://academic.oup.com/rfs/article-abstract/30/9/2972/3056946/Market-Segmentation-and-Differential-Reactions-ofby Princeton University useron 08 September 2017
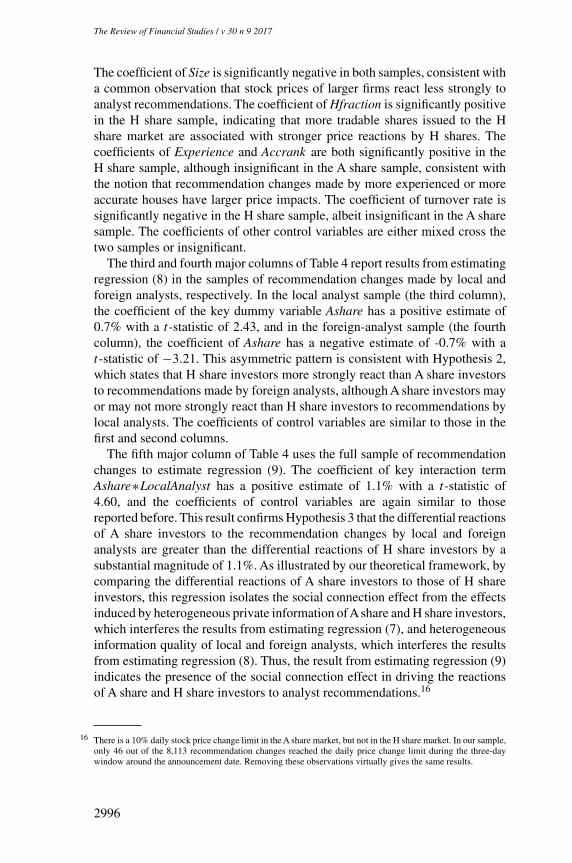
[12:29 10/8/2017 RFS-hhx010.tex] Page: 2996 2972–3008
The Review of Financial Studies / v 30 n 9 2017
The coefficient of Size is significantly negative in both samples, consistent witha common observation that stock prices of larger firms react less strongly toanalyst recommendations. The coefficient of Hfraction is significantly positivein the H share sample, indicating that more tradable shares issued to the Hshare market are associated with stronger price reactions by H shares. Thecoefficients of Experience and Accrank are both significantly positive in theH share sample, although insignificant in the A share sample, consistent withthe notion that recommendation changes made by more experienced or moreaccurate houses have larger price impacts. The coefficient of turnover rate issignificantly negative in the H share sample, albeit insignificant in the A sharesample. The coefficients of other control variables are either mixed cross thetwo samples or insignificant.
The third and fourth major columns of Table 4 report results from estimatingregression (8) in the samples of recommendation changes made by local andforeign analysts, respectively. In the local analyst sample (the third column),the coefficient of the key dummy variable Ashare has a positive estimate of0.7% with a t-statistic of 2.43, and in the foreign-analyst sample (the fourthcolumn), the coefficient of Ashare has a negative estimate of -0.7% with at-statistic of −3.21. This asymmetric pattern is consistent with Hypothesis 2,which states that H share investors more strongly react than A share investorsto recommendations made by foreign analysts, although A share investors mayor may not more strongly react than H share investors to recommendations bylocal analysts. The coefficients of control variables are similar to those in thefirst and second columns.
The fifth major column of Table 4 uses the full sample of recommendationchanges to estimate regression (9). The coefficient of key interaction termAshare∗LocalAnalyst has a positive estimate of 1.1% with a t-statistic of4.60, and the coefficients of control variables are again similar to thosereported before. This result confirms Hypothesis 3 that the differential reactionsof A share investors to the recommendation changes by local and foreignanalysts are greater than the differential reactions of H share investors by asubstantial magnitude of 1.1%. As illustrated by our theoretical framework, bycomparing the differential reactions of A share investors to those of H shareinvestors, this regression isolates the social connection effect from the effectsinduced by heterogeneous private information ofAshare and H share investors,which interferes the results from estimating regression (7), and heterogeneousinformation quality of local and foreign analysts, which interferes the resultsfrom estimating regression (8). Thus, the result from estimating regression (9)indicates the presence of the social connection effect in driving the reactionsof A share and H share investors to analyst recommendations.16
16 There is a 10% daily stock price change limit in the A share market, but not in the H share market. In our sample,only 46 out of the 8,113 recommendation changes reached the daily price change limit during the three-daywindow around the announcement date. Removing these observations virtually gives the same results.
2996
Downloaded from https://academic.oup.com/rfs/article-abstract/30/9/2972/3056946/Market-Segmentation-and-Differential-Reactions-ofby Princeton University useron 08 September 2017

[12:29 10/8/2017 RFS-hhx010.tex] Page: 2997 2972–3008
Market Segmentation and Differential Reactions
Table 5Regression analysis of price reactions measured by dCAR
Regression (7) Regression (8) Regression (9)
A share H share Local analyst Foreign analyst FullVariable sample sample sample sample sample
Ashare 0.281∗∗ −0.517∗∗∗ −0.462∗∗∗(2.04) (−4.55) (−4.31)
LocalAnalyst 0.289∗∗ −0.327∗∗∗ −0.314∗∗∗(2.47) (−4.49) (−4.31)
Ashare*LocalAnalyst 0.606∗∗∗(4.38)
Drecomm 0.050 0.123∗∗∗ 0.172∗∗ 0.093∗ 0.110∗∗(0.44) (2.60) (2.30) (1.71) (2.46)
Prev_own −0.740∗∗ −0.607∗∗∗ −0.536∗∗ −0.654∗∗∗ −0.625∗∗∗(−1.99) (−3.19) (−2.11) (−2.82) (−3.67)
Prev_other 0.250 0.577∗∗ 0.649∗ 0.275 0.389(0.55) (2.13) (1.68) (0.72) (1.38)
Size −0.141∗∗ −0.126∗∗∗ −0.141∗∗∗ −0.108∗∗∗ −0.117∗∗∗(−2.53) (−3.45) (−2.93) (−2.69) (−3.93)
Institutional 4.479∗ 3.229∗ 3.392 3.070∗ 2.987∗(1.67) (1.80) (1.28) (1.65) (1.96)
Hfraction −0.524∗ 0.448∗∗∗ −0.038 0.321∗ 0.196(−1.96) (2.83) (−0.18) (1.90) (1.53)
Experience −2.232 6.080∗∗∗ 0.781 4.693∗∗ 3.294∗∗(−0.50) (3.87) (0.29) (2.40) (2.07)
Ncover 4.518 3.124 14.230∗ −0.994 4.629(0.38) (0.54) (1.74) (−0.15) (0.90)
Accrank 0.047 0.041∗ 0.016 0.058∗∗ 0.043∗∗(1.13) (1.86) (0.46) (2.31) (2.10)
Idiov −2.528 −18.274∗∗∗ −8.421 −17.803∗∗∗ −14.538∗∗∗(−0.22) (−2.82) (−0.79) (−2.63) (−2.59)
Turnover −0.028 −0.096∗∗∗ −0.078∗ −0.027 −0.043(−0.68) (−2.79) (−1.74) (−0.75) (−1.51)
Momentum 16.727 −2.180 13.652 −4.658 1.322(1.24) (−0.27) (1.25) (−0.55) (0.20)
AHprcratio 0.015 0.056 0.051 0.059 0.062(0.14) (0.81) (0.55) (0.77) (1.05)
Observations 2,098 4,901 2,493 4,506 6,999R2 0.014 0.022 0.013 0.021 0.019F 2.22∗∗∗ 7.55∗∗∗ 2.11∗∗∗ 6.77∗∗∗ 8.33∗∗∗
The dependent variable is dCAR(-1,1), the cumulative abnormal return of a position based on the recommendationchange CAR(-1,1) deflated by the idiosyncratic volatility. Ashare =1 if the recommendation is for A shares.LocalAnalyst=1 if the recommendation is made by local analysts. Other control variables are the same as thosereported in Table 3. We cluster errors on announcement dates and firm/house pairs and use *, **, and *** to denotesignificance at the 10%, 5%, and 1% level, respectively. The coefficient estimate for Institutional, Experience,and Ncover is multiplied by 1,000.
We also use the two alternative price reaction measures, dCAR(-1,1) and Inf,as the dependent variable to rerun regressions (7), (8), and (9). Tables 5 and 6report the respective results, which are consistent with those reported in Table 4.In both Tables, the coefficient estimate of the key term LocalAnalyst fromestimating regression (7) is significantly positive in the A share sample (majorColumn 1), of Ashare from estimating regression (8) is significantly negativein the foreign-analyst sample (major Column 4), and of the interaction termAshare∗LocalAnalyst from estimating regression (9) is significantly positivein the full sample (major Column 5).
2997
Downloaded from https://academic.oup.com/rfs/article-abstract/30/9/2972/3056946/Market-Segmentation-and-Differential-Reactions-ofby Princeton University useron 08 September 2017

[12:29 10/8/2017 RFS-hhx010.tex] Page: 2998 2972–3008
The Review of Financial Studies / v 30 n 9 2017
Table 6Logit regression analysis of price reactions measured by Inf
Regression (7) Regression (8) Regression (9)
A share H share Local analyst Foreign analyst FullVariable sample sample sample sample sample
Ashare 0.443 −0.564∗∗ −0.448∗(1.41) (−2.25) (−1.96)
LocalAnalyst 0.513∗∗ −0.282∗ −0.263∗(2.19) (−1.85) (−1.74)
Ashare*LocalAnalyst 0.766∗∗∗(2.73)
Drecomm 0.156 0.282∗∗∗ 0.317∗∗ 0.250∗∗∗ 0.263∗∗∗(0.64) (4.05) (2.14) (3.33) (3.87)
Prev_own 0.000 −0.585 −0.409 −0.897 −0.746∗(.) (−1.41) (−0.75) (−1.47) (−1.80)
Prev_other 0.394 0.643∗ −0.121 0.941∗∗ 0.561∗(0.78) (1.67) (−0.22) (2.49) (1.87)
Size −0.262∗∗ −0.240∗∗∗ −0.189∗∗ −0.267∗∗∗ −0.220∗∗∗(−2.28) (−3.33) (−1.98) (−3.78) (−3.90)
Institutional 8.451 7.825∗∗ 8.194 6.342∗ 6.674∗∗(1.54) (2.11) (1.44) (1.67) (2.14)
Hfraction −0.968∗ 0.619∗ −0.442 0.645∗ 0.223(−1.70) (1.90) (−1.05) (1.92) (0.87)
Experience −2.152 4.433 −5.256 6.119∗∗ 2.277(−0.31) (1.48) (−0.97) (2.09) (0.87)
Ncover 13.633 13.676 24.538 8.298 12.271(0.55) (1.10) (1.27) (0.60) (1.07)
Accrank 0.107 0.014 0.037 0.036 0.038(1.31) (0.34) (0.53) (0.82) (1.01)
Idiov −61.480∗∗∗ −46.650∗∗∗ −46.297∗∗ −60.063∗∗∗ −52.766∗∗∗(−2.87) (−3.05) (−2.46) (−3.92) (−4.55)
Turnover −0.045 −0.240∗ −0.071 −0.049 −0.060(−0.47) (−1.71) (−0.67) (−0.40) (−0.76)
Momentum 71.432∗∗∗ −41.536∗∗ 18.812 −28.311 −13.093(2.86) (−2.30) (0.77) (−1.52) (−0.84)
AHprcratio 0.238 0.251∗ 0.159 0.335∗∗∗ 0.282∗∗∗(1.27) (1.89) (0.89) (2.60) (2.64)
Observations 2,098 4,901 2,493 4,506 6,999Pseudo R2 0.037 0.029 0.017 0.035 0.025Chi2 30.27∗∗∗ 68.57∗∗∗ 20.75 71.06∗∗∗ 82.49∗∗∗
The dependent variable is Inf, a dummy for a recommendation change to be influential or not, that is, whetherthe share’s CAR(-1,1) has the same sign as the direction of the change and an absolute value greater than a 2.5%tail of normal distribution with volatility equal to the share’s idiosyncratic volatility during the prior year. Ashare=1 if the recommendation is for A shares. LocalAnalyst = 1 if the recommendation is made by local analysts.Other control variables are the same as those reported in Table 3. We cluster errors on announcement dates andfirm/house pairs and use *, **, and *** to denote significance at the 10%, 5%, and 1% level, respectively. Thecoefficient estimate for Institutional, Experience, and Ncover is multiplied by 1,000.
Taken together, by using three different measures of stock price reactions,we find a rich set of differential investor reactions to analyst recommendations.The patterns of these differential reactions are consistent with the predictionsoutlined in Hypotheses 1-3. In particular, the findings support the presence ofthe social connection effect in driving the differential reactions of local andforeign investors to recommendations made by local and foreign analysts. Inthe next two subsections, we take advantage of two special subsamples of thedata to further demonstrate the robustness of this key result.
2998
Downloaded from https://academic.oup.com/rfs/article-abstract/30/9/2972/3056946/Market-Segmentation-and-Differential-Reactions-ofby Princeton University useron 08 September 2017
[12:29 10/8/2017 RFS-hhx010.tex] Page: 2999 2972–3008
Market Segmentation and Differential Reactions
5.3 Paired subsampleIn our sample, 296 pairs of recommendation changes are made by the samebrokerage house for the same firm on the same date, with one for the firm’sA shares and the other for its H shares. To take advantage of these pairedrecommendation changes, we can use a difference-in-differences approach tocontrol for all firm specific characteristics and analyst specific characteristics,which may not be fully captured by the control variables used in our earlierregressions.
Specifically, we first measure the differential price reaction between A and Hshares to each of these paired recommendation changes, then run the followingregression:
D_PriceReactioni,j,t =β0 +β1LocalAnalysti +β2Controlsi,j,t +εi,j,t , (10)
where D_PriceReactioni,j,t is the differential price reaction between A shareand H share to the recommendation change pair made by house i for the twoclasses of shares of firm j on date t ; LocalAnalysti is a dummy, which takesthe value of one if the recommendation is made by a local analyst and zerootherwise.According to Hypothesis 3, the differential reactions ofAshare and Hshare investors to recommendations made by local analysts are greater than theirdifferential reactions to recommendations by foreign analysts. Thus, we expectβ1 to be positive. Like before, we use the three measures of price reactions tocompute the differential reactions of A and H shares as the dependent variable.The control variables include all of those used in regressions (7)-(9). For anyvariable with different values forAand H shares, such as idiosyncratic volatilityand turnover, we include its values for both share classes in the regression.As before, we cluster errors on announcement dates and firm/house pairs incalculating t-statistics.
Table 7 reports the regression results. The first major column uses thedifference of CAR(-1,1) between A and H shares as the dependent variable.The coefficient estimate of the key variable LocalAnalyst has a large positivevalue of 1.6% with a t-statistic of 3.24, despite that the small sample sizemakes many of the control variables insignificant. The second major columnuses the difference of dCAR(-1,1) as the dependent variable and gives almostthe same result, with the coefficient of LocalAnalyst being positive andhighly significant. The third major column uses the difference of Inf betweenA and H shares as the dependent variable. In this regression, the coefficientof LocalAnalyst is positive but insignificant. The small sample size makesit rather difficult to draw statistical significance in variation of influentialrecommendation changes, which are just about 6% of the sample.
Taken together, Table 7 shows that even after using a small sample ofpaired recommendation changes to control for all unobservable firm and analystcharacteristics, there is still significant evidence supporting the key predictionof Hypothesis 3 that the differential reactions of A share and H share investors
2999
Downloaded from https://academic.oup.com/rfs/article-abstract/30/9/2972/3056946/Market-Segmentation-and-Differential-Reactions-ofby Princeton University useron 08 September 2017

[12:29 10/8/2017 RFS-hhx010.tex] Page: 3000 2972–3008
The Review of Financial Studies / v 30 n 9 2017
Table 7Regression analysis of paired recommendation changes
CAR(-1,1) dCAR(-1,1) Inf
Estimate t-value Estimate t-value Estimate t-value
LocalAnalyst 0.016 3.24∗∗∗ 0.726 2.83∗∗∗ 0.023 0.48Hfraction 0.143 1.05 8.163 1.23 0.713 0.69Accrank −0.001 −0.36 −0.096 −0.9 0.012 0.73AHprcratio −0.002 −0.36 −0.010 −0.04 0.074 1.69∗Drecomm_A −0.006 −0.94 −0.239 −0.83 −0.114 −2.6∗∗Prev_own_A −0.030 −1.44 −1.659 −1.65 −0.004 −0.01Prev_other_A −0.023 −0.98 −1.011 −0.93 −0.132 −1.34Idiov_A 0.525 0.77 18.879 0.58 −4.896 −1.2Turnover_A 0.000 0 −0.046 −0.29 −0.020 −0.74Momentum_A −0.919 −0.73 −46.664 −0.89 −5.981 −0.85Size_A 0.033 1.13 1.974 1.33 0.156 0.7Institutional_A 0.159 1.13 8.991 1.27 2.228 1.79∗Experience_A 0.209 1.88∗ 10.386 1.54 −0.085 −0.08Ncover_A −0.094 −0.18 −8.005 −0.31 1.256 0.27Drecomm_H −0.007 −1.11 −0.279 −1.05 0.084 1.93∗Prev_own_H −0.014 −0.37 −0.045 −0.03 −0.105 −0.48Prev_other_H 0.042 1.92 1.879 1.82∗ 0.126 0.45Idiov_H −0.750 −1.09 −22.922 −0.74 −11.113 −2.07∗∗Turnover_H 0.005 0.73 0.319 1.08 0.048 1.07Momentum_H 1.883 1.76∗ 106.348 2.23∗∗ 17.536 2.31∗∗Size_H −0.037 −1.23 −2.210 −1.45 −0.196 −0.86Institutional_H −0.071 −0.43 −0.329 −0.04 0.006 0.01Experience_H −0.087 −0.8 −6.625 −0.95 −0.605 −0.54Ncover_H 0.179 0.3 3.193 0.13 −6.270 −1.77∗Observations 296 pairs 296 pairs 296 pairsR2 0.110 0.112 0.119F 1.66** 2.05*** 1.11
This table reports difference-in-differences analysis using the paired sample of recommendation changes madeby the same brokerage house for the same firm on the same day, one for A shares and the other for H shares.The dependent variable in the first, second, and third major column is the difference between A and H shares inCAR(-1,1), dCAR(-1,1), and Inf, respectively. LocalAnalyst=1 if the recommendation is made by local analysts.Other control variables are the same as those in Table 3. Variable names end with A are associated with A shares,and those end with H are with H shares. We cluster errors on announcement dates and firm/house pairs and use*, **, and *** to denote significance at the 10%, 5%, and 1% level, respectively. The coefficient estimate forInstitutional, Experience, and Ncover is multiplied by 1,000.
to recommendations made by local analysts are greater than their differentialreactions to recommendations by foreign analysts.
5.4 Chinese versus non-Chinese analysts of foreign housesIn our earlier analysis, we treat analysts working for local houses as localanalysts and for foreign houses as foreign analysts. In this subsection, we furtherexplore the heterogeneity within analysts of foreign houses. It is common forforeign brokerage houses to hire both Chinese and non-Chinese analysts tocover Chinese firms, although it is rare for local houses to hire non-Chineseanalysts. As A share investors might have closer social connections withChinese analysts of foreign houses, while H share investors might have closerconnections with non-Chinese analysts of foreign houses, Hypothesis 3 againimplies that the differential reactions of A share investors to recommendationsmade by Chinese and non-Chinese analysts of foreign houses to be greater
3000
Downloaded from https://academic.oup.com/rfs/article-abstract/30/9/2972/3056946/Market-Segmentation-and-Differential-Reactions-ofby Princeton University useron 08 September 2017

[12:29 10/8/2017 RFS-hhx010.tex] Page: 3001 2972–3008
Market Segmentation and Differential Reactions
than the differential reactions of H share investors. This consideration thusmotivates another difference-in-differences analysis of the price reactions of Aand H shares to recommendation changes made by Chinese and non-Chineseanalysts of foreign houses.
This difference-in-differences analysis allows us to control for an argumentabout A share and H share investors having differential access to reports oflocal and foreign houses. That is, due to language and cultural reasons, it maybe easier for A share investors to access reports and contact analysts of localhouses and for H share investors to obtain reports and contact analysts offoreign houses. As investors (A share or H share investors) have the sameaccess to reports by Chinese and non-Chinese analysts of the same foreignhouses, comparing price reactions of A and H shares to these reports naturallycontrols for this accessibility issue.
We use analyst name to identify whether an analyst is Chinese. Bloombergprovides the full name of the analyst for each analyst report, and I/B/E/Sprovides the analyst’s last name together with the initial of the first namefor each analyst report. We define an analyst as Chinese if his full name isbased on Pinyin, the official phonetic system for transcribing the sound ofChinese characters into Latin script, and as foreign if his name is not based onPinyin.
Note that A share investors are primarily residents of mainland China, whileH share investors are mixed with residents from outside mainland China,including Chinese speaking regions such as Hong Kong, Taiwan, Singapore,and other parts of the world such as the United States, the United Kingdom,and continental Europe. It is thus useful to separate analysts with origins inmainland China from those with origins in Hong Kong, Taiwan, and Singapore,even though they also can speak Chinese. To do so, we take advantage of thefact that the Pinyin systems used in mainland China, Hong Kong, Taiwan, andSingapore are different from each other. Specifically, by potentially abusing theterm “Chinese,” we define an analyst as Chinese only if his full name matchesPinyin used in mainland China. It is easy for both local and foreign investorsto recognize an analyst whose name matches this criterion as coming from afamily in mainland China.
We adopt a regression specification similar to (9):
PriceReactioni,j,t,m =β0 +β1Asharem +β2ChineseAnalysti
+β3Asharem∗ChineseAnalysti +β4Controlsi,j,t,m +εi,j,t,m
(11)
where PriceReactioni,j,t,m is the share price reaction to the recommendationchange made by analyst i for firm j in market m on date t , ChineseAnalysti isa dummy variable indicating whether a recommendation change is made by aChinese analyst of a foreign house.
3001
Downloaded from https://academic.oup.com/rfs/article-abstract/30/9/2972/3056946/Market-Segmentation-and-Differential-Reactions-ofby Princeton University useron 08 September 2017

[12:29 10/8/2017 RFS-hhx010.tex] Page: 3002 2972–3008
The Review of Financial Studies / v 30 n 9 2017
Table 8Regression analysis of recommendation changes by Chinese and non-Chinese analysts of foreign houses
CAR(-1,1) dCAR(-1,1) Inf
Estimate t-value Estimate t-value Estimate t-value
Ashare −0.014 −2.93∗∗∗ −0.721 −3.1∗∗∗ −1.144 −2.5∗∗ChineseAnalyst 0.001 0.44 −0.143 −0.88 −0.692 −2.29∗∗Ashare* ChineseAnalyst 0.015 2.64∗∗∗ 0.855 2.86∗∗∗ 1.865 2.93∗∗∗Drecomm 0.002 0.93 0.070 0.59 0.398 2.71∗∗∗Prev_own 0.000 0.05 −0.027 −0.07 −0.262 −0.33Prev_other −0.005 −0.91 −0.125 −0.37 −0.188 −0.29Size −0.002 −1.24 −0.083 −1.23 −0.166 −1.25Institutional −0.059 −0.77 −1.791 −0.45 −13.304 −1.71∗Hfraction 0.010 1.55 0.536 1.62 0.696 1.27Experience −0.022 −0.38 −0.806 −0.23 −4.569 −0.83Ncover 0.047 0.17 6.682 0.5 20.289 0.77Accrank 0.003 2.48∗∗ 0.121 2.47∗∗ 0.213 2.26∗∗Idiov −0.034 −0.12 −24.712 −1.85 −53.824 −2.2∗∗Turnover 0.000 0.28 0.029 0.4 0.058 0.42Momentum 0.534 1.31 23.433 1.27 18.083 0.54AHprcratio 0.004 0.97 0.190 1.14 0.322 1.3
Observations 1,117 1,117 1,117R2 or Pseudo R2 0.038 0.031 0.058F or Chi2 2.55*** 2.09*** 33.09***
This table examines price reactions of A and H shares to recommendation changes made by Chinese and non-Chinese analysts of foreign houses. The dependent variable in the first, second, and third major column isCAR(-1,1), dCAR(-1,1), and Inf, respectively. Ashare = 1 if the recommendation is issued for A shares.ChineseAnalyst =1 if the recommendation is made by a Chinese analyst. Other control variables are the sameas those in Table 3. We cluster errors on announcement dates and firm/house pairs and use *, **, and *** todenote significance at the 10%, 5%, and 1% level, respectively. The reported coefficient estimate for Institutional,Experience, and Ncover is multiplied by 1,000.
We focus on a subsample of analyst recommendations made by foreignhouses that have both Chinese and non-Chinese analysts. Because some foreignhouses have only non-Chinese analysts and analyst names are missing fromsome analyst reports, the sample size drops to 741 recommendation changesmade by non-Chinese analysts of foreign houses and 376 recommendationchanges by Chinese analysts.
Table 8 reports the regression results. In the first major column, the dependentvariable is CAR(-1,1). The coefficient estimate of the key interaction termAshare∗ChineseAnalyst has a large positive value of 1.5% with a t-statisticof 2.64. In the second and third major columns, the dependent variable isdCAR(-1,1) and Inf, respectively. In both cases, the coefficient estimate ofAshare∗ChineseAnalyst is significantly positive with a t-statistic of 2.86 and2.93, respectively. Taken together, these results confirm that the differentialprice reactions of A share investors to recommendation changes made byChinese and non-Chinese analysts of the same foreign houses are greater thanthe differential reactions of H share investors. This pattern is again consistentwith Hypothesis 3 and supports the presence of the social connection effect indriving the differential reactions of A share and H share investors to analystrecommendations.
3002
Downloaded from https://academic.oup.com/rfs/article-abstract/30/9/2972/3056946/Market-Segmentation-and-Differential-Reactions-ofby Princeton University useron 08 September 2017

[12:29 10/8/2017 RFS-hhx010.tex] Page: 3003 2972–3008
Market Segmentation and Differential Reactions
5.5 Analyst recommendations and market segmentationHow do analyst recommendations affect the market segmentation between thetwo classes of shares? We anticipate two opposite forces to determine this effect.On one hand, information from analyst recommendations may make the pricesof both share classes to better reflect the firm fundamentals and thus comovemore with each other. On the other hand, an analyst recommendation may leadto differential price reactions between the two share classes and thus to comoveless with each other.
To examine which force dominates, we run the following regression:
Corri,t =β0 +β1Nreportsi,t +β2Fi,t +β3Controlsi,t +εi,t (12)
where Corri,t is the daily return correlation between the A share and Hshare prices of firm i in year t and Nreportsi,t is the number of analystrecommendations made for firm i in year t . If the aforementioned thedifferential-reaction effect dominates the information effect, the coefficient β1
is negative. We also include a list of control variables in this regression. Inparticular, we include Fi,t the fraction of recommendations for firm i in year t
that are made by either local analysts to A share investors or by foreign analyststo H share investors, because the close social connections between analysts andinvestors in these recommendations may further lower the return correlationbetween the two share classes. We also include the fraction of institutionalholding, market size, turnover, and idiosyncratic volatility in both A share andH share markets as controls since these factors may affect the return correctionbetween A and H shares. Finally, we control the yearly time effect.
Table 9 reports the regression results. The coefficient estimate of Nreportsis −0.019 and highly significant, confirming that a firm with more analystrecommendations tends to have a lower return correlation between its A andH shares. This effect is also economically significant, because the number ofreports has mean and standard deviation of 3.97 and 1.10 in this sample, whilethe return correlation has mean and standard deviation of 0.46 and 0.11.
Among the control variables, the coefficient of F is negative, as expected,albeit insignificant. Interestingly, the coefficient of institutional holding in Ashares Institutional_A is significantly positive, consistent with the argumentthat institutions in the A share market pay more attention to asset fundamentalsthan retail investors and their presence increases the return correlation of Ashares with H shares. On the other hand, the coefficient of institutional holdingin H shares Institutional_H, which is typically held by foreign institutionssubject to the well-known hot money effect in international capital markets,is significantly negative, suggesting that the presence of foreign institutionsreduces the return correlation between A and H shares. Overall, Table 9shows that more analyst recommendations are associated with a lower returncorrelation between the two share classes. That is, analyst recommendationsexacerbate rather than attenuate the market segmentation between A and Hshares.
3003
Downloaded from https://academic.oup.com/rfs/article-abstract/30/9/2972/3056946/Market-Segmentation-and-Differential-Reactions-ofby Princeton University useron 08 September 2017

[12:29 10/8/2017 RFS-hhx010.tex] Page: 3004 2972–3008
The Review of Financial Studies / v 30 n 9 2017
Table 9Regression analysis of market segmentation
Estimate t-value
Nreports −0.019 −2.60∗∗∗F −0.013 −0.40Institutional_A 0.001 4.28∗∗∗Institutional_H −0.001 −2.75∗∗∗Size_A 0.030 5.23∗∗∗Size_H 0.009 1.50Turnover_A 0.015 2.59∗∗∗Turnover_H 0.067 5.22∗∗∗Idiov_A 4.525 3.48∗∗∗Idiov_H −1.047 −0.79
Observations 430Adj R2 0.345F 14.3∗∗∗
The dependent variable is the daily return correlations for each stock pair in every year. Nreportsis the number of recommendation changes made by all houses in both market, and F is thefraction of recommendation change made by either by local analysts to A share investors or byforeign analysts to H share investors. Institutional_A and Institutional_H are the fraction ofall tradable shares held by institutional investors in A share and H share markets, respectively.Size_A and Size_H are the logarithm of the market capitalization of tradable shares at theend of the previous year for A and H shares, respectively. Turnover_A and Turnover_H aremeasured by the average turnover rates in the prior three-month period for A share and Hshare markets, respectively. Idiov_A and Idiov_H are idiosyncratic volatility estimated fromthe market model for A and H shares, respectively. This regression also controls for the yearlytime effect.
Note that the return correlation between A and H shares increases with thehorizons, as we have shown in summary statistics of Table 1. This observationleads to a natural question regarding whether the differential reactions ofAshareand H share investors remain persistent over time. If the differential reactionsare induced by nonfundamental reasons, one would expect the differentialreactions to gradually converge over time. To examine this issue, we facethe common challenge of having greater noise in long-horizon returns, whichreduces the power of statistical tests. Nevertheless, we depict the cumulativereturns around the announcement day of analyst recommendations from day −3to day 20 in Figure 3. Panel A depicts the cumulative returns averaged acrossfour types of recommendations based on the analyst-investor combination, thatis, from local analysts to A share investors, from foreign analysts to A shareinvestors, from local analysts to H share investors, and from foreign analyststo H share investors. Panel B separately depicts the cumulative returns for eachof these four types.
Panel A shows modest reaction reversal from day 8 afterward, even thoughthe reversal pattern is statistically insignificant due to the greater noise inthe long-horizon returns. Panel B further shows that the reversal pattern isparticularly visible in reactions of A share prices to the recommendationsof local analysts and in reactions of H share prices to the recommendationsof local analysts. The presence of reaction reversal suggests that the differentialreactions of A share and H share investors would partially converge over time,
3004
Downloaded from https://academic.oup.com/rfs/article-abstract/30/9/2972/3056946/Market-Segmentation-and-Differential-Reactions-ofby Princeton University useron 08 September 2017

[12:29 10/8/2017 RFS-hhx010.tex] Page: 3005 2972–3008
Market Segmentation and Differential Reactions
A Full sample
B Four subsamples
0
0.001
0.002
0.003
0.004
0.005
0.006
-0.002
0
0.002
0.004
0.006
0.008
0.01
0.012
0.014
0.016
0.018
H_Foreign A_Foreign H_Local A_Local
Figure 3Cumulative abnormal returnsThe figure depicts the cumulative abnormal return of a position based on the recommendation change from threedays before to t days after the recommendation announcement (up to 20 days), by using a market model withthe Shanghai Composite Index and the Hong Kong Hang Seng Index as the market returns and estimated from365 days to 10 days before each announcement. Panel A is for the full sample with all relevant recommendationchanges. Panel B separately depicts the four types of recommendations based on the analyst-investor combination,that is, from local analysts to A share investors (A_Local), from foreign analysts to A share investors (A_Foreign),from local analysts to H share investors (H_Local), and from foreign analyst to H share investors (H_Foreign).
which in turn help to explain the increase in return correlation between the twoshare classes over longer horizons.17
6. Conclusion
This paper uses the segmented dual-class shares of Chinese firms to analyze thedifferential reactions of local and foreign investors to analyst recommendations.
17 Despite the partial reaction reversal over longer horizons, our key results summarized in Tables 4–6 regardingthe differential reactions of A share and H share investors to analyst recommendations remain robust after usinga longer event window of from one day before to ten days after the announcement day. This robustness result isavailable on request from the authors.
3005
Downloaded from https://academic.oup.com/rfs/article-abstract/30/9/2972/3056946/Market-Segmentation-and-Differential-Reactions-ofby Princeton University useron 08 September 2017

[12:29 10/8/2017 RFS-hhx010.tex] Page: 3006 2972–3008
The Review of Financial Studies / v 30 n 9 2017
We find a rich set of differential reactions. In particular, our findings supporta new notion that social connections between investors and analysts can causedifferential investor reactions to analyst recommendations. Furthermore, weshow that analyst recommendations exacerbate rather than attenuate the marketsegmentation between the two share classes due to investors’ differentialreactions to analyst recommendations.
Our study sheds light on an important source of heterogeneity in financialmarkets. As investors have different social connections with different analysts,gurus, or other sources of information, they are likely to hold different beliefsabout the same financial asset and, as a result, to speculate against each other.This helps to explain the widely observed excessive trading in asset markets.This insight is particularly useful for understanding international investments.Foreign investors face more severe informational barriers in investing in localassets. To mitigate the informational barriers, it is beneficial for them to hirebetter informed local analysts or local money managers to facilitate theirinvestment decisions. However, as emphasized by Gennaioli, Shleifer, andVishny (2015), social trust is the key in maintaining the relationship betweeninvestors and money managers. The lack of trust and social connections mayprevent foreign investors from effectively relying on the expertise of localanalysts and local money managers to overcome their informational barriers.This helps explain the widely documented home bias in portfolio investmentsof investors across the world and why equity holdings of foreign investorstend to be highly volatile. This also offers an explanation for the segmentationbetween dual-class shares issued by the same firms in different markets.
References
Amihud,Y. 2002. Illiquidity and stock returns: Cross-section and time-series effects. Journal of Financial Markets5:31–56.
Asquith, P., M. B. Mikhail, andA. S.Au. 2005. Information content of equity analyst reports. Journal of FinancialEconomics 75:245–282.
Bae, K.-H., R. M. Stulz, and H. Tan. 2008. Do local analysts know more?Across-country study of the performanceof local analysts and foreign analysts. Journal of Financial Economics 88:581–606.
Bailey, W., and J. Jagtiani. 1994. Foreign ownership restrictions and stock prices in the Thai capital market.Journal of Financial Economics 36:57–87.
Bailey, W., A. Karolyi, and C. Salva. 2006. The economic consequences of increased disclosure: Evidence frominternational cross-listings. Journal of Financial Economics 81:175–213.
Baker, K., J. Nofsinger, and D. Weaver. 2002. International cross-listing and visibility. Journal of Financial andQuantitative Analysis 37:495–521.
Brennan, M., and H. Cao. 1997. International portfolio investment flows. Journal of Finance 52:1851–80.
Cao, H., and H. Ou-yang. 2009. Differences of opinion of public information and speculative trading in stocksand options. Review of Financial Studies 22:299–335.
Chan, K., A. Menkveld, and Z. Yang. 2008. Information asymmetry and asset prices: Evidence from the Chinaforeign share discount. Journal of Finance 63:159–96.
3006
Downloaded from https://academic.oup.com/rfs/article-abstract/30/9/2972/3056946/Market-Segmentation-and-Differential-Reactions-ofby Princeton University useron 08 September 2017
[12:29 10/8/2017 RFS-hhx010.tex] Page: 3007 2972–3008
Market Segmentation and Differential Reactions
Chen, Z., and P. Xiong. 2002. Discounts on illiquid stocks: Evidence from China. Working Paper, Yale University.
Coeurdacier, N., and H. Rey. 2012. Home bias in open economy financial macroeconomics. Journal of EconomicLiterature 51:63–115.
Dornbusch, R., and Y. C. Park. 1995. Financial integration in a second-best world: Are we still sure about ourclassical prejudices. In Financial opening: Policy lessons for Korea, eds. R. Dornbusch and Y. C. Park. Seoul:Korea Institute of Finance.
Du, Q., F. Yu, and X. Yu. 2014. Cultural proximity and the processing of financial information. Working Paper.
Dumas, B., A. Kurshev, and R. Uppal. 2009. Equilibrium portfolio strategies in the presence of sentiment riskand excess volatility, Journal of Finance 64:579–629.
Dumas, B., K. Lewis, and E. Osambela. 2016. Differences of opinion and international equity markets. Reviewof Financial Studies. Advance Access published October 1, 2016, 10.1093/rfs/hhw083.
Fernald, J., and J. Rogers. 2002. Puzzles in the Chinese stock market. Review of Economics and Statistics84:416–32.
French, K., and J. Poterba. 1991. Investor diversification and international equity markets. American EconomicReview 81:222–6.
Froot, K., and E. Dabora. 1999. How are stock prices affected by the location of trade? Journal of FinancialEconomics 53:189–216.
Gehrig, T. 1993. An information based explanation of the domestic bias in international equity investment.Scandinavian Journal of Economics 95:97–109.
Gennaioli, N., A. Shleifer, and R. Vishny. 2015. Money doctors. Journal of Finance 70:91–114.
Gentzkow, M., and J. Shapiro. 2006. Media bias and reputation. Journal of Political Economy 114:280–316.
Guiso, L., P. Sapienza, and L. Zingales. 2008. Trusting the stock market. Journal of Finance 63:2557–600.
———. 2009. Cultural biases in economic exchange? Quarterly Journal of Economics 124:1095–131.
Harris, M., andA. Raviv. 1993. Differences of opinion make a horse race. Review of Financial Studies 6:473–506.
Hong, H., and J. D. Kubik. 2003. Analyzing the analysts: Career concerns and biased earnings forecasts. Journalof Finance 58:313–51.
Hong, H., and J. C. Stein. 2007. Disagreement and the stock market. Journal of Economic Perspectives 21:109–28.
Kandel, E., and N. Pearson. 1995. Differential interpretation of public signals and trade in speculative markets.Journal of Political Economy 103:831–72.
Karolyi, A., and L. Li. 2003. A resolution of the Chinese discount puzzle. Working Paper, Cornell University.
Lang, M., K. Lins, and D. Miller. 2003. ADRs, analysts, and accuracy: Does cross listing in the US improve afirm’s information environment and increase market value? Journal of Accounting Research 41:317–46.
Lee, C., K. Li, and R. Zhang. 2015. Shell game: The long term performance of Chinese reverse merger firms.Accounting Review 90:1547–89.
Lewis, K. 2011. Global asset pricing, Annual Review of Financial Economics 3:435–66.
Loh, R. K., and R. M. Stulz. 2011. When are analyst recommendation changes influential? Review of FinancialStudies 24:593–627.
Mei, J., J. Scheinkman, and W. Xiong. 2009. Speculative trading and stock prices: evidence from Chinese A-Bshare premia. Annuals of Economics and Finance 10:225–55.
Mullainathan, S., and A. Shleifer. 2005. The market for news. American Economic Review 95:1031–53.
Radelet, S., and J. Sachs. 2000. The onset of the East Asian financial crisis. In Currency crises, 105–62. Chicago:University of Chicago Press.
3007
Downloaded from https://academic.oup.com/rfs/article-abstract/30/9/2972/3056946/Market-Segmentation-and-Differential-Reactions-ofby Princeton University useron 08 September 2017

[12:29 10/8/2017 RFS-hhx010.tex] Page: 3008 2972–3008
The Review of Financial Studies / v 30 n 9 2017
Scheinkman, J., and W. Xiong. 2003. Overconfidence and speculative bubbles. Journal of Political Economy111:1183–219.
Shiller, R., F. Kon-Ya, and Y. Tsutsui. 1991. Investor behavior in the October 1987 stock market crash: The caseof Japan. Journal of the Japanese and International Economies 5:1–13.
Stulz, R., and W. Wasserfallen. 1995. Foreign equity investment restrictions, capital flight, and shareholder wealthmaximization: Theory and evidence. Review of Financial Studies 8:1019–57.
Xiong, W. 2012. Bubbles, crises, and heterogeneous beliefs. In Handbook for systemic risk, eds. J.-P. Fouqueand J. Langsam. Cambridge: Cambridge University Press.
3008
Downloaded from https://academic.oup.com/rfs/article-abstract/30/9/2972/3056946/Market-Segmentation-and-Differential-Reactions-ofby Princeton University useron 08 September 2017


![Market Segmentation and Differential Reactions of Local ...wxiong/papers/AH_Reaction.pdf · [12:29 10/8/2017 RFS-hhx010.tex] Page: 2972 2972–3008 Market Segmentation and Differential](https://img.pdfslide.us/doc/110x75/5b51af9e7f8b9adf538c48c1/market-segmentation-and-differential-reactions-of-local-wxiongpapersahreactionpdf.jpg)