Embed Size (px)
Citation preview

Market Research Project Final Report
By
Joshua Kern
Adam Oser
Omar Duran-Mendoza
Presented to
Brad Barbeau

Table of Contents
I. Executive Summary………………………………………………………………………...3II. Situation Analysis and Marketing
Problem…………………………………….....3III. Marketing Research
Objectives……………………………………………………......4IV. Data Collection Plan………………………………………………………………………..
4A. Questionnaire
Design…………………………………………………………....4B. Questionnaire
Revision………………………………………………………....5C. Sample
Plan………………………………………………………………………….5D. Sample Plan Revision……………………………………………………………5E. Coding………………………………………………………………………………….
6V. Results and
Limitations…………………………………………………………………...6A. Is there a need for pizza……………………………………………………….6
VI. Conclusions and Recommendations……………………………………………….12
VII. Further Results……………………………………………………………………………..13VIII. Appendices…………………………………………………………………………………...1
4A. Questionnaire……………………………………………………………………..1
4B. Coding Sheet………………………………………………………………………24

List of Figures
Figure 1: Favorite pizza brand………………………………………………………………….7
Figure 2: Ranking importance of factors, when purchasing a pizza…………….8
Figure 3: Ratings of respondents opinion of each brand…………………………….9
Figure 4: Crosstabs showing respondents dining preference……………………..9
Figure 5: Anova test, compares On campus residents/ increased likelihood to
purchase ……………………………………………………………………………………………..9
Figure 6: Independent T-Test………………………………………………………………….10
Figure 7: Regression Analysis, willing purchase price/ Household size……..11

I. Executive SummaryMountain Mike’s is one of the leading pizza brands, and is a family-oriented
casual dining environment that also offers delivery and carryout options.
They provide only the highest quality and custom made food using the
freshest and finest ingredients. The main issue that the Mountain Mike’s
restaurant located in Marina is experiencing, is how to attract more CSUMB
students. We were assigned to help Mountain Mike’s find answers to it’s
current marketing problem and to come up with a conclusion how to
proceed. This report will give a detailed analysis regarding Mountain Mike’s
and provide conclusions, in order to fix Mountain Mike’s.
The report arrived at several opportunities for Mountain Mike’s. The first
option is to change their marketing campaign and begin targeting CSUMB
students more. The second option involves working together with CSUMB to
allow Mountain Mike’s to accept Otter Bucks as a form of payment.
II. Situation Analysis and Marketing ProblemMountain Mike’s is one of the few franchises that still offers a dine in
experience. The restaurants provide customers with a pleasant atmosphere,
where customers can enjoy pizza, while enjoying sporting events. Mountain
Mike’s has an excellent reputation, but here in Marina, it seems like they may
have some trouble in the community, including students at CSUMB. The
underlying objective of our research would be to determine if customers are
aware of Mountain Mikes Pizza in Marina. The next objective would be to
think of a new service that Mountain Mikes can provide to attract new
customers, CSUMB students will be targeted heavily. The new service will be
offered to CSUMB students, by accepting the otter bucks as a form of
payment. We will collect information through the process of using primary
data, which will be gathered through surveys and focus groups by targeting
CSUMB students. Once we have collected enough information to determine if
the new service will appeal to CSUMB students, we can move forward and

establish a marketing campaign that would allow incoming college students
know about our service and this can be done by partnering with the school.
III. Marketing Research ObjectivesThe underlying objective of our research is to determine if customers are
aware of Mountain Mikes Pizza in Marina. The next objective would be to
think of a new service that Mountain Mikes could provide to attract new
customers. The new service will be offered to CSUMB students in particular
by accepting the otter bucks as a form of payment. We will collect
information through the process of using primary data, which will be
gathered through surveys by targeting our sample population. Once we have
collected enough information to determine if the new service will appeal to
CSUMB students, we can move forward and establish a marketing campaign
that would allow incoming college students more information about its
services, by partnering with the school.
IV. Data Collection PlanQuestionnaire DesignWhen designing the questionnaire, we began with questions that were very
general in regards to student’s habits of eating out and their opinion about
otter bucks. Continuing on in the questionnaire, the questions got more
specific regarding student’s preferences about different factors while eating
out and other pizza chains. Further explanation is shown below:
● Section A
○ This section is composed of general questions about the student’s
habits in regards to ordering pizza and other pizza chains
● Section B
○ Inquired information about the student’s prior experiences and
the attributes or factors that they valued the most
● Section C
○ This final section consisted questions that would gather student’s
demographic information

The questionnaire that was used to gather our data and get results can be
found in Appendix 1.
Questionnaire RevisionTo make our survey more efficient, it was decided that we would need to
remove several questions that did not provide any relevant information in
regards to our issue. It allowed us to shorten the survey making the
participants more willing to take the survey. The length caused some takers
to speed through the survey causing some non-sampling errors because they
were not reading and understanding the question thoroughly.
We also needed to revise the wording of several questions to provide more
clarity for the respondents. Question nine of the survey, left several
respondents to inaccurately answer the question. Inserting (1-4) will provide
clarity for respondents, when answering the question. This lead several
respondents to non-response errors, but were about to identify the most
important “1” rated factor to the respondents.
Sample PlanTo take our sample we first needed to determine the sample size that was
needed to get the needed results. We determined that the sample plan size
should be much larger than 50, but a survey of 50 will be large enough to get
the satisfactory results. The research team was composed of three members,
each member was required to interview a minimum of 17 respondents.
The sample frame only consisted of CSUMB students, class members, random
students and friends. They were interviewed in person through oral and
written questioning, giving them our survey and emailing them the survey as
well. Since respondents sometimes are not willing to always answer the
surveys, no order was taken to the people who were given the survey, just
the people who answered the survey first were taken. They were both male
and female students.

As a team we tried to avoid bias results in our sample frames. When
interviewing students eating at the OE or the DC, most of them would in fact
admit that pizza is one of their favorite foods. However the results were not
dramatically affected.
Sample Plan RevisionA revised sample plan would take a larger sample size into consideration. We would
recommend a larger sample size to make our results more conclusive and accurate.
A sample size would ideally include the entire CSUMB student body. The sample size
would result in a more accurate and more useful information because it would
contain the opinions of the entire school. This data would be able to accurately
conclude the opinion of all CSUMB students.
CodingThe coding for questions were coded several way. For further info on the coding of
the questionnaire for each question can be seen in the appendix 3. The example of
how some of the questions were coded are below:
Yes or No
Yes or no questions coded by 1, 0.
● 0 indicates response of yes.
● 1 indicates response of no.
Check all that Apply
Questions with multiple answers were coded into several single variables for each
possible answer.
● 0 indicates “applies” as a response
● 1 indicates “does not apply” as a response
Multiple Choice
These were questions that had multiple options to choose from were coded 1
counting up to the needed number.
Rating
The chosen number on the scale is entered in the data set
V. Results and Limitations

Is there the need of pizza?
We had several limitations in the procedure of researching Mountain Mike’s
restaurant. The main limitation occurred by the limited number of survey
responses. It would have been more beneficial to have received a response from
every student attending CSUMB, in order to get a complete analysis of CSUMB
students. A complete analysis of the student body could accurately predict the
perception of Mountain Mike’s and the use of otter bucks.
First, we needed a screening question, in order to make sure all of the responses
were taken by CSUMB students. In order to conclude otter bucks would increase the
popularity of Mountain Mike’s with CSUMB students, we required only CSUMB
students to respond. The survey concluded a good point estimate would be 76% of
respondents prefer either Mountain Mike’s or Domino’s over Round Table and Pizza
Hut. Mountain Mike’s and Domino’s were each preferred equally by respondents at
38%, shown in figure 1 below.
Figure 1: Favorite pizza brand
Next, we evaluated the importance of several different factors regarding the
purchasing of pizza. We had respondents rank the importance of each variable,

between one and four. By having the “price” variable as the top selection for
respondents, this may lead respondents to entering “price” as the most important
factor and by having the “customer service” factor at the bottom of the options, it
may have received additional “4”’s from respondents. Even with “price” as the top
choice, “quality” received the most “1”’s and “2”’s in regards to importance when
purchasing a pizza. Results are shown below in figure 2.
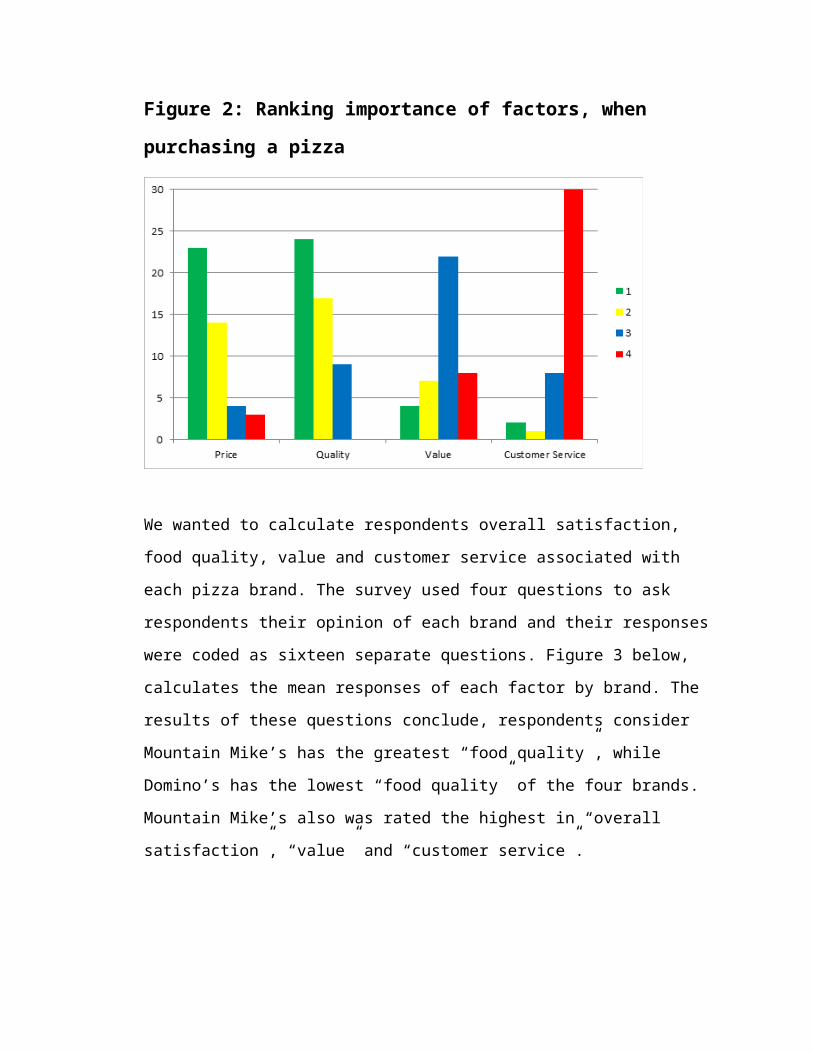
Figure 2: Ranking importance of factors, when purchasing a pizza
We wanted to calculate respondents overall satisfaction, food quality, value and
customer service associated with each pizza brand. The survey used four questions
to ask respondents their opinion of each brand and their responses were coded as
sixteen separate questions. Figure 3 below, calculates the mean responses of each
factor by brand. The results of these questions conclude, respondents consider
Mountain Mike’s has the greatest “food quality”, while Domino’s has the lowest
“food quality” of the four brands. Mountain Mike’s also was rated the highest in
“overall satisfaction”, “value” and “customer service”.

Figure 3: Ratings of respondents opinion of each brand
After examining respondents favorite pizza brand and respondents dining
preference, we noticed the majority of respondents who selected “eat at the
restaurant” also selected “Mountain Mike’s” as their favorite pizza brand
shown in figure 4 below. People who desire to eat pizza are likely to choose
Mountain Mike’s to the other pizza brands because of the inviting
atmosphere, which Mountain Mike’s provides for its customers. People who
wish to have their pizza delivered were more likely to prefer Domino’s. One
reason for domino’s lovers preferring delivery could be the unique way
Domino’s allows customers to track your pizza online at Dominos.com. As a
result, Mountain Mike’s may need to improve its platform for delivery service
to college students. College students may be more susceptible to
technological innovation.
Figure 4: Crosstabs showing respondents dining preference
Dine - in Carry out Delivery Total
Mountain
Mike’s
6 6 7 19

Round
Table
2 1 6 9
Pizza Hut 0 0 3 3
Domino’s 2 6 11 19
10 13 27 50
Next we wanted to see if there is a relationship between on-campus residents and
increased likelihood to purchase, if Mountain Mike’s accepted Otter Bucks. The
anova test shown in figure 5 below, concluded that there is a relationship between
the two variables, all the on-campus residents responded with an increased
likelihood of purchase, and we receive a significant value of .000. Also, we conclude
there is a relationship between respondents who would have an increased
likelihood of purchase with otter bucks and on-campus residents, and we received a
significant value of .036.
Figure 5: Anova test, compares On campus residents/ increased likelihood to purchase
Sum of
Squares
df Mean
Square
F Sig.
Increased
likeliness of
purchase w/
Otter bucks
3.735 1 3.735 23.832 .000
7.367 47 .157
Total 11.102 48
On-Campus
residents
.999 1 .999 4.645 .036
10.104 47 .215
Total 11.102 48
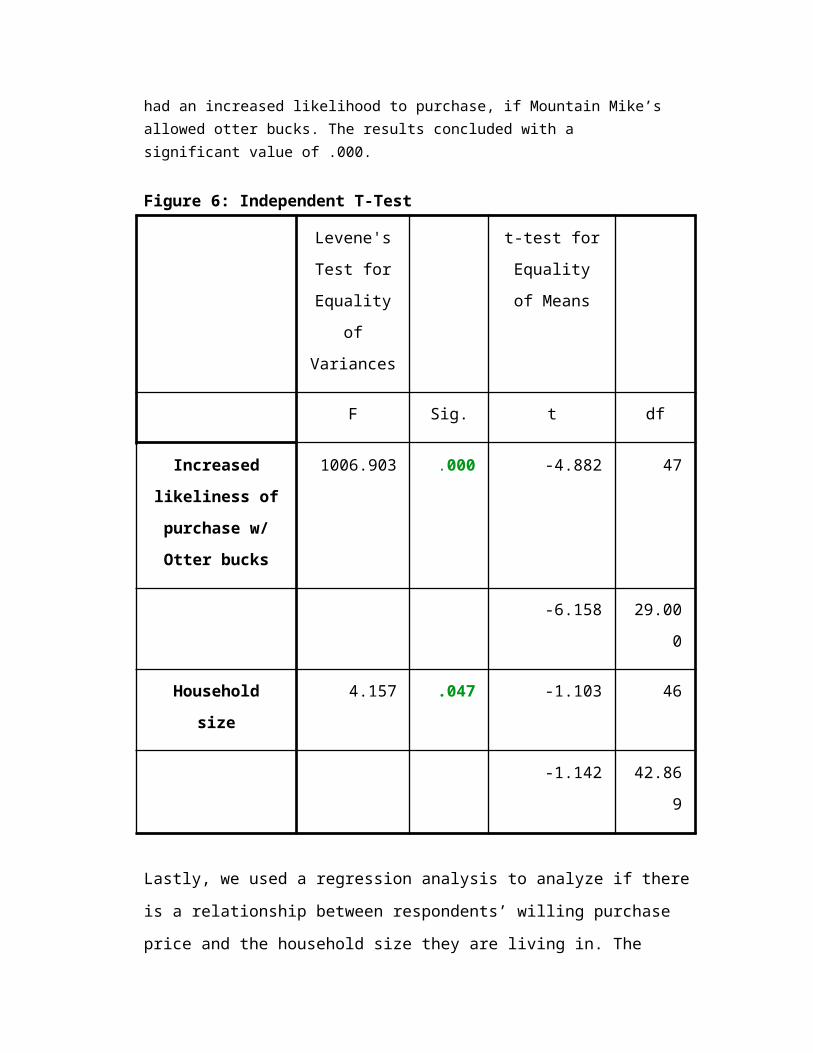
Figure 6 shown below, compares the relationship between household size and the increased likelihood of purchase, if Mountain Mike’s accepted otter bucks by using an independent T-test. The test provided significant p-values associated with the relationship between the two variables. Respondents had an increased likelihood to purchase, if Mountain Mike’s allowed otter bucks. The results concluded with a significant value of .000.
Figure 6: Independent T-Test
Levene's
Test for
Equality of
Variances
t-test for
Equality of
Means
F Sig. t df
Increased
likeliness of
purchase w/
Otter bucks
1006.903 .000 -4.882 47
-6.158 29.000
Household size 4.157 .047 -1.103 46
-1.142 42.869

Lastly, we used a regression analysis to analyze if there is a relationship between
respondents’ willing purchase price and the household size they are living in. The
regression analysis proves there is a relationship between these two variables, with
a significant value of .031. As a result, it also provides a negative standardized Beta,
which results in relation, such as, the willing purchase price of respondents with
smaller household sizes are willing to pay more for a large, 1-topping pizza, while
respondents with larger household sizes are willing to pay less. This could be a
result of several situations, including: Larger households are looking for a better
bargain to feed their families or respondents (college students) are living with
roommates and doesn’t want to share leftovers with their roommates. Either or
both cases could have resulting in this relationship in the regression analysis shown
in figure 7 below.
Figure 7: Regression Analysis, willing purchase price/ Household size
Model Unstand
ardized
Coefficie
nts
Standardiz
ed
Coefficient
s
t Sig.
B Std.
Error
Beta
(Constant) 2.213 .262 8.460 .000
Househol
d size
-.426 .191 -.315 -
2.230
.031
VI. Conclusions and Recommendations

After reviewing our results, it is clear that Mountain Mike’s has several
problems. The first one is that some students are not aware of the closest
location is. Second, students tend to prefer ordering pizza from Domino’s.
Therefore, we recommend that Mountain Mikes take one of these two
actions:
The first option would be for Mountain Mike’s to improve their marketing
campaign. At least when it comes to marketing CSUMB students. Perhaps
increasing the amount of television ads on local channels would increase
awareness and help solve the problem of students not knowing where the
nearest Mountain Mike’s location is.
The second option is for Mountain Mikes to begin accepting Otter Bucks.
Now, we understand this would involve lots of collaboration with CSUMB and
associated students, but this would benefit both CSUMB and Mountain
Mike’s. Our study showed that if Mountain Mike’s were to accept otter bucks,
many more students would use otter bucks.
VII. Further Research
Based on the results that we have gotten from our study, we recommend that
Mountain Mike’s go forward with working with CSUMB and accepting otter
bucks. If this is going to cause too many problems or be difficult to do,
another option could be to team with Sodexo and offer Mountain Mike’s in
the dining commons and Otter Express. This way, students would be aware
of what Mountain Mike’s has to offer for the students.
A better survey with more detailed questions and a larger sample size would
help us further our research. The unnecessary questions would be removed
and some questions rearranged in order to provide Mountain Mikes with
better information.
VIII.Appendices
Questionnaire

Hello, my name is ________, and I am a Business student from CSUMB. I am conducting a survey, about students opinions about local pizza parlors, for my market research class. This survey should take no more than 10 minutes of your time. All your answers provided will remain confidential and will only be used to determine your opinion of local pizza parlors.
Will you be willing to answer our survey questions?
1. Are you a student (If no please STOP)[ ] Yes[ ] No
2. Do you purchase fast food at least once a month?[ ] Yes [ ] No
3. Do you use CSUMB otter bucks?[ ] Yes[ ] No
4. Have you ever seen a Mountain Mike’s ad or commercial?[ ] Yes[ ] No
5. If Mountain Mike’s Pizza accepted Otter bucks, would this increase the likelihood of you eating at Mountain Mike’s?[ ] Yes[ ] No
These questions will determine your personal preferences for pizza.
6. How many times do you typically order pizza each month (from a pizza parlor)?[ ] Never[ ] Once[ ] Twice[ ] 3-4 times[ ] More than 5 times
7. When you have pizza, do you prefer eating at the restaurant, carry out or delivery when ordering pizza?[ ] Eat at the restaurant[ ] Carry-out[ ] Delivery
8. How far are you willing to travel for your favorite pizza?
[ ] Up to a mile[ ] 1 - 2 miles[ ] 2 - 5 miles[ ] More than 5 miles
9. Rank the importance of each factor when you purchase pizza?___ Price___ Quality___ Value___ Customer Service
10. Do you know where the closest Mountain Mike’s Pizza place is?[ ] Yes[ ] No
11. Do you know where the closest Pizza Hut or Domino’s Pizza are located?[ ] Yes[ ] No
These questions will determine your satisfaction of local pizza parlors
13. Which of the following pizza brands are you familiar with?[ ] Mountain Mike’s[ ] Round Table[ ] Pizza Hut[ ] Domino’s Pizza
14. Which of the following pizza have you ever tried?[ ] Mountain Mike’s[ ] Round Table[ ] Pizza Hut[ ] Domino’s Pizza
15. What is your local favorite pizza company?[ ] Mountain Mike’s[ ] Round Table[ ] Pizza Hut[ ] Domino’s Pizza
16. What would make you switch your favorite brand?[ ] Higher Quality[ ] Lower Price[ ] Healthier ingredients[ ] Closer location

17. How important are fresh ingredients to you in making a purchase?Not important at all 1 2 3 4 5 6 7 Very important
18. If you have tried the following pizza, how would you rate your overall satisfaction with it? Mountain Mike’s: Very bad 1 2 3 4 5 6 7 very good Round Table: Very bad 1 2 3 4 5 6 7 very good Pizza Hut: Very bad 1 2 3 4 5 6 7 very good Domino’s Pizza: Very bad 1 2 3 4 5 6 7 very good 19. If you have tried the following pizza, how would you rate it’s food quality? Mountain Mike’s: Very bad 1 2 3 4 5 6 7 very good Round Table: Very bad 1 2 3 4 5 6 7 very good Pizza Hut: Very bad 1 2 3 4 5 6 7 very good Domino’s Pizza: Very bad 1 2 3 4 5 6 7 very good
20. If you have tried the following pizza, how would you rate it’s value? Mountain Mike’s: Very bad 1 2 3 4 5 6 7 very good Round Table: Very bad 1 2 3 4 5 6 7 very good Pizza Hut: Very bad 1 2 3 4 5 6 7 very good Domino’s Pizza: Very bad 1 2 3 4 5 6 7 very good
21. If you have eaten at the following sub brands, how would you rate it’s service? Mountain Mike’s: Very bad 1 2 3 4 5 6 7 very good Round Table: Very bad 1 2 3 4 5 6 7 very good Pizza Hut: Very bad 1 2 3 4 5 6 7 very good Domino’s Pizza: Very bad 1 2 3 4 5 6 7 very good

22. How much money are you willing to pay for a 12-inch Large 1-topping pizza?[ ] Up to $9.99[ ] $10-$11.99[ ] $12-$13.99[ ] $14-$15.99[ ] Over $16
The following questions will be demographic questions: No obligations to answer
23. What is your age?_______ years
24. What is your gender?[ ] Male[ ] Female
25. What is your ethnicity?[ ] Hispanic[ ] African-American[ ] Caucasian[ ] Asian[ ] Other
26. What is your marital status?[ ] Married[ ] Single[ ] Committed[ ] Other
27. Do you live on campus?[ ] Yes[ ] No
28. If you answered No to the previous question, Where do you live?[ ] Marina[ ] Seaside[ ] Salinas[ ] Monterey[ ] Other
29. How many people are on your household?[ ] 0-1[ ] 2-3[ ] 4 or more

30. Do you have any children?[ ] Yes[ ] No
31. What is your annual income?[ ] $0 - $19,999[ ] $20,000 - $39,999[ ] $40,000 - $59,999[ ] $60,000 - $79,999[ ] $80,000 - $99,999[ ] $100,000 +
32. What industry do you work in?[ ] Retail[ ] Hospitality[ ] Marketing[ ] Healthcare[ ] Banking[ ] Other _________[ ] Unemployed
33. Do you own a car[ ] Yes[ ] No
34. If answered no to last question, what mean of transportation do you use?[ ] Bicycle[ ] Bus[ ] Walk[ ] Other
Thank you for completing our survey, here is a piece of candy!
Revised questionnaire
Hello, my name is ________, and I am a Business student from CSUMB. I am conducting a survey, about students opinions about local pizza parlors, for my market research class. This survey should take no more than 10 minutes of your time. All your answers provided will remain confidential and will only be used to determine your opinion of local pizza parlors.
Will you be willing to answer our survey questions?
1. Are you a student (If no please STOP)[ ] Yes

[ ] No
2. Do you purchase fast food at least once a month?[ ] Yes [ ] No
3. Do you use CSUMB otter bucks?[ ] Yes[ ] No
4. Have you ever seen a Mountain Mike’s ad or commercial?[ ] Yes[ ] No
5. If Mountain Mike’s Pizza accepted Otter bucks, would this increase the likelihood of you eating at Mountain Mike’s?[ ] Yes[ ] No
These questions will determine your personal preferences for pizza.
6. How many times do you typically order pizza each month (from a pizza parlor)?[ ] Never[ ] Once[ ] Twice[ ] 3-4 times[ ] More than 5 times
7. When you have pizza, do you prefer eating at the restaurant, carry out or delivery when ordering pizza?[ ] Eat at the restaurant[ ] Carry-out[ ] Delivery
8. How far are you willing to travel for your favorite pizza?[ ] Up to a mile[ ] 1 - 2 miles[ ] 2 - 5 miles[ ] More than 5 miles
9. Rank (Between 1-4), the importance of each factor when you purchase pizza?___ Customer Service___ Value___ Quality

___ Price
10. Do you know where the closest Mountain Mike’s Pizza place is?[ ] Yes[ ] No
11. Do you know where the closest Pizza Hut or Domino’s Pizza are located?[ ] Yes[ ] No
These questions will determine your satisfaction of local pizza parlors
12. How important are fresh ingredients to you in making a purchase?Not important at all 1 2 3 4 5 6 7 Very important
13. What would make you switch your favorite brand?[ ] Higher Quality[ ] Lower Price[ ] Healthier ingredients[ ] Closer location[ ] Nothing/ I’m brand loyal
14. What is your local favorite pizza company?[ ] Mountain Mike’s[ ] Round Table[ ] Pizza Hut[ ] Domino’s Pizza
15. Which of the following pizza brands are you familiar with?[ ] Mountain Mike’s[ ] Round Table[ ] Pizza Hut[ ] Domino’s Pizza
16. Which of the following pizza have you ever tried?[ ] Mountain Mike’s[ ] Round Table[ ] Pizza Hut[ ] Domino’s Pizza

17. If you have tried the following pizza, how would you rate your overall satisfaction with it? Mountain Mike’s: Very bad 1 2 3 4 5 6 7 very good Round Table: Very bad 1 2 3 4 5 6 7 very good Pizza Hut: Very bad 1 2 3 4 5 6 7 very good Domino’s Pizza: Very bad 1 2 3 4 5 6 7 very good 18. If you have tried the following pizza, how would you rate it’s food quality? Mountain Mike’s: Very bad 1 2 3 4 5 6 7 very good Round Table: Very bad 1 2 3 4 5 6 7 very good Pizza Hut: Very bad 1 2 3 4 5 6 7 very good Domino’s Pizza: Very bad 1 2 3 4 5 6 7 very good
19. If you have tried the following pizza, how would you rate it’s value? Mountain Mike’s: Very bad 1 2 3 4 5 6 7 very good Round Table: Very bad 1 2 3 4 5 6 7 very good Pizza Hut: Very bad 1 2 3 4 5 6 7 very good Domino’s Pizza: Very bad 1 2 3 4 5 6 7 very good
20. If you have eaten at the following sub brands, how would you rate it’s service? Mountain Mike’s: Very bad 1 2 3 4 5 6 7 very good Round Table: Very bad 1 2 3 4 5 6 7 very good Pizza Hut: Very bad 1 2 3 4 5 6 7 very good Domino’s Pizza: Very bad 1 2 3 4 5 6 7 very good 21. How much money are you willing to pay for a 12-inch Large 1-topping pizza?[ ] Up to $9.99

[ ] $10-$11.99[ ] $12-$13.99[ ] $14-$15.99[ ] Over $16
The following questions will be demographic questions: No obligations to answer
22. What is your age?_______ years
23. What is your gender?[ ] Male[ ] Female
24. What is your ethnicity?[ ] Hispanic[ ] African-American[ ] Caucasian[ ] Asian[ ] Other
25. What is your marital status?[ ] Married[ ] Single[ ] Committed[ ] Other
26. Do you live on campus?[ ] Yes[ ] No
27. If you answered No to the previous question, Where do you live?[ ] Marina[ ] Seaside[ ] Salinas[ ] Monterey[ ] Other
28. How many people are on your household?[ ] 0-1[ ] 2-3[ ] 4 or more
29. Do you have any children?[ ] Yes

[ ] No
30. What is your annual income?[ ] $0 - $19,999[ ] $20,000 - $39,999[ ] $40,000 - $59,999[ ] $60,000 - $79,999[ ] $80,000 - $99,999[ ] $100,000 +
31. What industry do you work in?[ ] Retail[ ] Hospitality[ ] Marketing[ ] Healthcare[ ] Banking[ ] Other _________[ ] Unemployed
32. Do you own a car[ ] Yes[ ] No
33. If answered no to last question, what mean of transportation do you use?[ ] Bicycle[ ] Bus[ ] Walk[ ] Other[ ] N/A
Thank you for completing our survey, here is a piece of candy!
Coding
Hello, my name is ________, and I am a Business student from CSUMB. I am conducting a survey, about students opinions about local pizza parlors, for my market research class. This survey should take no more than 10 minutes of your time. All your answers provided will remain confidential and will only be used to determine your opinion of local pizza parlors.
Will you be willing to answer our survey questions?
1. Are you a student (If no please STOP)

[ ] Yes =0[ ] No =1
2. Do you purchase fast food at least once a month?[ ] Yes =0[ ] No =1
3. Do you use CSUMB otter bucks?[ ] Yes =0[ ] No =1
4. Have you ever seen a Mountain Mike’s ad or commercial?[ ] Yes =0[ ] No =1
5. If Mountain Mike’s Pizza accepted Otter bucks, would this increase the likelihood of you eating at Mountain Mike’s?[ ] Yes =0[ ] No =1
These questions will determine your personal preferences for pizza.
6. How many times do you typically order pizza each month (from a pizza parlor)?[ ] Never =0[ ] Once =1[ ] Twice =2[ ] 3-4 times =3[ ] More than 5 times =4
7. When you have pizza, do you prefer eating at the restaurant, carry out or delivery when ordering pizza?[ ] Eat at the restaurant =0[ ] Carry-out =1[ ] Delivery =2
8. How far are you willing to travel for your favorite pizza?[ ] Up to a mile =0[ ] 1 - 2 miles =1[ ] 2 - 5 miles =2[ ] More than 5 miles =3
9. Rank the importance of each factor when you purchase pizza?___ Price =1-4___ Quality =1-4

___ Value =1-4___ Customer Service=1-4
10. Do you know where the closest Mountain Mike’s Pizza place is?[ ] Yes =0[ ] No =1
11. Do you know where the closest Pizza Hut or Domino’s Pizza are located?[ ] Yes =0[ ] No =1
These questions will determine your satisfaction of local pizza parlors
13. Which of the following pizza brands are you familiar with?[ ] Mountain Mike’sYes = 0No = 1[ ] Round TableYes = 0No = 1[ ] Pizza HutYes = 0No = 1[ ] Domino’s PizzaYes = 0No = 1
14. Which of the following pizza have you ever tried?[ ] Mountain Mike’sYes = 0No = 1[ ] Round TableYes = 0No = 1[ ] Pizza HutYes = 0No = 1[ ] Domino’s PizzaYes = 0No = 1
15. What is your local favorite pizza company?[ ] Mountain Mike’sYes = 0No = 1[ ] Round Table

Yes = 0No = 1[ ] Pizza HutYes = 0No = 1[ ] Domino’s PizzaYes = 0No = 1
16. What would make you switch your favorite brand?[ ] Higher QualityYes = 0No = 1[ ] Lower PriceYes = 0No = 1[ ] Healthier ingredientsYes = 0No = 1[ ] Closer locationYes = 0No = 1
17. How important are fresh ingredients to you in making a purchase?Not important at all 1 2 3 4 5 6 7 Very important1 = 12 = 23 = 34 = 45 = 56 = 67 = 7
18. If you have tried the following pizza, how would you rate your overall satisfaction with it? Mountain Mike’s: Very bad 1 2 3 4 5 6 7 very good1 = 12 = 23 = 34 = 45 = 56 = 67 = 7 Round Table: Very bad 1 2 3 4 5 6 7 very good

1 = 12 = 23 = 34 = 45 = 56 = 67 = 7 Pizza Hut: Very bad 1 2 3 4 5 6 7 very good1 = 12 = 23 = 34 = 45 = 56 = 67 = 7 Domino’s Pizza: Very bad 1 2 3 4 5 6 7 very good1 = 12 = 23 = 34 = 45 = 56 = 67 = 7
19. If you have tried the following pizza, how would you rate it’s food quality? Mountain Mike’s: Very bad 1 2 3 4 5 6 7 very good1 = 12 = 23 = 34 = 45 = 56 = 67 = 7 Round Table: Very bad 1 2 3 4 5 6 7 very good1 = 12 = 23 = 34 = 45 = 56 = 67 = 7

Pizza Hut: Very bad 1 2 3 4 5 6 7 very good1 = 12 = 23 = 34 = 45 = 56 = 67 = 7 Domino’s Pizza: Very bad 1 2 3 4 5 6 7 very good1 = 12 = 23 = 34 = 45 = 56 = 67 = 7
20. If you have tried the following pizza, how would you rate it’s value? Mountain Mike’s: Very bad 1 2 3 4 5 6 7 very good1 = 12 = 23 = 34 = 45 = 56 = 67 = 7 Round Table: Very bad 1 2 3 4 5 6 7 very good1 = 12 = 23 = 34 = 45 = 56 = 67 = 7 Pizza Hut: Very bad 1 2 3 4 5 6 7 very good1 = 12 = 23 = 34 = 45 = 56 = 6

7 = 7 Domino’s Pizza: Very bad 1 2 3 4 5 6 7 very good1 = 12 = 23 = 34 = 45 = 56 = 67 = 7
21. If you have eaten at the following sub brands, how would you rate it’s service? Mountain Mike’s: Very bad 1 2 3 4 5 6 7 very good1 = 12 = 23 = 34 = 45 = 56 = 67 = 7 Round Table: Very bad 1 2 3 4 5 6 7 very good1 = 12 = 23 = 34 = 45 = 56 = 67 = 7 Pizza Hut: Very bad 1 2 3 4 5 6 7 very good1 = 12 = 23 = 34 = 45 = 56 = 67 = 7 Domino’s Pizza: Very bad 1 2 3 4 5 6 7 very good1 = 12 = 23 = 34 = 4

5 = 56 = 67 = 7
22. How much money are you willing to pay for a 12-inch Large 1-topping pizza?[ ] Up to $9.99 =0[ ] $10-$11.99 =1[ ] $12-$13.99 =2[ ] $14-$15.99 =3[ ] Over $16 =4
The following questions will be demographic questions: No obligations to answer
23. What is your age?_______ years= # Value entered
24. What is your gender?[ ] Male =0[ ] Female =1
25. What is your ethnicity?[ ] Hispanic =0[ ] African-American =1[ ] Caucasian =2[ ] Asian =3[ ] Other =4
26. What is your marital status?[ ] Married =0[ ] Single =1[ ] Committed =2[ ] Other =3
27. Do you live on campus?[ ] Yes =0[ ] No =1
28. If you answered No to the previous question, Where do you live?[ ] Marina =0[ ] Seaside =1[ ] Salinas =2[ ] Monterey =3[ ] Other =4

29. How many people are on your household?[ ] 0-1 =0[ ] 2-3 =1[ ] 4 or more =2
30. Do you have any children?[ ] Yes =0[ ] No =1
31. What is your annual income?[ ] $0 - $19,999 =0[ ] $20,000 - $39,999 =1[ ] $40,000 - $59,999 =2[ ] $60,000 - $79,999 =3[ ] $80,000 - $99,999 =4[ ] $100,000 + =5
32. What industry do you work in?[ ] Retail =0[ ] Hospitality =1[ ] Marketing =2[ ] Healthcare =3[ ] Banking =4[ ] Other _________ =5[ ] Unemployed =6
33. Do you own a car[ ] Yes =0[ ] No =1
34. If answered no to last question, what mean of transportation do you use?[ ] Bicycle =0[ ] Bus =1[ ] Walk =2[ ] Other =3
Thank you for completing our survey, here is a piece of candy!


![[PPT]Food Processing Industry - E-R Impreseimprese.regione.emilia-romagna.it/internazionalizzazione/eventi/... · Web viewMarket Assessment of Food and Food Processing Industry](https://img.pdfslide.us/doc/110x75/5ab1da0e7f8b9a6b468d0849/pptfood-processing-industry-e-r-viewmarket-assessment-of-food-and-food-processing.jpg)


![#CapCom16 : AT9 - [Méthodo] Oser le street marketing](https://img.pdfslide.us/doc/110x75/58734ddb1a28ab56378b5a2f/capcom16-at9-methodo-oser-le-street-marketing.jpg)