Embed Size (px)
Citation preview
gas 2O18Analysis and Forecasts to 2O23
Ma
rk
et
Re
po
rt
Se
rie
s
executive summary
INTERNATIONAL ENERGY AGENCY
The IEA examines the full spectrum of energy issues including oil, gas and coal supply and demand, renewable energy technologies, electricity markets, energy efficiency, access
to energy, demand side management and much more. Through its work, the IEA advocates policies that will enhance the reliability, affordability and sustainability of energy in its 30 member countries, 7 association countries and beyond.
The four main areas of IEA focus are:
n Energy Security: Promoting diversity, efficiency, flexibility and reliability for all fuelsand energy sources;
n Economic Development: Supporting free markets to foster economic growth andeliminate energy poverty;
n Environmental Awareness: Analysing policy options to offset the impactof energy production and use on the environment, especially for
tackling climate change and air pollution; and
n Engagement Worldwide: Working closely with associationand partner countries, especially major emerging
economies, to find solutions to shared energy and environmental
concerns.
IEA member countries:
Australia Austria
Belgium Canada
Czech RepublicDenmark
EstoniaFinland
FranceGermany
GreeceHungary
Ireland Italy
JapanKoreaLuxembourgMexicoNetherlandsNew Zealand NorwayPolandPortugalSlovak RepublicSpainSwedenSwitzerland
TurkeyUnited Kingdom
United States
The European Commission also participates in
the work of the IEA.
Please note that this publication is subject to specific restrictions that limit its use and distribution.
The terms and conditions are available online at www.iea.org/t&c/
© OECD/IEA, 2018
International Energy Agency Website: www.iea.org
Together
SecureSustainable
EXECUTIVE SUMMARY
GAS MARKET REPORT 2018 3
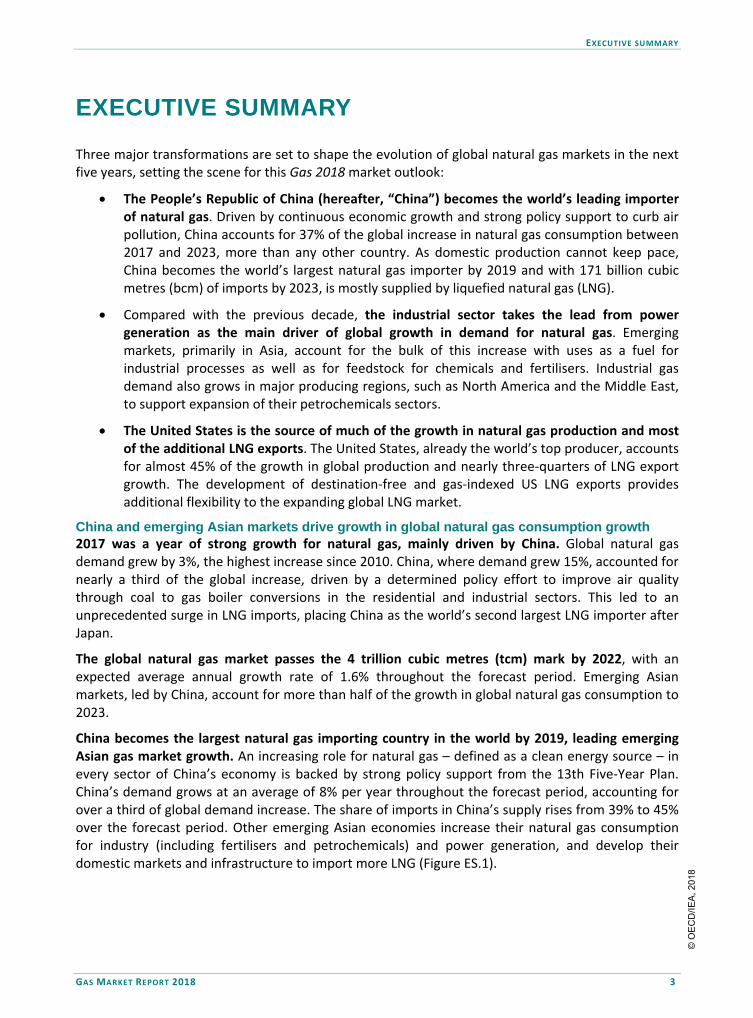
EXECUTIVE SUMMARY
Three major transformations are set to shape the evolution of global natural gas markets in the next five years, setting the scene for this Gas 2018 market outlook:
The People’s Republic of China (hereafter, “China”) becomes the world’s leading importerof natural gas. Driven by continuous economic growth and strong policy support to curb airpollution, China accounts for 37% of the global increase in natural gas consumption between2017 and 2023, more than any other country. As domestic production cannot keep pace,China becomes the world’s largest natural gas importer by 2019 and with 171 billion cubicmetres (bcm) of imports by 2023, is mostly supplied by liquefied natural gas (LNG).
Compared with the previous decade, the industrial sector takes the lead from powergeneration as the main driver of global growth in demand for natural gas. Emergingmarkets, primarily in Asia, account for the bulk of this increase with uses as a fuel forindustrial processes as well as for feedstock for chemicals and fertilisers. Industrial gasdemand also grows in major producing regions, such as North America and the Middle East,to support expansion of their petrochemicals sectors.
The United States is the source of much of the growth in natural gas production and mostof the additional LNG exports. The United States, already the world’s top producer, accountsfor almost 45% of the growth in global production and nearly three-quarters of LNG exportgrowth. The development of destination-free and gas-indexed US LNG exports providesadditional flexibility to the expanding global LNG market.
China and emerging Asian markets drive growth in global natural gas consumption growth 2017 was a year of strong growth for natural gas, mainly driven by China. Global natural gas demand grew by 3%, the highest increase since 2010. China, where demand grew 15%, accounted for nearly a third of the global increase, driven by a determined policy effort to improve air quality through coal to gas boiler conversions in the residential and industrial sectors. This led to an unprecedented surge in LNG imports, placing China as the world’s second largest LNG importer after Japan.
The global natural gas market passes the 4 trillion cubic metres (tcm) mark by 2022, with an expected average annual growth rate of 1.6% throughout the forecast period. Emerging Asian markets, led by China, account for more than half of the growth in global natural gas consumption to 2023.
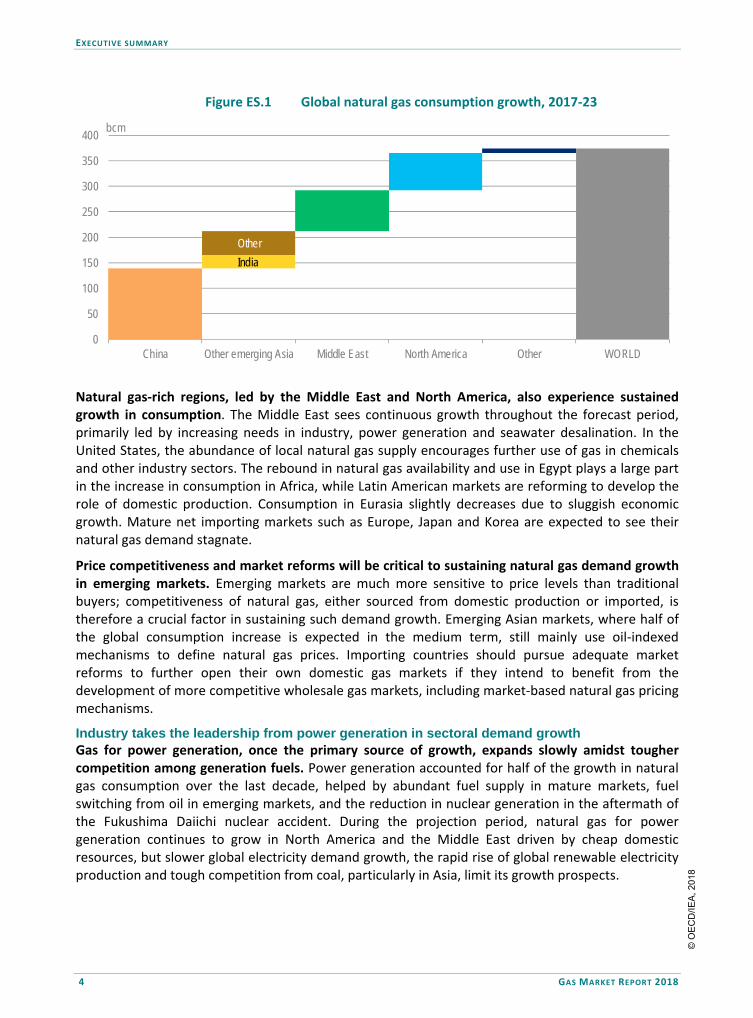
China becomes the largest natural gas importing country in the world by 2019, leading emerging Asian gas market growth. An increasing role for natural gas – defined as a clean energy source – in every sector of China’s economy is backed by strong policy support from the 13th Five-Year Plan. China’s demand grows at an average of 8% per year throughout the forecast period, accounting for over a third of global demand increase. The share of imports in China’s supply rises from 39% to 45% over the forecast period. Other emerging Asian economies increase their natural gas consumption for industry (including fertilisers and petrochemicals) and power generation, and develop their domestic markets and infrastructure to import more LNG (Figure ES.1).
© O
EC
D/IE
A, 2
018
EXECUTIVE SUMMARY
4 GAS MARKET REPORT 2018
Figure ES.1 Global natural gas consumption growth, 2017-23
0
50
100
150
200
250
300
350
400
China Other emerging Asia Middle East North America Other WORLD
bcm
Other
India
Natural gas-rich regions, led by the Middle East and North America, also experience sustained growth in consumption. The Middle East sees continuous growth throughout the forecast period, primarily led by increasing needs in industry, power generation and seawater desalination. In the United States, the abundance of local natural gas supply encourages further use of gas in chemicals and other industry sectors. The rebound in natural gas availability and use in Egypt plays a large part in the increase in consumption in Africa, while Latin American markets are reforming to develop the role of domestic production. Consumption in Eurasia slightly decreases due to sluggish economic growth. Mature net importing markets such as Europe, Japan and Korea are expected to see their natural gas demand stagnate.
Price competitiveness and market reforms will be critical to sustaining natural gas demand growth in emerging markets. Emerging markets are much more sensitive to price levels than traditional buyers; competitiveness of natural gas, either sourced from domestic production or imported, is therefore a crucial factor in sustaining such demand growth. Emerging Asian markets, where half of the global consumption increase is expected in the medium term, still mainly use oil-indexed mechanisms to define natural gas prices. Importing countries should pursue adequate market reforms to further open their own domestic gas markets if they intend to benefit from the development of more competitive wholesale gas markets, including market-based natural gas pricing mechanisms.
Industry takes the leadership from power generation in sectoral demand growth Gas for power generation, once the primary source of growth, expands slowly amidst tougher competition among generation fuels. Power generation accounted for half of the growth in natural gas consumption over the last decade, helped by abundant fuel supply in mature markets, fuel switching from oil in emerging markets, and the reduction in nuclear generation in the aftermath of the Fukushima Daiichi nuclear accident. During the projection period, natural gas for power generation continues to grow in North America and the Middle East driven by cheap domestic resources, but slower global electricity demand growth, the rapid rise of global renewable electricity production and tough competition from coal, particularly in Asia, limit its growth prospects.
© O
EC
D/IE
A, 2
018
EXECUTIVE SUMMARY
GAS MARKET REPORT 2018 5
Industry emerges as the main driver of growth in natural gas consumption. The industrial sector is expected to account for 40% of the increase in natural gas consumption, replacing power generation as the main driver. Incremental industrial uses cover both energy for processes and feedstock for chemicals including fertilisers in emerging economies and feedstock for petrochemicals for export in regions with abundant natural gas.
The United States keeps its leading role in supply and export growth The United States, the largest producer of natural gas, accounts for the largest share of supply expansion, with the production outlook given a boost by the gas associated with tight oil output. US natural gas production recovered in 2017 after a decline in 2016. Shale gas now accounts for two-thirds of total output. Shale gas from the Appalachian (dry gas) and Permian (mainly associated gas) basins are the main pillars of US gas production growth and continue to grow, with Permian taking the lead as recovering oil prices favour investment in US light tight oil (LTO) production, increasing associated natural gas output. Additional US production accounts for almost 45% of the global growth and two thirds of that is exported via pipeline to Mexico or as LNG globally.
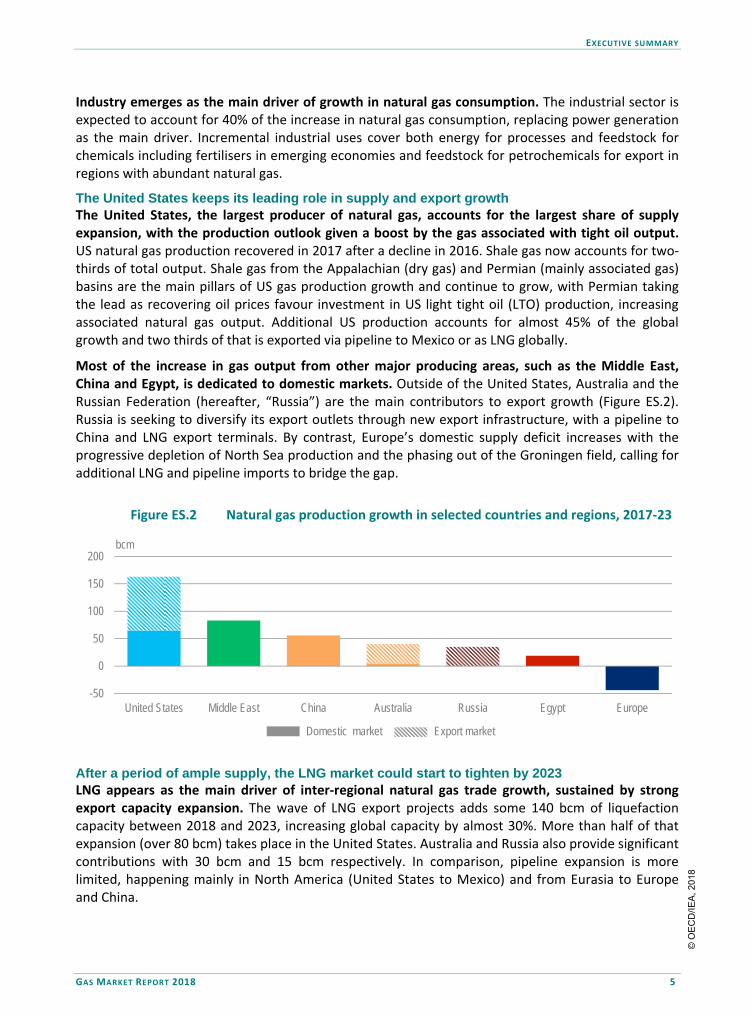
Most of the increase in gas output from other major producing areas, such as the Middle East, China and Egypt, is dedicated to domestic markets. Outside of the United States, Australia and the Russian Federation (hereafter, “Russia”) are the main contributors to export growth (Figure ES.2). Russia is seeking to diversify its export outlets through new export infrastructure, with a pipeline to China and LNG export terminals. By contrast, Europe’s domestic supply deficit increases with the progressive depletion of North Sea production and the phasing out of the Groningen field, calling for additional LNG and pipeline imports to bridge the gap.
Figure ES.2 Natural gas production growth in selected countries and regions, 2017-23
-50
0
50
100
150
200
United States Middle East China Australia Russia Egypt Europe
bcm
Domestic market Export market
After a period of ample supply, the LNG market could start to tighten by 2023 LNG appears as the main driver of inter-regional natural gas trade growth, sustained by strong export capacity expansion. The wave of LNG export projects adds some 140 bcm of liquefaction capacity between 2018 and 2023, increasing global capacity by almost 30%. More than half of that expansion (over 80 bcm) takes place in the United States. Australia and Russia also provide significant contributions with 30 bcm and 15 bcm respectively. In comparison, pipeline expansion is more limited, happening mainly in North America (United States to Mexico) and from Eurasia to Europe and China.
© O
EC
D/IE
A, 2
018
EXECUTIVE SUMMARY
6 GAS MARKET REPORT 2018
The emergence of the United States as a global exporter challenges the traditional features of LNG trade. This wave of liquefaction projects, expected in the coming two years, ensures ample supply and growth of LNG trade but also challenges the traditional features of supply contracts. Emergence of US exports with flexible destination and gas-indexed pricing presents different models from the standard fixed-delivery, oil-indexed supply agreements. Australia and the United States appear as new global players likely to challenge Qatar in Asian markets.
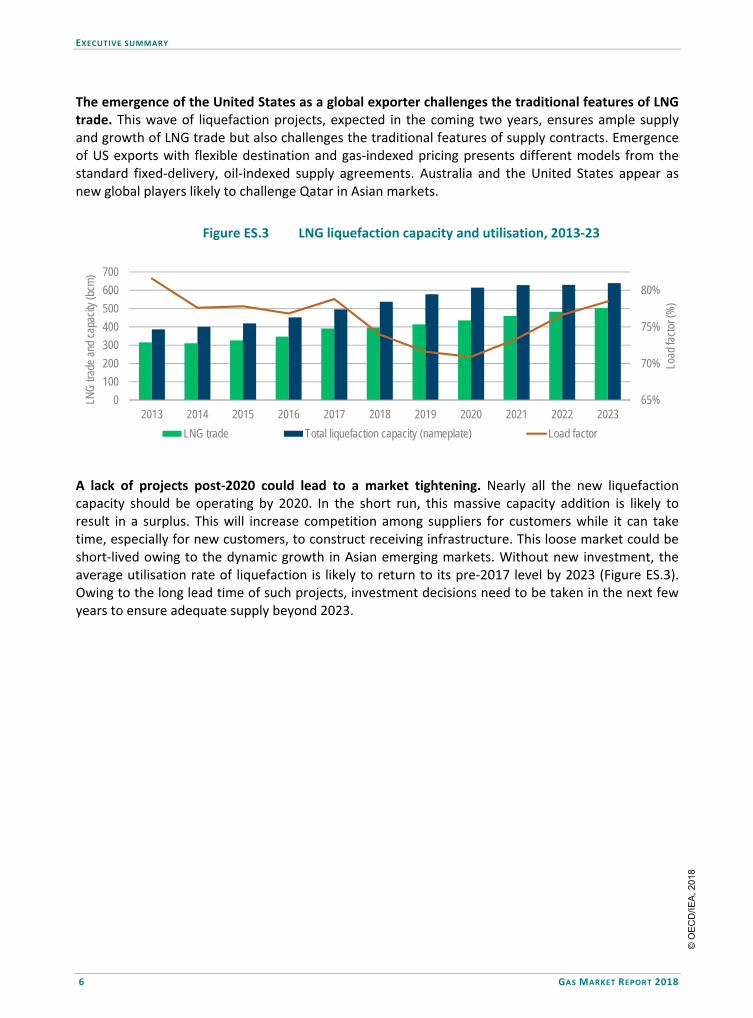
Figure ES.3 LNG liquefaction capacity and utilisation, 2013-23
65%
70%
75%
80%
0
100
200
300
400
500
600
700
2013 2014 2015 2016 2017 2018 2019 2020 2021 2022 2023
Load
fact
or (%
)
LNG
trad
e an
d ca
paci
ty (b
cm)
LNG trade Total liquefaction capacity (nameplate) Load factor
A lack of projects post-2020 could lead to a market tightening. Nearly all the new liquefaction capacity should be operating by 2020. In the short run, this massive capacity addition is likely to result in a surplus. This will increase competition among suppliers for customers while it can take time, especially for new customers, to construct receiving infrastructure. This loose market could be short-lived owing to the dynamic growth in Asian emerging markets. Without new investment, the average utilisation rate of liquefaction is likely to return to its pre-2017 level by 2023 (Figure ES.3). Owing to the long lead time of such projects, investment decisions need to be taken in the next few years to ensure adequate supply beyond 2023.
© O
EC
D/IE
A, 2
018

Onl
in
e bookshopPDF versions at 20% discount
ww
w.i
ea.o
rg/booksIn
tern
atio
nal
Energy Agency
Secure Sustain
able T
oget
her
World Energy Outlook series
World Energy
Investment series
Energy Statistics series
Energy Policiesof IEA
Countriesseries
Energy Technology
Perspectives series
E-mail: books@
iea.org
Market ReportSeries
Oil
Coal
RenewableEnergy Energy
Efficiency
Gas
Global Gas Security series
EnergyPolicies
Beyond IEA Countriesseries
This publication reflects the views of the IEA Secretariat but does not necessarily reflect those of individual IEA member countries. The IEA makes no representation or warranty, express or implied, in respect of the publication’s contents (including its completeness or accuracy) and shall not be responsible for any use of, or reliance on, the publication.
Unless otherwise indicated, all material presented in figures and tables is derived from IEA data and analysis.
This publication and any map included herein are without prejudice to the status of or sovereignty over any territory, to the delimitation of international frontiers and boundaries and to the name of any territory, city or area.
IEA/OECD possible corrigenda on: www.oecd.org/about/publishing/corrigenda.htm
IEA PublicationsInternational Energy Agency
Website: www.iea.orgContact information: www.iea.org/about/contact
Typeset in France by IEA - June 2018 Cover design: IEA; Photo credits: © GraphicObsession
Ma
rk
et
Re
po
rt
Se
rie
s
GAS 2O18
The gas industry’s future remains bright. Three major shifts will shape the evolution
of global natural gas markets in the next five years – growing imports from China,
greater industrial demand, and rising production from the United States.
The structural shift will determine the evolution of the market at a time when
growth in emerging markets is sustained by strong economic expansion and
strong policy support to curb air pollution. Industry becomes a major player in
gas markets, while the United States cements its position as a top producer and
exporter thanks to its shale revolution.
Gas 2018, the latest IEA annual market report, assesses these trends and provides
a detailed analysis of supply and trade developments, infrastructure investments,
and demand-growth forecast through 2023.
The report analyses the main changes that will likely transform the natural gas
market, including market reforms that shape supply and demand patterns in
key Asian economies and developments in the LNG market – the main driver of
interregional natural gas trade growth.
Analysis and Forecasts to 2O23