Embed Size (px)
Citation preview
cushmanwakefield.com
Market ReportSuburban Maryland | 4th Quarter 2017

Cushman & Wakefield | 2
DC Metropolitan Area Overview..............................................................................3
Suburban Maryland & Map...................................................................................4-6
Bethesda/Chevy Chase...............................................................................................7
Rock Spring Park..........................................................................................................8
Pike Corridor..................................................................................................................9
I-270/Rockville..............................................................................................................10
Gaithersburg/Germantown.......................................................................................11
Silver Spring....................................................................................................................12
Prince George’s County..............................................................................................13
Frederick County..........................................................................................................14
Appendix.........................................................................................................................15
Tables..........................................................................................................................18-25
Methodology & Definitions......................................................................................26
About Cushman & Wakefield.................................................................................27
Contents

cushmanwakefield.com | 3
Washington, DC Metropolitan Area
WASHINGTON, DC METRO
Q4 16 Q4 17 12-Month Forecast
DC Metro Employment 3.2M 3.3M
DC Metro Unemployment 3.8% 3.6%
U.S. Unemployment 4.6% 4.1%
Economic Indicators
Market IndicatorsQ4 16 Q4 17 12-Month
Forecast
Overall Vacancy 17.8% 17.8%
Net Absorption 1.4M 1.9M
Under Construction 8.4M 10.0M
Average Asking Rent (FS) $35.85 $37.54
Net Absorption/Asking Rent 4Q TRAILING AVERAGE
Washington, DC Metropolitan Area NET ABSORPTION - DELIVERIES - VACANCY
The past 12 months proved to be another strong year for economic performance in the Washington, DC metropolitan region (DC metro). For a third straight year, job growth far exceeded the historical average, adding 56,300 nonfarm payroll positions in 2017 – only slightly off the 2015 and 2016 totals of 57,000 per year. Job growth was led by the office-intensive Professional and Business Services sector, which grew by 16,300 jobs in 2017. Job creation in other office-using sectors was flat to negative: employment in Financial Services ended the year up 700, in Federal Government down 500 and in Information down 2,500 jobs. Among non-office-using sectors, the Education and Healthcare, and Leisure and Hospitality sectors experienced strong gains of over 13,000 positions each. The District of Columbia (DC) added 10,000 jobs while Northern Virginia (NoVA) and Suburban Maryland (SMD) both added 23,000.
While job growth and the overall economy continued to surge, overall net absorption continued to erode compared to historical averages. The DC metro region absorbed 1.9 million square feet (msf) of space in 2017, well off the 2.6 msf that the region has averaged every year since 2001. The regional vacancy rate was 17.8%, relatively unchanged from year-end 2016. DC accounted for 600,000 square feet (sf) of absorption and a 12.4% vacancy rate, NoVA registered 1.0 msf of absorption and a vacancy rate of 21.5% and SMD had 130,000 sf of absorption with vacancy ending the year at 19.4%.
While technology, consumer goods and real estate firms executed several notable new leases in 2017, most large new transactions were executed by organizations that are typically on the “top deals” list in the DC metro region: federal agencies, law firms, not-for-profits and federal contractors. The federal government’s leasing arm – the General Services Administration (GSA) – was responsible for the largest lease of the year in each of the three DC metro jurisdictions, with the Federal Communications Commission leasing 473,000 sf in DC, the Transportation Security Administration leasing 625,000 sf in Northern Virginia, and the Department of Homeland Security leasing 575,000 sf in Suburban Maryland. These three cases demonstrate that the government will continue to consolidate large requirements in submarkets that offer quality development at a relative value compared to pricier, traditional government enclaves.
New supply in the core downtown submarkets of DC continues to be a concern for overall market fundamentals looking forward. The Central Business District (CBD), East End, and Capitol Hill/NoMa are expected to deliver over 7.0 msf of office space in the next 24 months, 4.8 msf of which is currently under construction. Among those projects that are currently under construction, 2.5 msf—51%—is already preleased. Expect vacancy rates and concessions to rise in these submarkets as tenants continue to seek the top floors while velocity on lesser space in new developments remains modest, at best.
On the flipside, the transit-oriented suburban submarkets have been relatively supply-constrained with under-construction projects nearing 80.0% preleased. This supply constraint is subject to change as a plethora of high-profile, large tenants are currently active in the market with limited existing quality space options left to accommodate them. This will benefit developers like Carr Properties, The Meridian Group and JBG Smith, all of whom have risked spec development. The next 12 to 18 months should see two or more developments getting underway in Reston/Herndon, one likely in Tysons, and an active market for projects that recently broke ground in Bethesda.
$36
$37
$37
$38
$38
$39
$39
-1,000
-500
0
500
1,000
1,500
2011 2012 2013 2014 2015 2016 2017Net Absorption, SF (thousands) Asking Rent, $ PSF
0%
4%
8%
12%
16%
20%
-6-4-202468
10
05 06 07 08 09 10 11 12 13 14 15 16 17
Vaca
ncy R
ate
MSF
Net Absorption Deliveries

Cushman & Wakefield | 4
Suburban Maryland
Overall Vacancy
Net Absorption/Asking Rent FOUR QUARTER TRAILING AVERAGE
Market IndicatorsQ4 16 Q4 17 12-Month
Forecast
Vacancy 20.6% 19.4%
YTD Absorption (sf) 747k 130k
Under Construction (sf) 0 1,106,787
Average Asking Rent $26.33 $26.85
$25.00$25.50$26.00$26.50$27.00$27.50$28.00$28.50$29.00
-3
-2
-1
0
1
2
3
2011 2012 2013 2014 2015 2016 Q2 2017
x 100
000
Net Absorption, MSF Asking Rent, $ PSF
Suburban Maryland Office Q4 2017
MARKETBEAT
cushmanwakefield.com
Economic Indicators
Market Indicators (Overall, All Classes)
Overall Net Absorption/Overall Asking Rent4-QTR TRAILING AVERAGE
Overall Vacancy
EconomyJob growth in Suburban Maryland remained strong in 2017, but themajority of job gains were in non-office-using sectors. From Januarythrough November, the local economy generated just over 15,700 netnew, nonfarm payroll jobs. Leading job growth year-over-year were theEducation and Healthcare sector with 5,400 jobs, and Leisure andHospitality with 5,300 jobs. For the office-using sectors there was a lossof about 1,350 jobs in Information, Financial, and Federal employment,and a small gain of 370 jobs in the Professional Business Servicessector.
Market OverviewFollowing headline-making headquarters relocations by the GeneralServices Administration (GSA) for the Department of HomelandSecurity’s (DHS) Citizenship and Immigration Services (CIS) to PrinceGeorge’s County, and by Marriott International to Bethesda/ChevyChase, Suburban Maryland once again captured two notable leases bythe close of the fourth quarter of 2017. JBG Smith secured two morepreleases (also the second and third largest leases of the quarter) at4747 Bethesda Avenue: Booz Allen Hamilton preleased 65,000 squarefeet (sf) and Host Hotels preleased 55,000 sf, bringing the Class Abuilding to 71.0% committed. These two leases helped new leasingactivity close the fourth quarter of 2017 at 3.7 million square feet (msf)—the highest level since 2007.
Such healthy leasing activity resulted in positive overall year-to-date netabsorption of 130,658 sf, 90,173 sf of which occurred in the fourthquarter. There was a handful of small to midsized tenants andexpansions that helped bolster overall net absorption. The GSAexpanded to take 12,000 sf at 20030 Century Boulevard, and the Makea Wish Foundation moved into 11,000 sf at 4451-4459 ForbesBoulevard. The largest move-in of the quarter was Bank of America/Merrill Lynch which occupied 23,500 sf at 7501 Wisconsin Avenue.Given positive absorption, overall vacancy declined 140 basis points(bps) year-over-year, closing the fourth quarter of 2017 at 19.4%. Withdeclining vacancy—particularly in the Bethesda/Chevy Chase submarketwhere vacancy remained among the lowest in the region—landlordshave begun to push overall asking rents upward. Overall asking rents forall classes in Suburban Maryland closed the fourth quarter of 2017 at$26.85 per square foot (psf).
Throughout 2017, headlines focused on the development story ofBethesda/Chevy Chase, particularly as several buildings are expected togo spec over the next 12 to 18 months. But other areas of the SuburbanMaryland market have also continued to attract tenants with build to-suitopportunities, including Kaiser Permanente’s building at 4000 GardenCity Drive, and the DHS/CIS headquarters at One Town Center.
OutlookWith the pipeline of new construction coming to the Bethesda/ChevyChase submarket and the Purple Line finally underway, excitementcontinues to build in the Suburban Maryland market. The area’s strongdemographics, exceptional amenities and growing range oftransportation options position Suburban Maryland for revitalization inthe Metro-accessible submarkets. With the increasing trend towardthe live-work-play environment, these new multipurpose developmentswill appeal strongly to companies that are looking to attract and retaintop talent in their workforce. However, vacancies in non-Metro servedlocations are likely to remain elevated as tenants gravitate towards moreamenitized options.
Q4 16 Q4 17 12-Month Forecast
D.C. Metro Employment 3.2M 3.3M
D.C. Metro Unemployment 3.8% 3.6%
U.S. Unemployment 4.7% 4.1%
Q4 16 Q4 17 12-Month Forecast
Vacancy 20.6% 19.4%
YTD Net Absorption (sf) 747k 130k
Under Construction (sf) 0 1,106,787
Average Asking Rent* $26.33 $26.85
*Rental rates reflect gross asking $psf/year
$25.00$25.50$26.00$26.50$27.00$27.50$28.00$28.50$29.00
-300-250-200-150-100-50
050
100150200250
2011 2012 2013 2014 2015 2016 Q4 2017
Thou
sand
s
Net Absorption, MSF Asking Rent, $ PSF
12%
14%
16%
18%
20%
22%
24%
2011 2012 2013 2014 2015 2016 2017
Historical Average = 19.5%
SUBURBAN MARYLAND OFFICE
EconomyJob growth in Suburban Maryland remained strong in 2017, but the majority of job gains were in non-office-using sectors. From January through November, the local economy generated just over 15,700 net new, nonfarm payroll jobs. Leading job growth year-over-year were the Education and Healthcare sector with 5,400 jobs, and Leisure and Hospitality with 5,300 jobs. For the office-using sectors there was a loss of about 1,350 jobs in Information, Financial, and Federal employment, and a small gain of 370 jobs in the Professional Business Services sector.
Market OverviewFollowing headline-making headquarters relocations by the General Services Administration (GSA) for the Department of Homeland Security’s (DHS) Citizenship and Immigration Services (CIS) to Prince George’s County, and by Marriott International to Bethesda/Chevy Chase, Suburban Maryland once again captured two notable leases by the close of the fourth quarter of 2017. JBG Smith secured two more preleases (also the second and third largest leases of the quarter) at 4747 Bethesda Avenue: Booz Allen Hamilton preleased 65,000 square feet (sf) and Host Hotels preleased 55,000 sf, bringing the Class A building to 71.0% committed. These two leases helped new leasing activity close the fourth quarter of 2017 at 3.7 million square feet (msf)—the highest level since 2007.
Such healthy leasing activity resulted in positive overall year-to-date net absorption of 130,658 sf, 90,173 sf of which occurred in the fourth quarter. There was a handful of small to midsized tenants and expansions that helped bolster overall net absorption. The GSA expanded to take 12,000 sf at 20030 Century Boulevard, and the Make a Wish Foundation moved into 11,000 sf at 4451-4459 Forbes Boulevard. The largest move-in of the quarter was Bank of America/Merrill Lynch which occupied 23,500 sf at 7501 Wisconsin Avenue. Given positive absorption, overall vacancy declined 140 basis points (bps) year-over-year, closing the fourth quarter of 2017 at 19.4%. With declining vacancy—particularly in the Bethesda/Chevy Chase submarket where vacancy remained among the lowest in the region—landlords have begun to push overall asking rents upward. Overall asking rents for all classes in Suburban Maryland closed the fourth quarter of 2017 at$26.85 per square foot (psf).
Throughout 2017, headlines focused on the development story of Bethesda/Chevy Chase, particularly as several buildings are expected to go spec over the next 12 to 18 months. But other areas of the Suburban Maryland market have also continued to attract tenants with build to-suit opportunities, including Kaiser Permanente’s building at 4000 Garden City Drive, and the DHS/CIS headquarters at One Town Center.
OutlookWith the pipeline of new construction coming to the Bethesda/Chevy Chase submarket and the Purple Line finally underway, excitement continues to build in the Suburban Maryland market. The area’s strong demographics, exceptional amenities and growing range of transportation options position Suburban Maryland for revitalization in the Metro-accessible submarkets. With the increasing trend toward the live-work-play environment, these new multipurpose developments will appeal strongly to companies that are looking to attract and retain top talent in their workforce. However, vacancies in non-Metro served locations are likely to remain elevated as tenants gravitate towards more amenitized options.

cushmanwakefield.com | 5
Maryland Office Submarkets
cushmanwakefield.com | 5
Maryland Office Submarkets
270
28
340
85
190
495 395
95
95
210 51
295
9529
695
795
83
32
27 26
236
FREDERICK
GERMANTOWN
GAITHERSBURG
I-270/ROCKVILLE
PIKE CORRIDOR
ROCK SPRINGPARK
BETHESDA/CHEVY CHASE SILVER
SPRING
NORTHSILVER SPRING
LAUREL
BELTSVILLE/COLLEGE PARK
GREENBELT
BOWIE
OXON HILL/SUITLAND
LANDOVER/LANHAM

Cushman & Wakefield | 6
Suburban Maryland Office MarketInventory & Vacancy by Submarket, Fourth Quarter 2017
Top Transactions
Suburban Maryland Office MarketNet Absorption - Deliveries - Vacancy, Fourth Quarter 2017
Key Lease Transactions Q4 2017
2
Suburban MarylandNet Absorption – Deliveries – Vacancy
0%
4%
8%
12%
16%
20%
24%
-1.5
-1.0
-0.5
0.0
0.5
1.0
1.5
2.0
05 06 07 08 09 10 11 12 13 14 15 16 17
Vaca
ncy
Rat
e
MSF
Net Absorption Deliveries Vacancy Rate
PROPERTY SF TENANT TRANSACTION TYPE SUBMARKET
2115 East Jefferson Street 89,708 GSA - National Institutes of Health Renewal Pike Corridor
4747 Bethesda Avenue 65,000 Booz Allen Hamilton Direct Bethesda/Chevy Chase
4747 Bethesda Avenue 55,050 Host Hotels Direct Bethesda/Chevy Chase
6511 America Boulevard 54,000 GSA - Federal Emergency Management Agency Renewal Bethesda/Chevy Chase
4600 Powder Mill Road 40,000 Virginia College Renewal Bethesda/Chevy Chase
4
Suburban Maryland Office Market Inventory & Vacancy by Submarket, Fourth Quarter 2017
10%
12%
14%
16%
18%
20%
22%
24%
0
2
4
6
8
10
12
14
16
Vaca
ncy
Rat
e
MSF
Class A Class B Class C Vacancy % MD Overall Vacancy

cushmanwakefield.com | 7
Bethesda/Chevy Chase
The Bethesda/Chevy Chase submarket closed the fourth quarter of 2017 with generally healthy market fundamentals. Year-to-date new leasing activity registered just over 1.2 million square feet (msf)—a record high due in large part to Marriott International, Inc.’s prelease for its future headquarters at 7750 Wisconsin Avenue committed to earlier in the year. Additionally, fourth-quarter leasing activity was bolstered by two preleases secured by JBG Smith at 4747 Bethesda Avenue: Booz Allen Hamilton preleased 65,000 square feet (sf) and Host Hotels preleased 55,050 sf. Combined with JBG Smith’s previously announced commitment to take approximately 100,000 sf at the property, the Class A building is currently 71.0% preleased. The third-largest lease of the fourth quarter of 2017 was that executed by WTOP for 30,612 sf at 5425 Wisconsin Avenue.
Despite record new leasing activity, year-to-date net absorption closed the fourth quarter of 2017 at negative 91,454 sf—a year-over-year (YOY) decline of 67.0%. The decline was primarily a result of limited near-term availabilities for tenants. The first new construction building is not scheduled to deliver until mid-2019, leaving few existing options in the Bethesda/Chevy Chase submarket. However, given that new leasing activity has been buoyed by a number of large preleases from new-to-the-submarket tenants, once those new buildings deliver, net absorption will certainly spike upward.
The overall vacancy rate in the Bethesda/Chevy Chase submarket closed the fourth quarter of 2017 at 10.8%. While that is up slightly year-over-year by 110 basis points (bps), it is still among the lowest in the region.
Given the relatively low vacancy in the submarket, overall asking rents have continued to hold steady, closing the fourth quarter of 2017 at $36.89 per square foot (psf) for all classes. Class A rental rates closed the quarter at $41.08 psf—a 4% decline quarter-over-quarter—primarily due to a large block of space with above-average asking rents leasing up in the fourth quarter, and increasingly limited quality options remaining on the market.
OutlookOverall, the Bethesda/Chevy Chase submarket is positioned for a market resurgence, with multiple buildings in the construction pipeline and healthy preleasing at very strong rents already underway for many of them. Given the submarket’s strong amenity base, Metro access to both the existing Red Line and a future Purple Line station, and a broad tenant base of professional and business services, the new deliveries will continue to attract tenants from across the region. This is evident in Marriott’s decision to relocate its headquarters to the market, and Booz Allen Hamilton and Host Hotels committing to leases in Bethesda from other submarkets. Additionally, with one of the lowest vacancy rates in the region and no new deliveries set to hit the market until mid-2019, the Bethesda/Chevy Chase submarket is expected to remain landlord-favorable for the next 12 to 18 months.
Market Indicators*Arrows = Current Qtr Trend
Asking Rent
Net Absorption – Deliveries – Vacancy
New Leasing Activity
Asking Rent$36.89
Net Absorption(91,454 SF)
Vacancy10.3%
Deliveries0 SF
Under Construction626,020 SF
5
Bethesda/Chevy Chase Net Absorption – Deliveries - Vacancy
0%
2%
4%
6%
8%
10%
12%
14%
-0.2-0.1-0.10.00.10.10.20.20.30.30.4
09 10 11 12 13 14 15 16 17
Vaca
ncy
Rat
e
MSF
Net Absorption Deliveries Vacancy Rate
6
Bethesda/Chevy ChaseNew Leasing Activity
0.00
0.20
0.40
0.60
0.80
1.00
1.20
1.40
1.60
2007 2008 2009 2010 2011 2012 2013 2014 2015 2016 2017
MSF
Q1 Q2 Q3 Q4
7
Bethesda/Chevy Chase
$25
$30
$35
$40
$45
$50
$55
2009 2010 2011 2012 2013 2014 2015 2016 Q4 2017
Full
Serv
ice
PSF
Class A Class B, $ PSF
Asking Rent

Cushman & Wakefield | 8
Rock Spring Park
8
Rock Spring ParkNet Absorption – Deliveries - Vacancy
0%
5%
10%
15%
20%
25%
30%
35%
-0.2-0.2-0.1-0.10.00.10.10.20.20.3
09 10 11 12 13 14 15 16 17
Vaca
ncy
Rat
e
MSF
Net Absorption Deliveries Vacancy Rate
As it did during the first half of the year, Rock Spring Park continued to see improving, albeit still soft, market fundamentals through the fourth quarter of 2017. New leasing activity for the quarter was comprised of small and mid-sized tenants. The largest lease of the quarter was that of the Make a Wish Foundation, which signed for 11,464 square feet (sf) at 10401 Fernwood Road. In all, total new leasing activity for the fourth quarter of 2017 totaled 19,342 sf, which helped bring the year-to-date new leasing to 68,151sf. That wasn’t quite enough, however, to top 2016’s total of 128,116 sf, registering a 39% decrease year-over-year.
Year-to-date overall net absorption remained positive, closing the year at 188,515 sf. Most of that absorption was due to the National Institutes of Health (NIH) vacating from 5635 Fishers Lane and relocating to 6700 Rockledge Drive in the first quarter.
The substantial positive absorption in the market contributed to a decline in overall vacancy rates which closed the fourth quarter of 2017 at 24.8% —down 430 basis points (bps) year-over-year. With Suburban Maryland as a whole posting an average overall vacancy rate of 19.4%, however, Rock Spring Park continued to face market softness, particularly as older, less-amenitized office parks struggle to compete against the Metro-accessible locations tenants continue to seek.
Given elevated vacancy rates, overall asking rents dipped 1.8%, closing the fourth quarter of 2017 at $29.80 per square foot (psf). Despite above market vacancy, asking rents in Rock Spring Park remained on par with Montgomery County’s average of $29.20 psf, and well above Suburban Maryland’s average of $26.85 psf. Overall Class A asking rents in Rock Spring Park averaged $30.58 psf for the fourth quarter, slightly below the county average of $31.52 psf, signaling an opportunity for tenants to find quality space at competitive price points.
Outlook
Overall, the Rock Spring Park submarket continues to tighten, though slowly, as small and mid-sized tenants help to chip away at remaining vacancy. With the Marriott Headquarters slated for residential, the risk of new office vacancy coming online following the hotelier’s relocation to the Bethesda/Chevy Chase submarket is mitigated. Additionally, the market should see an increase in the population base as the new residential comes along, and along with it, more amenities to further attract tenants from both the public and private sectors. With no new construction in the pipeline vacancy rates should remain in check and asking rents holding.
Market Indicators*Arrows = Current Qtr Trend
Net Absorption – Deliveries – Vacancy
9
Rock Spring ParkNew Leasing Activity
0.00
0.02
0.04
0.06
0.08
0.10
0.12
0.14
0.16
0.18
0.20
2012 2013 2014 2015 2016 2017
MSF
Q1 Q2 Q3 Q4
10
Rock Spring Park
$20
$22
$24
$26
$28
$30
$32
$34
$36
2011 2012 2013 2014 2015 2016 Q4 2017
Full
Serv
ice
PSF
Class B, $ PSFClass A, $ PSF
Asking Rent
Asking Rent$29.70
Net Absorption188,515 SF
Vacancy24.8%
Deliveries0 SF
Under Construction0 SF
Asking Rent
New Leasing Activity

cushmanwakefield.com | 9
Pike Corridor
11
Pike CorridorNet Absorption – Deliveries - Vacancy
0.0%
5.0%
10.0%
15.0%
20.0%
25.0%
-1.5
-1.0
-0.5
0.0
0.5
1.0
10 11 12 13 14 15 16 17
Vaca
ncy
Rat
e
MSF
Net Absorption Deliveries Vacancy Rate
Market fundamentals in the Pike Corridor submarket were varied throughout the fourth quarter of 2017. Year-to-date new leasing activity picked up during the quarter, closing at just under 338,943 square feet (sf) —a 75.7% increase from the third quarter. The largest lease of the quarter was signed by the General Services Administration (GSA) on behalf of the National Institutes of Health for a 90,000-sf renewal at 2115 East Jefferson Street. The largest new lease was executed by The American Physiological Society (APS), which committed to just over 30,000 sf at 6120 Executive Boulevard.
Despite strong leasing activity, year-to-date net absorption still registered at negative 96,725 sf at the close of the fourth quarter of 2017. It should be noted, however, that this was due to several tenants vacating the submarket during the first half of the year: Dixon Hughes vacated 24,849 sf at Rockville Pike, the FDA vacated 10,000 sf at 1 Church Street, and Montgomery County’s consolidation from 47,322 sf at 40 West Gude Drive.
Overall vacancy rates closed the fourth quarter of 2017 at 17.9%—a 110-basis-point (bps) increase year-over-year. Pike Corridor’s fourth quarter vacancy matched the overall average vacancy for Montgomery County, and 150 bps lower than Suburban Maryland’s average as a whole. While vacancy has declined, overall asking rents for all classes have remained in check, closing the fourth quarter of 2017 at $28.30 per square foot (psf). The overall average rent for Class A product closed the quarter at $30.05 psf, in line with Suburban Maryland’s overall Class A average of $30.16 psf.
Outlook
The Pike Corridor submarket started to experience some improvements in its market fundamentals through the fourth quarter of 2017. The area remains well-positioned to attract tenants, particularly as construction of the Pike & Rose mixed-use development comes to an end, bringing with it retail and residential options to the area. With the growing demand for amenity-heavy and Metro-accessible locations, vacancy rates are expected to continue decreasing over the next 18 to 24 months, which will help to keep asking rents elevated.
Market Indicators*Arrows = Current Qtr Trend
Net Absorption – Deliveries – Vacancy
12
Pike CorridorNew Leasing Activity
0.00
0.20
0.40
0.60
0.80
1.00
1.20
1.40
1.60
2010 2011 2012 2013 2014 2015 2016 2017
MSF
Q1 Q2 Q3 Q4
13
Pike CorridorAsking Rent
$20
$22
$24
$26
$28
$30
$32
$34
$36
2012 2013 2014 2015 2016 Q4 2017
Full
Serv
ice
PSF
Class A Class B, $ PSF
Asking Rent$28.30 FS
Net Absorption(96,725 SF)
Vacancy17.9%
Deliveries0 SF
Under Construction0 SF
Asking Rent
New Leasing Activity
Cushman & Wakefield | 10
I-270/Rockville
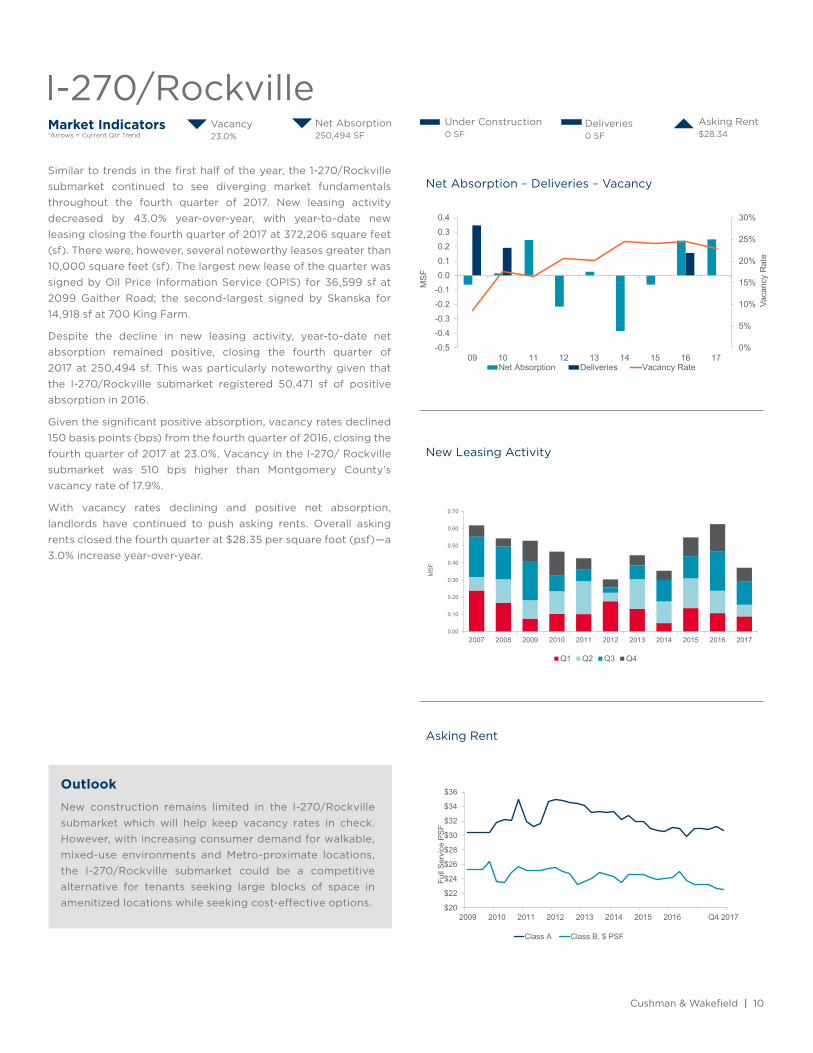
Similar to trends in the first half of the year, the 1-270/Rockville submarket continued to see diverging market fundamentals throughout the fourth quarter of 2017. New leasing activity decreased by 43.0% year-over-year, with year-to-date new leasing closing the fourth quarter of 2017 at 372,206 square feet (sf). There were, however, several noteworthy leases greater than 10,000 square feet (sf). The largest new lease of the quarter was signed by Oil Price Information Service (OPIS) for 36,599 sf at 2099 Gaither Road; the second-largest signed by Skanska for 14,918 sf at 700 King Farm.
Despite the decline in new leasing activity, year-to-date net absorption remained positive, closing the fourth quarter of 2017 at 250,494 sf. This was particularly noteworthy given that the I-270/Rockville submarket registered 50,471 sf of positive absorption in 2016.
Given the significant positive absorption, vacancy rates declined 150 basis points (bps) from the fourth quarter of 2016, closing the fourth quarter of 2017 at 23.0%. Vacancy in the I-270/ Rockville submarket was 510 bps higher than Montgomery County’s vacancy rate of 17.9%.
With vacancy rates declining and positive net absorption, landlords have continued to push asking rents. Overall asking rents closed the fourth quarter at $28.35 per square foot (psf)—a 3.0% increase year-over-year.
Outlook
New construction remains limited in the I-270/Rockville submarket which will help keep vacancy rates in check. However, with increasing consumer demand for walkable, mixed-use environments and Metro-proximate locations, the I-270/Rockville submarket could be a competitive alternative for tenants seeking large blocks of space in amenitized locations while seeking cost-effective options.
Market Indicators*Arrows = Current Qtr Trend
Asking Rent$28.34
Net Absorption250,494 SF
Vacancy23.0%
Deliveries0 SF
Under Construction0 SF
14
I-270/Rockville Net Absorption – Deliveries - Vacancy
0%
5%
10%
15%
20%
25%
30%
-0.5-0.4-0.3-0.2-0.10.00.10.20.30.4
09 10 11 12 13 14 15 16 17
Vaca
ncy
Rat
e
MSF
Net Absorption Deliveries Vacancy Rate
Net Absorption – Deliveries – Vacancy
15
I-270/RockvilleNew Leasing Activity
0.00
0.10
0.20
0.30
0.40
0.50
0.60
0.70
2007 2008 2009 2010 2011 2012 2013 2014 2015 2016 2017
MSF
Q1 Q2 Q3 Q4
16
I-270/Rockville
$20
$22
$24
$26
$28
$30
$32
$34
$36
2009 2010 2011 2012 2013 2014 2015 2016 Q4 2017
Full
Serv
ice
PSF
Class A Class B, $ PSF
Asking Rent
Asking Rent
New Leasing Activity

cushmanwakefield.com | 11
Gaithersburg/Germantown
Market fundamentals in the Gaithersburg and Germantown submarkets remained stable through the fourth quarter of 2017. Both submarkets experienced sluggish new leasing activity during the quarter. Year-to-date new leasing activity in Gaithersburg closed the quarter at 35,062 square feet (sf)—a 31.0% decrease year-over-year. With no new leasing activity recorded in Germantown during the quarter, new leasing activity year-to-date was unchanged from that in the third quarter of the year at 18,924 sf. Indeed, the majority of new leasing activity for Germantown during 2017 occurred in the third quarter. The most notable lease of the quarter was signed by Deleon Stang for 9,000 sf at 100 Lakeforest Boulevard in Gaithersburg.
Despite Gaithersburg’s quiet leasing activity in the fourth quarter of 2017, overall net absorption remained stable, closing the quarter with positive 15,504 sf and accounting for 20.3% of Montgomery County’s total absorption in 2017. Vacancy rates continued to hold, closing the fourth quarter of 2017 at 21.6%, 220 basis points (bps) above Suburban Maryland’s overall average vacancy rate of 19.4%. As office parks continue to struggle with the increasing demand for Metro-proximate locations, vacancy rates could continue to rise. Rental rates remained in check, with overall asking rents for all classes closing the fourth quarter of 2017 at $24.37 per square foot (psf).
Germantown closed the fourth quarter of 2017 with 5,084 sf of positive absorption, resulting in 51,545 sf of positive absorption year-to-date, most of which was registered in the third quarter. Given positive absorption, overall vacancy declined 370 bps year-over-year, locking in the fourth quarter of 2017 at 18.7%. Germantown vacancy remains 70 bps lower than Suburban Maryland’s overall average vacancy of 19.4%. With vacancy rates declining, rental rates increased, closing the fourth quarter of 2017 at $24.66 psf—a 1.0% uptick from the fourth quarter of 2016. In comparison to Montgomery County’s overall average asking rent of $29.20, average rents in Germantown remain among the lowest in the County.
Outlook
Leasing activity remained slow in both submarkets throughout 2017. Vacancy rates in Germantown declined and remained flat in Gaithersburg; however, with new leasing activity remaining stagnant and no new construction in the pipeline, vacancy rates should remain in check for both submarkets. As the demand continues to shift towards more amenitized, Metro-proximate locations, market fundamentals in the Gaithersburg and Germantown submarkets could struggle. But for those tenants that are looking for space at a lower price point in Montgomery County, Germantown and Gaithersburg are competitive options.
Market Indicators*Arrows = Current Qtr Trend
Asking Rent$24.02
Net Absorption20,588 SF
Vacancy20.2%
Deliveries0 SF
Under Construction0 SF
17
Gaithersburg/GermantownNet Absorption – Deliveries - Vacancy
0%
5%
10%
15%
20%
25%
-0.2
-0.1
-0.1
0.0
0.1
0.1
0.2
0.2
0.3
09 10 11 12 13 14 15 16 17
Vaca
ncy
Rat
e
MSF
Net Absorption Deliveries Vacancy Rate
Net Absorption – Deliveries – Vacancy
18
Gaithersburg/GermantownNew Leasing Activity
0.00
0.05
0.10
0.15
0.20
0.25
2007 2008 2009 2010 2011 2012 2013 2014 2015 2016 2017
MSF
Q1 Q2 Q3 Q4
19
Gaithersburg/Germantown
$15
$17
$19
$21
$23
$25
$27
$29
2011 2012 2013 2014 2015 2016 Q42017
Full
Serv
ice
PSF
Class A Class B, $ PSF
Asking Rent
Asking Rent
New Leasing Activity

Cushman & Wakefield | 12
Silver Spring
Silver Spring experienced mixed market fundamentals throughout the fourth quarter of 2017. Year-to-date new leasing activity registered 173,727 square feet (sf), an uptick of 11.5% year-over-year, although the majority of new leasing was recorded in the first half of the year. Small and mid-sized tenants accounted for all the leasing activity during the fourth quarter, as there were no leases executed for more than 10,000 sf. There were, however, a couple of small and mid-sized tenants that relocated from the submarket, resulting in negative year-to-date absorption which closed the fourth quarter of 2017 at a barely audible negative 512 sf.
Overall vacancy rates closed the fourth quarter of 2017 at 12.6%—a 110-basis-point (bps) increase year-over-year. Despite the increase, Silver Spring still registered the second-lowest vacancy rate among all Suburban Maryland submarkets: 530 bps lower than Montgomery County’s overall vacancy of 17.9% and 680 bps lower than Suburban Maryland’s vacancy of 19.4%. Overall asking rents, which continued to hold near the $29.00 per square foot (psf) mark, closed the fourth quarter of 2017 at $29.35 psf.
Outlook
With the noteworthy announcement of Discovery Communications relocating its headquarters to New York City in 2019, the Silver Spring submarket could see a significant increase in vacancy and a decline in absorption with the 545,000 sf of vacant space coming online. But with Silver Spring’s strong amenity base and Metro-accessibility, as well as proximity to the District of Columbia, it will remain an attractive option for tenants that begin to be pushed out of the more landlord-favorable Bethesda/Chevy Chase submarket. With the addition of Metro’s now-underway Purple Line, Silver Spring will be further connected to the western Suburban Maryland submarket, continuing to provide tenants the accessibility that they currently demand. This, combined with a rare very large block of existing quality space, will add the Discovery headquarters space to the short list of any large tenant requirements looking for space regionally.
Market Indicators*Arrows = Current Qtr Trend
Asking Rent$29.35
Net Absorption(-512 SF)
Vacancy12.6%
Deliveries0 SF
Under Construction0 SF
20
Silver SpringNet Absorption – Deliveries - Vacancy
8%
9%
10%
11%
12%
13%
-0.50
0.00
0.50
1.00
1.50
2.00
10 11 12 13 14 15 16 17
Vaca
ncy
Rat
e
MSF
Net Absorption Deliveries Vacancy Rate
Net Absorption – Deliveries – Vacancy
21
Silver SpringNew Leasing Activity
0.00
0.05
0.10
0.15
0.20
0.25
0.30
0.35
0.40
2004 2005 2006 2007 2008 2009 2010 2011 2012 2013 2014 2015 2016 2017
MSF
Q1 Q2 Q3 Q4
22
Silver SpringAsking Rent
$20$22$24$26$28$30$32$34$36$38
2009 2010 2011 2012 2013 2014 2015 2016 Q4 2017
Full
Serv
ice
PSF
Class A Class B, $ PSF
Asking Rent
New Leasing Activity

cushmanwakefield.com | 13
Prince George’s County
The Prince George’s County submarket experienced healthy market fundamentals throughout the fourth quarter of 2017. Year-to-date new leasing activity closed the quarter at just over 1.7 million square feet (msf) —a 47.1% increase from the fourth quarter of 2016, although the majority of new leasing activity occurred in the first three quarters of the year. Throughout the fourth quarter, there were a handful of renewals and mid-sized leases. The largest new lease of the quarter was that of the National Center for Children and Families (NCCF) which signed for 12,616 square feet (sf) at 6404 Ivy Lane. The United States Federal Emergency Management Agency (FEMA) captured the largest renewal of the quarter for 54,000 sf at 6511 American Boulevard. Such healthy leasing activity resulted in positive overall year-to-date- net absorption of 205,054 sf—a year-over-year increase of 31.6%—75,165 sf of which occurred in the fourth quarter.
Given such positive absorption, overall vacancy closed the fourth quarter of 2017 at 24.5%—a 380-basis-point (bps) decrease year-over-year. Overall vacancy in Prince George’s County was 510 bps higher than Suburban Maryland’s overall vacancy rate of 19.4%. The two tightest submarkets in Prince George’s County were Landover/Landham and Bowie which had vacancy rates of 19.6% and 18.4%, respectively, in the fourth quarter. At the close of the quarter the highest vacancy rates were in Beltsville/College Park (27.5%) and Greenbelt (30.7%), 300 bps and 620 bps higher, respectively, than the County’s overall average.
Overall asking rents in Prince George’s County, which continued to hold near the $21.00 per square foot (psf) mark, closed the fourth quarter of 2017 at $21.40 psf. The County’s overall average asking rate fell $5.45 below Suburban Maryland’s overall average asking rent of $26.85 psf for the quarter. The overall average asking rent for Class A buildings closed the quarter at $23.57 psf, a 4.9% increase year-over-year. Beltsville/College Park boasts the highest rental rate in the County, closing the fourth quarter at $22.26 psf, but rents could continue to rise since construction on Metro’s Purple Line has begun.
There were no new deliveries in the fourth quarter of the year; however, there are a couple buildings in the pipeline. Construction continues at 5801 Research Court in College Park: a 75,000-sf, Class A speculative project slated to deliver in the fourth quarter of 2018. Built-to-suit opportunities have continued to attract tenants, as is evident with Kaiser Permanente’s 176,000 sf building at 4000 Garden City drive and the DHS/CIS headquarters at One Town Center, both currently underway.
OutlookWith the pipeline of new construction and the Metro Purple Line underway, Prince George’s County is well-positioned to attract tenants. When the Purple Line delivers in 2020 it will connect College Park to the western Suburban Maryland submarket. As tenants seek out Metro-proximate locations, College Park becomes a new viable option for tenants that are looking to leave the more landlord-favorable Bethesda/ Chevy Chase submarket. As 5801 University Research Court gets closer to delivering and no preleasing occurs, the market can expect to see a rise in vacancy with 75,000 sf of inventory coming online. In addition, it is clear that as the federal government continues to seek locations that offer a value compared to traditional enclaves, Prince George’s County should continue to be a net beneficiary of GSA consolidations.
Market Indicators*Arrows = Current Qtr Trend
Asking Rent$21.40
Net Absorption205,054 SF
Deliveries251,000 SF
Under Construction825,464 SF
23
Prince George's CountyNet Absorption – Deliveries - Vacancy
0%
4%
8%
12%
16%
20%
24%
28%
32%
-0.6-0.5-0.4-0.3-0.2-0.10.00.10.20.30.4
07 08 09 10 11 12 13 14 15 16 17
Vaca
ncy
Rat
e
MSF
Net Absorption Deliveries Vacancy Rate
Net Absorption – Deliveries – Vacancy
24
Prince George's CountyNew Leasing Activity
0.00
200.00
400.00
600.00
800.00
1,000.00
1,200.00
1,400.00
2007 2008 2009 2010 2011 2012 2013 2014 2015 2016 2017
THSF
Q1 Q2 Q3 Q4
25
Prince George's County
$18
$19
$20
$21
$22
$23
$24
$25
2011 2012 2013 2014 2015 2016 Q4 2017
Full
Serv
ice
PSF
Class A Class B, $ PSF
Asking RentAsking Rent
New Leasing Activity
Vacancy24.5%

Cushman & Wakefield | 14
Frederick County
Frederick County continued to experience diverse market fundamentals through the fourth quarter of 2017. Year-to-date new leasing activity closed the quarter at 128,016 square feet (sf). Most new leasing activity was recorded in the first two quarters of 2017—thanks in large part to CSRA leasing 33,360 sf at 110 Thomas Johnson Drive and Asbury Communities taking 26,380 sf at 5285 Westview Drive. The largest lease of the fourth quarter was signed by an undisclosed tenant for 2,020 sf at 5301 Buckeystown Pike.
Given sluggish leasing activity, quarter-to-date absorption closed the fourth quarter of 2017 at a slightly negative 3,430 sf. There were a handful of small move-outs that contributed, and with limited, large new-to-market tenant’s future absorption activity is expected to remain relatively flat.
Overall vacancy closed the fourth quarter of 2017 at 17.3%—a 10-basis-point (bps) increase quarter-over-quarter. Class A vacancy remained significantly tighter, closing the fourth quarter at 13.0%—500 bps lower than Class A vacancy in Montgomery County and 720 bps lower than Class A vacancy in Prince George’s County. Average rents for all classes in Frederick County closed the fourth quarter of 2017 at $15.21 per square foot (psf) —a 1.4% increase quarter-over-quarter. Class A overall average asking rent was $22.00 psf at the close of the quarter, $8.16 lower than Suburban Maryland’s overall Class A average of $30.16 psf.
Outlook
With the growing trend toward live-work-play environments, and considering Frederick County’s lack of accessibility to Metro as well as its distance from Washington, DC, the market could see vacancy rates increase as tenants look to seek out more amenity rich submarkets. However, Frederick County’s affordable rental rates make the submarket a viable option for tenants looking to lease a large amount of space at low rental rates.
Market Indicators*Arrows = Current Qtr Trend
Asking Rent$15.21
Net Absorption(420,919 SF)
Vacancy17.3%
Deliveries0 SF
Under Construction0 SF
26
Frederick CountyNet Absorption – Deliveries - Vacancy
0%
4%
8%
12%
16%
20%
24%
28%
-0.5
-0.4
-0.3
-0.2
-0.1
0.0
0.1
11 12 13 14 15 16 17
Vaca
ncy
Rat
e
MSF
Net Absorption Deliveries Vacancy Rate
Net Absorption – Deliveries – Vacancy
27
Frederick CountyNew Leasing Activity
0.00
50.00
100.00
150.00
200.00
250.00
300.00
350.00
400.00
450.00
500.00
2007 2008 2009 2010 2011 2012 2013 2014 2015 2016 2017
THSF
Q1 Q2 Q3 Q4
28
Frederick County
$0
$5
$10
$15
$20
$25
$30
2011 2012 2013 2014 2015 2016 Q4 2017
Full
Serv
ice
PSF
Class A Class B, $ PSF
Asking Rent
Asking Rent
New Leasing Activity
cushmanwakefield.com | 15
Appendix
Table Summaries
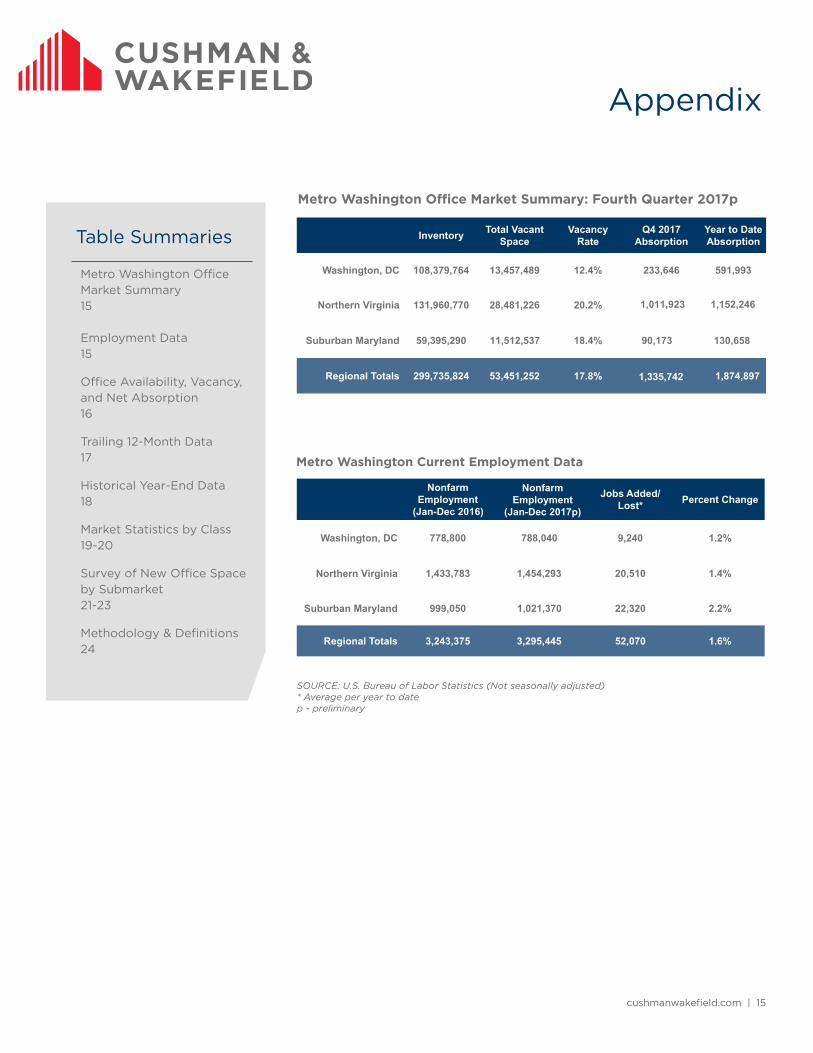
Metro Washington Office Market Summary: Fourth Quarter 2017p
cushmanwakefield.com | 13
Appendix
Table Summaries
Metro Washington Office Market Summary13
Employment Data13
Office Availability, Vacancy, and Net Absorption14
Trailing 12-Month Data15
Historical Year-End Data16
Market Statistics by Class17-18
Survey of New Office Space by Submarket19-22
Methodology & Definitions23
Metro Washington Current Employment Data
Metro Washington Office Market Summary: Second Quarter 2017p
SOURCE: U.S. Bureau of Labor Statistics (Not seasonally adjusted)* Average per year to datep - preliminary
Inventory Total Vacant Space
Vacancy Rate
Q 2017Absorption
Year to Date Absorption
Washington, DC 13, 12. %
Northern Virginia 2 20. %
Suburban Maryland 59, 1 %
Regional Totals 5 17. %
NonfarmEmployment
(Jan- 2016)
NonfarmEmployment
(Jan- 2017p)
Jobs Added/ Lost* Percent Change
Washington, DC 78 1. %
Northern Virginia 1,433,7 1. %
Suburban Maryland 9 1,0 2. %
Regional Totals 3 3,2 1.6%
Metro Washington Office Market Summary15
Employment Data15
Office Availability, Vacancy, and Net Absorption16
Trailing 12-Month Data17
Historical Year-End Data18
Market Statistics by Class19-20
Survey of New Office Space by Submarket21-23
Methodology & Definitions24

Cushman & Wakefield | 16
AppendixO
ffice
Ava
ilab
ility
, Vac
ancy
, and
Net
Ab
sorp
tio
n, F
our
th Q
uart
er 2
017
p
Tota
l Inv
ento
ryN
ew/R
elet
Sp
ace
Vaca
ntSu
blet
Spa
ce
Vaca
ntTo
tal S
pace
Va
cant
Vaca
ncy
Rat
e (%
)N
ew/R
elet
Spa
ce
Abs
orpt
ion
Subl
et S
pace
A
bsor
ptio
nTo
tal N
et A
b-so
rptio
n
Beth
esda
/Che
vy C
hase
(2
2)8,
523,
023
709,
536
211,
072
920,
608
10.8
%24
,240
(1
15,6
94)
(91,
454)
Roc
k Sp
ring
Park
(23
)4,
165,
404
1,01
8,67
113
,809
1,03
2,48
024
.8%
181,
591
6,92
4 18
8,51
5
Pike
Cor
ridor
(1)
11,1
03,0
611,
875,
697
112,
562
1,98
8,25
917
.9%
(90,
447)
(6,2
78)
(96,
725)
I-270
Roc
kville
(20
)9,
345,
162
2,03
0,88
112
1,42
72,
152,
308
23.0
%28
4,89
6 (3
4,40
2)25
0,49
4
Gai
ther
sbur
g (2
4)2,
187,
015
470,
072
1,28
247
1,35
421
.6%
36,2
29
34,1
31
70,3
60
Ger
man
tow
n (2
1)1,
852,
930
342,
662
3,00
034
5,66
218
.7%
49,9
29
1,61
6 51
,545
Silv
er S
prin
g (2
)4,
877,
684
565,
815
47,0
0461
2,81
912
.6%
12,6
88
(13,
200)
(512
)
Nor
th S
ilver
Spr
ing
(25)
1,05
5,12
720
0,11
60
200,
116
19.0
%(2
5,70
0)0
(25,
700)
Mon
tgom
ery
Cou
nty
43,1
09,4
067,
213,
450
510,
156
7,72
3,60
617
.9%
473,
426
(126
,903
)34
6,52
3
Prin
ce G
eorg
e's
Cou
nty
13,4
24,1
603,
256,
351
33,5
083,
289,
859
24.5
%16
5,65
6 39
,398
20
5,05
4
Fred
eric
k C
ount
y2,
861,
724
462,
341
33,5
0849
5,84
917
.3%
(387
,411
)(3
3,50
8)(4
20,9
19)
Tota
l59
,395
,290
10,9
32,1
4258
0,39
511
,512
,537
19.4
%25
1,67
1(1
21,0
13)
130,
658
p -
pre
limin
ary

cushmanwakefield.com | 17
AppendixTr
ailin
g 1
2-M
ont
h D
ata
Tota
l Inv
ento
ryVa
canc
y R
ate
(%)
Tota
l Abs
orpt
ion
1st Q
tr
2017
2nd
Qtr
20
173r
d Q
tr
2017
4th
Qtr
20
171s
t Qtr
20
172n
d Q
tr
2017
3rd
Qtr
20
174t
h Q
tr
2017
1st Q
tr
2017
2nd
Qtr
20
173r
d Q
tr
2017
4th
Qtr
20
17
Beth
esda
/Che
vy
Cha
se8,
641,
418
8,64
1,41
88,
523,
023
8,52
3,02
39.
5%10
.4%
9.8%
10.8
%8,
246
(125
,061
)55
,407
(3
0,04
6)
Roc
k Sp
ring
Park
4,18
9,00
14,
189,
001
4,16
5,40
44,
165,
404
25.8
%25
.1%
25.0
%24
.8%
151,
052
28,4
16
(50)
9,09
7
Pike
Cor
ridor
11,0
79,4
6411
,079
,464
11,1
03,0
6111
,103
,061
17.0
%18
.5%
18.4
%17
.9%
(64,
902)
(65,
525)
14,5
30
19,1
72
I-270
/Roc
kville
9,38
8,90
09,
340,
900
9,34
5,16
29,
345,
162
23.3
%23
.3%
23.2
%23
.0%
294,
020
(58,
368)
(1,0
20)
15,8
62
Gai
ther
sbur
g2,
022,
113
2,18
7,01
52,
187,
015
2,18
7,01
515
.2%
21.7
%22
.3%
21.6
%69
,921
(3
,808
)(1
1,25
7)15
,504
Ger
man
tow
n1,
908,
759
1,85
2,93
01,
852,
930
1,85
2,93
021
.1%
20.9
%18
.9%
18.7
%6,
952
3,13
5 36
,374
5,
084
Silv
er S
prin
g4,
877,
684
4,87
7,68
44,
877,
684
4,87
7,68
411
.0%
12.1
%12
.1%
12.6
%14
,648
(1
3,57
2)22
,252
(2
3,84
0)
Nor
th S
ilver
Spr
ing
1,05
5,12
71,
055,
127
1,05
5,12
71,
055,
127
21.2
%18
.4%
19.7
%19
.0%
(48,
993)
29,1
69
(13,
481)
7,60
5
Mon
tgom
ery
Cou
nty
43,1
62,4
6643
,223
,539
43,1
09,4
0643
,109
,406
17.2
%18
.1%
17.9
%17
.9%
430,
944
(205
,614
)10
2,75
5 18
,438
Prin
ce G
eorg
e's
Cou
nty
13,4
23,6
4513
,423
,745
13,4
23,6
4513
,424
,160
27.2
%25
.4%
25.1
%24
.5%
102,
993
(3,6
93)
30,5
89
75,1
65
Fred
eric
k C
ount
y2,
745,
520
2,79
6,42
02,
861,
724
2,86
1,72
419
.3%
19.0
%17
.2%
17.3
%(4
56,6
91)
351
38,8
51
(3,4
30)
Subu
rban
Mar
ylan
d59
,331
,631
59
,443
,704
59
,394
,775
59
,395
,290
19
.6%
19.8
%19
.5%
19.4
%77
,246
(2
08,9
56)
172,
195
90,1
73
p -
pre
limin
ary

Cushman & Wakefield | 18
AppendixH
isto
rica
l Yea
r-E
nd D
ata
Tota
l Inv
ento
ryVa
canc
y R
ate
(%)
Tota
l Abs
orpt
ion
2014
20
15
2016
20
17
2014
20
15
2016
20
17
2014
20
15
2016
20
17
Beth
esda
/Che
vy
Cha
se8,
612,
795
8,61
2,79
58,
612,
795
8,52
3,02
312
.9%
13.1
%9.
7%10
.8%
(44,
478)
(26,
319)
128,
324
(91,
454)
Roc
k Sp
ring
Park
4,05
5,40
44,
079,
001
4,24
0,00
14,
165,
404
25.0
%28
.2%
29.1
%24
.8%
(58,
558)
(4,6
08)
19,7
22
188,
515
Pike
Cor
ridor
10,6
93,2
7010
,772
,914
10,8
76,4
6411
,103
,061
21.8
%16
.9%
16.8
%17
.9%
(30,
994)
93,9
69
(137
,641
)(9
6,72
5)
I-270
/Roc
kville
9,48
8,71
09,
536,
528
9,62
0,13
99,
345,
162
24.5
%24
.2%
24.5
%23
.0%
29,0
88
134,
427
282,
841
250,
494
Gai
ther
sbur
g2,
122,
113
2,15
7,11
32,
157,
113
2,18
7,01
521
.9%
21.0
%21
.3%
21.6
%30
,895
16
,517
(3
1,55
0)70
,360
Ger
man
tow
n1,
908,
759
1,90
8,75
91,
908,
759
1,85
2,93
023
.6%
24.2
%21
.4%
18.7
%24
,654
13
,268
8,
920
51,5
45
Silv
er S
prin
g4,
806,
040
4,80
6,04
04,
877,
684
4,87
7,68
410
.5%
12.2
%11
.5%
12.6
%3,
421
(3,3
32)
21,6
57
(512
)
Nor
th S
ilver
Spr
ing
1,05
5,12
71,
055,
127
1,05
5,12
71,
055,
127
23.2
%24
.9%
19.6
%19
.0%
(7,5
18)
1,25
9 20
,653
(2
5,70
0)
Mon
tgom
ery
Cou
nty
42,7
42,2
1842
,928
,277
43,3
48,0
8243
,109
,406
19.8
%19
.0%
18.2
%17
.9%
(53,
490)
225,
181
312,
926
346,
523
Prin
ce G
eorg
e's
Cou
nty
13,4
17,8
9013
,515
,386
13,4
23,6
4513
,424
,160
24.7
%28
.2%
28.3
%24
.5%
(57,
646)
(6,1
24)
145,
440
205,
054
Fred
eric
k C
ount
yN
/AN
/AN
/A2,
861,
724
N/A
N/A
N/A
17.3
%N
/AN
/AN
/A(4
20,9
19)
Subu
rban
M
aryl
and
56,1
60,1
0856
,443
,663
56,7
71,7
2759
,395
,290
21.0
%21
.2%
20.6
%19
.4%
(111
,136
)21
9,05
7 45
8,36
6 13
0,65
8
p -
pre
limin
ary

cushmanwakefield.com | 19
Suburban Maryland – 4th Quarter 2017 Market Statistics
Market Statistics
Cushman & Wakefield | 18
Suburban Maryland – 2nd Quarter 2017 Market Statistics
BuildingsTotal
Inventory(SF)
New/ReletVacancy (%)
SubletVacancy (%)
Total Vacancy* (%)
Net Absorption Current QTR
(SF)
UnderConstruction
(SF)
Average Asking Rent
(FS)
Bethesda/Chevy Chase
Class
A 22 5,177,706 24.5% 2.6% 9.4% 35,416( ) 626,020 $41.08
B 26 2,640,140 11.7% 2.6% 13.1% 3,518 0 $33.97
C 15 705,177 10.7% 0.4% 12.1% 1,852 0 $30.20
TOTAL 64 8,523,023 8.3% 2.5% 10.8% (30,046) 626,020 $41.08
Rock Spring Park
Class
A 13 3,050,815 24.5% 0.5% 25.0% (4,230) 0 $30.58
B 8 953,589 26.4% 0.0% 26.4% 13,327 0 $27.56
C 1 161,000 11.0% 0.0% 11.0% 0 0 $20.00
TOTAL 22 4,165,404 24.5% 0.3% 24.8% 9,097 0 $28.34
Pike Corridor
Class
A 33 5,294,799 19.0% 0.1% 19.1% (3,492) 0 $31.05
B 46 4,947,208 15.8% 2.1% 17.9% 349 0 $26.66
C 16 861,054 10.5% 0.0% 10.5% 22,315 0 $18.41
TOTAL 95 11,103,061 16.9% 1.0% 17.9% 19,172 0 $28.30
I-270/Rockville
Class
A 46 6,608,313 20.6% 1.6% 22.2% 15.982( ) 0 $30.73
B 31 2,567,028 24.2% 0.7% 24.9% 29,190 0 $22.59
C 3 169,821 27.2% 0.0% 27.2% 2,654 0 $24.66
TOTAL 80 9,345,162 21.7% 1.3% 23.0% 15,862 0 $28.34
Gaithersburg
Class
A 6 605,663 17.8% 0.1% 18.0% (129) $24.37
B 16 1,021,105 16.0% 0.0% 16.1% 15,304 0 $23.62
C 11 560,247 35.4% 0.0% 35.4% 329 0 $15.94
TOTAL 34 2,187,015 21.5% 0.1% 21.6% 15,504 0 $23.47Germantown
ClassA 5 662,740 17.9% 0.5% 18.4% 0 0 $27.86
B 17 1,190,190 18.8% 0.0% 18.8% 5,084 0 $22.32
C 0 0 0.0% 0.0% 0.0% 0 0 N/A
TOTAL 22 1,852,930 18.5% 0.2% 18.7% 5,084 0 $24.66
* Total Vacancy - the vacancy rate is calculated using the combined total of relet, sublet and new vacant space.
Market Statistics
0

Cushman & Wakefield | 20
Suburban Maryland – 4th Quarter 2017 Market Statistics
Market Statistics
cushmanwakefield.com | 19
Suburban Maryland – 2nd Quarter 2017 Market Statistics
Market Statistics
BuildingsTotal
Inventory(SF)
New/ReletVacancy (%)
SubletVacancy (%)
Total Vacancy* (%)
Net Absorption Current QTR
(SF)
UnderConstruction
(SF)
Average Asking Rent
(FS)
Silver Spring
Class
A 14 2,901,148 13.6% 1.5% 15.1% 18,109( ) 0 $30.52
B 7 973,764 7.7% 0.0% 7.7% 6,994 0 $26.96
C 16 1,002,772 9.6% 0.5% 10.0% (12,725) 0 $23.89
TOTAL 37 4,877,684 11.6% 1.0% 12.6% (23,840) 0 $29.35
North Silver Spring
Class
A 4 222,322 2.3% 0.0% 2.3% 0 0 N/A
B 16 832,805 23.4% 0.0% 23.4% 7,605 0 $24.21
C 0 0 0.0% 0.0% 0.0% 0 0 N/A
TOTAL 20 1,055,127 19.0% 0.0% 19.0% 7,605 0 $24.21
Prince George’s County
Class
A 39 4,592,560 20.2% 0.0% 20.2% 47,964 825,767 $23.57
B 135 7,200,545 27.7% 0.5% 27.7% 12,832 0 $20.53
C 54 1,631,055 22.5% 0.0% 22.5% 14,369 0 $19.82
TOTAL 228 13,424,160 24.3% 0.2% 24.5% 75,165 825,767 $21.40
Frederick County
Class
A 14 1,737,465 13.0% 0.0% 13.0% (1,520) $22.00
B 20 1,124,259 21.0% 3.0% 24.0% (1,910) $12.81
C 0 0 0.0% 0.0% 0.0% 0 N/A
TOTAL 34 2,861,724 16.2% 1.1% 17.3% (3,430) $15.21
Suburban Maryland
ClassA 196 30,853,531 17.0% 1.0% 18.0% 30,914( ) 1,451,787 $30.16
B 322 23,450,633 20.4% 1.1% 21.5% 92,293 0 $23.66
C 122 5,091,126 17.7% 0.1% 17.8% 28,794 0 $22.02
TOTAL 640 59,395,290 18.4% 1.0% 19.4% 90,173 1,451,787 $26.85
* Total Vacancy - the vacancy rate is calculated using the combined total of relet, sublet and new vacant space.
0
0
0
0
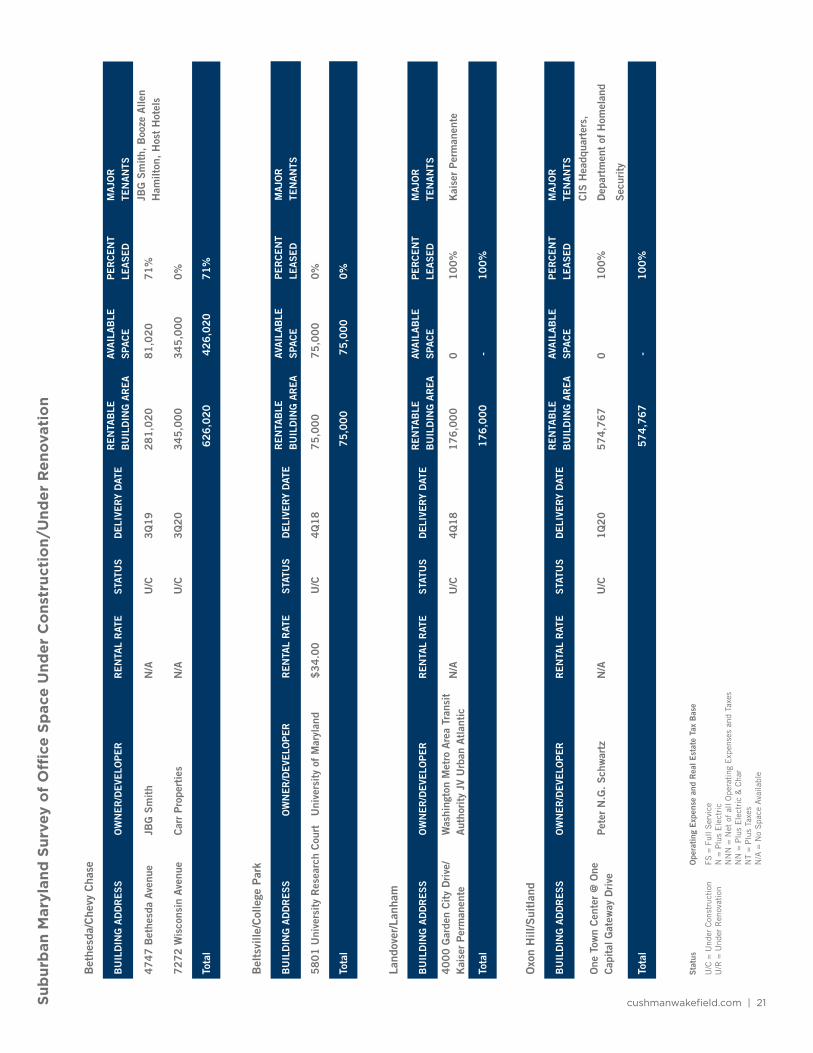
cushmanwakefield.com | 21Sub
urb
an M
aryl
and
Sur
vey
of
Offi
ce S
pac
e U
nder
Co
nstr
ucti
on/
Und
er R
enov
atio
n
Bet
hesd
a/C
hevy
Cha
se
BU
ILD
ING
AD
DR
ES
SO
WN
ER
/DE
VELO
PE
RR
EN
TAL
RAT
ES
TATU
SD
ELI
VER
Y D
ATE
RE
NTA
BLE
B
UIL
DIN
G A
RE
AAV
AIL
AB
LE
SPA
CE
PE
RC
EN
T
LEA
SE
DM
AJO
R
TEN
AN
TS
47
47
Bet
hesd
a Av
enue
JB
G S
mit
hN
/AU
/C3
Q1
92
81
,02
08
1,0
20
71
%JB
G S
mit
h, B
ooze
Alle
n H
amilt
on,
Hos
t H
otel
s
72
72
Wis
cons
in A
venu
eC
arr
Pro
pert
ies
N/A
U/C
3Q
20
34
5,0
00
34
5,0
00
0%
Tota
l 6
26
,02
0
42
6,0
20
7
1%
Bel
tsvi
lle/C
olle
ge P
ark
BU
ILD
ING
AD
DR
ES
SO
WN
ER
/DE
VELO
PE
RR
EN
TAL
RAT
ES
TATU
SD
ELI
VER
Y D
ATE
RE
NTA
BLE
B
UIL
DIN
G A
RE
AAV
AIL
AB
LE
SPA
CE
PE
RC
EN
T
LEA
SE
DM
AJO
R
TEN
AN
TS
58
01
Uni
vers
ity
Res
earc
h C
ourt
Uni
vers
ity
of M
aryl
and
$3
4.0
0U
/C4
Q1
87
5,0
00
75
,00
00
%
Tota
l 7
5,0
00
7
5,0
00
0
%
Land
over
/Lan
ham
BU
ILD
ING
AD
DR
ES
SO
WN
ER
/DE
VELO
PE
RR
EN
TAL
RAT
ES
TATU
SD
ELI
VER
Y D
ATE
RE
NTA
BLE
B
UIL
DIN
G A
RE
AAV
AIL
AB
LE
SPA
CE
PE
RC
EN
T
LEA
SE
DM
AJO
R
TEN
AN
TS
40
00
Gar
den
Cit
y D
rive
/ K
aise
r P
erm
anen
te
Was
hing
ton
Met
ro A
rea
Tran
sit
Aut
hori
ty J
V U
rban
Atl
anti
cN
/AU
/C4
Q1
81
76
,00
00
10
0%
Kai
ser
Per
man
ente
Tota
l 1
76
,00
0
-
1
00
%
Oxo
n H
ill/S
uitl
and
BU
ILD
ING
AD
DR
ES
SO
WN
ER
/DE
VELO
PE
RR
EN
TAL
RAT
ES
TATU
SD
ELI
VER
Y D
ATE
RE
NTA
BLE
B
UIL
DIN
G A
RE
AAV
AIL
AB
LE
SPA
CE
PE
RC
EN
T
LEA
SE
DM
AJO
R
TEN
AN
TS
One
Tow
n C
ente
r @
One
C
apit
al G
atew
ay D
rive
Pet
er N
.G.
Sch
war
tzN
/AU
/C1
Q2
05
74
,76
70
10
0%
CIS
Hea
dqua
rter
s,
Dep
artm
ent
of H
omel
and
Sec
urit
y
Tota
l 5
74
,76
7
-
1
00
%
Sta
tus
Ope
rati
ng E
xpen
se a
nd R
eal E
stat
e Ta
x B
ase
U/C
= U
nder
Con
stru
ctio
nU
/R =
Und
er R
enov
atio
nFS
= F
ull S
ervi
ceN
= P
lus
Ele
ctri
cN
NN
= N
et o
f al
l Ope
rati
ng E
xpen
ses
and
Taxe
sN
N =
Plu
s E
lect
ric
& C
har
NT
= P
lus
Taxe
sN
/A =
No
Spa
ce A
vaila
ble

Cushman & Wakefield | 22
SU
MM
AR
YR
EN
TAB
LE
BU
ILD
ING
AR
EA
AVA
ILA
BLE
S
PAC
EP
ER
CE
NT
LE
AS
ED
20
17
Del
iver
ies
00
0%
20
18
Del
iver
ies
25
1,0
00
75
,00
03
0%
20
19
Del
iver
ies
28
1,0
20
81
,02
07
1%
20
20
Del
iver
ies
91
9,7
67
34
5,0
00
60
%
TOTA
L 1
,45
1,7
87
5
01
,02
0
35
%
Sta
tus
Ope
rati
ng E
xpen
se a
nd R
eal E
stat
e Ta
x B
ase
U/C
= U
nder
Con
stru
ctio
nU
/R =
Und
er R
enov
atio
nFS
= F
ull S
ervi
ceN
= P
lus
Ele
ctri
cN
NN
= N
et o
f al
l Ope
rati
ng E
xpen
ses
and
Taxe
sN
N =
Plu
s E
lect
ric
& C
har
NT
= P
lus
Taxe
sN
/A =
No
Spa
ce A
vaila
ble
Surb
urb
an M
aryl
and
Sum
mar
y o
f O
ffice
Sp
ace
Und
er C
ons
truc
tio
n/U
nder
Ren
ovat
ion

cushmanwakefield.com | 23
Sta
tus
Ope
rati
ng E
xpen
se a
nd R
eal E
stat
e Ta
x B
ase
U/C
= U
nder
Con
stru
ctio
nU
/R =
Und
er R
enov
atio
nFS
= F
ull S
ervi
ceN
= P
lus
Ele
ctri
cN
NN
= N
et o
f al
l Ope
rati
ng E
xpen
ses
and
Taxe
sN
N =
Plu
s E
lect
ric
& C
har
NT
= P
lus
Taxe
sN
/A =
No
Spa
ce A
vaila
ble
Surb
urb
an M
aryl
and
Sur
vey
of
New
Offi
ce S
pac
e
20
17
Del
iver
ies
BU
ILD
ING
AD
DR
ES
SO
WN
ER
/DE
VELO
PE
RS
TATU
SR
EN
TAL
RAT
ES
UB
MA
RK
ET
RE
NTA
BLE
B
UIL
DIN
G A
RE
AN
EW
AVA
ILA
BLE
S
PAC
E
VAC
AN
CY
RAT
E
(AS
OF
CU
RR
EN
T Q
UA
RTE
R)
PE
RC
EN
T LE
AS
ED
UP
ON
D
ELI
VER
Y
20
16
Del
iver
ies
BU
ILD
ING
AD
DR
ES
SO
WN
ER
/DE
VELO
PE
RS
TATU
SR
EN
TAL
RAT
ES
UB
MA
RK
ET
RE
NTA
BLE
B
UIL
DIN
G A
RE
AN
EW
AVA
ILA
BLE
S
PAC
E
VAC
AN
CY
RAT
E
(AS
OF
CU
RR
EN
T Q
UA
RTE
R)
PE
RC
EN
T LE
AS
ED
UP
ON
D
ELI
VER
Y
12
35
8 P
arkl
awn
Dri
veG
reen
cour
t P
orpe
rty
Gro
upD
eliv
ered
4Q
16
N/A
Pik
e C
orri
dor
10
3,5
50
10
3,5
02
87
%0
%
12
43
5 P
ark
Pot
omac
Ave
Foul
ger
Pra
tt/F
oulg
er P
ratt
C
ompa
nies
Del
iver
ed 1
Q1
6N
/AI-
27
0/R
ockv
ille
15
6,0
00
84
,10
75
0%
13
%
Tota
l2
59
,55
01
87
,60
97
2%
63
%
20
15
Del
iver
ies
BU
ILD
ING
AD
DR
ES
SO
WN
ER
/DE
VELO
PE
RS
TATU
SR
EN
TAL
RAT
ES
UB
MA
RK
ET
RE
NTA
BLE
B
UIL
DIN
G A
RE
AN
EW
AVA
ILA
BLE
S
PAC
E
VAC
AN
CY
RAT
E
(AS
OF
CU
RR
EN
T Q
UA
RTE
R)
PE
RC
EN
T LE
AS
ED
UP
ON
D
ELI
VER
Y
11
81
0 G
rand
Par
k Av
eFe
dera
l Rea
lty
Inve
stm
ent
Trus
tD
eliv
ered
1Q
15
N/A
Pik
e C
orri
dor
79
,64
47
9,6
44
0%
50
%
78
00
Han
kins
Roa
dB
erm
an E
nter
pris
esD
eliv
ered
3Q
15
N/A
Land
over
/Lan
ham
11
0,0
00
00
%1
00
%
Tota
l1
,73
2,7
13
57
7,9
13
20
14
Del
iver
ies
BU
ILD
ING
AD
DR
ES
SO
WN
ER
/DE
VELO
PE
RS
TATU
SR
EN
TAL
RAT
ES
UB
MA
RK
ET
RE
NTA
BLE
B
UIL
DIN
G A
RE
AN
EW
AVA
ILA
BLE
S
PAC
E
VAC
AN
CY
RAT
E
(AS
OF
CU
RR
EN
T Q
UA
RTE
R)
PE
RC
EN
T LE
AS
ED
UP
ON
D
ELI
VER
Y
56
01
Fis
hers
Lan
eJB
G S
mit
hD
eliv
ered
1Q
14
N/A
Pik
e C
orri
dor
49
0,9
98
0%
10
0%
45
00
Eas
t W
est
Hig
hway
Car
r/Th
e C
lare
tt G
roup
Del
iver
ed 4
Q1
4N
/AB
ethe
sda/
Che
vy
Cha
se2
26
,35
29
%1
2%
70
00
Mul
kirk
Roa
d1
11
19
th S
tree
t A
ssoc
iati
on L
td
Par
tner
ship
/Kon
terr
a R
ealt
yD
eliv
ered
1Q
14
N/A
Bel
tsvi
lle/C
olle
ge
Par
k5
7,0
00
0%
88
%
Tota
l7
74
,35
00
%4
7%

Cushman & Wakefield | 24
MethodologyMarket statistics are calculated from a base building inventory made up of office properties deemed to be competitive in the typical Washington, DC office market. Single-tenant buildings and privately-owned buildings in which the federal government leases space are included. Generally, owner-occupied and federally-owned buildings are not included. Older buildings unfit for occupancy or ones that require substantial renovation before tenancy are generally not included in the competitive inventory. Vacant space is defined as space that is physically vacant and available immediately. Sublet space still occupied by the tenant is not counted as vacant space.
Explanation of TermsTotal Inventory: The total amount of office space (in buildings greater than 10,000 square feet) that can be rented by a Fourth party.
New Space Vacant: First generation, never-occupied office space in newly constructed or substantially renovated buildings, being actively marketed by a landlord.
Relet Space Vacant: Second-generation, unoccupied office space being actively marketed by a landlord. (Space that is marketed but largely occupied is not counted as vacant space.)
Sublet Space Vacant: Second-generation, unoccupied space being actively marketed by a tenant. (Sublet space that is marketed but still occupied is not counted as vacant space.)
Total Space Vacant: The sum of new, relet, and sublet space that is unoccupied and being actively marketed.
Vacancy Rate: The amount of unoccupied space (new, relet, and sublet) expressed as a percentage of total inventory. (Total Space Vacant divided by Total Inventory.)
Total Space Available: The total amount of space, both vacant and occupied, being actively marketed for lease by a tenant or landlord. (This includes space that is currently occupied but marketed for future availability.)
Availability Rate: The total amount of space being actively marketed for lease (both vacant and occupied) expressed as a percentage of total inventory. (Total Space Available divided by Total Inventory.)
Absorption: The net change in occupied space between two points in time. (Total occupied space in the previous quarter minus total occupied space in the current quarter, quoted on a net, not gross, basis.)
New/Relet/Sublet Absorption: The net change in occupied new, relet, and sublet space between two quarters.
Total Absorption: The net change in total occupied (new, relet, and sublet) space between two quarters.
New Leasing Activity: The sum of all square footage underlying any leases between two quarters. This includes pre-leasing activity as well as expansion. It does not include renewals.
Methodology & Definitions
Disclaimer
This report and other research materials may be found on our website at www.cushmanwakefield.com. This is a research
document of Cushman & Wakefield in Washington, DC. Questions related to information herein should be directed to the
Research Department at +1 202 463 2100. Information contained herein has been obtained from sources deemed reliable and
no representation is made as to the accuracy thereof.
About Cushman & Wakefield
Cushman & Wakefield is a leading global real estate services firm that helps clients transform the way people work, shop, and
live. Our 43,000 employees in more than 60 countries help investors and occupiers optimize the value of their real estate by
combining our global perspective and deep local knowledge with an impressive platform of real estate solutions. Cushman
& Wakefield is among the largest commercial real estate services firms with revenue of $5 billion across core services of
agency leasing, asset services, capital markets, facility services (C&W Services), global occupier services, investment & asset
management (DTZ Investors), project & development services, tenant representation, and valuation & advisory. To learn more,
visit www.cushmanwakefield.com or follow @CushWake on Twitter.

Visit cushmanwakefield.com for more information on the full range of Cushman & Wakefield commercial real estate services or contact:
Nathan EdwardsSenior Director2101 L Street, NW, Suite 700Washington, DC 20037+1 202 463 2100
Summer NewmanAssociate Market Director 2101 L Street, NW, Suite 700Washington, DC 20037+1 202 463 2100
Paige WingateResearch Analyst 2 Bethesda Metro Center, Suite 860Bethesda, MD 20814+1 301 654 9700
Core Services• Capital Markets
- Debt Placement- Investment Sales- Note Sales- Structured Finance
• Corporate Services- Facilities Management- Portfolio Administration- Project Management- Strategic Consulting- Transaction Management
• Project Leasing• Project and Development Services• Property Management• Tenant Representation
Practices and Specialties• Auction Services• Distressed Assets• Financial Advisory• Food and Beverage• Golf and Resort Properties• Government Contracting• Government Services• Healthcare• Higher Education• Hospitality• Law Firm• Life Sciences• Location Advisory and Incentives• Mission Critical• Net Lease• Not-for-profit• Private Client• Supply Chain • Sustainability Services
Real Estate Types• Industrial• Land• Multi-family• Office• Retail
Publication date: 1.9.18
Copyright © 2018 Cushman & Wakefield. All rights reserved.
About Cushman & WakefieldCushman & Wakefield is a leading global real estate services firm that helps clients
transform the way people work, shop, and live. Our 43,000 employees in more than
60 countries help investors and occupiers optimize the value of their real estate by
combining our global perspective and deep local knowledge with an impressive
platform of real estate solutions. Cushman & Wakefield is among the largest
commercial real estate services firms with revenue of $5 billion across core services
of agency leasing, asset services, capital markets, facility services (C&W Services),
global occupier services, investment & asset management (DTZ Investors), project &
development services, tenant representation, and valuation & advisory. To learn more,
visit www.cushmanwakefield.com or follow @CushWake on Twitter.