Embed Size (px)
Citation preview

MARKET REPORT
2018
ENERGY MARKET COMPANY MARKET PERFORMANCE
ADDITIONAL INFORMATION
MARKET OVERVIEW
MARKET GOVERNANCE
Letter from the Chairman Overview of the Year
Energy Demand
Energy Supply
Energy Prices
Ancillary Markets
Competition in the Generation and Retail Markets
Settlement, Prudential Management, and Automatic Financial Penalty Scheme
Contracted Ancillary Services
Market Fees
Open Electricity Market
Glossary
Market Entities’ Contact Details
1 17
21
22
27
31
38
40
41
42
44
45
47
Market History
Industry Structure
Market Features
Overview
Letter from the Chair, Rules Change Panel
Market Evolution
Letter from the Dispute Resolution Counsellor
3
4
6
9
10
11
14
CONTENTS

1CONTENTS
Dear Industry Members
I am excited to have witnessed a milestone development in Singapore’s electricity industry when I took over as Chairman of Energy Market Company (EMC) in 2018 – the launch of the Open Electricity Market (OEM).
Since the launch, electricity retailers have been offering attractive price plans to eligible consumers in a bid to gain a foothold in the retail market. As the OEM is extended to more consumers across Singapore in 2019, we can expect competition to intensify as electricity retailers gain experience and strive to increase their market share.
We continue to welcome new investments in the National Electricity Market of Singapore (NEMS) in 2018. A record number of 23 new intermittent generation source (IGS) facilities were added in the year, raising the total registered capacity in the NEMS to 13,559MW.
While the proportion of IGS facilities is still below 0.5 percent, we can expect more of such facilities to be registered in the market in the coming years as Singapore seeks to diversify its energy sources and increase the deployment of renewable energy. EMC will continue to support the adoption of renewable energy in the market by facilitating changes to the Singapore Electricity Market Rules, and streamlining the market registration and settlement processes for IGS facilities.
In the meantime, the market share of the most efficient generation type currently available in the market – the combined-cycle gas turbine (CCGT) – remained the highest and contributed 97.9% of the total generation dispatched in 2018. Production efficiency in the NEMS continues to be high.
Like past years, wholesale electricity prices moved in tandem with changes in fundamental demand and supply factors. The annual average Uniform Singapore Energy Price (USEP) rose 36.3 percent from the preceding year to $110.29 per megawatt hour (MWh), arising from increases in oil prices as well as electricity consumption (metered demand)1. This was the second consecutive year of increase in the USEP after it started falling from its peak of $222.49/MWh in 2012.
Corresponding to the USEP’s movement, the annual value of products traded in the wholesale market increased 40.3 percent to $6.16 billion. Although a record number of 24 default notices were issued in the year, I am pleased to note that there are adequate safeguards in place to protect the market’s financial integrity. As a result, no default levy needed to be recovered from the market as sufficient credit support was secured for all 24 cases. As a prudent market operator, EMC will continue to look for opportunities to strengthen the existing safeguards to ensure that they remain robust and relevant.
Like any well-functioning competitive market, the concentration level in the generation sector diluted further in 2018, with the combined market share of the three largest generation companies dropping another 2.2 percentage points to 53.2 percent. Likewise, in the retail sector, the market share of SP Services (the default retailer for consumers who continue to buy electricity at the regulated tariff) declined a further 2.0 percentage points to 26.0%, and competition among the other electricity retailers resulted in continual market share changes among them.
At this point, I would like to thank our key stakeholders – the NEMS market participants, our regulator, the Energy Market Authority, the Rules Change Panel, the Market Surveillance and Compliance Panel, as well as the Dispute Resolution and Compensation Panel – for their support and partnership which have been vital in keeping the NEMS stable, efficient and competitive.
We have done well, but it is also necessary to look into the longer term strategic development of the NEMS to ensure that it remains relevant and well positioned to meet new challenges. In this regard, EMC is setting up a Market Advisory Panel (MAP) to provide thought leadership and drive discussions on broader, strategic issues. I look forward to the establishment and guidance of the MAP in shaping the future of the NEMS.
Agnes KohChairmanEnergy Market Company
1 In 2018, fuel oil price rose 31.3 percent while annual electricity consumption grew 1.6 percent.
ENERGY MARKET COMPANY: Letter from the Chairman

MARKETOVERVIEW
3CONTENTS
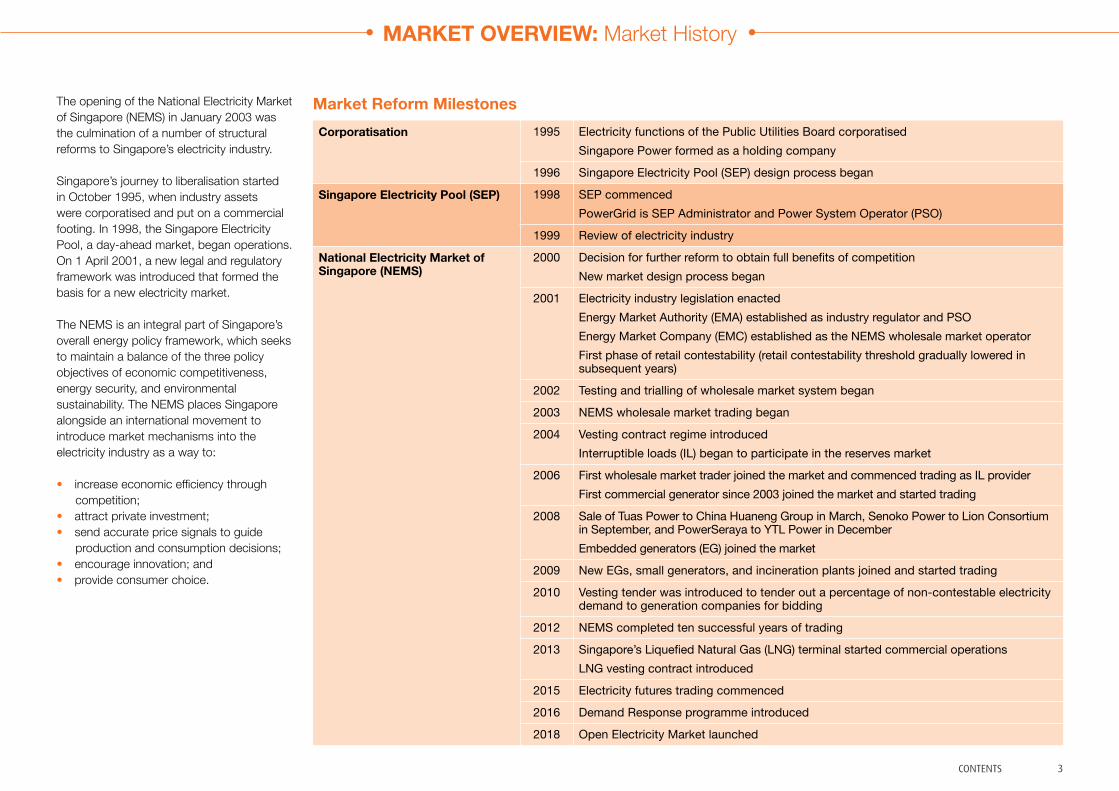
The opening of the National Electricity Market of Singapore (NEMS) in January 2003 was the culmination of a number of structural reforms to Singapore’s electricity industry.
Singapore’s journey to liberalisation started in October 1995, when industry assets were corporatised and put on a commercial footing. In 1998, the Singapore Electricity Pool, a day-ahead market, began operations. On 1 April 2001, a new legal and regulatory framework was introduced that formed the basis for a new electricity market.
The NEMS is an integral part of Singapore’s overall energy policy framework, which seeks to maintain a balance of the three policy objectives of economic competitiveness, energy security, and environmental sustainability. The NEMS places Singapore alongside an international movement to introduce market mechanisms into the electricity industry as a way to:
• increase economic efficiency through competition;
• attract private investment;• send accurate price signals to guide
production and consumption decisions;• encourage innovation; and• provide consumer choice.
Market Reform MilestonesCorporatisation 1995 Electricity functions of the Public Utilities Board corporatised
Singapore Power formed as a holding company
1996 Singapore Electricity Pool (SEP) design process began
Singapore Electricity Pool (SEP) 1998 SEP commencedPowerGrid is SEP Administrator and Power System Operator (PSO)
1999 Review of electricity industry
National Electricity Market of Singapore (NEMS)
2000 Decision for further reform to obtain full benefits of competitionNew market design process began
2001 Electricity industry legislation enactedEnergy Market Authority (EMA) established as industry regulator and PSOEnergy Market Company (EMC) established as the NEMS wholesale market operatorFirst phase of retail contestability (retail contestability threshold gradually lowered in subsequent years)
2002 Testing and trialling of wholesale market system began
2003 NEMS wholesale market trading began
2004 Vesting contract regime introducedInterruptible loads (IL) began to participate in the reserves market
2006 First wholesale market trader joined the market and commenced trading as IL providerFirst commercial generator since 2003 joined the market and started trading
2008 Sale of Tuas Power to China Huaneng Group in March, Senoko Power to Lion Consortium in September, and PowerSeraya to YTL Power in DecemberEmbedded generators (EG) joined the market
2009 New EGs, small generators, and incineration plants joined and started trading
2010 Vesting tender was introduced to tender out a percentage of non-contestable electricity demand to generation companies for bidding
2012 NEMS completed ten successful years of trading
2013 Singapore’s Liquefied Natural Gas (LNG) terminal started commercial operationsLNG vesting contract introduced
2015 Electricity futures trading commenced
2016 Demand Response programme introduced
2018 Open Electricity Market launched
MARKET OVERVIEW: Market History
4 CONTENTS
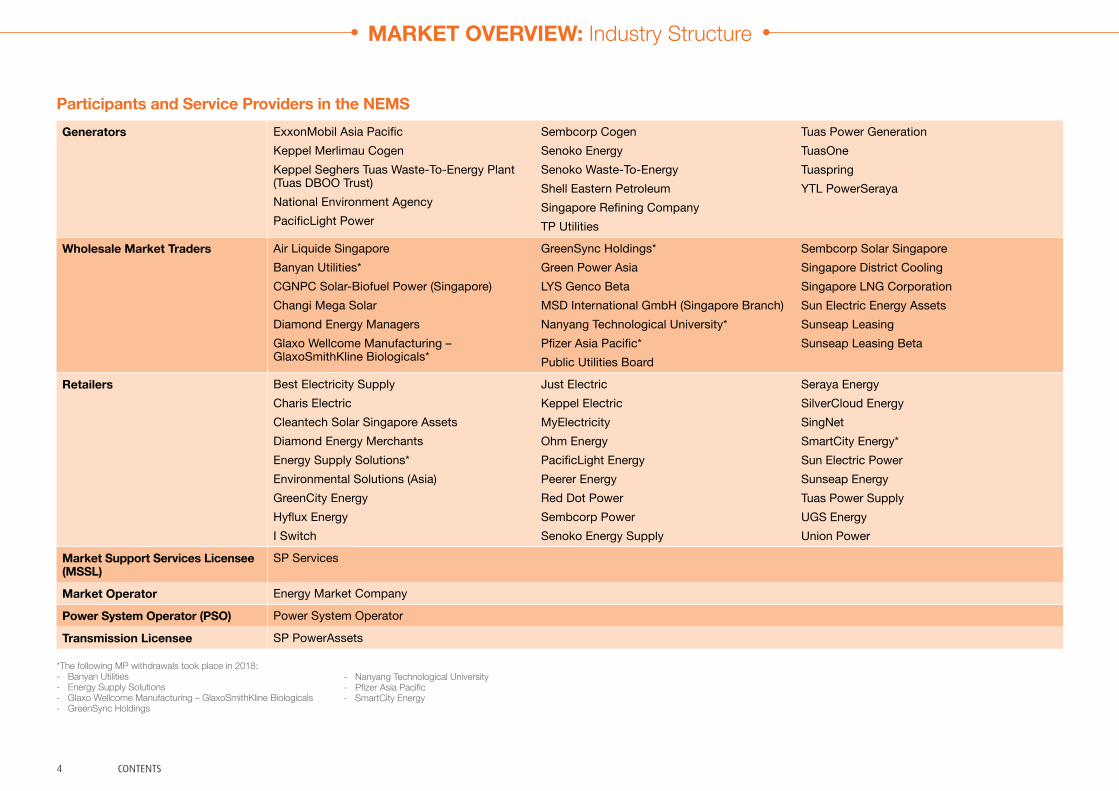
Participants and Service Providers in the NEMS Generators ExxonMobil Asia Pacific
Keppel Merlimau CogenKeppel Seghers Tuas Waste-To-Energy Plant (Tuas DBOO Trust)National Environment AgencyPacificLight Power
Sembcorp CogenSenoko Energy Senoko Waste-To-EnergyShell Eastern PetroleumSingapore Refining Company TP Utilities
Tuas Power GenerationTuasOneTuaspringYTL PowerSeraya
Wholesale Market Traders Air Liquide SingaporeBanyan Utilities*CGNPC Solar-Biofuel Power (Singapore)Changi Mega SolarDiamond Energy ManagersGlaxo Wellcome Manufacturing – GlaxoSmithKline Biologicals*
GreenSync Holdings*Green Power AsiaLYS Genco BetaMSD International GmbH (Singapore Branch)Nanyang Technological University*Pfizer Asia Pacific*Public Utilities Board
Sembcorp Solar SingaporeSingapore District CoolingSingapore LNG CorporationSun Electric Energy AssetsSunseap LeasingSunseap Leasing Beta
Retailers Best Electricity SupplyCharis ElectricCleantech Solar Singapore AssetsDiamond Energy MerchantsEnergy Supply Solutions*Environmental Solutions (Asia)GreenCity EnergyHyflux EnergyI Switch
Just Electric Keppel ElectricMyElectricityOhm EnergyPacificLight EnergyPeerer EnergyRed Dot PowerSembcorp PowerSenoko Energy Supply
Seraya Energy SilverCloud Energy SingNetSmartCity Energy*Sun Electric PowerSunseap EnergyTuas Power SupplyUGS EnergyUnion Power
Market Support Services Licensee (MSSL)
SP Services
Market Operator Energy Market Company
Power System Operator (PSO) Power System Operator
Transmission Licensee SP PowerAssets
*The following MP withdrawals took place in 2018:- Banyan Utilities- Energy Supply Solutions- Glaxo Wellcome Manufacturing – GlaxoSmithKline Biologicals - GreenSync Holdings
MARKET OVERVIEW: Industry Structure
- Nanyang Technological University- Pfizer Asia Pacific- SmartCity Energy
5CONTENTS
Singapore’s electricity industry is structured to facilitate competitive wholesale and retail markets. Competitiveness is achieved by separating the ownership of the contestable parts of the industry from those with natural monopoly characteristics.
Market Participant Changes in 2018
A total of six new market participants (MPs) joined the NEMS in 2018.
The new MPs comprise:• one generator: TuasOne; and• five retailers: GreenCity Energy,
MyElectricity, Peerer Energy, SingNet and UGS Energy.
Aside from the new entrants, the year also saw the withdrawal of five wholesale market traders and two retailers from the market.
With the above changes, there were 54 MPs in the NEMS as of end December 2018 comprising 15 generators, 14 wholesale market traders and 25 retailers.
Generation LicenseesAll generators with facilities of 1MW or more that are connected to the transmission system must participate in the NEMS and be registered with EMC. Generation licensees are companies with generating facilities that are 10MW or more that are connected to the transmission system and licensed by the EMA to trade in the wholesale electricity market. Wholesale Market TradersWholesale market traders are companies, other than generation licensees or retail licensees, that are licensed by the EMA to trade in the wholesale electricity market. Wholesale market traders include companies with generating facilities of less than 10MW, companies that offer their own loads to be interrupted, as well as companies that provide services to other consumers interested in offering their loads to be interrupted. Retail Electricity LicenseesRetailers that sell electricity to contestable consumers are licensed by the EMA. Retailers that are registered as MPs purchase electricity directly from the wholesale market.
Market Support Services Licensee — SP ServicesA Market Support Services Licensee (MSSL) is authorised to provide market support services. Such services include facilitating customer transfers between retailers, meter reading and meter data management. SP Services is the only MSSL. In addition to its market support services function, SP Services also facilitates access to the NEMS for contestable consumers who have not appointed a retailer, and supplies electricity to non-contestable consumers.
Market Operator — EMCEMC operates and administers the wholesale market. This role includes calculating prices, scheduling generation, clearing and settling market transactions, and procuring ancillary services. EMC also administers the rule change process and provides resources that support the market surveillance and compliance, and dispute resolution processes. Transmission Licensee — SP PowerAssets SP PowerAssets owns and is responsible for maintaining the transmission system.
Power System OperatorThe Power System Operator (PSO), a division of the EMA, is responsible for ensuring the security of electricity supply to consumers. The PSO controls the dispatch of generation facilities, co-ordinates scheduled outages, oversees power system emergency planning and directs the operation of the high-voltage transmission system. The PSO also oversees the real-time operation of the natural gas transmission system. Regulator — EMAThe EMA is the regulator of the electricity industry and has the ultimate responsibility for the market framework and for ensuring that the interests of consumers are protected. ConsumersConsumers are classified as either contestable or non-contestable. Contestable consumers purchase electricity from a retailer or from the wholesale market. Non-contestable consumers purchase electricity from SP Services at the regulated tariff.
MARKET OVERVIEW: Industry Structure
6 CONTENTS
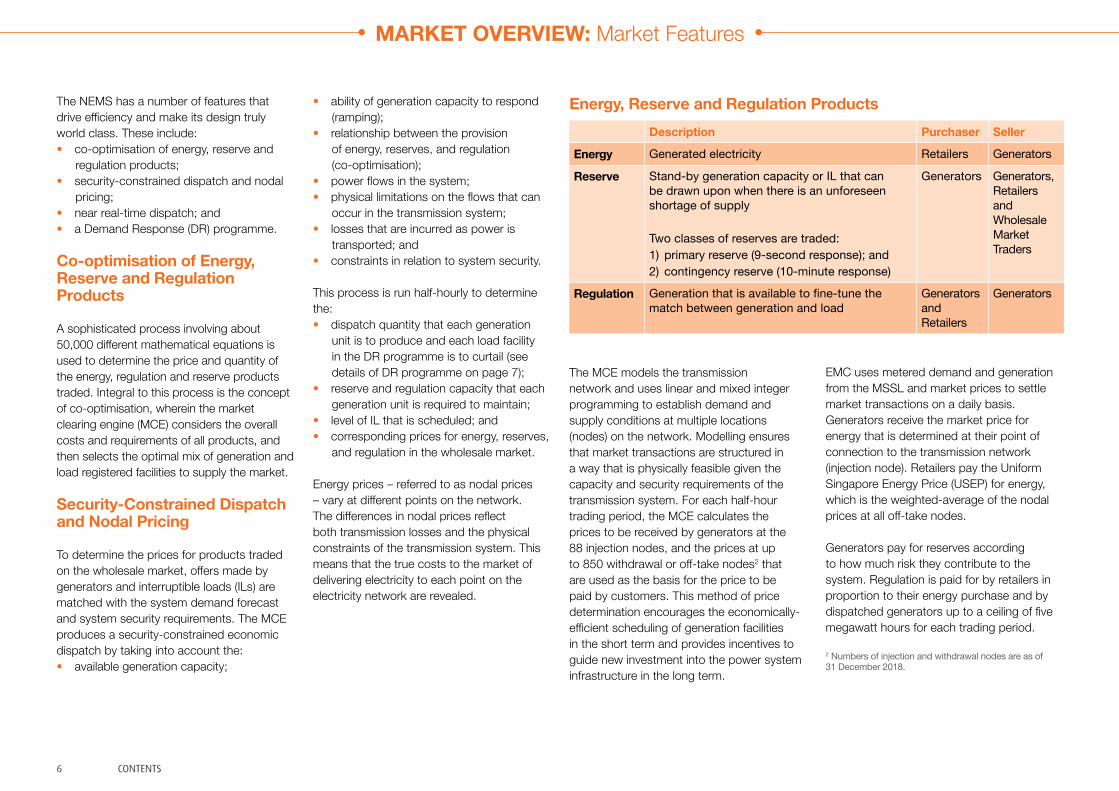
The NEMS has a number of features that drive efficiency and make its design truly world class. These include:• co-optimisation of energy, reserve and
regulation products;• security-constrained dispatch and nodal
pricing; • near real-time dispatch; and• a Demand Response (DR) programme.
Co-optimisation of Energy, Reserve and Regulation Products
A sophisticated process involving about 50,000 different mathematical equations is used to determine the price and quantity of the energy, regulation and reserve products traded. Integral to this process is the concept of co-optimisation, wherein the market clearing engine (MCE) considers the overall costs and requirements of all products, and then selects the optimal mix of generation and load registered facilities to supply the market.
Security-Constrained Dispatch and Nodal Pricing
To determine the prices for products traded on the wholesale market, offers made by generators and interruptible loads (ILs) are matched with the system demand forecast and system security requirements. The MCE produces a security-constrained economic dispatch by taking into account the:• available generation capacity;
• ability of generation capacity to respond (ramping);
• relationship between the provision of energy, reserves, and regulation (co-optimisation);
• power flows in the system;• physical limitations on the flows that can
occur in the transmission system;• losses that are incurred as power is
transported; and• constraints in relation to system security.
This process is run half-hourly to determine the:• dispatch quantity that each generation
unit is to produce and each load facility in the DR programme is to curtail (see details of DR programme on page 7);
• reserve and regulation capacity that each generation unit is required to maintain;
• level of IL that is scheduled; and • corresponding prices for energy, reserves,
and regulation in the wholesale market.
Energy prices – referred to as nodal prices – vary at different points on the network. The differences in nodal prices reflect both transmission losses and the physical constraints of the transmission system. This means that the true costs to the market of delivering electricity to each point on the electricity network are revealed.
Energy, Reserve and Regulation Products Description Purchaser Seller
Energy Generated electricity Retailers Generators
Reserve Stand-by generation capacity or IL that can be drawn upon when there is an unforeseen shortage of supply
Two classes of reserves are traded: 1) primary reserve (9-second response); and2) contingency reserve (10-minute response)
Generators Generators, Retailers and Wholesale Market Traders
Regulation Generation that is available to fine-tune the match between generation and load
Generators and Retailers
Generators
The MCE models the transmission network and uses linear and mixed integer programming to establish demand and supply conditions at multiple locations (nodes) on the network. Modelling ensures that market transactions are structured in a way that is physically feasible given the capacity and security requirements of the transmission system. For each half-hour trading period, the MCE calculates the prices to be received by generators at the 88 injection nodes, and the prices at up to 850 withdrawal or off-take nodes2 that are used as the basis for the price to be paid by customers. This method of price determination encourages the economically-efficient scheduling of generation facilities in the short term and provides incentives to guide new investment into the power system infrastructure in the long term.
EMC uses metered demand and generation from the MSSL and market prices to settle market transactions on a daily basis. Generators receive the market price for energy that is determined at their point of connection to the transmission network (injection node). Retailers pay the Uniform Singapore Energy Price (USEP) for energy, which is the weighted-average of the nodal prices at all off-take nodes.
Generators pay for reserves according to how much risk they contribute to the system. Regulation is paid for by retailers in proportion to their energy purchase and by dispatched generators up to a ceiling of five megawatt hours for each trading period.
MARKET OVERVIEW: Market Features
2 Numbers of injection and withdrawal nodes are as of 31 December 2018.

7CONTENTS
Near Real-Time Dispatch
Market prices and dispatch quantities for energy, reserves, and regulation are calculated five minutes before the start of each half-hour trading period. This ensures that the market outcomes reflect prevailing power system conditions, the most recent offers made by generators, as well as the most recent bids made by demand response aggregators and/or retailers. The result of near real-time calculation of dispatched generation quantities ensures as little real-time intervention as possible, and hence minimal deviation from a competitive market solution.
To support near real-time dispatch, EMC produces market forecast schedules up to a week ahead of the relevant trading period. These forecast schedules increase in frequency as the trading period approaches to ensure that MPs have the information they need to adjust their trading positions prior to physical dispatch.
Demand Response Programme
In April 2016, a new milestone was reached in the NEMS. A DR programme was introduced to allow consumers to submit bids in the energy market for the purpose of providing load curtailments. Loads located in the same zone can be aggregated and registered as a single load registered facility (LRF) in the market. These LRFs can submit energy bids if they satisfy the necessary requirements, and the MCE will schedule them for load curtailment in a given dispatch period. Scheduled and compliant load curtailments will receive incentive payments, which are calculated based on the estimated falls in the USEP across all non-regulatory loads. These incentive payments will be recovered from contestable consumers through the hourly energy uplift charges.
An ex-post assessment, comparing actual metering data with the expected consumption based on the LRFs’ dispatch schedules, will be conducted. LRFs that are scheduled for curtailment have to reduce their consumption accordingly, while LRFs that are not scheduled for curtailment have to consume at their non-curtailed level. Financial penalties will be imposed on LRFs that are deemed to have deviated from their dispatch schedules, and all financial penalties collected will be returned to the market via the monthly energy uplift charges.
MARKET OVERVIEW: Market Features

MARKETGOVERNANCE
9CONTENTS
Governing Documents and Institutions
The Energy Market Authority (EMA) was established under the Energy Market Authority of Singapore Act 2001. The EMA is the electricity market regulator under the Electricity Act 2001 and is responsible for, among other mandates:• creating the market framework for
electricity and gas supply;• promoting the development of the
electricity and gas industries;• protecting the interests of consumers
and the public;• issuing licences; and• advising the Government on energy
policies.
Rule Change Process
The day-to-day functioning of the National Electricity Market of Singapore (NEMS) wholesale market is governed by the Singapore Electricity Market Rules.
The rule change process is the responsibility of the Rules Change Panel (RCP). Appointed by the Energy Market Company (EMC) Board, RCP members represent generators, retailers, wholesale market traders, the financial community, the Power System Operator (PSO), the Market Support Services Licensee (MSSL), the transmission licensee, electricity consumers and EMC, ensuring representation by all key sectors of the industry.
The rule change process is designed to maximise transparency and opportunities for public involvement. Rule modifications recommended by the RCP require the support of the EMC Board and the EMA. When approving changes to the Market Rules, the EMA is required to consider whether the proposed rule modifications (i) unjustly discriminate in favour of or against a market participant (MP) or a class of MPs; or (ii) are inconsistent with the functions and duties of the EMA under subsection 3(3) of the Electricity Act. Each year, the RCP establishes and publishes its work plan to ensure that stakeholders remain informed about the likely evolution of the market. The work plan can be found at www.emcsg.com.
Market Surveillance and Compliance
The Market Surveillance and Compliance Panel (MSCP), comprising professionals independent of the market, is responsible for monitoring, investigating and reporting the behaviour of MPs and the structural efficiency of the market. The Panel identifies market rule breaches and assesses market operations for efficiency and fairness. In circumstances where the MSCP determines that an MP is not compliant with the Market Rules, it may take enforcement action, which may include levying a penalty. The MSCP also recommends remedial actions to mitigate any rule breaches or inefficiencies identified. The Panel produces the MSCP Annual Report, which has been published together with the NEMS Market Report since 2007.
Dispute Resolution
The Market Rules contain a process that facilitates the resolution of disputes between MPs and service providers. The dispute resolution process is designed to be a cost-effective way of resolving disputes and preserving market relationships by avoiding court proceedings. This process is managed by the Dispute Resolution Counsellor (DRC).
MARKET GOVERNANCE: Overview

10 CONTENTS
Dear Industry Members
Evolving the Singapore Electricity Market Rules, which serve as a contract between each market participant and Energy Market Company (EMC), requires the combined effort of many industry stakeholders. For the rule change process to be fair and efficient, the industry has given the Rules Change Panel (RCP) the mandate to review and make decisions on rules change proposals.
This year, a recurring theme in the proposals addressed by the RCP is enhancing the transparency of information to all market players. Providing market participants with additional information can help them make more informed decisions, with the market benefitting from more efficient outcomes.
One example is the publication of ex-ante schedule data based on alternative load scenarios for the short-term schedule, which is especially important with the increased adoption of intermittent generation sources that could result in greater load fluctuations. From this issue, it can also be seen that the RCP was mindful of the needs of, and the corresponding costs to, the industry when
hardware resources were re-allocated to the production of more useful information for the industry. Another example is the publication of ex-post offer data for reserves and regulation. The RCP, after weighing the benefits of increased transparency against the downside of the potential exercise of market power, supported the publication but made clear to the industry some caveats on the use and interpretation of such data.
With the entry of more diverse types of market participants, the RCP facilitated the participation of these new players and ensured that they all compete on a level playing field. The RCP sought to allocate EMC and the Power System Operator’s (PSO) administrative costs more equitably among market participants on a causer-pay principle so as to maintain the market’s confidence that the value of services provided commensurate with what they pay. The RCP further supported the proposal to provide clearer credit support templates and increased the options of alternative forms of credit support that net debtor participants can feasibly put up with EMC.
While the Singapore wholesale electricity market remains largely an offer-based market, the RCP recognised that the demand side is one of the key tenets of an efficient and competitive electricity market. This was apparent when the RCP acknowledged that a more comprehensive review of the Demand Response programme was required when it studied how compensation for generators adversely affected by price revisions could be extended to loads participating in the programme.
There were some changes to the RCP this year. I value the fresh perspectives that new members provide, as well as the wisdom that more experienced members offer. Collectively, they have brought robust discussions to the table for the betterment of the market. I am particularly grateful to Marcus Tan and Daniel Lee who left the RCP in 2018, for their contributions in the past three and eight years, respectively.
Finally, I would like to thank the industry for its continuous support and faith in the rule change process. My sincere appreciation goes to all market participants, service providers (the SP Group, EMC and the PSO) and the Energy Market Authority for facilitating rigorous analysis and thorough discussions on issues that are important to the market.
Toh Seong WahChairRules Change Panel
MARKET GOVERNANCE: Letter from the Chair, Rules Change Panel
11CONTENTS
Rule Changes Supported by the RCP
The following rule changes were discussed and approved, as part of the RCP’s continual efforts to guide the evolution of the wholesale electricity market.
Templates for Banker’s Guarantees and Standby Letters of Credit
Net debtors to the market are required to provide credit support in the form of cash, banker’s guarantee (BG), standby letter of credit (SBLC) or treasury bills. This proposal sought to amend the prescribed BG template and introduce a SBLC template.
To address concerns that clauses in the prescribed BG template might inadvertently imply a continuous liability for the issuing bank even after the BG’s expiry date, the BG template was revised to clarify the obligations of issuing banks and to improve the general flow within the template.
A standard template for SBLC was also introduced to give MPs greater confidence, as well as lower the transaction costs and processing time for MPs who wish to use them as credit support.
Imposition of Market Participant Registration Application Fee
The EMC and PSO’s administrative costs used to be recovered from MPs in the form of variable fees that were calculated based on the amount of energy traded by the MPs. A review of the cost recovery methodology was conducted in 2017.
One of EMC’s recommendations during the review was to introduce an MP registration application fee so that the costs incurred in providing the MP registration service would be charged directly to the applicants instead of being spread across the market. The recommendation was supported by the RCP and approved by the EMA during its review of EMC’s schedule of fees for the new regulatory period beginning 1 April 2018.
A rule change was made to implement the MP registration application fee. The change was implemented to ensure that the costs of services are allocated in the least distortionary manner to users of the services.
Publishing Additional Load Scenarios in the Forecast Schedules
Currently, EMC publishes three forecast schedules – short-term schedule (STS), pre-dispatch schedule (PDS) and market outlook scenario (MOS) – based on the normal load forecast received from the PSO. Two of the forecast schedules – PDS and MOS – include additional load scenarios based on a high load forecast and a low load forecast, to reflect forecasted load which is 100MW above and 100MW below the normal load forecast respectively.
The industry proposed to review the granularity and the number of load scenarios, and to include additional load scenarios for the STS.
Generally, more granular load scenarios are beneficial as they provide forecast price signals, help MPs manage spot price risks and encourage demand response. However, upon weighing these benefits against the associated costs of having more load scenarios – such as higher implementation and recurring costs, and the potential to facilitate MPs’ strategic bidding behaviour – the RCP decided on the status quo.
MARKET GOVERNANCE: Market Evolution
As for the inclusion of additional load scenarios for the STS, since the STS is published most frequently and closest to real-time, having forecast information relating to different load scenarios in the STS would be more useful to MPs compared to having the information in the PDS or MOS. The RCP, therefore, decided to remove the high and low load scenarios published in the PDS and MOS, and use the existing hardware to solve high and low load scenarios at the same granularity (±100MW) for the STS instead.

12 CONTENTS
Publication of Offer Data
Among the products traded in the Singapore wholesale electricity market, EMC currently releases offer information for energy only but not for reserve and regulation. Such information is currently released on an aggregated and masked basis with a four-week lag.
In considering whether changes should be made to the way energy offer information is released, the RCP decided to maintain the status quo. Since energy offer information is already being released, the incremental benefits to be gained from publishing energy offer data in a non-aggregated and non-masked manner with a shorter time lag are expected to be small, while the costs are expected to be high, in view of the existence of pivotal suppliers in the energy market.
However, given the benefits of greater information transparency, coupled with the low occurrence of pivotal suppliers in the reserve and regulation markets, the RCP supported the rule change to release reserve and regulation offer information in the same way as energy offers.
Rule Change Not Supported by the RCP
The RCP also discussed the following proposal but decided not to support it.
Compensation for Load Registered Facilities Adversely Affected by Price Revisions
A rule change which took effect from 1 September 2018, introduced compensation for generators which are adversely affected by price revisions. A proposal suggested that such compensation be extended to load registered facilities (LRFs) which are registered to provide load curtailment.
If the Uniform Singapore Energy Price (USEP) is revised higher than their bid prices, LRFs could incur out-of-pocket costs (relative to their bid prices). Since an LRF’s bid price reflects its maximum willingness to pay, for fairness, such LRFs should be compensated for the difference between the revised USEP and their bid prices for quantities that such LRFs consumed in adherence to dispatch instructions.
However, since the load curtailment price (LCP) serves as an incentive payment to LRFs for load curtailments delivered, a basis for compensation could not be established given that the LCP is not designed to be aligned with the bid prices submitted.
The RCP decided not to go ahead with the proposal at this time as the potential benefits are not expected to outweigh the implementation costs given the infrequency of upward price revisions and limited participation of LRFs currently. More importantly, the RCP agreed with EMC that given the inherent design issues with the current Demand Response (DR) programme, it is better to review and revise the design of the programme itself before re-considering the provisions for compensation during price revision periods.
MARKET GOVERNANCE: Market Evolution
Validating Load Forecasts
The RCP supported the rule change proposal for EMC to impose a validation check on the load forecasts received from the PSO. The check will invalidate the load forecast for a half-hourly period if it differs from the latest valid load forecast for the prior period by more than the fixed maximum difference provided by the PSO, and replace it with the latest valid load forecast for the same period.
This serves to address system security and reliability concerns arising from the use of erroneous and extreme load forecasts received from the PSO’s Energy Management System by EMC’s market clearing engine (MCE) to produce real-time schedules (RTS). With the validation check, the MCE will not schedule excessive or insufficient generation due to erroneous and extreme load forecasts, and the PSO will not need to significantly re-dispatch generators in real-time.

13CONTENTS
Rule Changes Directed by the EMA
In addition to the rule changes considered by the RCP, EMC also implemented the following rule changes as directed by the EMA pursuant to Section 46(2)(b) of the Electricity Act.
Registration of Non-exporting Embedded Intermittent Generation Facility
All generation facilities with installed capacity of 1MWac and above are required to be registered. Solar generation facilities generating solely to serve on-site loads are not exempted from this requirement, even though they do not set prices and are registered for the sole purpose of paying regulation charges.
The current system design only allows the registration of generation facilities serving the same on-site load by a single owner. With the increased adoption of solar, there have been instances when different owners of multiple solar generation facilities wish to serve the same on-site load.
MARKET GOVERNANCE: Market Evolution
To circumvent this problem, the EMA introduced a new generation facility type – Non-exporting Embedded Intermittent Generation Facility (NEIGF). Embedded intermittent generation facilities below 10MWac that will not be selling any electricity back to the market can be registered as NEIGFs. NEIGFs enjoy streamlined market participant and generation facility registrations. In addition, instead of daily settlement, NEIGFs only need to make half-yearly payments of fixed market-related charges (currently only regulation charges) to EMC based on historical rates.
Rule Modifications for the EMA’s Final Determination Papers “Enhancements to the Regulatory Framework for Intermittent Generation Sources” and “Enhancement to the Central Intermediary Scheme for Embedded Generation”
In 2015, the Central Intermediary Scheme (CIS) was introduced to allow contestable consumers (CCs) with embedded intermittent generation sources (IGS) of less than 1MWac to choose to sell their excess electricity generated through the central intermediary, the Market Support Services Licensee (MSSL), instead of participating directly in the wholesale market.
To further enhance the regulatory framework for IGS, EMC implemented rule changes to effect the EMA’s key policy decisions as follows:
1) Extend the thresholds under the CIS, to allow all CCs with embedded generators (IGS and non-IGS) less than 10MWac to choose to sell their excess electricity generated through the MSSL; and
2) Charge residential CCs with embedded IGS below 1MWac regulation costs on a net basis if such IGSs are registered via the MSSL in the CIS.
Recovery of Load Curtailment Uplift Charges
Under the DR programme, incentive payments are made to compliant scheduled load curtailments of LRFs if the scheduled curtailments resulted in a fall in the USEP. This incentive payment is recovered via the load curtailment uplift charges, which was previously charged only to CCs.
With the start of the Open Electricity Market, the EMA decided to recover the load curtailment uplift charges from all loads (instead of only contestable loads), as all consumers may benefit from lower wholesale prices as a result of load curtailments.
14 CONTENTS
Dear Industry Members
Dispute Resolution and Compensation Panel
The Dispute Resolution and Compensation Panel (DRCP) was established under the Market Rules to provide dedicated dispute resolution services to the NEMS when required.
The DRCP members are:
Mediation Panel1. Chow Kok Fong
2. Daniel John
3. Danny McFadden
4. Engelin Teh, Senior Counsel
5. Geoff Sharp
6. Associate Professor Joel Lee
7. Associate Professor Lim Lei Theng
8. Lim Tat
9. Professor Nadja Alexander
10. Dr Peter Adler
11. Robert Yu
12. Shirli Kirschner
Arbitration Panel1. Ben Giaretta
2. Chelva Rajah, Senior Counsel
3. Giam Chin Toon, Senior Counsel
4. Gregory Thorpe
5. Harry Elias, Senior Counsel
6. Kenneth Tan, Senior Counsel
7. Professor Lawrence Boo
8. N Sreenivasan, Senior Counsel
9. Naresh Mahtani
10. Philip Jeyaretnam, Senior Counsel
11. Phillip Harris
12. Raymond Chan
13. Dr Robert Gaitskell, Queen’s Counsel
14. Tan Chee Meng, Senior Counsel
15. Professor Tan Cheng Han, Senior Counsel
Dispute Management System Contacts
Pursuant to the Market Rules, each market entity has nominated at least one Dispute Management System (DMS) contact to be the first point of engagement in the event of a dispute.
The current DMS contacts are:
1. Best Electricity Supply – Terence Neo
2. CGNPC Solar-Biofuel Power (Singapore) – Mike Ong
3. CleanTech Solar Singapore Assets – Andre Nobre
4. Diamond Energy Merchants – Muhammad Khairul
5. Energy Market Company – Jeth Lee
6. Environmental Solutions (Asia) – Sivakumar Avadiar
7. ExxonMobil Asia Pacific – Eric Lim
8. ExxonMobil Asia Pacific – Lim Li Fang
9. ExxonMobil Asia Pacific – Matthias Franke
10. GreenCity Energy - Chilton Loh
11. Green Power Asia – Daniel Ma
12. Hyflux Energy – Cindy Lim
13. Hyflux Energy – Ooi Chel-Lin
14. I Switch – Senthil Kumar
15. Just Electric – Wittman Wah
16. Keppel Electric – Joelyn Wong
MARKET GOVERNANCE: Letter from the Dispute Resolution Counsellor
15CONTENTS
17. Keppel Electric – Nicholas Tan
18. Keppel Merlimau Cogen – Janice Bong
19. Keppel Merlimau Cogen – Sean Chan
20. LYS Genco Beta – Jonathan Chong
21. MyElectricity – Jeffrey Tan
22. National Environment Agency – Teresa Tan
23. National Environment Agency – Yap Hwee Tat
24. Ohm Energy – Nerine Teo
25. PacificLight Energy – Teo Chin Hau
26. PacificLight Power – Teo Chin Hau
27. Peerer Energy – Joe Poon
28. Power System Operator – Loh Poh Soon
29. Power System Operator – Oh Chai Choo
30. Red Dot Power – Vijay Sirse
31. Sembcorp Cogen – Agnes Low
32. Sembcorp Cogen – Ang Geok Chuan
33. Sembcorp Power – Lee Fee Goo
34. Sembcorp Power – Lim Han Kwang
35. Sembcorp Solar – Fendy Nursalim
36. Senoko Energy – Poo Siok Yin
37. Senoko Energy Supply – Michelle Lim
38. Senoko Waste-to-Energy – Francis Ng
39. Senoko Waste-to-Energy – Lee Song Koi
40. Seraya Energy – Elaine Syn
41. Shell Eastern Petroleum – Grace Chiam
42. Shell Eastern Petroleum – Farah Silas
43. SilverCloud Energy – Lee Hock Lim
44. Singapore District Cooling – Dennis Chong
45. Singapore District Cooling – Liu Yue
46. Singapore LNG Corporation – Jasmine Pang
47. Singapore LNG Corporation – Vincent Lam
48. Singapore Refining Company – Ho Weng Foo
49. Singapore Refining Company – Balasubramaniam Sundararaj Mohanakkannan
50. SP PowerAssets – Chan Hung Kwan
51. SP Services – Hilda Toh
52. SP Services – Ho Yin Shan
53. Sun Electric Energy Assets – Eugene Lim
54. Sun Electric Energy Assets – Matthew Peloso
55. Sunseap Energy – Lawrence Kwan
56. Sunseap Leasing – Jonathan Tai
57. Sunseap Leasing – Shawn Tan
58. Sunseap Leasing Beta – Shawn Tan
59. Tuas DBOO Trust – Victor Fong
60. Tuas DBOO Trust – Wilfred Tan
61. Tuas Power Generation – Priscilla Chua
62. Tuas Power Supply – Jazz Feng
63. Tuas Power Supply – Zhang Ai Jia
64. TuasOne – Kevin Fong
65. Tuaspring – Calvin Quek
66. Tuaspring – Chin Shi En
67. Union Power – Ellen Teo
68. Union Power – Eric Lim
69. UGS Energy – Esther Lim
70. UGS Energy – Jessica Ang
71. YTL PowerSeraya – Jonathan Chew
72. YTL PowerSeraya – Ong Yi Zha
Dispute Resolution Training
As part of my responsibilities, I provide training in dispute resolution for the DMS contacts.
On 5 June 2018, I conducted a briefing on the NEMS’ dispute resolution process for new DMS contacts. The workshop was organised and supported by EMC’s Market Assessment Unit.
Conclusion
I am happy to report that for the past year, no disputes were filed with this office. I thank the DRCP members and DMS contacts for their contributions, and look forward to continuing to support the dispute resolution needs of all NEMS market entities in the coming year.
George LimSenior CounselDispute Resolution Counsellor
MARKET GOVERNANCE: Letter from the Dispute Resolution Counsellor

MARKETPERFORMANCE

17CONTENTS
Annual Electricity Consumption 2014 – 2018
Electricity consumption rises in all four quarters of 2018
Electricity purchased by market participants (MPs) is settled using electricity consumption data provided by the Market Support Services Licensee (MSSL).
While Singapore’s economy grew 3.2 percent in 20183, the year-on-year (YOY) growth in electricity consumption was only 1.6 percent. Total electricity consumption exceeded the 50.0 terawatt hour (TWh) level for the first time since the market started, registering 50.4TWh in 2018.
Compared to the same periods in 2017, all four quarters in 2018 saw higher YOY electricity consumption. The largest increase was in the second quarter when electricity consumption rose 3.2 percent. The smallest increase of 0.4 percent was registered in the third quarter.
YOY Growth
YOY Growth (%)5
4
3
2
1
0 0
10
20
30
40
46.7 47.5 48.9 49.6 50.4
60
50
20182017201620152014
TWh
Q1 Q2 Q3 Q4
Q4
Q3
Q2
Q1
3 Based on the Singapore Ministry of Trade and Industry press release on 15 February 2019: “MTI Maintains 2019 GDP Growth Forecast at “1.5 to 3.5 Per Cent””.
MARKET PERFORMANCE: Overview of the Year

18 CONTENTS
Generation Capacity as of 31 December 2018: Registered Versus Licensed
Annual Generation Supply by Plant Type 2014 – 2018
Both licensed capacity and registered capacity rise in 2018 Annual generation supply decreases for the first time since 2015
Total licensed capacity in the National Electricity Market of Singapore (NEMS) of generators with capacity larger than or equal to 10 megawatts (MW) increased by 75MW to 13,646MW in 2018. The increase primarily came from TuasOne’s new licensed capacity of 136MW.
Total registered capacity grew 0.2 percent to 13,559MW in 2018. This was contributed by the addition of 24 facilities and the deregistration of four facilities in the NEMS (see details on page 22).
The annual generation supply decreased 2.6 percent in 2018 to 7,865MW, after two consecutive years of staying above 8,000MW in 2016 and 2017.
CCGT/cogen/trigen supply fell to 7,607MW in line with the lower generation supply but remained above forecasted demand by a margin of 29.5 percent. This was different from the past four years when this proportion was above 35.0 percent. The gap narrowed in 2018 due to lower supply and higher demand.
The proportion of CCGT/cogen/trigen registered capacity to total registered capacity decreased by 0.1 percentage point to 77.6 percent.
Both ST and GT supplies contracted in 2018. ST and GT supplies were 2.3 percent and 1.1 percent lower respectively compared to 2017.
CCGT/Cogen/Trigen ST STGT GTIGS Licensed Capacity
*Embedded generators exclude TP Utilities.**Licensed capacity for generators <10MW excluded as the information is no longer publicly available.
MARKET PERFORMANCE: Overview of the Year
CCGT/Cogen/Trigen Forecasted Demand
3,500
3,000
2,500
2,000
1,500
1,000
500
PacificLight Power
Sembcorp Cogen
Senoko Energy
YTL PowerSeraya
Tuas Power Generation
Incineration Plants
Generators** <10MW
TP Utilities Tuaspring Keppel Merlimau
Cogen
Embedded Generators*
≥ 10MW
0
MW
CCGT/cogen/trigen = Combined-cycle gas turbine/cogeneration/trigeneration (combined category)ST = Steam turbineGT = Gas turbineIGS = Intermittent generation sourcesEmbedded generators (EG) = Generation units that generate electricity to their onsite load principally for self-consumption.
9,000
5,000
8,000
4,000
7,000
3,000
6,000
2,000
1,000
0
MW
2017201620152014 2018
19CONTENTS
Annual USEP and Ancillary Prices 2014 – 2018
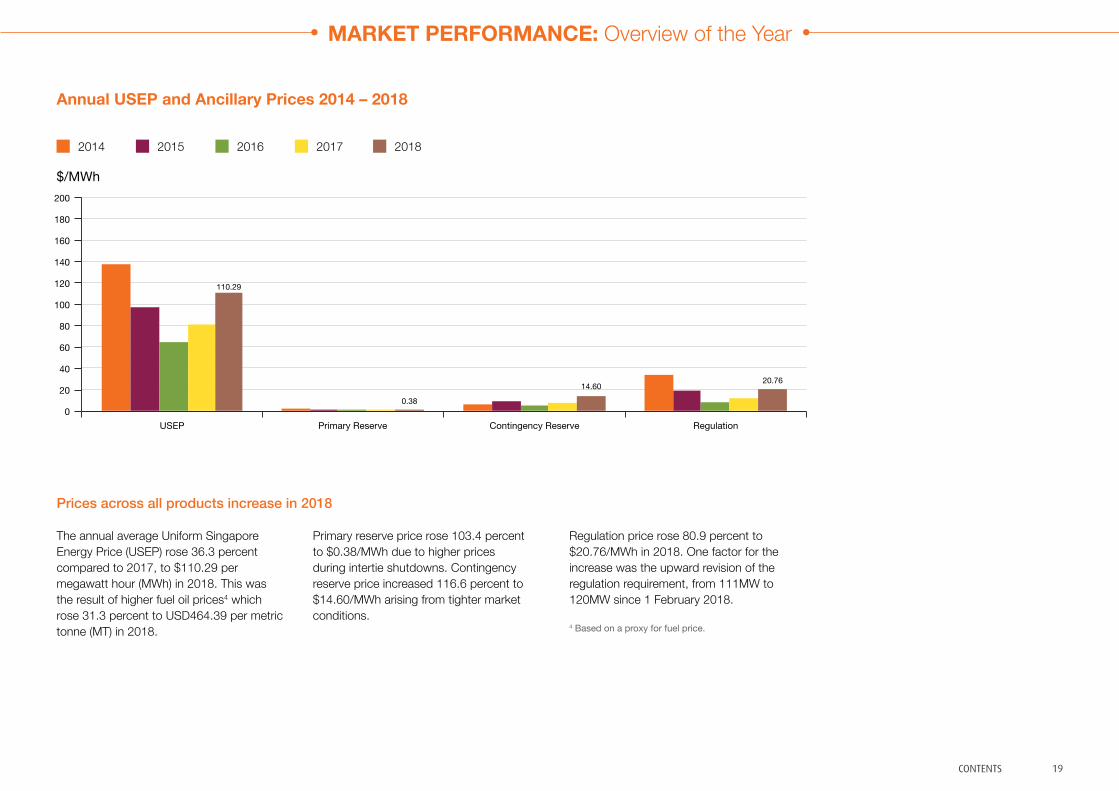
Prices across all products increase in 2018
The annual average Uniform Singapore Energy Price (USEP) rose 36.3 percent compared to 2017, to $110.29 per megawatt hour (MWh) in 2018. This was the result of higher fuel oil prices4 which rose 31.3 percent to USD464.39 per metric tonne (MT) in 2018.
Primary reserve price rose 103.4 percent to $0.38/MWh due to higher prices during intertie shutdowns. Contingency reserve price increased 116.6 percent to $14.60/MWh arising from tighter market conditions.
2014 2015 2016 2017 2018
200
160
140
100
60
180
120
80
40
20
0
$/MWh
USEP Primary Reserve Contingency Reserve Regulation
4 Based on a proxy for fuel price.
MARKET PERFORMANCE: Overview of the Year
110.29
0.38
14.6020.76
Regulation price rose 80.9 percent to $20.76/MWh in 2018. One factor for the increase was the upward revision of the regulation requirement, from 111MW to 120MW since 1 February 2018.
20 CONTENTS
Annual Value of Products Traded 2014 – 2018 Annual USEP and Fuel Oil Price Movements 2014 – 2018
MARKET PERFORMANCE: Overview of the Year
USEP Fuel Oil
0
10 1.5
1.0
8
6
4
2
$ Billion Index
2017 2018 20182016 20172015 20162014 20152014 (index base)
7.01
5.11
3.42
4.39
6.16
0.5
0
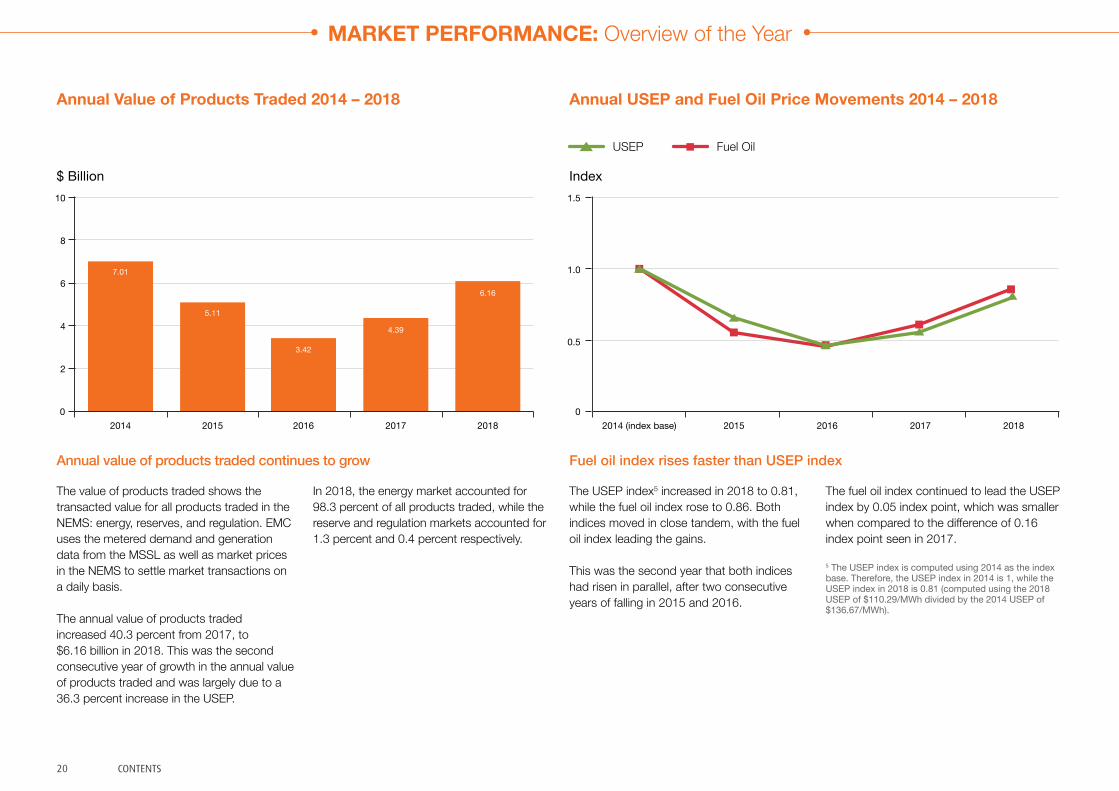
Annual value of products traded continues to grow Fuel oil index rises faster than USEP index
The value of products traded shows the transacted value for all products traded in the NEMS: energy, reserves, and regulation. EMC uses the metered demand and generation data from the MSSL as well as market prices in the NEMS to settle market transactions on a daily basis.
The annual value of products traded increased 40.3 percent from 2017, to $6.16 billion in 2018. This was the second consecutive year of growth in the annual value of products traded and was largely due to a 36.3 percent increase in the USEP.
The USEP index5 increased in 2018 to 0.81, while the fuel oil index rose to 0.86. Both indices moved in close tandem, with the fuel oil index leading the gains.
This was the second year that both indices had risen in parallel, after two consecutive years of falling in 2015 and 2016.
In 2018, the energy market accounted for 98.3 percent of all products traded, while the reserve and regulation markets accounted for 1.3 percent and 0.4 percent respectively.
The fuel oil index continued to lead the USEP index by 0.05 index point, which was smaller when compared to the difference of 0.16 index point seen in 2017.
5 The USEP index is computed using 2014 as the index base. Therefore, the USEP index in 2014 is 1, while the USEP index in 2018 is 0.81 (computed using the 2018 USEP of $110.29/MWh divided by the 2014 USEP of $136.67/MWh).

21CONTENTS
Monthly Forecasted Demand 2014 – 2018
MW
May Oct DecApr Sep NovMar AugFeb JulJan Jun
6,000
5,800
5,600
5,400
5,200
5,000
4,600
Higher demand registered in all 12 months
Forecasted demand refers to the projected electricity consumption in Singapore. The forecast is provided in real-time by the Power System Operator (PSO) and is a key component in determining the USEP.
The annual forecasted demand rose 2.2 percent in 2018 to 5,873MW.
Compared to 2017, demand was stronger in all 12 months of the year. The highest forecasted demand growth YOY was in April at 5.6 percent, which corresponded to the largest temperature increase of 1.9 degrees Celsius compared to April 2017. The highest monthly average forecasted demand in 2018 was 6,031MW in May, which also registered the second highest YOY growth of 3.9 percent.
The forecasted demand reached new monthly highs in all months in 2018.
The peak half-hourly forecasted demand of 7,071MW was recorded in Period 22 on 11 May 2018. This was higher than 2017’s peak half-hourly forecasted demand of 6,967MW seen in Period 22 on 1 August 2017.
MARKET PERFORMANCE: Energy Demand
2018, June Forecasted Demand
Five-Year Average for June
2014, February Forecasted Demand
6,200
4,800

22 CONTENTS
Generation and Load Facilities Registered and De-registered in 2018
MARKET PERFORMANCE: Energy Supply
24 new generation facilities registered in 2018
At the end of 2018, the total registered capacity of generation facilities in the NEMS stood at 13,559MW. Out of this, 77.6 percent or 10,512MW belonged to the CCGT/cogen/trigen category. The total number of generation facilities registered as of 31 December 2018 was 91.
In the year, 24 new generation facilities were added from seven MPs which collectively contributed a total of 23 intermittent generation source (IGS)6 facilities and one CCGT facility to the market.
A breakdown of the new generation facilities can be seen from the table on the right.
At the same time, four generation facilities were de-registered in 2018 – a 1.932MW CCGT unit from Glaxo Wellcome Manufacturing, a 4.971MW IGS unit from Nanyang Technological University, a 4.80MW CCGT unit from Pfizer Asia Pacific and a 2.844MW IGS unit from Changi Mega Solar.
For load facilities, Diamond Energy Merchants reduced an interruptible load (IL) facility by 6.2MW in 2018 to 7.0MW.
Market Participant Generation Type Registered Capacity
Cleantech Solar Singapore Assets
1 NEIGF unit 1.500MW
Changi Mega Solar 1 NEIGF unit 2.840MW
Sembcorp Solar Singapore
4 IGS units 2.016MW, 1.728MW, 1.980MW, 0.432MW
SP Services# 1CCGT unit & 1 IGS unit 10.628MW, 0.005MW
Sun Electric Energy Assets
9 IGS units 0.145MW, 0.193MW, 0.193MW, 0.345MW, 0.313MW, 0.041MW, 0.112MW, 0.150MW, 0.267MW
Sunseap Leasing 3 IGS units & 1 NEIGF unit 1.020MW, 1.003MW, 1.260MW##, 0.428MW
Sunseap Leasing Beta 3 IGS units 2.340MW, 0.864MW, 0.360MW
Total 30.163MW
*NEIGF refers to non-exporting embedded IGS.**SP Services includes aggregated facilities.
#Registered capacity of CCGT unit revised on 5 July to 10.628MW and that of IGS unit revised on 21 November to 0.005MW.##Capacity for NEIGF unit.
De-re
gist
ered
Re
gist
ered
SembcorpSolar Singapore
31 Jan 1 IGS unit
Sunseap Leasing9 May
1 IGS unit Sembcorp Solar Singapore
29 Jun1 IGS unit
Sun ElectricEnergy Assets
28 Nov1 IGS unit
Sun Electric Energy Assets 13 Jul4 IGS units
SunseapLeasing10 Sep
1 NEIGF* unit
Sunseap Leasing23 Feb
1 IGS unit
SunseapLeasing Beta4 Apr1 IGS unit
SunseapLeasing
7 Dec1 IGS unit
Sunseap Leasing Beta19 Sep2 IGS units
Sembcorp SolarSingapore19 Sep1 IGS unit
Cleantech Solar Singapore Assets
30 Oct1 NEIGF* unit
Sembcorp Solar Singapore
27 Mar1 IGS unit
Sun Electric Energy Assets15 Feb
1 IGS unit
Jan Feb Mar Apr May Jun Jul SepAug NovOct Dec
ChangiMega Solar
28 Dec1 IGS unit
ChangiMega Solar
28 Dec1 NEIGF* unit
Sun ElectricEnergy Assets
28 Dec1 IGS unit
Sun ElectricEnergy Assets
12 Sep2 IGS units
Pfizer Asia Pacific1 Jun
1 CCGT unitNanyang Technological University1 Jun1 IGS unit
Glaxo Wellcome Manufacturing1 Jun1 CCGT unit
6 Includes NEIGFs registered in 2018.
SP Services** 23 Mar
1 CCGT unit1 IGS unit

23CONTENTS
Embedded Generator Generation Market Share 2014 – 2018 Annual Supply Cushion 2014 – 2018
Supply YOY ChangeSupply CushionEG Generation Market Share
% YOY Change (%) Supply Cushion (%)8.0
7.0
6.0
3.0
5.0
2.0
4.0
1.0
0
10.0 31.0
8.0 30.0
6.0 29.0
4.0 28.0
0.0 26.0
2.0 27.0
-2.0 25.0
-4.0 24.020182018 20172017 20162016 201520142014 2015
Embedded generator generation market share increases in 2018 Supply cushion contracts on lower supply and higher demand
The EG generation market share in the NEMS continued to grow, increasing from 5.6 percent in 2017 to 7.0 percent in 2018. This was due to the commissioning of an EG facility and higher on-site consumption of the facilities.
Supply cushion measures the percentage of total generation supply that is available after matching off forecasted demand. It is calculated by subtracting forecasted demand from total supply, over total supply.
The highest monthly EG generation market share was registered in November at 7.8 percent and the lowest was in April at 5.2 percent. The standard deviation was 0.82 percent, down from 2017’s standard deviation of 1.3 percent.
In 2018, the forecasted demand increased while total supply fell. This resulted in a reduction of 3.5 percentage points in the supply cushion to 25.4 percent, which was the lowest annual supply cushion level since 2011. For the fourth consecutive year, the supply cushion stayed below 30.0 percent.
MARKET PERFORMANCE: Energy Supply
4.2 4.0
4.6
5.6
7.0
24 CONTENTS
Monthly Supply by Plant Type 2018
MARKET PERFORMANCE: Energy Supply
ST GTCCGT/Cogen/Trigen Total Supply YOY Change
MW YOY Change (%)
2.0
-1.0
-4.0
-7.0May Oct DecApr Sep NovMar AugFeb JulJan Jun
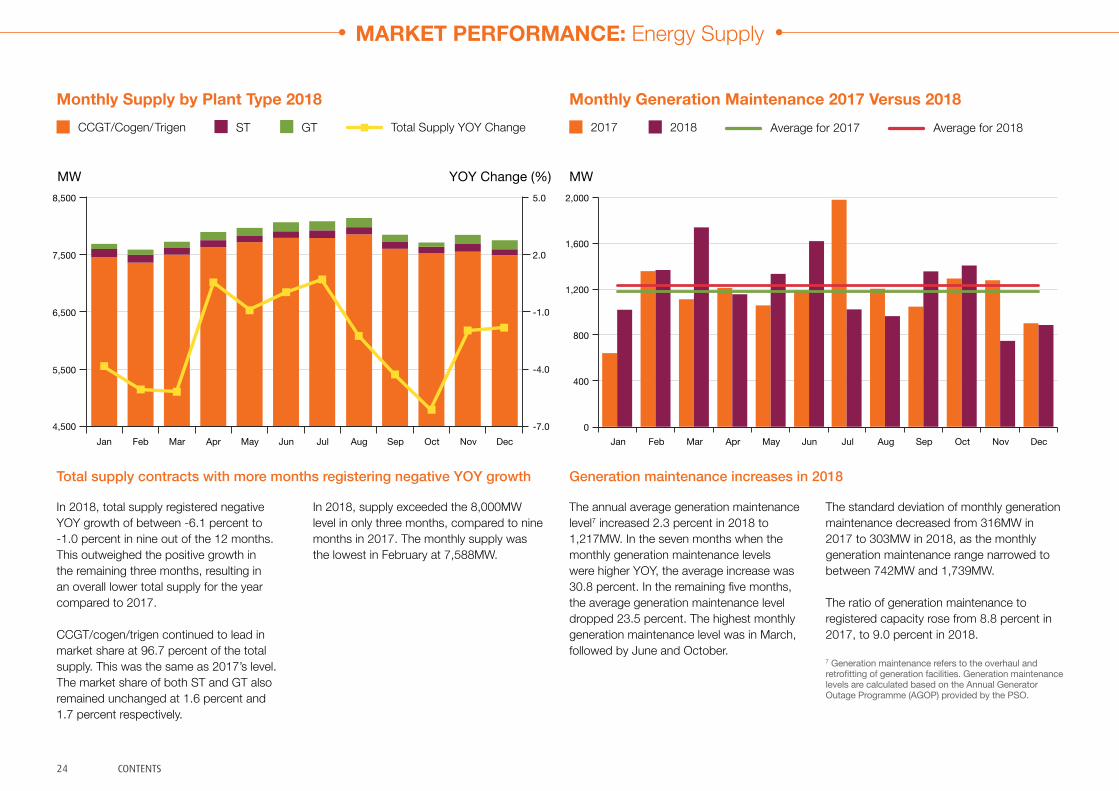
Total supply contracts with more months registering negative YOY growth
In 2018, total supply registered negative YOY growth of between -6.1 percent to -1.0 percent in nine out of the 12 months. This outweighed the positive growth in the remaining three months, resulting in an overall lower total supply for the year compared to 2017.
CCGT/cogen/trigen continued to lead in market share at 96.7 percent of the total supply. This was the same as 2017’s level. The market share of both ST and GT also remained unchanged at 1.6 percent and 1.7 percent respectively.
In 2018, supply exceeded the 8,000MW level in only three months, compared to nine months in 2017. The monthly supply was the lowest in February at 7,588MW.
Generation maintenance increases in 2018
The annual average generation maintenance level7 increased 2.3 percent in 2018 to 1,217MW. In the seven months when the monthly generation maintenance levels were higher YOY, the average increase was 30.8 percent. In the remaining five months, the average generation maintenance level dropped 23.5 percent. The highest monthly generation maintenance level was in March, followed by June and October.
The standard deviation of monthly generation maintenance decreased from 316MW in 2017 to 303MW in 2018, as the monthly generation maintenance range narrowed to between 742MW and 1,739MW.
The ratio of generation maintenance to registered capacity rose from 8.8 percent in 2017, to 9.0 percent in 2018.
7 Generation maintenance refers to the overhaul and retrofitting of generation facilities. Generation maintenance levels are calculated based on the Annual Generator Outage Programme (AGOP) provided by the PSO.
Monthly Generation Maintenance 2017 Versus 2018Average for 2017 Average for 20182017 2018
MW2,000
1,600
1,200
800
400
0May Oct DecApr Sep NovMar AugFeb JulJan Jun
5.0
5,500
4,500
8,500
7,500
6,500

25CONTENTS
Monthly Energy Offer Price Proportion and Fuel Oil Price 2018
Fuel Oil ≥ $150/MWh< $80/MWh ≥ $80/MWh and < $100/MWh ≥ $100/MWh and < $120/MWh≥ $120/MWh and < $150/MWh
Offer Price Proportion (%) Fuel Oil (US$/MT) 100.0
25.0 350
37.5
50.0
62.5
75.0
87.5
May Oct DecApr Sep NovMar AugFeb JulJan Jun
550
530
510
490
470
450
430
410
390
370
Energy offer prices move into higher price bands in tandem with rising fuel oil prices
In 2018, the daily fuel oil price ranged between USD369.00/MT and USD551.50/MT. Fuel oil prices trended upwards for the first ten months and peaked in October, before falling in the last two months of the year.
In the ten months of rising fuel oil prices, energy offers in the price band below $80.00/MWh reduced and shifted into higher price bands – while the proportion of offers in this price band was 73.0 percent in January, it dropped to 64.5 percent in October.
Comparing month-on-month, the percentage of energy offers in the $80.00/MWh to $100.00/MWh price band reduced to 9.2 percent in October compared to the preceding month, while the percentage of energy offers in the $100.00/MWh to $120.00/MWh price band doubled to 8.4 percent.
The proportion of energy offers in the lowest price band decreased further to 61.7 percent in November, while those in the higher price bands increased. The energy offers in the lowest price band rebounded to 66.3 percent in December when fuel oil prices dropped by close to USD100.00/MT to USD408.00/MT.
Throughout 2018, the percentage of energy offers priced under $100.00/MWh ranged between 70.9 percent and 81.3 percent. The proportion of energy offers in the higher price bands moved largely in tandem with rising fuel oil prices, as offers shifted from the lower price bands to the higher price bands.
MARKET PERFORMANCE: Energy Supply
26 CONTENTS
MARKET PERFORMANCE: Energy Supply
Monthly Utilisation Rate by Plant Type 2018
Monthly ST Utilisation Rate 2018Monthly CCGT/Cogen/ Trigen Utilisation Rate 2018
Annual CCGT/Cogen/ Trigen Utilisation Rate 2018 Annual ST Utilisation Rate 2018 Annual CCGT/Cogen/ Trigen Utilisation Rate 2017 Annual ST Utilisation Rate 2017
Utilisation Rate (%) 60
50
40
30
20
10
0May Oct DecApr Sep NovMar AugFeb JulJan Jun
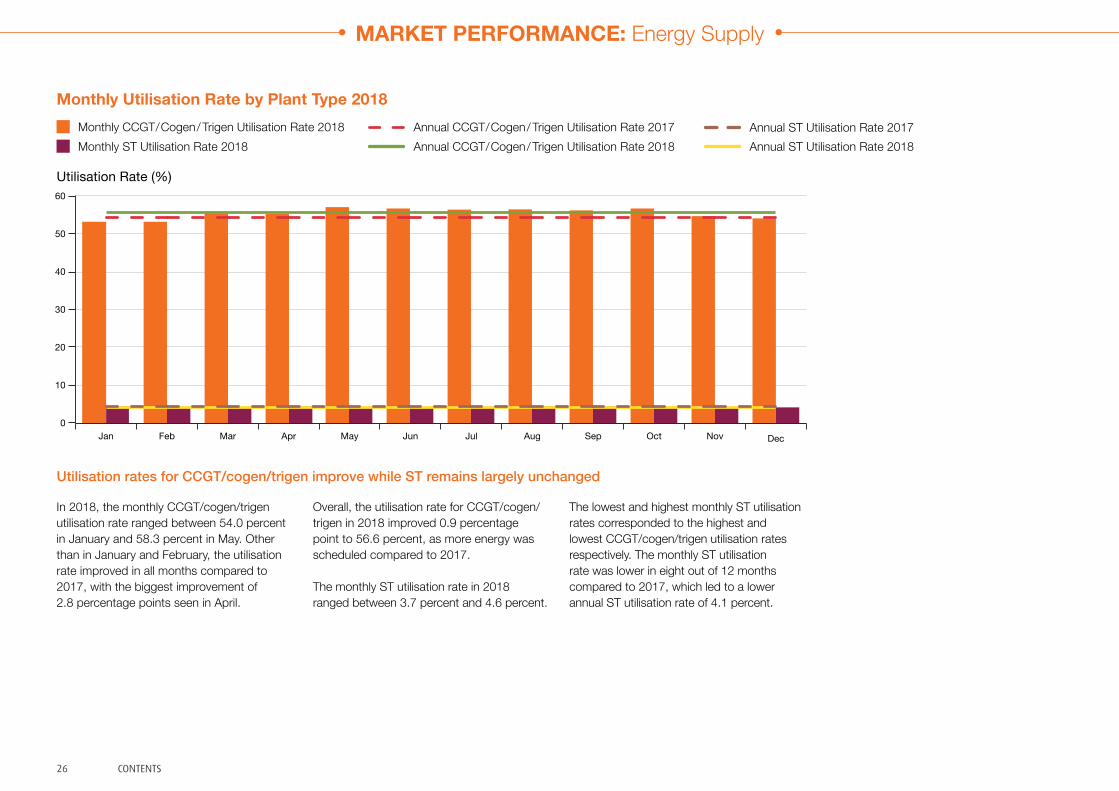
Utilisation rates for CCGT/cogen/trigen improve while ST remains largely unchanged
In 2018, the monthly CCGT/cogen/trigen utilisation rate ranged between 54.0 percent in January and 58.3 percent in May. Other than in January and February, the utilisation rate improved in all months compared to 2017, with the biggest improvement of 2.8 percentage points seen in April.
Overall, the utilisation rate for CCGT/cogen/trigen in 2018 improved 0.9 percentage point to 56.6 percent, as more energy was scheduled compared to 2017.
The monthly ST utilisation rate in 2018 ranged between 3.7 percent and 4.6 percent.
The lowest and highest monthly ST utilisation rates corresponded to the highest and lowest CCGT/cogen/trigen utilisation rates respectively. The monthly ST utilisation rate was lower in eight out of 12 months compared to 2017, which led to a lower annual ST utilisation rate of 4.1 percent.
27CONTENTS
180
200 28
160
140
27
120
26
100
25
24
80
23
20
22
21
60
Monthly USEP, BVP, LVP and Supply Cushion 2018USEP BVP LVPSupply Cushion
$/MWh Supply Cushion (%)
May Oct DecApr Sep NovMar AugFeb JulJan Jun
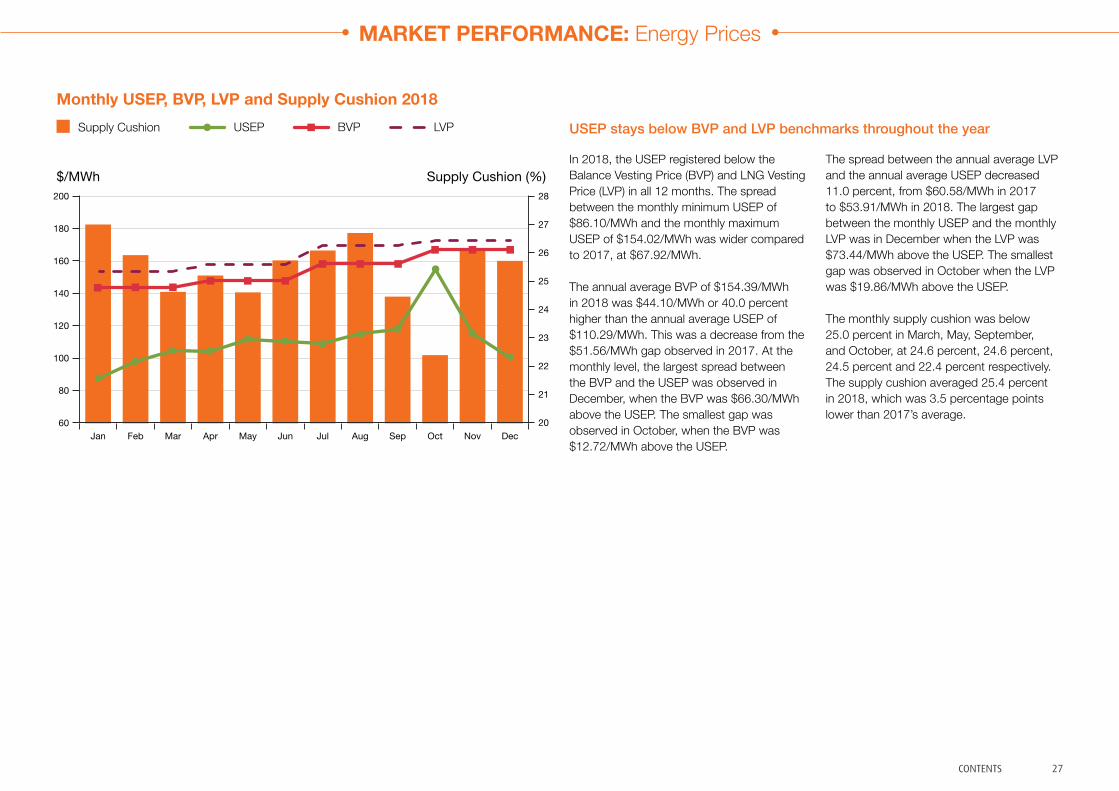
USEP stays below BVP and LVP benchmarks throughout the year
In 2018, the USEP registered below the Balance Vesting Price (BVP) and LNG Vesting Price (LVP) in all 12 months. The spread between the monthly minimum USEP of $86.10/MWh and the monthly maximum USEP of $154.02/MWh was wider compared to 2017, at $67.92/MWh.
The annual average BVP of $154.39/MWh in 2018 was $44.10/MWh or 40.0 percent higher than the annual average USEP of $110.29/MWh. This was a decrease from the $51.56/MWh gap observed in 2017. At the monthly level, the largest spread between the BVP and the USEP was observed in December, when the BVP was $66.30/MWh above the USEP. The smallest gap was observed in October, when the BVP was $12.72/MWh above the USEP.
The spread between the annual average LVP and the annual average USEP decreased 11.0 percent, from $60.58/MWh in 2017 to $53.91/MWh in 2018. The largest gap between the monthly USEP and the monthly LVP was in December when the LVP was $73.44/MWh above the USEP. The smallest gap was observed in October when the LVP was $19.86/MWh above the USEP.
The monthly supply cushion was below 25.0 percent in March, May, September, and October, at 24.6 percent, 24.6 percent, 24.5 percent and 22.4 percent respectively. The supply cushion averaged 25.4 percent in 2018, which was 3.5 percentage points lower than 2017’s average.
MARKET PERFORMANCE: Energy Prices
28 CONTENTS
Daily USEP, Forecasted Demand and Generation Supply 2018Generation Supply Forecasted Demand USEP
$/MWh MW
MARKET PERFORMANCE: Energy Prices
500 9,500
400 8,500
450 9,000
300 7,500
250 7,000
350 8,000
100 5,500
200 6,500
150 6,000
50 5,000
0 4,500Nov DecOctSepAugJulJunMayAprMarFebJan
BC
DE
F
A
29CONTENTS
MARKET PERFORMANCE: Energy Prices
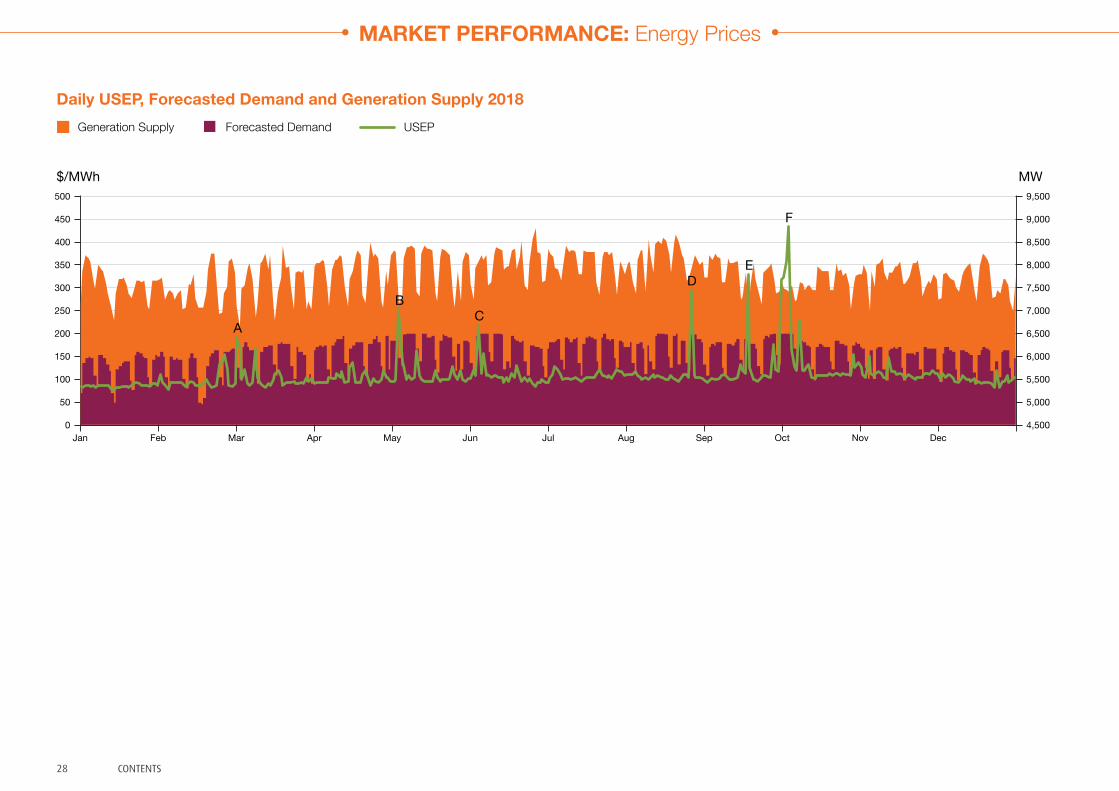
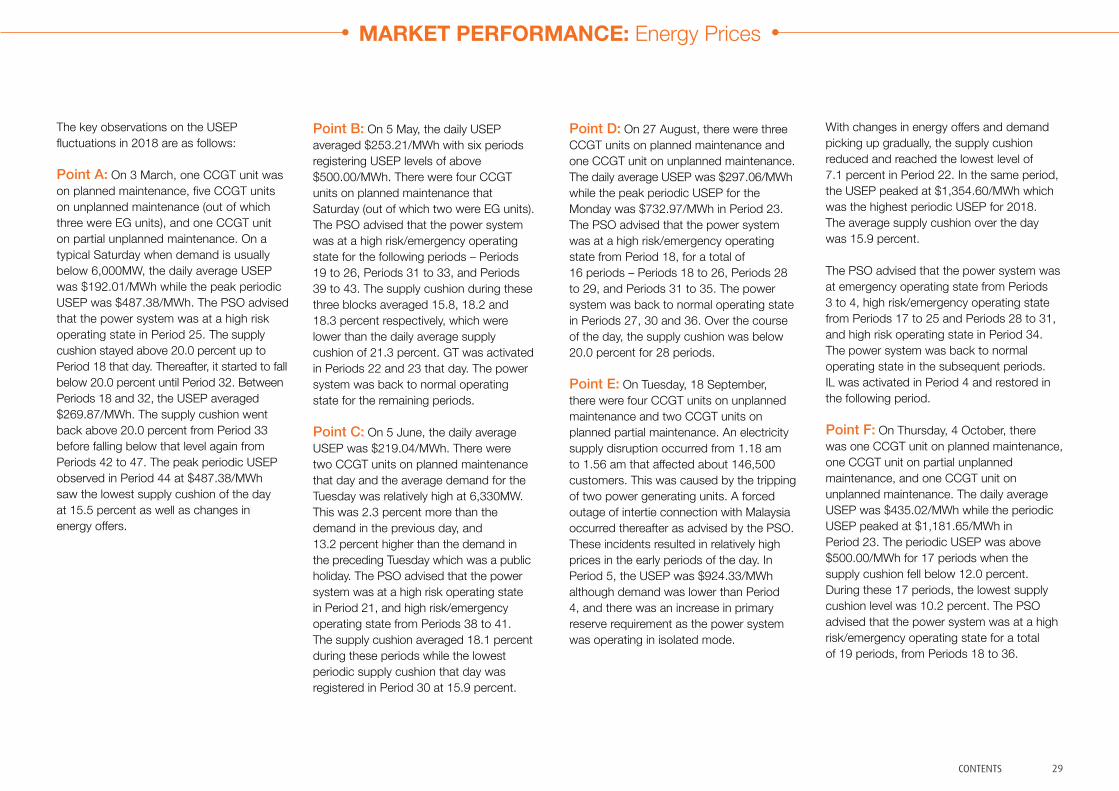
The key observations on the USEP fluctuations in 2018 are as follows:
Point A: On 3 March, one CCGT unit was on planned maintenance, five CCGT units on unplanned maintenance (out of which three were EG units), and one CCGT unit on partial unplanned maintenance. On a typical Saturday when demand is usually below 6,000MW, the daily average USEP was $192.01/MWh while the peak periodic USEP was $487.38/MWh. The PSO advised that the power system was at a high risk operating state in Period 25. The supply cushion stayed above 20.0 percent up to Period 18 that day. Thereafter, it started to fall below 20.0 percent until Period 32. Between Periods 18 and 32, the USEP averaged $269.87/MWh. The supply cushion went back above 20.0 percent from Period 33 before falling below that level again from Periods 42 to 47. The peak periodic USEP observed in Period 44 at $487.38/MWh saw the lowest supply cushion of the day at 15.5 percent as well as changes in energy offers.
Point B: On 5 May, the daily USEP averaged $253.21/MWh with six periods registering USEP levels of above $500.00/MWh. There were four CCGT units on planned maintenance that Saturday (out of which two were EG units). The PSO advised that the power system was at a high risk/emergency operating state for the following periods – Periods 19 to 26, Periods 31 to 33, and Periods 39 to 43. The supply cushion during these three blocks averaged 15.8, 18.2 and 18.3 percent respectively, which were lower than the daily average supply cushion of 21.3 percent. GT was activated in Periods 22 and 23 that day. The power system was back to normal operating state for the remaining periods.
Point C: On 5 June, the daily average USEP was $219.04/MWh. There were two CCGT units on planned maintenance that day and the average demand for the Tuesday was relatively high at 6,330MW. This was 2.3 percent more than the demand in the previous day, and 13.2 percent higher than the demand in the preceding Tuesday which was a public holiday. The PSO advised that the power system was at a high risk operating state in Period 21, and high risk/emergency operating state from Periods 38 to 41. The supply cushion averaged 18.1 percent during these periods while the lowest periodic supply cushion that day was registered in Period 30 at 15.9 percent.
Point D: On 27 August, there were three CCGT units on planned maintenance and one CCGT unit on unplanned maintenance. The daily average USEP was $297.06/MWh while the peak periodic USEP for the Monday was $732.97/MWh in Period 23. The PSO advised that the power system was at a high risk/emergency operating state from Period 18, for a total of 16 periods – Periods 18 to 26, Periods 28 to 29, and Periods 31 to 35. The power system was back to normal operating state in Periods 27, 30 and 36. Over the course of the day, the supply cushion was below 20.0 percent for 28 periods.
Point E: On Tuesday, 18 September, there were four CCGT units on unplanned maintenance and two CCGT units on planned partial maintenance. An electricity supply disruption occurred from 1.18 am to 1.56 am that affected about 146,500 customers. This was caused by the tripping of two power generating units. A forced outage of intertie connection with Malaysia occurred thereafter as advised by the PSO. These incidents resulted in relatively high prices in the early periods of the day. In Period 5, the USEP was $924.33/MWh although demand was lower than Period 4, and there was an increase in primary reserve requirement as the power system was operating in isolated mode.
With changes in energy offers and demand picking up gradually, the supply cushion reduced and reached the lowest level of 7.1 percent in Period 22. In the same period, the USEP peaked at $1,354.60/MWh which was the highest periodic USEP for 2018. The average supply cushion over the day was 15.9 percent. The PSO advised that the power system was at emergency operating state from Periods 3 to 4, high risk/emergency operating state from Periods 17 to 25 and Periods 28 to 31, and high risk operating state in Period 34. The power system was back to normal operating state in the subsequent periods. IL was activated in Period 4 and restored in the following period.
Point F: On Thursday, 4 October, there was one CCGT unit on planned maintenance, one CCGT unit on partial unplanned maintenance, and one CCGT unit on unplanned maintenance. The daily average USEP was $435.02/MWh while the periodic USEP peaked at $1,181.65/MWh in Period 23. The periodic USEP was above $500.00/MWh for 17 periods when the supply cushion fell below 12.0 percent. During these 17 periods, the lowest supply cushion level was 10.2 percent. The PSO advised that the power system was at a high risk/emergency operating state for a total of 19 periods, from Periods 18 to 36.
30 CONTENTS
MARKET PERFORMANCE: Energy Prices
Summary of Security Constraints in 2018
Application of security constraints in 2018 Periods with security constraint binding in 2018
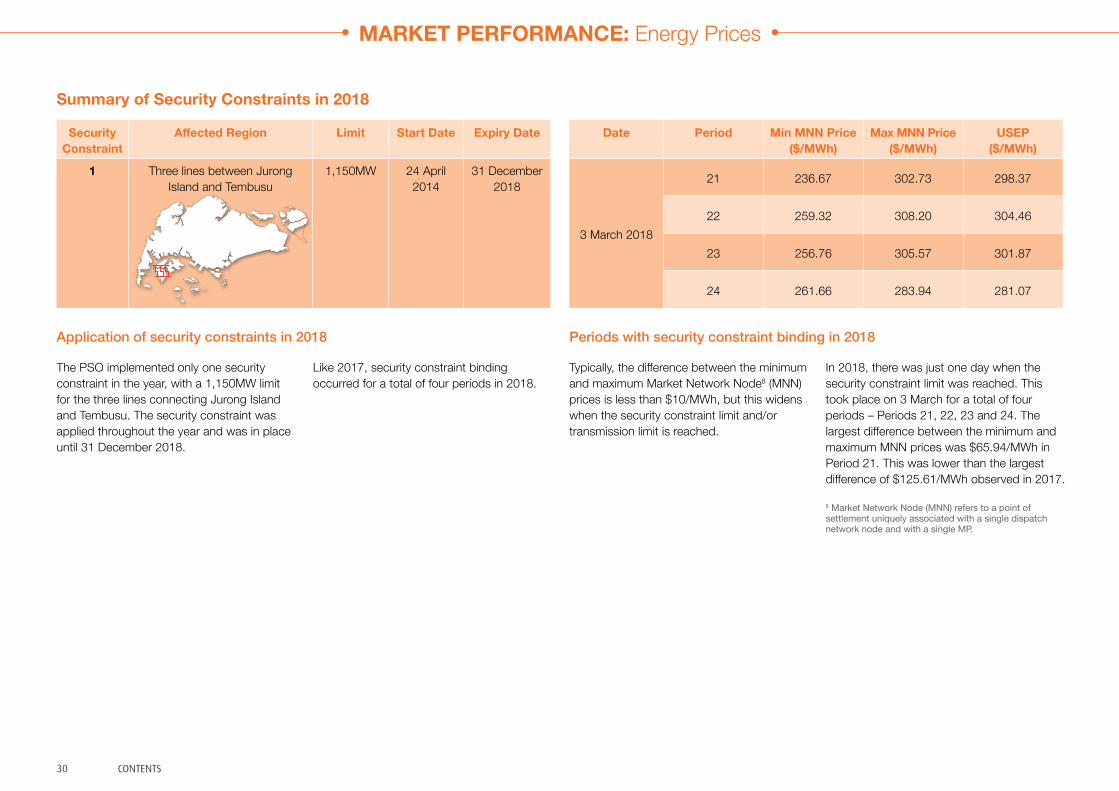
The PSO implemented only one security constraint in the year, with a 1,150MW limit for the three lines connecting Jurong Island and Tembusu. The security constraint was applied throughout the year and was in place until 31 December 2018.
Security Constraint
Affected Region Limit Start Date Expiry Date
1 Three lines between Jurong Island and Tembusu
1,150MW 24 April 2014
31 December 2018
Date Period Min MNN Price ($/MWh)
Max MNN Price ($/MWh)
USEP ($/MWh)
3 March 2018
21 236.67 302.73 298.37
22 259.32 308.20 304.46
23 256.76 305.57 301.87
24 261.66 283.94 281.07
Typically, the difference between the minimum and maximum Market Network Node8 (MNN) prices is less than $10/MWh, but this widens when the security constraint limit and/or transmission limit is reached.
Like 2017, security constraint binding occurred for a total of four periods in 2018.
In 2018, there was just one day when the security constraint limit was reached. This took place on 3 March for a total of four periods – Periods 21, 22, 23 and 24. The largest difference between the minimum and maximum MNN prices was $65.94/MWh in Period 21. This was lower than the largest difference of $125.61/MWh observed in 2017.
8 Market Network Node (MNN) refers to a point of settlement uniquely associated with a single dispatch network node and with a single MP.

31CONTENTS
Annual Reserve Payment 2014 – 2018
$ Million
2017201620152014
100
80
60
40
20
0
51.456.5
31.4
39.8
MARKET PERFORMANCE: Ancillary Markets
Reserve payment doubles in 2018
Reserves serve as a backup in the electricity market for unexpected outages caused by generators tripping. The amount of reserves required is determined by the amount needed should the largest on-line generator trip. In the NEMS, two reserve products are traded: primary and contingency reserves. Each reserve has its own price and response time, the latter being nine seconds for primary reserve and 10 minutes for contingency reserve. The generators bear the cost of procuring the reserves.
Compared to 2017, reserve costs increased 107.8 percent to $82.7 million. This was the result of higher reserve prices for both reserve classes. Primary reserve price rose 103.4 percent to $0.38/MWh and contingency reserve price increased 116.6 percent to $14.60/MWh.
2018
82.7

32 CONTENTS
Monthly Primary Reserve Price, Requirement and Supply 2018
Offer capacity at and above $1/MWhRequirement
Offer capacity below $1/MWhPrice
MW $/MWh 600 2.4
500 2.0
400 1.6
300 1.2
200 0.8
100 0.4
0 0.0May Oct DecApr Sep NovMar AugFeb JulJan Jun
MARKET PERFORMANCE: Ancillary Markets
Less reserve offers and occurrences of intertie disconnections push primary reserve prices up
The annual average primary reserve price was 103.4 percent higher at $0.38/MWh in 2018. The highest monthly primary reserve price was seen in September at $1.61/MWh while the lowest monthly average was observed in January at $0.06/MWh.
The annual average primary reserve requirement remained at 179MW in 2018. The annual primary reserve offers were lower by 3.4 percent at 480MW.
There were 132 periods of intertie disconnections in 2018 compared to 145 in 2017. Despite lesser intertie disconnection periods, primary reserve prices averaged $31.85/MWh which was significantly higher than the $9.48/MWh in 2017 due to tight supply conditions. In 2018, there were four periods of primary reserve shortfalls ranging between 9MW to 70MW.
On a monthly basis, the primary reserve requirement ranged between 164MW to 192MW in 2018, with the lowest level seen in November and the highest in May. The monthly primary reserve offers were lowest in April and highest in November.
The month of September saw the highest primary reserve price. Following the tripping of intertie connections between Singapore and Malaysia on 18 September, Singapore’s power system was in isolated mode. More primary reserve requirements were needed arising from this, which resulted in higher primary reserve prices. The primary reserve price that day averaged $46.41/MWh and the highest periodic price was registered in Period 5 at $1,950.58/MWh.
The month of February also saw higher primary reserve prices when intertie disconnections occurred from Periods 24 to 26 on 27 February, resulting in an average primary reserve price of $17.87/MWh that day. The high prices on these two days skewed prices up in 2018.
There were no changes to the Risk Adjustment Factor (RAF)9 in 2018. It was set at 1.0 for primary reserve.
9 There is an RAF for each class of reserve in the NEMS. The RAF is multiplied by the raw reserve requirement to arrive at the final reserve requirement that is cleared by the market clearing engine (MCE). The PSO may amend the RAF for any reserve class temporarily if it foresees power system conditions that may warrant a higher reserve requirement than usual.

33CONTENTS
Monthly Contingency Reserve Price, Requirement and Supply 2018
Offer capacity at and above $5/MWhRequirement
Offer capacity below $5/MWhPrice
MW $/MWh
May Oct DecApr Sep NovMar AugFeb JulJan Jun
16
1,200
12900
20
1,500
8600
4300
1,800 28
24
0 0
MARKET PERFORMANCE: Ancillary Markets
Contingency reserve price surges on lower supply
The annual average contingency reserve price rose 116.6 percent to $14.60/MWh in 2018. The highest monthly contingency reserve price was observed in October at $26.15/MWh while the lowest was registered in January at $6.91/MWh.
The annual average contingency reserve requirement rose 1.7 percent in 2018 to 598MW. The annual average contingency reserve offers fell 4.3 percent to 1,257MW in 2018.
At the monthly level, the lowest contingency reserve requirement was observed in November at 576MW and the peak contingency reserve requirement was observed in May at 611MW. The monthly contingency reserve offers were highest at 1,361MW in January and lowest at 1,159MW in May.
The highest daily average contingency reserve price was registered on 18 September at $116.09/MWh. That day, there were 17 periods of contingency reserve violations when Stepwise Constraint Violation Penalty (CVP) kicked in, resulting in contingency reserve shortfalls.
There were more days in October that recorded contingency reserve shortfalls due to CVP compared to the other months in 2018. On 1, 2, 3 and 4 October, the daily average contingency reserve price was $92.33/MWh, $99.39/MWh, $94.41/MWh and $103.78/MWh respectively which resulted in the highest monthly contingency reserve price for the year.
There were no changes to the RAF in 2018 and it was set at 1.5 for contingency reserve.
34 CONTENTS
Reserve Provider Group Effectiveness for Primary and Secondary Reserve Classes (Aggregate) 2014 – 2018
A B C D E
Statistics exclude IL providers.
MARKET PERFORMANCE: Ancillary Markets
Reserve provider group effectiveness improves slightly
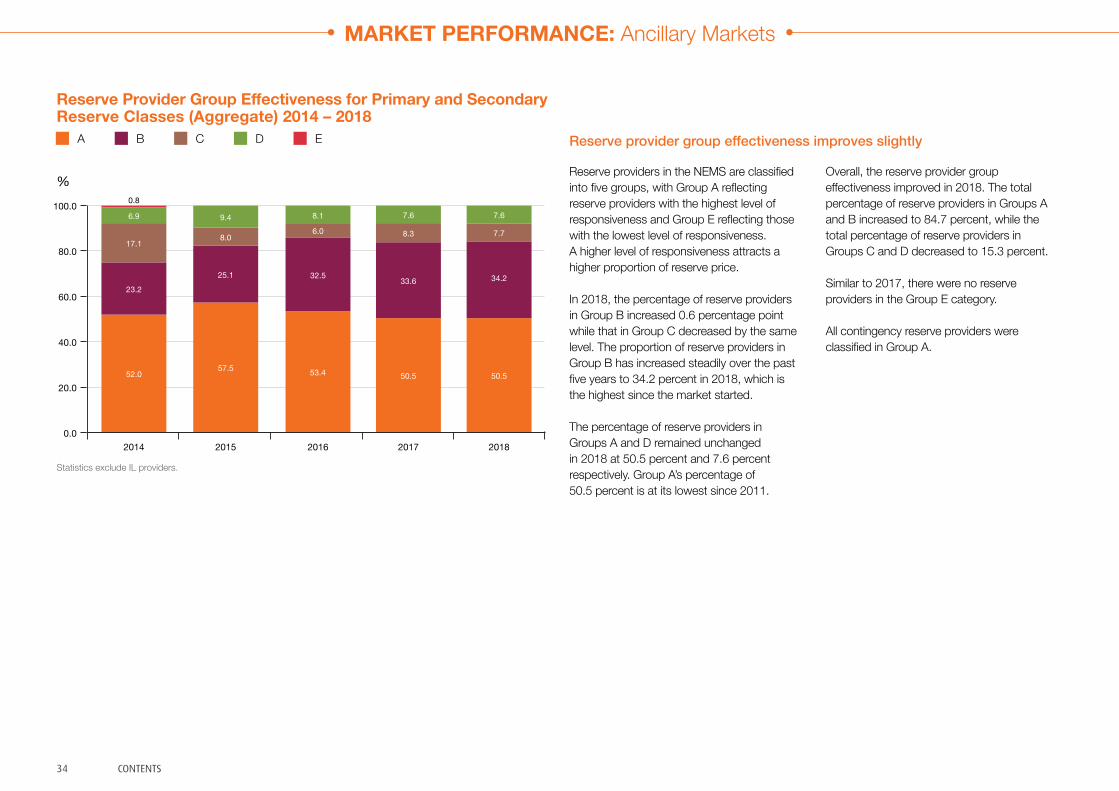
Reserve providers in the NEMS are classified into five groups, with Group A reflecting reserve providers with the highest level of responsiveness and Group E reflecting those with the lowest level of responsiveness. A higher level of responsiveness attracts a higher proportion of reserve price.
In 2018, the percentage of reserve providers in Group B increased 0.6 percentage point while that in Group C decreased by the same level. The proportion of reserve providers in Group B has increased steadily over the past five years to 34.2 percent in 2018, which is the highest since the market started.
The percentage of reserve providers in Groups A and D remained unchanged in 2018 at 50.5 percent and 7.6 percent respectively. Group A’s percentage of 50.5 percent is at its lowest since 2011.
Overall, the reserve provider group effectiveness improved in 2018. The total percentage of reserve providers in Groups A and B increased to 84.7 percent, while the total percentage of reserve providers in Groups C and D decreased to 15.3 percent.
Similar to 2017, there were no reserve providers in the Group E category.
All contingency reserve providers were classified in Group A.
100.0
80.0
60.0
40.0
20.0
0.0
%
2017201620152014
6.9 9.4 8.1 7.6
6.0 8.3
32.5 33.6
53.4 50.5
17.18.0
23.2
25.1
52.057.5
0.8
2018
7.6
7.7
34.2
50.5
35CONTENTS
2017201620152014
MARKET PERFORMANCE: Ancillary Markets
Annual Forced Outages by Generation Companies 2014 – 2018
Keppel Merlimau Cogen Sembcorp Cogen YTL PowerSerayaSenoko Energy Incineration PlantsTuas Power Generation
PacificLight Power TP UtilitiesTuaspringEmbedded Generators*
Generation units subject to failure probability
The number of generation units refers to the number of generation units registered in the NEMS which are subject to reserve responsibility share.*Embedded generators exclude TP Utilities
Total number of forced outages at lowest level since market started
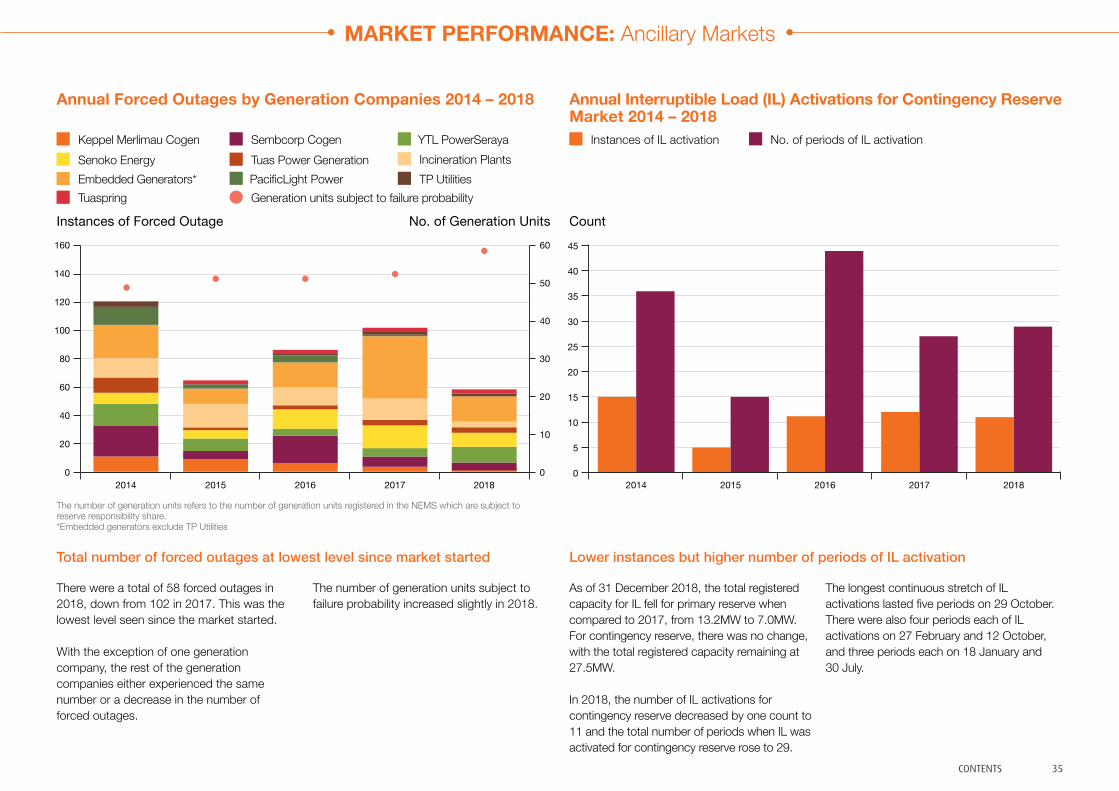
There were a total of 58 forced outages in 2018, down from 102 in 2017. This was the lowest level seen since the market started.
With the exception of one generation company, the rest of the generation companies either experienced the same number or a decrease in the number of forced outages.
The number of generation units subject to failure probability increased slightly in 2018.
Annual Interruptible Load (IL) Activations for Contingency Reserve Market 2014 – 2018
Instances of IL activation No. of periods of IL activation
Count45
40
35
30
25
15
5
20
10
0
Lower instances but higher number of periods of IL activation
As of 31 December 2018, the total registered capacity for IL fell for primary reserve when compared to 2017, from 13.2MW to 7.0MW. For contingency reserve, there was no change, with the total registered capacity remaining at 27.5MW.
In 2018, the number of IL activations for contingency reserve decreased by one count to 11 and the total number of periods when IL was activated for contingency reserve rose to 29.
The longest continuous stretch of IL activations lasted five periods on 29 October. There were also four periods each of IL activations on 27 February and 12 October, and three periods each on 18 January and 30 July.
160 60
14050
120
40100
3080
2060
10
40
20
0 0
Instances of Forced Outage No. of Generation Units
2017201620152014 2018 2018
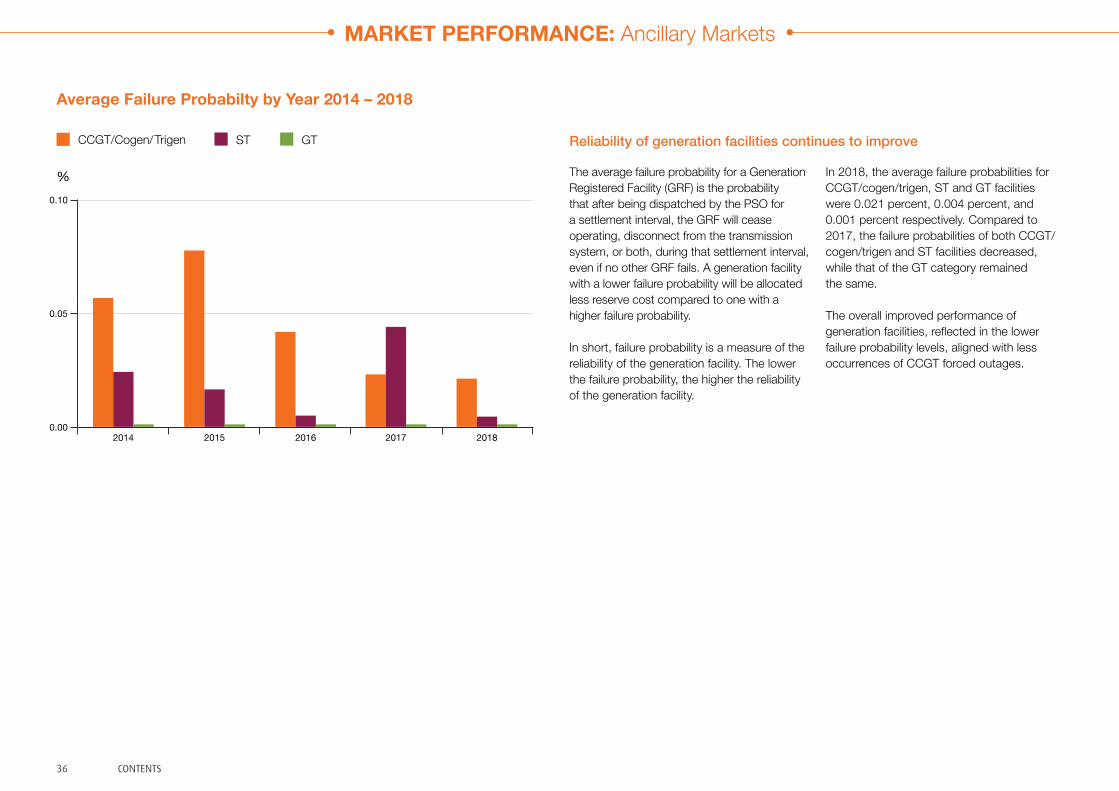
36 CONTENTS
Average Failure Probabilty by Year 2014 – 2018
MARKET PERFORMANCE: Ancillary Markets
ST GTCCGT/Cogen/Trigen Reliability of generation facilities continues to improve
The average failure probability for a Generation Registered Facility (GRF) is the probability that after being dispatched by the PSO for a settlement interval, the GRF will cease operating, disconnect from the transmission system, or both, during that settlement interval, even if no other GRF fails. A generation facility with a lower failure probability will be allocated less reserve cost compared to one with a higher failure probability.
In short, failure probability is a measure of the reliability of the generation facility. The lower the failure probability, the higher the reliability of the generation facility.
In 2018, the average failure probabilities for CCGT/cogen/trigen, ST and GT facilities were 0.021 percent, 0.004 percent, and 0.001 percent respectively. Compared to 2017, the failure probabilities of both CCGT/cogen/trigen and ST facilities decreased, while that of the GT category remained the same.
The overall improved performance of generation facilities, reflected in the lower failure probability levels, aligned with less occurrences of CCGT forced outages.
0.10
%
2017201620152014
0.05
0.002018

37CONTENTS
MARKET PERFORMANCE: Ancillary Markets
Annual Regulation Payment 2014 – 2018 Monthly Regulation Price, Requirement and Supply 2018
PriceOffer capacity below $10/MWh Offer capacity at and above $10/MWh
Requirement
$ Million MW $/MWh40
30
20
10
02017201620152014
200 40
150 30
100 20
50 10
250 50
0 0May Oct DecApr Sep NovMar AugFeb JulJan Jun
Regulation payment rises for the second consecutive year More volatility in regulation prices
With the increase in regulation requirement from 111MW to 119MW from 1 February 2018, as well as the regulation price increase of 80.9 percent to $20.76/MWh, regulation payment rose 93.6 percent to $24.2 million.
In 2018, the annual average regulation price rose 80.9 percent to $20.76/MWh compared to 2017’s $11.48/MWh.
Regulation prices were more volatile in 2018. In 2017, the minimum monthly regulation price was $7.86/MWh in January and the maximum was $14.44/MWh in December – a spread of $6.58/MWh.
In 2018, this spread widened to $25.24/MWh with the minimum price in January at $11.96/MWh and the maximum price in October at $37.20/MWh.
The regulation payment increased for all months in the year, crossing the $1.0 million level every month. The highest regulation payment was $3.7 million in October while the lowest was $1.1 million in January.
The standard deviation increased from $2.28/MWh in 2017 to $6.59/MWh in 2018. Coupled with the higher regulation requirement, the annual regulation price was higher in 2018 and on all months compared to 2017.
2018
32.5
22.0
9.1
12.5
24.2
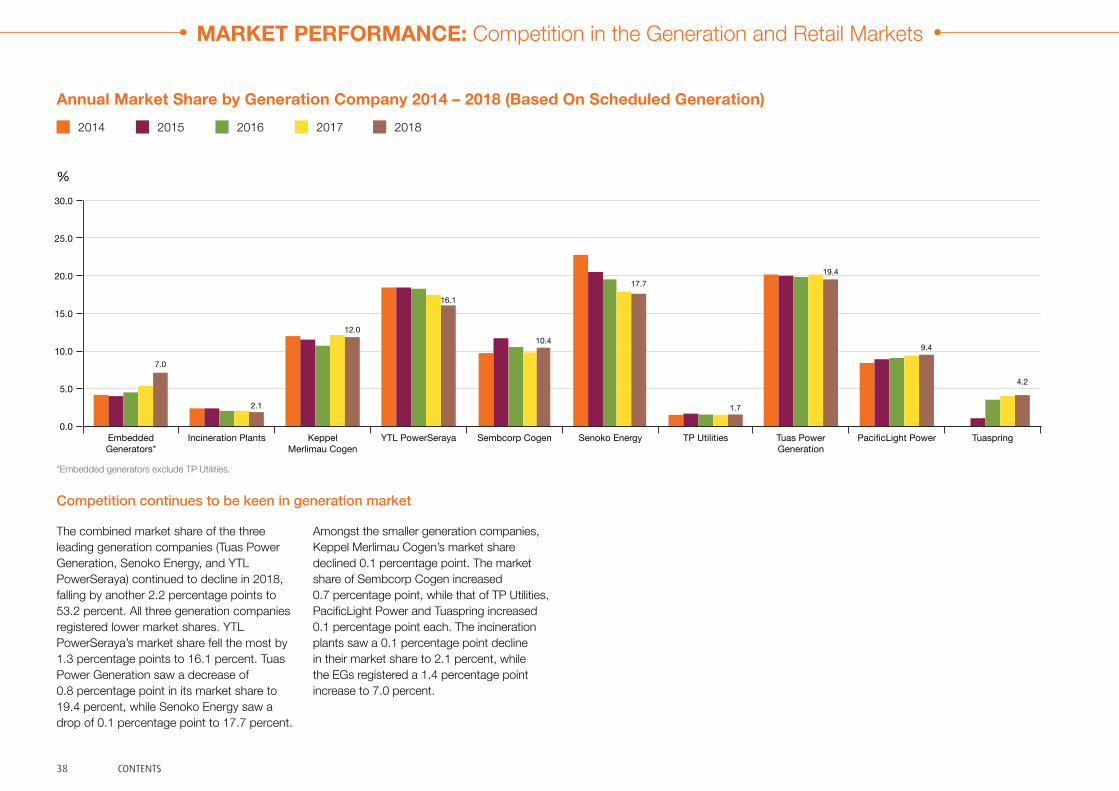
38 CONTENTS
1.72.1
Annual Market Share by Generation Company 2014 – 2018 (Based On Scheduled Generation)2014 2015 2016 2017 2018
*Embedded generators exclude TP Utilities.
30.0
25.0
20.0
15.0
10.0
5.0
0.0
%
Embedded Generators*
Incineration Plants YTL PowerSeraya Sembcorp Cogen Senoko Energy TP Utilities PacificLight Power TuaspringTuas PowerGeneration
Keppel Merlimau Cogen
MARKET PERFORMANCE: Competition in the Generation and Retail Markets
Competition continues to be keen in generation market
The combined market share of the three leading generation companies (Tuas Power Generation, Senoko Energy, and YTL PowerSeraya) continued to decline in 2018, falling by another 2.2 percentage points to 53.2 percent. All three generation companies registered lower market shares. YTL PowerSeraya’s market share fell the most by 1.3 percentage points to 16.1 percent. Tuas Power Generation saw a decrease of 0.8 percentage point in its market share to 19.4 percent, while Senoko Energy saw a drop of 0.1 percentage point to 17.7 percent.
Amongst the smaller generation companies, Keppel Merlimau Cogen’s market share declined 0.1 percentage point. The market share of Sembcorp Cogen increased 0.7 percentage point, while that of TP Utilities, PacificLight Power and Tuaspring increased 0.1 percentage point each. The incineration plants saw a 0.1 percentage point decline in their market share to 2.1 percent, while the EGs registered a 1.4 percentage point increase to 7.0 percent.
7.0
12.010.4
16.1
17.719.4
9.4
4.2
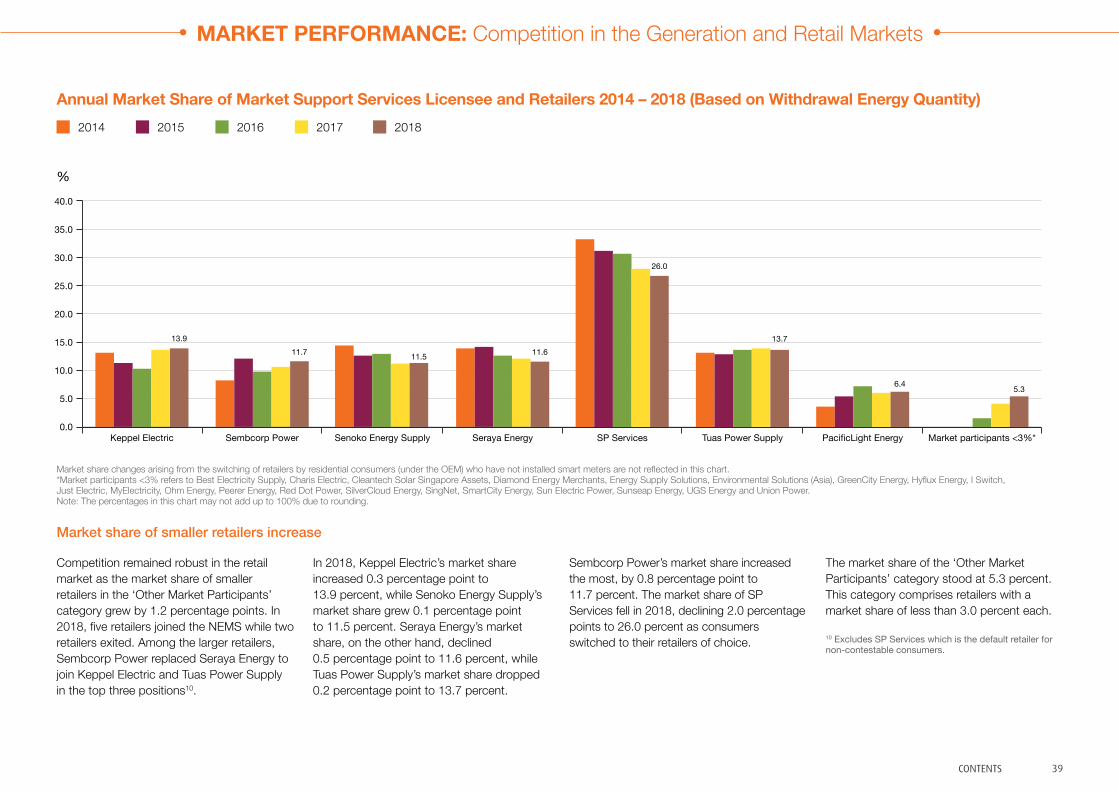
39CONTENTS
2014 2015 2016 2017 2018
Annual Market Share of Market Support Services Licensee and Retailers 2014 – 2018 (Based on Withdrawal Energy Quantity)
Market share changes arising from the switching of retailers by residential consumers (under the OEM) who have not installed smart meters are not reflected in this chart.*Market participants <3% refers to Best Electricity Supply, Charis Electric, Cleantech Solar Singapore Assets, Diamond Energy Merchants, Energy Supply Solutions, Environmental Solutions (Asia), GreenCity Energy, Hyflux Energy, I Switch, Just Electric, MyElectricity, Ohm Energy, Peerer Energy, Red Dot Power, SilverCloud Energy, SingNet, SmartCity Energy, Sun Electric Power, Sunseap Energy, UGS Energy and Union Power.Note: The percentages in this chart may not add up to 100% due to rounding.
40.0
35.0
30.0
25.0
20.0
15.0
10.0
5.0
0.0
%
Market share of smaller retailers increase
Competition remained robust in the retail market as the market share of smaller retailers in the ‘Other Market Participants’ category grew by 1.2 percentage points. In 2018, five retailers joined the NEMS while two retailers exited. Among the larger retailers, Sembcorp Power replaced Seraya Energy to join Keppel Electric and Tuas Power Supply in the top three positions10.
In 2018, Keppel Electric’s market share increased 0.3 percentage point to 13.9 percent, while Senoko Energy Supply’s market share grew 0.1 percentage point to 11.5 percent. Seraya Energy’s market share, on the other hand, declined 0.5 percentage point to 11.6 percent, while Tuas Power Supply’s market share dropped 0.2 percentage point to 13.7 percent.
Sembcorp Power’s market share increased the most, by 0.8 percentage point to 11.7 percent. The market share of SP Services fell in 2018, declining 2.0 percentage points to 26.0 percent as consumers switched to their retailers of choice.
The market share of the ‘Other Market Participants’ category stood at 5.3 percent. This category comprises retailers with a market share of less than 3.0 percent each.
10 Excludes SP Services which is the default retailer for non-contestable consumers.
Keppel Electric
13.9
Senoko Energy Supply
11.5
Seraya Energy
11.6
Sembcorp Power
11.7
SP Services
26.0
Tuas Power Supply
13.7
PacificLight Energy
6.4 5.3
MARKET PERFORMANCE: Competition in the Generation and Retail Markets
Market participants <3%*

40 CONTENTS
MARKET PERFORMANCE: Settlement, Prudential Management, and Automatic Financial Penalty Scheme
Energy Market Company (EMC) is the financial clearing house for the wholesale market and settles the following transactions: • energy;• ancillary market products – two classes
of reserve (primary and contingency) and regulation;
• bilateral and vesting contracts;• uplift charges;• financial adjustments;• fee recovery of EMC and the PSO
administration costs; and• contracted ancillary services not provided
through the ancillary market (black-start services).
The market is well-secured. To cover the exposure of a debtor and the time required to manage a default, all retailers must provide on-going collateral to EMC. This credit support protects EMC and other MPs from payment defaults. EMC reviews the risk exposure of MPs on a daily basis.
Margin Calls and Notices of Default – 1 January to 31 December 2018
A margin call is issued when a retailer’s estimated net exposure reaches a value that is equivalent to or greater than 70.0 percent of the level of its credit support. In 2018, EMC issued a total of 161 margin calls which is a record high since the market started.
A notice of default is issued when an MP is unable to remit to the EMC settlement clearing account by the end of the business day following the MP payment date. In 2018, EMC issued 24 notices of defaults, of which 17 led to the issue of a First Default Levy Notice and the settlement amounts were made good by drawing from the defaulting MPs’ credit support.
Automatic Financial Penalty Scheme (AFPS) – 1 January to 31 December 2018 The AFPS is a penalty scheme applied to all GRFs that deviate from their dispatch schedules by more than 10MW. It was implemented in November 2015, in an effort to incentivise GRFs to comply with dispatch instructions. In 2018, there were 63 periods when the AFPS kicked in, and the total penalty collected was $401,146.29. The penalty collected was returned to the market via the monthly energy uplift charges.
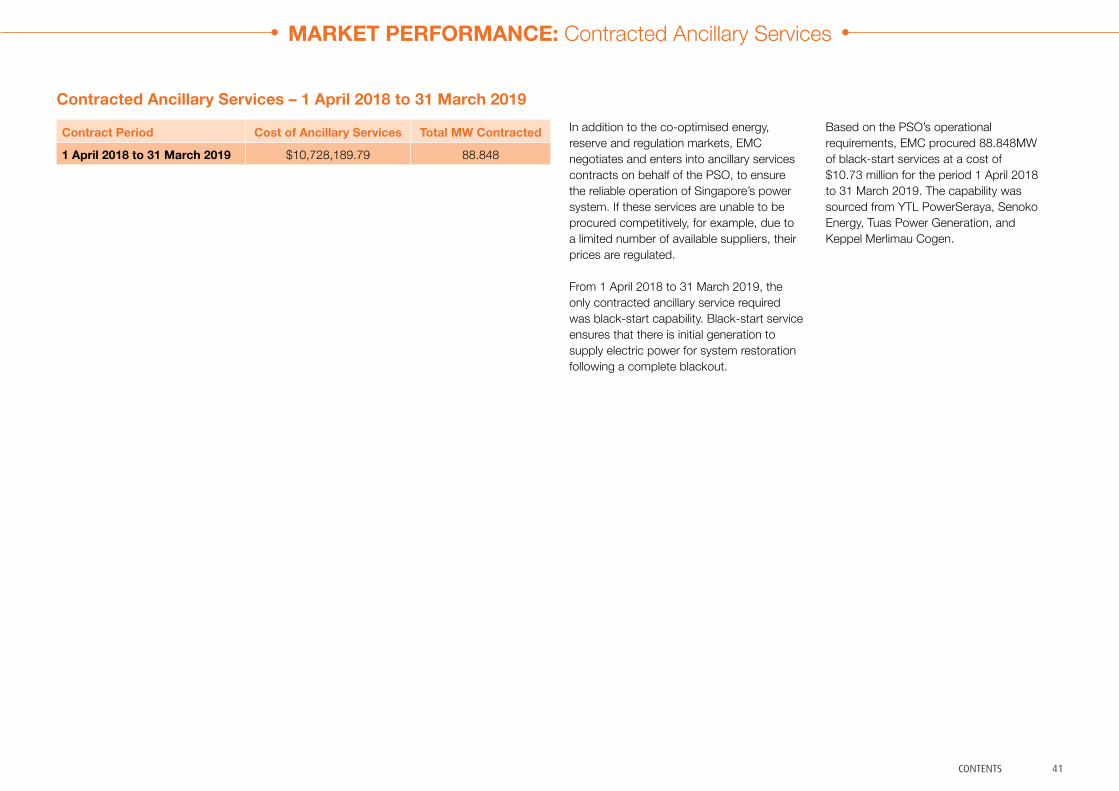
41CONTENTS
Contracted Ancillary Services – 1 April 2018 to 31 March 2019In addition to the co-optimised energy, reserve and regulation markets, EMC negotiates and enters into ancillary services contracts on behalf of the PSO, to ensure the reliable operation of Singapore’s power system. If these services are unable to be procured competitively, for example, due to a limited number of available suppliers, their prices are regulated.
From 1 April 2018 to 31 March 2019, the only contracted ancillary service required was black-start capability. Black-start service ensures that there is initial generation to supply electric power for system restoration following a complete blackout.
Based on the PSO’s operational requirements, EMC procured 88.848MW of black-start services at a cost of $10.73 million for the period 1 April 2018 to 31 March 2019. The capability was sourced from YTL PowerSeraya, Senoko Energy, Tuas Power Generation, and Keppel Merlimau Cogen.
Contract Period Cost of Ancillary Services Total MW Contracted
1 April 2018 to 31 March 2019 $10,728,189.79 88.848
MARKET PERFORMANCE: Contracted Ancillary Services
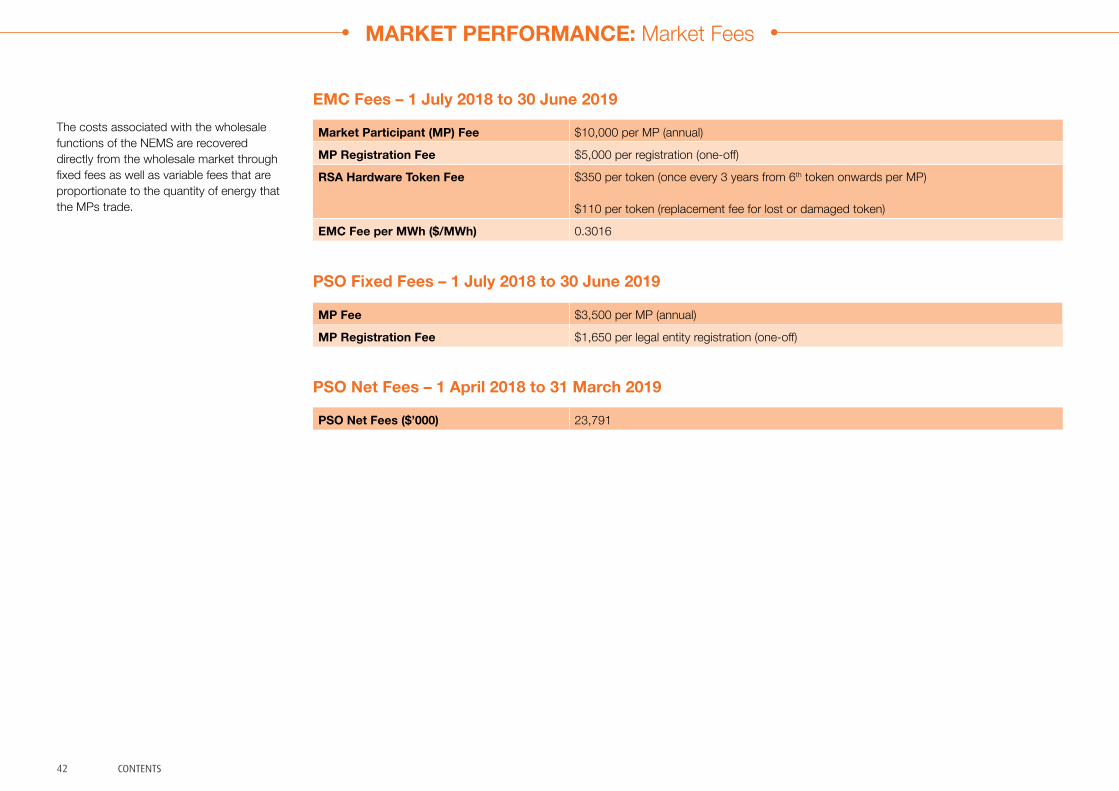
42 CONTENTS
MP Fee $3,500 per MP (annual)
MP Registration Fee $1,650 per legal entity registration (one-off)
PSO Net Fees ($’000) 23,791
EMC Fees – 1 July 2018 to 30 June 2019
PSO Fixed Fees – 1 July 2018 to 30 June 2019
PSO Net Fees – 1 April 2018 to 31 March 2019
The costs associated with the wholesale functions of the NEMS are recovered directly from the wholesale market through fixed fees as well as variable fees that are proportionate to the quantity of energy that the MPs trade.
Market Participant (MP) Fee $10,000 per MP (annual)
MP Registration Fee $5,000 per registration (one-off)
RSA Hardware Token Fee $350 per token (once every 3 years from 6th token onwards per MP)
$110 per token (replacement fee for lost or damaged token)
EMC Fee per MWh ($/MWh) 0.3016
MARKET PERFORMANCE: Market Fees

ADDITIONALINFORMATION
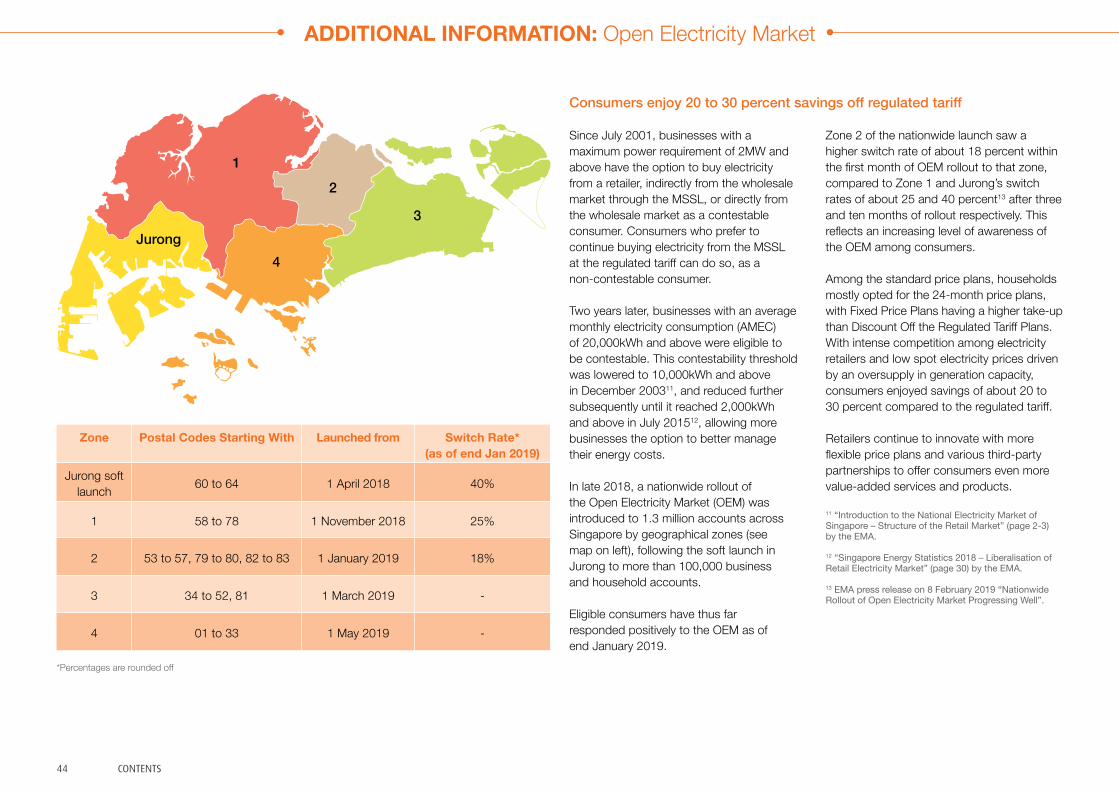
44 CONTENTS
ADDITIONAL INFORMATION: Open Electricity Market
Zone Postal Codes Starting With Launched from Switch Rate* (as of end Jan 2019)
Jurong soft launch 60 to 64 1 April 2018 40%
1 58 to 78 1 November 2018 25%
2 53 to 57, 79 to 80, 82 to 83 1 January 2019 18%
3 34 to 52, 81 1 March 2019 -
4 01 to 33 1 May 2019 -
Since July 2001, businesses with a maximum power requirement of 2MW and above have the option to buy electricity from a retailer, indirectly from the wholesale market through the MSSL, or directly from the wholesale market as a contestable consumer. Consumers who prefer to continue buying electricity from the MSSL at the regulated tariff can do so, as a non-contestable consumer. Two years later, businesses with an average monthly electricity consumption (AMEC) of 20,000kWh and above were eligible to be contestable. This contestability threshold was lowered to 10,000kWh and above in December 200311, and reduced further subsequently until it reached 2,000kWh and above in July 201512, allowing more businesses the option to better manage their energy costs. In late 2018, a nationwide rollout of the Open Electricity Market (OEM) was introduced to 1.3 million accounts across Singapore by geographical zones (see map on left), following the soft launch in Jurong to more than 100,000 business and household accounts. Eligible consumers have thus far responded positively to the OEM as of end January 2019.
Zone 2 of the nationwide launch saw a higher switch rate of about 18 percent within the first month of OEM rollout to that zone, compared to Zone 1 and Jurong’s switch rates of about 25 and 40 percent13 after three and ten months of rollout respectively. This reflects an increasing level of awareness of the OEM among consumers. Among the standard price plans, households mostly opted for the 24-month price plans, with Fixed Price Plans having a higher take-up than Discount Off the Regulated Tariff Plans. With intense competition among electricity retailers and low spot electricity prices driven by an oversupply in generation capacity, consumers enjoyed savings of about 20 to 30 percent compared to the regulated tariff. Retailers continue to innovate with more flexible price plans and various third-party partnerships to offer consumers even more value-added services and products.
Consumers enjoy 20 to 30 percent savings off regulated tariff
11 “Introduction to the National Electricity Market of Singapore – Structure of the Retail Market” (page 2-3) by the EMA.
12 “Singapore Energy Statistics 2018 – Liberalisation of Retail Electricity Market” (page 30) by the EMA.
13 EMA press release on 8 February 2019 “Nationwide Rollout of Open Electricity Market Progressing Well”.
*Percentages are rounded off
1
2
3
4Jurong
45CONTENTS
ancillary servicesThe additional services necessary to ensure the security and reliability of the power system. The ancillary services traded competitively on the wholesale market are regulation and the two classes of reserves (primary and contingency). The black-start ancillary service is contracted by Energy Market Company (EMC) on behalf of the Power System Operator (PSO) on an annual basis.
balance vesting price (BVP)This refers to the price for the balance vesting quantity allocated.
balance vesting quantity With the start of the Liquefied Natural Gas (LNG) Vesting Scheme in the third quarter of 2013, a certain percentage of the total allocated vesting quantity is pegged to LNG. The remaining percentage pegged to piped natural gas is known as balance vesting quantity.
black-start ancillary serviceA service to ensure that there is initial generation for system restoration following a complete blackout.
co-optimisationThe process used by the market clearing engine (MCE) to ensure that the most inexpensive mix of energy, reserves, and regulation is purchased from the market to meet electricity demand in each dispatch period.
demand response (DR)DR enables contestable consumers to reduce their electricity demand voluntarily in response to market conditions, particularly during periods of high wholesale market prices or when system reliability is adversely affected.
dispatch scheduleA schedule produced by the MCE every half-hour that is the basis for the supply and consumption of energy, and the supply of reserve and regulation in the market.
embedded generators (EG)Generation units that generate electricity to their onsite load principally for self consumption.
energyThe flow of electricity.
gigawatt (GW)A measure of electrical power equivalent to one thousand megawatts. Gigawatt hour (GWh) represents the number of gigawatts produced or consumed in an hour.
intermittent generation sources (IGS)Sources of energy whose output depends on environmental factors and weather conditions, such as solar and wind energy. While there are IGS facilities connected to the grid in Singapore, IGS are not scheduled for dispatch by the PSO in the wholesale market because the power output cannot be controlled or varied at will.
interruptible load (IL)A contestable consumer of electricity that participates in the wholesale market and allows its supply of electricity to be interrupted in the event of a system disturbance in exchange for reserve payment. The activation of interruptible loads is by the PSO.
licensed capacityCapacity of a facility licensed by the Energy Market Authority (EMA).
lng vesting price (LVP)The price for the LNG vesting quantity allocated.
lng vesting quantityWith the start of the LNG Vesting Scheme in the third quarter of 2013, a certain percentage of the total allocated vesting quantity is pegged to LNG. This is known as the LNG vesting quantity.
loadThe consumption of electricity.
market clearing engine (MCE)The linear programme computer application used to calculate the spot market quantities and prices.
market participant (MP)A person who has an electricity licence issued by the EMA and has been registered with EMC as a market participant to trade in the wholesale electricity market.
megawatt (MW)A measure of electrical power equivalent to one million watts. Megawatt hour (MWh) represents the number of megawatts produced or consumed in an hour.
metered demand The electricity consumption which is proxied by the withdrawal energy quantity (WEQ).
nodal pricingA market structure in which prices are calculated at specific locations, or nodes, in the power system to reflect the demand and supply characteristics of each location, taking into consideration transmission losses and congestion. Nodal pricing is also commonly referred to as locational marginal pricing. In the settlements reports, this is termed as the market energy price (MEP).
open electricity market (OEM)An initiative by the EMA to enable all business consumers and households to buy electricity from a retailer of their choice at a price plan that best meets their needs, or remain on the regulated tariff rate.
ADDITIONAL INFORMATION: Glossary
46 CONTENTS
registered capacityThis denotes the capacity of a facility registered with the National Electricity Market of Singapore (NEMS). Registered capacity may differ from licensed capacity.
regulationGeneration that is on standby to fine-tune or correct frequency variations or imbalances between demand and supply in the power system.
reserveStand-by generation capacity or interruptible load that can be drawn upon when there is an unforeseen disruption of supply.
retail marketThe transactions made between retail companies and end consumers.
supply cushionThe supply cushion measures the percentage of total supply available after matching off demand.
terawatt (TW)A measure of electrical power equivalent to one million megawatts. Terawatt hour (TWh) represents the number of terawatts produced or consumed in an hour.
uniform singapore energy price (USEP)The USEP is the weighted-average of the nodal prices at all off-take nodes.
vesting contractA vesting contract is a regulatory instrument imposed on some generators by the EMA, with the objective of mitigating the potential exercise of market power when the supply side of the industry is concentrated among a small number of generators. A vesting contract requires these generators to sell a specified quantity of electricity (vesting contract level) at a specified price (vesting contract hedge price).
vesting contract hedge price (VCHP)The VCHP is calculated by the MSSL, SP Services, every three months. It is determined using the long-run marginal cost of the most efficient generation technology in the Singapore power system, i.e., the combined-cycle gas turbine (CCGT). EMC’s settlement system uses the VCHP to settle the vesting quantity between the MSSL and the generation companies. With the introduction of LNG into the generation mix, the VCHP has been replaced by ‘LNG vesting price’ and ‘balance vesting price’ from July 2013.
withdrawal energy quantity (WEQ) Withdrawal energy quantity (in MWh) refers to the amount of electricity withdrawn by load facilities. It is provided by the MSSL, SP Services.
wholesale marketThe transactions made between generation companies and retail companies.
ADDITIONAL INFORMATION: Glossary
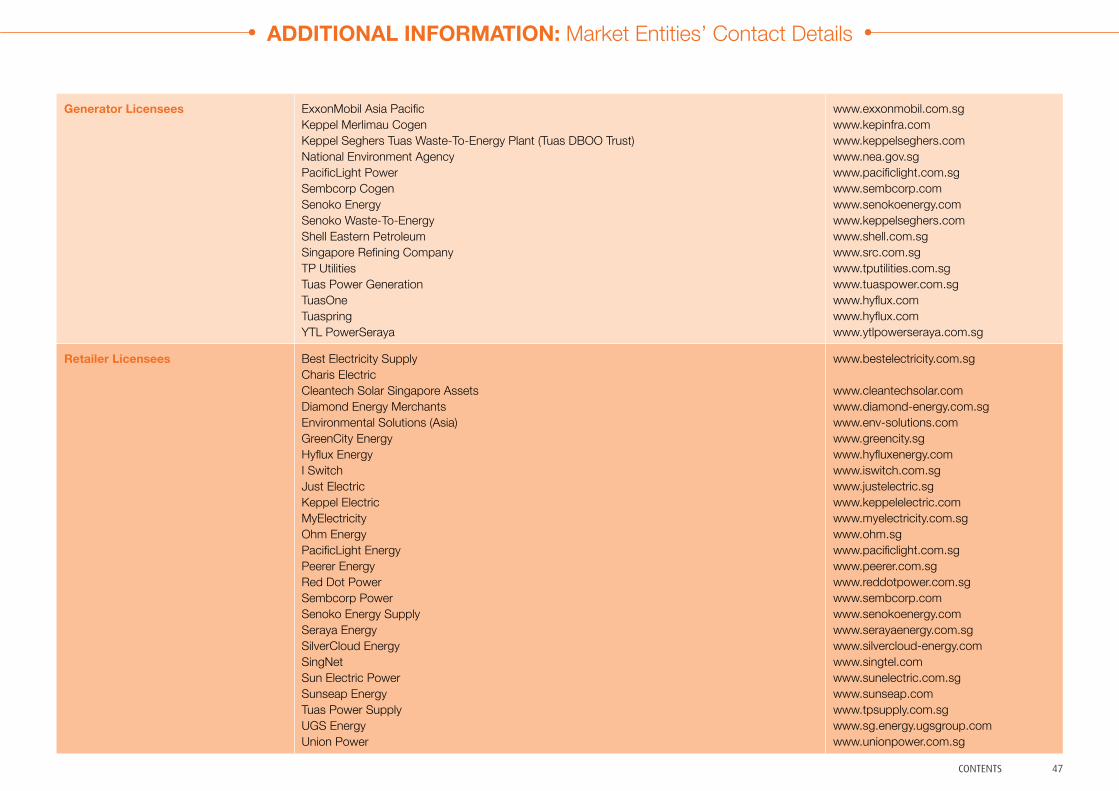
47CONTENTS
Generator Licensees ExxonMobil Asia PacificKeppel Merlimau CogenKeppel Seghers Tuas Waste-To-Energy Plant (Tuas DBOO Trust)National Environment Agency PacificLight PowerSembcorp CogenSenoko EnergySenoko Waste-To-Energy Shell Eastern PetroleumSingapore Refining Company TP UtilitiesTuas Power GenerationTuasOne TuaspringYTL PowerSeraya
www.exxonmobil.com.sgwww.kepinfra.comwww.keppelseghers.com www.nea.gov.sgwww.pacificlight.com.sgwww.sembcorp.comwww.senokoenergy.comwww.keppelseghers.com www.shell.com.sg www.src.com.sg www.tputilities.com.sg www.tuaspower.com.sgwww.hyflux.com www.hyflux.com www.ytlpowerseraya.com.sg
Retailer Licensees Best Electricity SupplyCharis ElectricCleantech Solar Singapore AssetsDiamond Energy MerchantsEnvironmental Solutions (Asia)GreenCity Energy Hyflux EnergyI SwitchJust ElectricKeppel ElectricMyElectricity Ohm EnergyPacificLight EnergyPeerer Energy Red Dot PowerSembcorp PowerSenoko Energy SupplySeraya EnergySilverCloud EnergySingNet Sun Electric PowerSunseap EnergyTuas Power SupplyUGS Energy Union Power
www.bestelectricity.com.sg
www.cleantechsolar.com www.diamond-energy.com.sg www.env-solutions.com www.greencity.sg www.hyfluxenergy.comwww.iswitch.com.sg www.justelectric.sg www.keppelelectric.com www.myelectricity.com.sg www.ohm.sg www.pacificlight.com.sg www.peerer.com.sg www.reddotpower.com.sgwww.sembcorp.comwww.senokoenergy.com www.serayaenergy.com.sgwww.silvercloud-energy.com www.singtel.com www.sunelectric.com.sg www.sunseap.com www.tpsupply.com.sgwww.sg.energy.ugsgroup.comwww.unionpower.com.sg
ADDITIONAL INFORMATION: Market Entities’ Contact Details

48 CONTENTS
Wholesale Market Traders Air Liquide SingaporeCGNPC Solar-Biofuel Power (Singapore)Changi Mega Solar Diamond Energy ManagersGreen Power AsiaLYS Genco BetaMSD International GmbH (Singapore Branch)Public Utilities BoardSembcorp Solar SingaporeSingapore District CoolingSingapore LNG CorporationSun Electric Energy AssetsSunseap LeasingSunseap Leasing Beta
https://industry.airliquide.sgwww.cgnpc.com.cnwww.sembcorp.com www.diamond-energy.com.sgwww.greenpowerasia.comwww.lysenergy.com www.msd-singapore.comwww.pub.gov.sg www.sembcorp.com www.spgroup.com.sgwww.slng.com.sg www.sunelectric.com.sgwww.sunseap.com www.sunseap.com
Market Support Services Licensee (MSSL) SP Services www.spgroup.com.sg
Market Operator Energy Market Company www.emcsg.com
Power System Operator (PSO) Power System Operator www.ema.gov.sg
Transmission Licensee SP PowerAssets www.spgroup.com.sg
ADDITIONAL INFORMATION: Market Entities’ Contact Details

Important Notice
© 2019 Energy Market Company Pte Ltd. All rights reserved.
Unless authorised by law, no part of this publication may be reproduced or distributed without prior permission from Energy Market Company Pte Ltd (EMC).
This publication is meant only for general information and nothing in it may be construed as advice. Whilst EMC has taken reasonable care in the preparation of this publication, EMC does not warrant its suitability for any purpose. You should always consult your professional advisers before making any decision.
If you have any specific queries about this publication, you can write to [email protected].

A member of Singapore Exchange group of companies. Co. Reg. No. 200101336E
Energy Market Company Pte Ltd4 Shenton Way#03-01 SGX Centre 2 Singapore 068807T: +65 6779 3000 | F: +65 6779 3030
www.emcsg.com