Embed Size (px)
Citation preview

Electronic copy available at: http://ssrn.com/abstract=1556532
Market Reaction to Corporate Press Releases
Andreas Neuhierl∗
Northwestern University
Anna Scherbina†
UC Davis
Bernd Schlusche‡
Federal Reserve Board
This version: October 31, 2011
ABSTRACT
We classify a unique and comprehensive dataset of corporate press releases into topicsand study the market reaction to various types of news. While confirming prior find-ings regarding strong stock price responses to financial news, we also document signifi-cant reactions to news about corporate strategy, customers and partners, products andservices, management changes, and legal developments. Consistent with regulators’expectations, the level of informational asymmetry in the market declines followingmost types of press releases. At the same time, return volatility frequently increasesin the post-announcement period, which we show can be attributed to higher levels ofvaluation uncertainty.
JEL classification: G01, G10, G14, G30
Keywords: Corporate News, Event Study, Market Efficiency
∗Address: Kellogg Graduate School of Management, Northwestern University, Evanston, IL 60208. E-mail:[email protected].†Address: Graduate School of Management, University of California, Davis, One Shields Avenue, Davis, CA 95616. E-mail:
[email protected]. Phone: (530) 754-8076. Fax: (530) 725-2924.‡Address: Board of Governors of the Federal Reserve System, Washington, DC 20551. E-mail: [email protected].
The views expressed in this paper are those of the authors and not necessarily those of the Board of Governors, other membersof its staff, or the Federal Reserve System.

Electronic copy available at: http://ssrn.com/abstract=1556532
Market Reaction to Corporate Press Releases
ABSTRACT
We classify a unique and comprehensive dataset of corporate press releases into topicsand study the market reaction to various types of news. While confirming prior find-ings regarding strong stock price responses to financial news, we also document signifi-cant reactions to news about corporate strategy, customers and partners, products andservices, management changes, and legal developments. Consistent with regulators’expectations, the level of informational asymmetry in the market declines followingmost types of press releases. At the same time, return volatility frequently increasesin the post-announcement period, which we show can be attributed to higher levels ofvaluation uncertainty.
JEL classification: G01, G10, G14, G30
Keywords: Corporate News, Event Study, Market Efficiency
I. Introduction
On January 9, 2007, Apple Inc. issued a press release, headlined “Apple Reinvents the Phone
with iPhone,” which stated:
“iPhone ... ushers in an era of software power and sophistication never before
seen in a mobile device, which completely redefines what users can do on their
mobile phones.”
It contained a pronouncement from CEO, Steve Jobs, that “... iPhone is a revolutionary and
magical product that is literally five years ahead of any other mobile phone,” and described
the new product’s features. On the day of the announcement, the stock trading volume
increased more than four-fold and remained almost as high on the following day before
dropping by half the day after that. The stock price also rose, and in the period from the
day before to five days after the announcement Apple’s stock earned a cumulative return of
9.31% in excess of the market. Moreover, the stock became much more volatile: In the 10
days following the press release its idiosyncratic volatility increased by 28% relative to the
level in the 10 days prior to the announcement.
Following the adoption of Regulation Fair Disclosure (Reg FD) in October 2000 and of the
Sarbanes-Oxley Act (SOX) in July 2002, corporate press releases became a prevalent method
of communicating new developments to investors. These regulations mandate that publicly
traded companies disclose all private information that may have an impact on their market
values and report changes in their “financial conditions or operations” in a timely fashion
and simultaneously to all market participants. In particular, Reg FD states: “With advances
in information technology, most notably the internet, information can be communicated to
shareholders directly and in real time, without the intervention of an intermediary.”1 Reg FD
further suggests that communicating information via press releases should be the preferred
means of achieving timeliness and non-exclusivity.
Corporate press releases reach investors almost instantaneously via services such as PR
Newswire, BusinessWire, GlobeNewswire, Marketwire, and the like.2 We form our dataset
1The entire document can be found at http://www.sec.gov/rules/final/33-7881.htm.2Firms usually sign up for an account with one of the newswire services, and issue all of their press releases
through that service. Typically, a basic account is free but a fee is charged for each press release. Newswire
1
of corporate press releases issued between April 2006 and August 2009 by combining obser-
vations of official corporate press releases from all major newswire services. We believe that
our dataset contains nearly all press releases that were issued in this time period. We manu-
ally classify these press releases into major news categories and their subcategories based on
content. For example, Apple’s press release mentioned earlier is classified under the major
category Products & Services and the subcategory New Product. After removing the press
release categories for which we have no priors with respect to the expected market impact
(such as announcements about establishing new awards, participation in new employee and
industry initiatives, and the like) and eliminating infrequent news categories with fewer than
30 press release observations, we are left with a total of ten major news categories, further
subdivided into 60 subcategories. We analyze how various types of corporate announcements
affect stock returns, volatility, bid-ask spreads, and trading volume, all of these measures
providing different metrics for the informativeness of news.
The importance of firm-level news should not be assessed solely by its immediate impact
on the stock price but also by its effect on trading volume and the information environment
of the firm. Some announcements may not lead to a large change in the equilibrium price
because they will not substantially move the consensus belief regarding the firm value. How-
ever, as long as they cause individual traders to revise their expectations, the informational
impact of news may be reflected in abnormal trading volume. Moreover, the assumption
that the market will always be able to quickly quantify the impact of news on the firm value
is unrealistic. In particular, when it comes to managerial decisions, this view would fail to
recognize the value of managerial expertise, as it implicitly presumes that investors could
have made these decisions themselves.3 We find that many types of news lead to subsequent
volatility increases as the announcement weakens valuation priors and prices start to react
more strongly to subsequent news signals. Finally, we show that press releases remove the in-
formational advantage of firm insiders, as evidenced by almost universal decreases in bid-ask
spreads in the post-announcement period.
services then post press releases on their own websites and also distribute them, typically free of charge, tolocal and global media outlets, trade magazines, and financial internet sites. Often, firms must pay extra forwider distribution. Newswire services compete on price, the breadth of their distribution network, and thequality of customer service.
3We appreciate this insight from Jack Treynor.
2

This paper contributes to the corporate news event-study literature in four respects. First,
we consistently apply the same event-study design to all types of corporate news (rather than
focusing on one type of event at a time, as was generally done in prior literature) in order
to assess their relative importance to the market in a systematic manner. Moreover, unlike
prior event studies that frequently inferred event dates from newspaper articles, we are able
to tell the exact time when market participants learn the news. Second, owing to the breadth
of our dataset, we are able to include types of corporate news events that have not received
much attention in the literature. Third, even for news categories that have been extensively
studied before, we investigate whether the documented regularities still hold in this more
recent and significantly broader dataset. Fourth, in addition to stock price reactions, we
investigate the patterns of changes in stock volatility, bid-ask spreads, and trading volume
following different types of news, which has not been consistently done in earlier papers. For
the analysis of the post-announcement information environment, an advantage of our dataset
is that it contains news that were delivered by firms directly to investors rather than being
disclosed by information intermediaries, such as the financial media; the latter would likely
distort the post-announcement information environment by including their take on the news
being disclosed in the news article.
The impact of financial news has been extensively studied in prior literature. We confirm
that several previously documented regularities still exist in the most recent data. Moreover,
we find that other types of news are just as important as financial news. In the past, it was
not required to make many such announcements in a timely manner, if at all; this changed
with the adoption of Reg FD, which requires that firms disclose all news that could be
deemed “material” for stock prices.4 We are, therefore, able to show that stock prices react
strongly to non-financial news as well. In particular, the market reacts negatively to news
about customer losses, management terminations, FDA rejections, and product defects. News
releases about new products, patent awards, exiting unsuccessful ventures, new partnerships
formed, legal settlements, management additions, FDA approvals, and successful research
outcomes are all accompanied by significantly positive abnormal returns. Prices also react
4We were told by staff at the SEC that the language of the regulation and the definition of the types ofnews that need to be disclosed are intentionally left vague in order to prevent firms from gaming the system.Hence, firms may disclose a wider range of news than what is considered “material” by investors or regulators.
3

significantly positively to such seemingly uninformative news as reaching a sales milestone
or winning a company award. The underlying reason might be a temporary or a permanent
increase in investor attention (Merton (1987)).5
Ranking the news categories by the magnitude of the price reaction within seven trading
days around the announcement date, the five categories that elicit the most positive signifi-
cant market responses are: (1) pre-announcements of better-than-expected financial results,
(2) announcements of share buybacks, (3) FDA approvals, (4) special dividends, and (5) an
intent to spin off a subsidiary. The five news categories that elicit the most negative sig-
nificant market reactions are: (1) pre-announcements of disappointing financial results, (2)
announcements of FDA rejections, (3) customer losses, (4) product defects, and (5) earnings
restatements.
Investigating post-announcement changes in the information environment, we find that
most stocks experience volatility increases in the post-announcement period. We further
show that we can reject the hypothesis that the volatility increases can be attributed solely to
price shocks that occur on announcement days. Moreover, news that appear to be more non-
routine in nature lead to more prevalent volatility increases. Both of these results indicate
that the informational content of press releases leads to higher valuation uncertainty for
some types of news, which manifests itself in higher volatility levels. Finally, in line with
regulators’ expectations, press releases tend to reduce the informational advantage of firm
insiders, resulting in lower bid-ask spreads.
This paper studies the market reaction to news originating from the primary news source,
i.e., corporations themselves. Another strand of literature that has gained momentum re-
cently focuses on the importance of news media and the internet in disseminating new in-
formation to the market. Many of these studies try to assess whether new information
has a positive or a negative content based on the presence of positive or negative words in
news stories or chat board messages and investigate whether news stories quantified in this
way can predict future returns (e.g., Chan (2003), Antweiler and Frank (2004), and Das
and Chen (2007) for internet message boards; Tetlock (2007) and Dougal, Engelberg, Garcia,
5The importance of investor attention for firm valuations is evidenced by the fact that newswire servicescompete on the breadth of their network.
4

and Parsons (forthcoming) for Wall Street Journal (WSJ) articles about the market; Tetlock,
Saar-Tsechansky, and Macskassy (2008) for news stories about individual stocks; and Engel-
berg (2008) for qualitative information that is released along with earnings reports). Using
textual-similarity analysis, Tetlock (2011) finds that investors react to previously-reported
information, causing subsequent return reversals. Using the Dow Jones news archive for the
period 1979-2007, Tetlock (2010) shows that returns earned on days when firm-specific news
are released are less likely to be subsequently reversed. He also finds that news stories typi-
cally reduce the level of informational asymmetry. Most similar in spirit to ours is the study
by Antweiler and Frank (2005), which classifies news stories that have appeared in the WSJ
from 1973 to 2001 into topics and runs event studies for each type of news.6 An important
objective of our study is to provide a reasonable classification for firm-level press releases
and assess their impact on stock prices and the information environment. Questions about
firm characteristics that determine the speed of price discovery are beyond the scope of this
paper and are left to future research.
The remainder of the paper proceeds as follows. Section II provides an overview of the
regulations affecting mandatory disclosures and describes the data. Section III explains the
test methodology and presents our test results. Section IV concludes.
6Our dataset offers three advantages. First, as Antweiler and Frank (2005) point out, the WSJ tends tocover only relatively large firms and print the news stories that are likely to attract readers’ attention. Whiletheir sample contains, on average, 18 announcements per day, our sample is much more comprehensive andcontains, on average, 218 announcements per day. Second, as a result of the recently implemented disclosureregulations, the timing of the information disclosures can be identified more precisely with our dataset; aswe will discuss later in the paper, during the time period covered by Antweiler and Frank (2005), firmswere allowed to report important news with a delay of up to four days; being picked up by the WSJ woulddelay it by at least another day. Finally, our news stories are hand-classified into news categories, while themajority of the sample in their paper is classified by a computer algorithm. Interestingly, we do not observethe conspicuous patterns of overreaction documented by the authors, probably because the press releaseannouncements in our dataset do not attract as much attention of retail investors as the WSJ articles.
5

II. New Disclosure Requirements and the News Dataset
A. New Regulations to Ensure More Complete and Timely Infor-
mation Disclosure
Prior to the adoption of Reg FD, corporations were required to disclose important material
information using the SEC’s Form 8-K. However, it was permitted for these forms to be
filed with a delay of up to four business days after the occurrence of an event (page 2 of
Form 8-K), and the news likely reached investors with an even further delay. Within that
time, a subset of market participants (notably, analysts and investment funds) could have
benefited from selective information disclosure, and this knowledge would have already been
(partially) incorporated in stock prices at the time of the official disclosure to the public.
Reg FD was adopted in October 2000 in response to a series of analyst scandals caused by
firms’ selective information disclosure to a subset of analysts in return for favorable stock
recommendations. The regulation states that firms must disclose all relevant information,
favorable or unfavorable, without any delay and to all market participants at once. The
Sarbanes-Oxley Act was adopted in July 2002 to address a series of accounting scandals, and,
among other objectives, aimed to improve the quality of financial information disclosure. The
SEC responded by adding the new Section 13(1) to the Exchange Act that obligates public
companies to disclose “on a rapid and current basis” nonpublic information “concerning
material changes in the financial condition or operations.”
Prior to these increased information disclosure requirements, press releases were a popular
method of communicating information, but, left to corporate discretion, they likely conveyed
predominantly favorable news. Reg FD states explicitly that firms have to disclose all relevant
information in order to eliminate the informational advantage of firm insiders.7 The advances
in information technology and, specifically, the internet are singled out as the technological
innovations that allow firms to disclose information to shareholders “directly and in real time,
without the intervention of an intermediary” (page 3 of the regulation). The SEC further
7As mentioned earlier, the regulation does not specifically list the types of news that have to be reported,for the fear that firms may try to game the system but only states that the information to be disclosed shouldbe “material” and “nonpublic” and such that “there is a substantial likelihood that a reasonable shareholderwould consider it important” (page 9 of the regulation).
6

suggests that issuing a press release should be the first step in conveying new information to
investors (page 15 of the regulation).
Our dataset of corporate press releases provides an improvement over a set of corporate
news that could have been constructed using Form 8-K reports over the same time period
for three reasons. First, as discussed earlier, the information reported on these forms reaches
the market with a significant delay, and the news may have been already, at least partially,
incorporated into stock prices. Second, the set of news that firms disclose via press releases
under Reg FD and SOX is broader than the information that was to be reported in Form
8-K.8 Finally, after the passage of the regulations, the SEC reduced the Form 8-K reporting
requirements as part of the Paperwork Reduction Act, so that many of the news announced
via press releases do not have to be reported again via Form 8-K. Given that our dataset
contains over 90% of all publicly traded firms, it appears that most firms comply with Reg
FD and SOX by disclosing new information via press releases.
B. The Dataset
Our dataset comprises corporate press releases issued between April 2006 and August 2009.
The press releases are issued via newswire services, which further disseminate the firm news
via their web interfaces and news distribution networks. The distribution networks contain
local and global media outlets (newspapers, magazines, radio and TV stations), trade mag-
azines, internet sites (such as Yahoo and Google), financial news service providers (such as
Bloomberg, Dow Jones/Factiva, and Thomson Reuters), some of which, especially those with
limited space capacities, then further decide whether or not to feature the press releases in
their news stories. Newswire companies do not charge members of their news distribution
networks but charge the firms issuing the press releases.9 Although there may be a tendency
to release bad news to smaller networks, this practice is discouraged by regulators.
8For example, in the year 2000, the SEC estimated that Reg FD would increase the number of requiredfirm disclosures by 70,000 per year (this estimate can be found on http://www.sec.gov/rules/proposed/34-42259.htm).
9For instance, BusinessWire does not charge an annual fee for maintaining an account with them butcharges for each press release based on its length and the width of the agreed upon distribution network.Fees start at $210 for the first 400 words and additional charges are added for photos and graphics.
7

Our dataset is consolidated from all of the major newswire services, including PR News-
wire, BusinessWire, GlobeNewswire, and MarketWire. PR Newswire contains 50%-60% of all
publicly traded firms, BusinessWire about 30%, and GlobeNewswire and Marketwire are the
next in terms of coverage, with the rest containing significantly fewer firms. Our coverage
shows an upward time trend; in 2006, 75.94% of all publicly traded firms appear in our
dataset, in 2007 coverage increases to 91.00%, in 2008 to 97.23%, and in 2009, since data
extends only through August, coverage drops slightly to 96.67% of all publicly traded firms.
The firms that are missing tend to be smaller than the firms present in the dataset. Over
the entire sample period, the mean (median) market capitalization of the firms present in
our dataset is equal to $2,596 ($321) million, while the mean (median) market capitalization
of the firms absent from the dataset is equal to $1,307 ($228) million.
We use only news releases issued by corporations themselves rather than by news agen-
cies.10 The press releases are then manually classified into news categories based on their
information content. In the future, the news classification can be easily automated with the
use of search words. Our objective in defining news categories is to achieve the best tradeoff
between the precision of each classification and its frequency of occurrence.
Perhaps as a result of the vagueness of the SEC’s information disclosure requirements,
firms tend to err on the side of releasing too much information. Additionally, firms may
prefer to announce immaterial news in order to attract the attention of potential investors.
For the sake of brevity, we remove news categories likely to be considered uninformative by
the market: We discard press releases announcing the firm’s participation in charity events,
environmental initiatives, news campaigns, and various corporate surveys (such as surveys
assessing the diversity of the labor force, security, etc.); declaring the filings of various doc-
uments with the stock exchanges and the SEC; announcing the establishment of industry
awards and competitions; making statements regarding labor strikes; describing new em-
ployee and industry initiatives; publicizing changes in internal policies; announcing speaking
engagements of their executives; and so on. We also discard news categories with fewer than
10Among all postings, official corporate press releases can be identified by the news’ “source” printed atthe bottom of the report.
8

30 press release observations. This leaves us with 271,867 corporate press releases.11 Further-
more, we exclude small stocks in order to reduce the impact of market microstructure effects
in our event study analysis, requiring that all firms in our sample have a market capitaliza-
tion of at least $100 million and a share price of at least $5/share before the announcement,
and also count as a single observation any multiple press releases in the same news category
issued on the same day. This reduces our dataset to 203,621 observations of unique press
releases, which are then split into ten major news categories and 60 subcategories.12 Table
I presents descriptions of all subcategories and the Appendix provides representative press
release headlines.13
The largest category, Financial, is comprised of 39,933 press releases and contains an-
nouncements about earnings, dividends, accounting restatements, stock splits, secondary
debt and equity offerings, and share buybacks. Meetings and Events is the second largest
category, with a total of 36,793 observations. The third largest category is Customers and
Partners, with 35,538 observations; it contains announcements about customer losses or
wins, new partnerships formed, and various company milestones.14 The category Products
and Services comes fourth, with a total of 31,881 observations; it includes announcements
about product approvals, new products, updates and upgrades to the existing products and
services, patent awards, product defects, and outcomes of firms’ research projects. The fifth
largest category, with 25,142 observations, is Management, describing various changes in the
management team. In sixth place, with 13,206 observations, is the M&A category, which
contains press releases about mergers, acquisitions, and spinoffs. The Awards category ranks
seventh, with 10,486 observations, and includes announcements of company and product
awards. With 7,214 observations, Strategy and Performance comes next and includes an-
11Throughout the paper, we use the terms “(corporate) press release,” “news event,” and “news announce-ment” interchangeably.
12When redoing our analysis using all firms in the sample, we obtain qualitatively similar results.13Our news categorizations are designed to be rather general in nature in order to capture the average
effect of a particular news type; moreover, they lend themselves to the possibility of easy automation throughkeyword searches of press release headlines. For this reason and due to space constraints, we refrained fromforming the finer sub-partitions that have been proposed by follow-up studies of several frequently investigatednews events (for example, we do not separate acquisitions into stock- and cash-based, newly-awarded patentsinto “broad” or “narrow” in scope, new debt issues into convertible and straight, and so on).
14The subcategory Reaching a Milestone could have been also assigned to the major category CorporateStrategy & Performance, but it frequently describes milestones reached in sales to customers or anniversariesof customer and partner relationships, thus signifying enduring business ties.
9

nouncements about decisions to expand or scale back firm operations, credit news, and trends
in performance and profitability.15 The ninth largest category, with 2,617 observations, is
Legal, which contains announcements of (class action) lawsuits, SEC investigations initiated
against the firm, and settlements of ongoing lawsuits. The smallest category, with 811 obser-
vations, is Exchange; it contains both announcements about the receipt of non-compliance
notices from the stock exchange or the return to compliance with exchange rules.16
Table II presents summary statistics for monthly press release activity across firms (the
table only includes the press release observations that we kept). Panel A reports the statistics
for the entire sample and shows that the average number of monthly press releases per firm is
0.88. However, a typical firm issues zero press releases per month, implying that the positive
average is driven by a subset of firms issuing a relatively large number of monthly press
releases. Panel B presents the mean/median monthly press release numbers by firm size, the
left-hand side of the panel for NYSE-based size quintiles and the right-hand side for sample-
based size quintiles, formed every month, so that all sample-based quintiles contain roughly
the same number of stocks. Predictably, the number of press releases tends to increase with
firm size. The average number of monthly press releases for NYSE-based (sample-based)
quintiles increases from 0.21 (0.82) for the smallest to 1.98 (1.14) for the largest quintile.
III. Empirical Tests
In this section, we investigate the impact of various types of news on stock prices and the
information environment. Many news may be so major in nature that, rather than simply
offering an independent signal that helps investors refine their firm valuation models, they
may instead force them to adopt an entirely different model. Consider a market maker
15Subcategories Profitability - Declining and Profitability - Improving are related to the subcategoriesdescribing strong and weak financial results under the major category Financial, but instead of focusing oncurrent earnings, these announcements provide big-picture assessments of patterns and trends in firm sales,revenues, and profitability.
16Often, notices of noncompliance are triggered by periods of bad performance, such as bid prices stayingbelow the exchange-set minimum for a pre-specified number of consecutive days, or the total value of publiclyheld shares falling below a minimum value set by the exchange. Noncompliance notices are also triggeredby delays in providing exchange-mandated information releases, such as annual and quarterly reports anddisclosures about the firm’s corporate governance. Announcements of various firm filings with the exchanges—including requests for listing or delisting—have been omitted from this dataset.
10

observing a news announcement. Suppose that the announcement induces her to revise both
her estimate of the fair value of the stock, v, and the precision with which it is estimated,
σ2v , thus replacing the old valuation model, V firm ∼ N(v, σ2
v), with the new one, V firm ∼
N(vnew, σ2v,new). The change in the mean of the distribution, vnew−v, will be captured by the
abnormal return at the time of the announcement. The change in the precision with which it is
estimated, σv,new−σv, will be manifested in the change in the stock’s subsequent idiosyncratic
volatility. If the valuation priors are weakened (σv,new > σv), then the price will react more
strongly than before to subsequent information signals (such as analyst reports, news media
stories, and various follow-up information releases issued by the firm), increasing the post-
event idiosyncratic volatility. If the valuation priors are instead strengthened (σv,new < σv),
the post-announcement volatility will decrease. Additionally, Grundy and Kim (2002) show
that the post-announcement volatility will increase if traders interpret the news differently
and have different valuation priors.
If corporate insiders have beforehand knowledge of the information to be released, the
adverse selection in trade will decrease in the post-announcement period, and trading costs
will decrease as well (according to the models of Glosten and Milgrom (1985) and Kyle
(1985)). If instead a group of more sophisticated traders has an advantage in interpreting
the news, adverse selection will be higher in the post-announcement period and trading costs
will increase (e.g., Kim and Verrecchia (1994)).
Compared to the considerable literature on event-induced abnormal returns, the number
of papers conducting investigations of event-driven changes in volatility and liquidity is much
smaller. Yet, firm management should be concerned with both. As noted by Clayton,
Hartzell, and Rosenberg (2005), higher idiosyncratic volatility reduces the attractiveness
of firms’ equity as a medium for acquisitions and stock-based employee compensation and
exacerbates the conflict of interest between bondholders and stockholders. Reduced liquidity
increases the required rate of return and, hence, the firm’s cost of capital.
Trading volume provides an additional insight into the informativeness of the news. A
news announcement may manifest itself in abnormal trading volume if it causes individual
11

investors to revise their beliefs, even when not accompanied by abnormal returns.17 Karpoff
(1986) models how volume may react to news by considering two groups of investors: the stock
owners and the non-owners. He shows that trading volume should be expected to increase
if a news announcement causes investors to interpret the information differently because
it is then more likely that beliefs will be jumbled and the non-owners will develop higher
valuations than the owners. Obviously, volume will increase when the non-owners increase
their valuation by a larger amount than the owners. When the reverse is true and the owners
increase their valuations by a larger amount than the non-owners, trading volume will decline.
In addition to these considerations, Verrecchia (1981) shows that even when investors have
identical prior beliefs and an identical interpretation of new information, they will still trade
if the news changes state-contingent security payoffs and investors have different levels of
risk tolerance. Changes in the post-announcement level of informational asymmetry will
have a separate effect on volume. If discretionary liquidity traders can choose when to trade,
they will stay out of the market when the level of informational asymmetry is high and
trade when it is low (e.g., Admati and Pfleiderer (1988), Foster and Viswanathan (1990),
and Tetlock (2010)). Therefore, depending on whether a news announcement increases or
decreases informational asymmetry, the post-announcement trading volume could increase
or decrease.
A. Impact on Stock Returns
A.1. Event Study Methodology
To assess the immediate impact of news releases on stock prices, we follow the common event
study methodology. For each firm i, the abnormal return on day t, ARit, is specified as:
ARit = Rit − E(Rit|Xt), (1)
17Indeed, Bamber and Cheon (1995) and Cready and Hurtt (2002) show that the magnitudes of the priceand volume response to earnings announcements are largely independent.
12

where Rit and E(Rit|Xt) are the actual and expected returns, respectively, for day t, and
Xt is the conditioning information for the predictive model. Assuming that returns can be
described by the market model, the abnormal return is defined as:
ARit = Rit − α̂i − β̂iRmt, (2)
where Rmt is the day-t return on the market portfolio, which we proxy with the CRSP value-
weighted index. The coefficients α̂i and β̂i are the OLS estimates from the regression of firm
i’s daily returns on market returns over the 200 days prior to the event window.
The event window extends from one day before to five days after the day of the press
release (as is common in event studies, we start the window one day before the actual an-
nouncement day in case the news has leaked to the market just before the actual press
release).18 We keep the event window relatively short for two reasons: We are interested
in the immediate impact of news on stock prices and we want to minimize the chance that
another press release is issued by the firm within the same window. Thus, we compute the
average daily abnormal return for each firm i issuing a press release on day t as:19
CARit =1
7
t+5∑τ=t−1
ARiτ . (3)
Next, we calculate the average CAR (CAR) for each news category across all press release
observations and test whether the null hypothesis (H0 : CAR = 0) is violated. In order not
to understate the standard errors for statistical inference, we correct for possible correlation
of individual CARs estimated in overlapping event windows by clustering errors by the week
in which press releases were issued.
18For all our event studies we assume that if a press release was made after trading hours, the announcementday is the next trading day.
19Henceforth, for convenience we will refer to the average daily abnormal return as the cumulative abnormalreturn (CAR) despite the fact that it is rather averaged over the seven days from t− 1 to t + 5. Therefore,in all tables and figures reported CARs should be multiplied by seven to obtain the cumulative excess returnearned over the seven-day period around the announcement.
13

A.2. Event Study Results
Figure 1 plots individual CAR observations for each news category. It shows that the dis-
tribution of CARs is somewhat right-skewed. However, when computed with a sufficiently
large number of observations, the distribution of sample means should approach normal. (As
mentioned earlier, we do not have news categories with fewer than 30 observations.) As an
additional check, we also conduct a non-parametric test for whether the sample CARs are
different from zero for samples that contain fewer than 100 observations.20
Table III presents average CARs and the p-values of the tests of H0. For the news
categories that contain fewer than 100 press releases, the p-values are italicized, and the 1%,
5%, and 10% significance levels of the non-parametric tests are indicated by symbols a, b, and
c, respectively. The results confirm previously reported regularities, especially when it comes
to financial news, which have been extensively studied in prior literature. For illustration,
Figure 2 plots average CARs for all news categories.
Financial News. Under the assumption of informational asymmetries between managers
and investors, financial decisions can be viewed as signals revealing managers’ private infor-
mation about whether the firm is under- or overvalued.21 Additionally, Jensen (1993) argues
that managers tend to waste cash (he calls this tendency the “free-cash-flow problem”) and,
therefore, decisions to pay out the excess cash should be value-increasing.
Dividends signal both the availability of cash and the willingness to pay out this cash in-
stead of wasting it; as a result, dividend announcements, and especially dividend initiations
or increases, are typically accompanied by positive returns (e.g., Asquith and Mullins Jr.
(1983), Healy and Palepu (1988), and Yoon and Starks (1995)). In our sample, we subdi-
vide dividend announcements into several subgroups. Dividend initiations or increases are
accompanied by a significantly positive mean CAR, and it is almost three times as high as
the mean CAR associated with generic dividend announcements, which do not reveal infor-
20Specifically, the non-parametric test evaluates how frequently the CAR is different from zero. Settingp := Pr(CAR ≥ 0), (or, equivalently, we can define p := Pr(CAR ≤ 0)), we test the null hypothesis,H0 : p = 0.5, against the alternative, HA : p 6= 0.5, using a signed rank test.
21See, for example, the models of Myers and Majluf (1984), Myers (1984), and Miller and Rock (1985), aswell as the discussions in chapters 13-17 of Brealey, Myers, and Allen (2006).
14

mation about the relative magnitude of the dividend payment.22 The mean CAR associated
with dividend suspensions or decreases is significantly negative and roughly equal in absolute
value to the mean CAR associated with dividend increases. The highest price reaction in the
dividend subgroup (and the fourth highest among all significant subcategories) is associated
with announcements of special dividends. Finally, announced dividend payments to preferred
stockholders do not elicit a significant price reaction.
Share repurchases are another way to distribute excess cash back to investors; in addi-
tion, the decision to buy back shares can be interpreted as a signal that the firm’s equity
is undervalued. Announcements of share repurchases were shown to be accompanied by
positive market reactions (e.g., Asquith and Jr. (1986), Lakonishok and Vermaelen (1990),
and Grullon and Michaely (2004)). In our sample, the average CAR associated with share
repurchase announcements is the second highest among all significant subcategories and is
highly significant.
Secondary equity offerings (SEOs) signal that the firm’s equity might be overpriced or
that the firm is running out of cash. Prior studies show that equity prices tend to decline
in response to SEO announcements (e.g., Smith (1986) and Corwin (2003)). In our sample,
the average CAR associated with SEOs is significantly negative and tenth lowest among all
significant news categories.
Similarly, the issuance of debt might be interpreted as a signal that the firm is overval-
ued and/or short of cash. However, the evidence on whether or not stock prices fall upon
announcements of debt issuances is mixed. Smith (1986) documents a negative price re-
action following announcements of convertible bond issuances but finds no price reaction
following announcements of straight debt issuances (the latter result is also confirmed by
Shyam-Sunder (1991)). However, Akhigbe, Easterwood, and Pettit (1997) show that prices
react negatively to announcements of new debt issuances when they are motivated by the
need to raise funds due to an unexpected cash shortfall. Although the authors do not investi-
gate price reactions to straight and convertible debt issuances separately, most observations
in their sample (90% of the 399 announcements they study) are for straight debt. We also do
22We use the terms “mean CAR,” “average CAR,” and sometimes, for brevity, just “CAR” interchangeably.
15

not separate announced debt issuances into straight and convertible debt and find a negative,
albeit insignificant average price reaction.
Announcements of forward stock splits were previously shown to generate positive price
reactions, as suggested by signaling models (e.g., Ikenberry, Rankine, and Stice (1996)).23 In
our sample, the price reactions to forward splits are also positive and significant. Investigat-
ing a sample of 32 reverse split announcements, Woolridge and Chambers (1983) observe a
significantly negative average price reaction. The average CAR in our sample is also negative,
but insignificant.
It has been shown that prices react strongly to positive and negative earnings surprises
(e.g., Ball and Kothari (1991), Stice (1991), Kothari (2001), and Vega (2006)). Our findings
are in line with these studies; announcements of disappointing financial results (Financial
Results - Weak) are accompanied by significantly negative CARs, while announcements of
strong financial results (Financial Results - Strong) trigger significantly positive price reac-
tions. Frequently, financial results are pre-announced, and we find that the market reacts
to positive pre-announcements almost twice as strongly, and to negative pre-announcements
more than ten times as strongly as to the regularly scheduled announcements of strong/weak
results, possibly because firms tend to pre-announce earnings that deviate considerably from
the expectations. In fact, the average CAR associated with negative pre-announcements is
the lowest in our sample.
Finally, restatements, which are usually caused by either genuine accounting errors or
deliberate earnings manipulation, are usually accompanied by negative price reactions unless
the accounting errors are to the firms’ disadvantage (e.g., Callen, Livnat, and Segal (2006)).
In our sample, the average CAR associated with restatements is significantly negative and
the fifth-lowest among all significant news categories.
M&A News. The market reaction to M&A decisions is another extensively studied area
in finance. Some M&A plans never come to fruition because of a lack of shareholder approval
or, in case of mergers and acquisitions, government interventions enforcing the compliance
with antitrust laws. Whenever possible, we separate M&A-related press releases into an-
23See also Yildizhan (2009) for a literature review.
16

nouncements of intent and of imminent or executed transactions. Mergers and acquisitions
are similar in nature, in that two stand-alone firms combine and start trading as one. In
acquisitions, the acquirer is almost always larger than the target and the combined firm
usually keeps the name of the acquirer. In mergers, the two firms behave more like equals,
and the combined entity often takes on a new name. The frequently stated motivation for
mergers and acquisitions is that two firms are deemed to be worth more together than apart
(for example, due to synergies, economies of scale, increased market power, and higher tax
efficiency). If a bidding war for the target erupts, the acquirer faces the danger of overpaying,
and the target emerges as the clear beneficiary. Another caveat is that even if the valuation
gain for both the target and the acquirer is positive, the price effect is more noticeable for
the target firm since it tends to be smaller than the acquirer. Moreover, when an acquirer
chooses to pay for the target with its stock rather than cash, a negative signal is sent that
its shares might be overvalued. It has been shown that acquirers’ prices generally fall when
stock-financed acquisitions are announced and register a small gain when cash-financed ac-
quisitions are announced, while targets’ prices tend to significantly increase (e.g., Franks,
Harris, and Titman (1991) and Andrade, Mitchell, and Stafford (2001)). Consistent with
these studies, we find that target firms experience significantly positive announcement re-
turns, ranked sixth-highest among all significant news categories. As for the acquiring firms,
we do not separate acquisitions into cash- and stock-financed, and our results show that, on
average, the price reaction to announcements of a certain acquisition, albeit not very high, is
significantly positive.24 The returns associated with acquirers’ announcements of the intent
to acquire are positive but insignificant. Likewise, merger announcements generate a positive
average CAR, which, however, is indistinguishable from zero.
Divestiture announcements typically elicit a positive price reaction (e.g., Schipper and
Smith (1983)). Several explanations have been considered for why valuations of parent firms
may increase upon announcement. First, by divesting lines of business that are a “poor
fit,” the management of the parent company can refocus on its main activity. Second,
the fact that the management chooses to raise funds by issuing equity in the subsidiary
24We have many more press releases issued by acquirers than by targets because many of the latter areprivate firms not present in our dataset.
17

rather than issuing equity in the consolidated corporation signals that the parent firm is
undervalued relative to the subsidiary (Nanda (1991)). Third, divestitures make parent
firms more transparent, which leads to a better alignment of managers’ and shareholders’
interests and further ensures that funds from more profitable lines of business will not be
diverted to support an unprofitable division of the firm. Subsidiaries may be divested via
a spinoff, when at least 80% of the shares in the subsidiary are distributed to the parent
firm shareholders, or equity carve-outs, when some or all of the subsidiary’s stock is offered
directly to the public in the form of an IPO.25 The first method is more tax efficient. In our
sample, announcements of both a spinoff intent and an imminent or completed spinoff lead
to highly positive and significant CARs, which rank fifth and seventh, respectively, relative
to all significant news categories. The average price reaction associated with equity carve-
outs (IPOs), which are less prevalent in our sample, although positive, is not statistically
significant.
Other News Categories. As expected, among the other news categories, press releases
describing developments that are likely to increase or stabilize future cash flows are accom-
panied by positive price reactions, and news likely to result in lower and more volatile cash
flows by negative price reactions. News about Products & Services and Customers & Partners
stand out as potentially having a fairly immediate impact on cash flows.
Product-related news shed light on future sales. The price reaction to FDA approvals
ranks third highest and to FDA rejections second lowest among all news categories (Bosch
and Lee (1994) also document large reactions to FDA decisions). The reaction to Product
Defect announcements is fourth most negative in our sample. This is in line with prior studies
(e.g., Jarrell and Peltzman (1985), Davidson III and Worrell (1992), and Barber and Darrough
(1996)).26 New Product introductions are accompanied by significantly positive abnormal re-
turns, confirming the evidence in Woolridge and Snow (1990) and Chaney, Devinney, and
Winer (1991). The market reaction to Patent Award announcements is significantly positive;
this finding is consistent with prior research documenting that new patent awards are associ-
25Sales of a subsidiary to another firm are included in the “spinoff” category.26Possibly due to the damaging effect on firm reputation, Jarrell and Peltzman (1985) find that for product
recalls, the negative return penalty surpasses the direct costs associated with the recall.
18

ated with positive abnormal returns (e.g., Austin (1993)) and improved future performance
and higher valuations (e.g., Bloom and Reenen (2002)). Announcements about the successful
completion of research projects also lead to a significantly positive average price reaction, and
the market reaction to research failures is negative but insignificant.
News about Customers & Partners shed light on future product demand as well as adver-
tising and production costs, and tend to be accompanied by significant price reactions. The
significantly positive CARs associated with announcements of a New Partnership that we
observe have been previously documented by McConnell and Nantell (1985) using a sample
of 210 firms involved in 136 joint ventures and by Woolridge and Snow (1990) using 197 joint
venture announcements. Signaling lower future demand, announcements of a Customer Loss
is the category with the third-lowest price reaction. The average price response to announce-
ments of a Customer Win is significantly positive but almost seven times lower in absolute
value than the reaction to customer losses.
Investigating corporate investment decisions, Woolridge and Snow (1990) show that the
market tends to react positively to corporate investment announcements. We, however, docu-
ment no significant reaction to such announcements, though the direction is, on average, pos-
itive (Infrastructure - Expansion). We do find that the market reacts significantly positively
to corporate decisions to shut down unprofitable operations (Infrastructure - Downsizing),
consistent with the free-cash-flow concern of Jensen (1993).
Turning to Legal news, it has been previously shown that announcements of negative legal
issues, such as stockholder or patent infringement lawsuits, lead to negative price reactions
and announcements of legal settlements to positive price reactions (e.g., Bhagat, Brickley,
and Coles (1994), Bizjak and Coles (1995), Bhagat and Romano (2002), Griffin, Grundfest,
and Perino (2004), and Raghu, Woo, Mohan, and Rao (2008)). In our sample, the average
price reaction to negative legal developments is negative, though statistically insignificant.
However, in unreported results, we find it to be significantly negative for the full sample of
firms that also includes firms with a market capitalization under $100 million and a share price
under $5, probably because for smaller firms it is less likely that the information has leaked
out prior to the official announcement. Announcements of class action lawsuits also elicit a
19

negative, albeit insignificant, reaction, possibly because the news has been already revealed
by law firms or plaintiffs prior to the press release. Announcements of legal settlements are
accompanied by significantly positive CARs of almost the same magnitude as announcement
of legal problems.
Changes in the firm Management could have large valuation consequences, but it is very
difficult to assess their immediate impact. Nonetheless, in our sample, additions to the top
management are accompanied by significantly positive returns, while management termina-
tions (voluntary and involuntary combined), by significantly negative abnormal returns that
are more than four times larger in magnitude; in fact, this is the category with the sixth
lowest significant CAR.
The average market reactions to announcements about Noncompliance and Return to
Compliance with exchange rules are insignificant. This is not unexpected, since the released
information is already public prior to the announcement. For example, notices of noncom-
pliance are often triggered by poor past performance and, in particular, by prices falling
below an exchange-specified minimum. This information is not only public, but also al-
ready priced in. Other types of noncompliance, which are triggered by delays in providing
exchange mandated reports, are probably inconsequential for firm valuation. Likewise, the
return to compliance with exchange rules is secured either by the rise of stock prices (and,
by this, already priced in) or by the submission of the overdue forms, and unlikely to be
valuation-relevant.
Finally, announcements about winning a Company Award may send a positive signal about
the quality of the firm, which would explain the significantly positive price reaction (this is
consistent with the evidence of positive abnormal returns associated with quality award
announcements, documented in Hendricks and Singhal (1996)). Alternatively, such awards
do not convey new information but simply increase the firm’s visibility, as do announcements
about Reaching a Milestone or participating in an Industry Event, which are also accompanied
by significantly positive abnormal returns. Higher visibility broadens the investor base and
lowers the firm’s cost of capital, increasing the market value (Merton (1987)).
20

Longer Event Windows. Figure 3 plots the cumulative abnormal returns, calculated
over the period from 21 trading days before to 21 trading days after news announcements
[−21,+21]—spanning approximately one calendar month before and after the announcement—
for the seven most positive, significant as well as the seven most negative, significant CAR cat-
egories, as reported in Table III. The figure is meant to capture pre- and post-announcement
price drifts. It shows that most press releases convey value-relevant information, as the cu-
mulative abnormal return plots start to fan out on the announcement day (t = 0). Moreover,
most price reactions appear to be permanent, with only few lines showing reversals. The
reaction to bad news often starts prior to the press release date.
Individual cumulative abnormal return plots for the period [−21,+21] for the eight most
positive, significant CAR categories of Table III are presented in Figure 4, arranged in de-
creasing order of CARs. Figure 5 plots cumulative abnormal returns for the eight news cat-
egories with the most negative, significant price reactions reported in Table III, arranged in
increasing order of CARs.27 Daniel, Hirshleifer, and Subrahmanyam (1998) in their model of
investor overconfidence distinguish between “selective” and “nonselective” corporate events.
The first type is defined as being dependent in its occurrence on the prior mispricing, and
the second is not. For example, share repurchases are likely to be initiated by managers as
a result of equity being undervalued and new share issues as a result of equity being over-
valued; these are selective events. In contrast, external decisions, such as FDA approvals or
rejections are independent of the current level of mispricing. One of the model predictions
is that good/bad selective events occur more frequently when the firm is under-/overvalued.
If prior high/low returns are indicative of over-/undervaluation, we find consistent results
among the events plotted. Decisions to repurchase equity are associated with low prior re-
turns.28 Spin-off decisions are preceded by high returns, making it likely that the spun off
division is overvalued by the market. Target firm acquisitions are preceded by poor prior
returns of the target, indicating that it is likely underpriced. These are examples of selective
decisions that may generate a financial gain for the firm. Other selective decisions, such as
27Note that the return plots for categories with fewer observations tend to be more volatile.28This graph is consistent with previously documented evidence of a pre-repurchase share price decline
(e.g., Lakonishok and Vermaelen (1990), Comment and Jarrell (1991), and Singh, Zaman, and Krishnamurti(1994)).
21

forward splits, may be used for signaling, and yet other types, such as dividend decreases,
may be necessitated by dwindling profits and cash balances; in our sample, these decisions
also appear to be related to prior returns.
Another prediction of the Daniel, Hirshleifer, and Subrahmanyam (1998) model is that
the market will underreact to selective events intended to exploit mispricing because overcon-
fident investors will revise their prior valuations too little at the time of the announcement,
and, as a result, post-event returns will be positively correlated with event-date returns. On
the contrary, for nonselective events, since their occurrence is uncorrelated with mispricing,
and, hence, with investors’ priors, their price impact should be fully reflected at the time
of the announcement and no post-event drift should be observed. Our results only partially
align with these predictions. Among the set of selective events designed to exploit mispricing,
we find that, consistent with the model, share repurchases are followed by a positive price
drift; in conflict with the model’s predictions, we observe no post-announcement drift for ac-
quisition targets. Among the set of nonselective events, in line with the model’s predictions,
we detect no post-announcement drift for FDA approvals and product defect announcements;
yet, at odds with the model, we observe a drift following announcements of FDA rejections
and customer losses.
Interestingly for FDA Approval and FDA Rejection announcements prices start to move
even before the official press release is made. The leakage of FDA decisions prior to the
official announcement matches the evidence in Bosch and Lee (1994). In fact, for the FDA
rejection category, the pre- and post-announcement drifts are so large that the total cumu-
lative abnormal return equals about -11.2% when calculated over the period [−21,+21], and
only about -7.2% when computed over the period [−1,+5] (as reported in Table III).
Patterns of overreaction and reversals are observed for Termination of top managers,
Dividend - Decrease, and, to a lesser extent, for Spinoff - Intent and Financial Results -
Strong. However, as discussed above, these patterns are not universal across announcement
categories. In contrast, Antweiler and Frank (2005) document that the market tends to
overreact to corporate news events reported in the WSJ. Further investigation is warranted
22

into whether the overreaction is limited to a set of announcements that attract attention of
retail investors, in particular, by being re-reported by various media outlets.
B. Impact on the Firm’s Information Environment
Here, we investigate announcement-induced changes in volatility, turnover, and bid-ask
spreads as our measure of trading costs.
B.1. Effect on Volatility
In order to investigate the effect that press releases have on volatility in the short period
after the information becomes public, we follow the realized volatility approach outlined
in Andersen, Bollerslev, Diebold, and Labys (2003). We estimate realized volatility from
TAQ data, sampling from equidistant five-minute intervals using the midpoint of the quoted
bid-ask spread.29 One important advantage of this approach is that it allows us to obtain
precise estimates of volatility over short time intervals. We would like to keep the post-
announcement period short in order to not inadvertently include subsequent press releases.
An additional advantage is that we can obtain consistent estimates of volatility that are
very robust to the underlying assumption about the return generating process. In particular,
recent research in financial econometrics is often concerned with the role of jumps in the
return generating process.30 As we are analyzing realized volatility in an environment when
new information becomes public we cannot rule out the presence of jumps. It is therefore
important to highlight that our estimates are consistent in the presence of jumps.
In order to conduct inference about realized volatility, we need an asymptotic theory for
realized volatility. This is a non-trivial matter as the asymptotic theory depends heavily
on the assumptions about the underlying stochastic process driving returns. In fact in the
presence of jumps, there is no asymptotic theory as in this case realized volatility is not in the
domain of attraction of the normal law (Andersen and Benzoni (2009)). We therefore follow
a simple non-parametric strategy to analyze changes in volatility following press releases.
29This methodology for estimating realized volatility is discussed by Andersen and Benzoni (2009) andimplemented by Hansen and Lunde (2006).
30See, e.g., Andersen, Bollerslev, and Diebold (2007).
23

Specifically, we first calculate the frequency of volatility increases in the event window relative
to the pre-event window. Specifically, define X :=∑n
i=1 1σposti >σpre
i, where σposti and σprei
are the event-window and pre-event-window volatility realizations. The variable X follows
the binomial distribution, X ∼ B(n, p), where n is the number of observations and p :=
Pr(σposti > σprei ). We are testing the null hypothesis, H0 : p = 0.5, against the alternative,
HA : p 6= 0.5.
The event window is constructed to have the same endpoint as the event window we used
for calculating CARs. However, here we skip the event day in order to exclude the large price
movement immediately around the announcement. Therefore, we set our event window to
[+1,+5] and the pre-event window to the same length, [−5,−1]. The results are presented
in Table IV. The table shows that volatility increases in the post-announcement period for
most of the news categories, and that for 27 out of 60 categories the null hypothesis can be
rejected at the 10% significance level.31 Regularly scheduled and pre-announced earnings,
as well as earnings restatements result in the most prevalent volatility increases. Volatility
increases following some types of announcements appear quite pervasive but are not indicated
as significant due to the low power of our non-parametric test (e.g., FDA rejections, customer
losses, and reverse stock splits).
Previous studies that investigated the effect of public news on volatility calculated volatil-
ity from daily returns and, therefore, used longer event windows, making them not directly
comparable to our results. Consistent with our results, it has been shown that stock splits
lead to higher volatility (e.g., Ohlson and Penman (1985), Dravid (1987), Dubofsky (1991),
and Koski (1998)), and at least some of the post-split volatility increase may be attributable
to market microstructure effects. While we find that stock dividend announcements increase
volatility over the subsequent five days, and Koski (1998) documents a significant increase
over the next 20 days, Dravid (1987) observes a significant decrease over the next 35 days;
however, he finds a significant volatility increase following reverse stock splits over the same
period, which is consistent with the economically large (though statistically insignificant)
volatility increase in our sample. Finally, Clayton, Hartzell, and Rosenberg (2005) document
31We have experimented with window lengths of three and ten days around the announcement and foundthat the results are somewhat stronger for the three-day and somewhat weaker for the ten-day event window.
24

that CEO departures, especially the forced ones, which in the authors’ view create “higher
uncertainty over the firm’s strategic direction and management’s ability to run the firm,”
lead to significant increases in stock volatility. In our sample, volatility increases for the
majority of firm-events following all management-related announcements, but the increases
are significant only for the categories Promotion and Termination.
Volatility changes subsequent to news and non-news days. In this section, we ad-
dress the concern that the post-announcement increases in realized volatility that we observe
may be explained solely by the price shock that accompanies news releases rather than by
the valuation-uncertainty-inducing aspect of the new information. For this purpose, we sep-
arate returns into those driven by news and those driven by liquidity shocks, as has been
done in prior literature. If a more uncertain post-announcement information environment is
responsible for the increased volatility level, then the news-driven price shocks would result
in higher volatility increases than liquidity-driven shocks of a similar magnitude.
We follow Chan (2003) and Tetlock (2010) in separating returns driven by news from
those driven by liquidity shocks. We begin by classifying as news days the days on which the
firm issued a press release or on which a major macroeconomic announcement was made. (We
are careful to include macroeconomic news because the potentially heightened sensitivity of
some stocks to macroeconomic conditions during our sample period.) Macroeconomic news
include announcements about (1) the rate of unemployment, (2) the consumer price index,
(3) changes in nonfarm payrolls, (4) personal consumption, (5) advance, preliminary, or final
annualized GDP numbers, and (6) Federal Open Market Committee interest rate decisions.32
Next, on each day, we sort stocks into 20 groups based on the abnormal return on that day.
Within each return-sorted group of stocks, we proceed to sort stocks into two further groups,
the news and the non-news groups, based on whether or not the day on which the abnormal
return is observed is a news day for the stock. Thus, for each level of a daily price shock, we
obtain two firm-day groups, one where the return can be attributed to news, and one where
we think it can be attributed to a liquidity shock.
32We are grateful to Clara Vega for providing us with the dataset of macroeconomic news announcements.
25

For both groups, we check the subsequent volatility changes in the five days after the
group assignment day (t = 0), [+1,+5], relative to the five days before, [−5,−1], using the
non-parametric test described earlier. Finally, for each return group, we check the difference-
in-difference of the post-formation volatility change between the news- and the non-news
firm-day groups, using a simple t-test for the null hypothesis that both groups contain equal
fractions of stocks that experience post-formation volatility increases. This way, we can
separate out volatility changes attributable to news-induced valuation uncertainty from those
attributable to price shocks.
The results are presented in Table V. The news group contains slightly more than one-
third of the observations of the non-news group.33 The table shows that volatility increases
are significant across all news groups but not across all non-news groups.34 It can be seen that
more stocks experience volatility increases following extreme returns. However, controlling for
the magnitude of the contemporaneous abnormal return, the fraction of firms that experience
volatility increases is always significantly higher for the news sample relative to the non-news
sample.35 This result implies that the post-announcement volatility increases that we observe
in Table IV must be, at least partly, driven by the valuation-uncertainty-increasing content
of the news being released.
Volatility changes subsequent to more non-routine-sounding news. We check whether
volatility increases are more prevalent following less routine-sounding types of press releases
that are likely to induce larger valuation uncertainty, compared to more routine news.36 As
33During our sample period, realized volatility exhibits a slightly increasing trend, which is why the averagefraction of stocks that experienced a volatility increase in the post-formation period is slightly higher than0.5.
34The reason why volatility increases are always significant in Table V and not universally significant acrossthe news categories in Table IV is because the power of our statistical test is low and having a large numberof observations helps achieve higher significance levels.
35We have also experimented with changing the volatility measurement windows to three or ten days andwith not including macroeconomic news announcements and obtained qualitatively similar results.
36In particular, we search headlines across all news categories for the words “surprising,” “unexpected,”“groundbreaking,” ”revolutionary,” “unprecedented,” “exceptional,” “extraordinary,” “unique,” “shocking,”and their synonyms, as well as spelling variations. This search produces vastly different numbers of qualifyingheadlines across the different news categories, indicating that some types of announcements are inherentlymore prone to be of a routine nature. We keep the categories for which the number of “non-routine”headlines exceeds either 20 observations or 1% of the total observations in that category, by this, keepingthe following news categories: announcements about profitability improvements, new products, productupgrades, legal settlements, share buybacks, new partnerships, infrastructure expansion, industry events,and company awards. We then combine all the non-routine announcements from these “parent” categories
26

before, we use the non-parametric test with the same event and pre-event windows to in-
vestigate the significance of post-announcement volatility changes in the two groups. As
expected, non-routine news induce more prevalent post-announcement volatility increases:
volatility increases for 53.51% of firms in the non-routine news category, with an associated
p-value of 4.11%, and for 50.12% of firms in the routine category, which is not statistically
significant. The statistically more powerful t-test, which we use to test whether the fraction
of firm-events with post-announcement volatility increases is the same for both categories,
returns a significant difference between the two groups, with an associated p-value of 3.20%.
Therefore, despite our relatively crude way of identifying non-routine, uncertainty-inducing
press releases, we are able to obtain the intuitively appealing result that such news induce
larger volatility increases.
B.2. Effect on the Bid-Ask Spread and Turnover
We conduct event studies on the bid-ask spread and turnover using the common event study
methodology. We begin by calculating the unexpected value of the variable of interest (X)
in the event window as:
Uit = Xit − E (Xit) . (4)
The expected value of the variable, E(X), is calculated as its mean realization in the pre-
event window. We then compute the standardized unexpected value as the unexpected value
scaled by the standard deviation of variable X in the pre-event window (σi):
SUit =Uitσi. (5)
As in the abnormal return tests, we test the null hypothesis H0 : SU = 0, using a standard
t-test and clustering standard errors by the week in which the announcement was made in
order to account for possible cross-correlations in turnover and bid-ask spreads, respectively.
As before, for categories with fewer than 100 announcements, we also report the significance
into one “non-routine” group of news. The remainder of the press releases in the “parent” categories aresimilarly combined into one “routine” news group. The total number of news in the combined non-routinegroup is 753, and the total number of news in the combined routine group is 94,191.
27

levels of the non-parametric tests that evaluate how frequently the abnormal variable falls
above or below the baseline value of zero for each news category.
The pre-event window is set to 50 days, [−51,−2].37 For turnover, the event window is
set to be the same as for the CAR estimation, [−1,+5], as before, starting one day prior to
the announcement in order to account for early trading induced by potential news leakage.
For the bid-ask spread, we start the window on the day of the announcement because prior
research has shown that the bid-ask spread may be unusually high just before the scheduled
announcement due to high adverse selection in trading (e.g., Chae (2005) and Graham, Koski,
and Loewenstein (2006)) and we would like to focus exclusively on the post-announcement
information environment. Therefore, the event window for the bid-ask spread event study is
set to [0,+5].
Bid-ask spread. The bid-ask spread series is computed daily as the natural logarithm
of the time-weighted intraday bid-ask spreads reported in the TAQ dataset: SPREADit =
ln(ASKit −BIDit
). The results of the bid-ask spread event studies are presented in Table
VI. The table shows that the bid-ask spread decreases for almost all news categories, and the
decrease is significant for 39 out of 60 categories. These results are consistent with Tetlock
(2010), who shows that the price impact of order flow is substantially lower on news days, and
in the following five days, implying that public news releases reduce informational asymmetry
in the market.
Chae (2005) investigates what happens to the information environment of the firm prior
to scheduled and unscheduled information releases; for his study, he considers three classes of
news: (1) earnings announcements, (2) announcements made by corporate targets, and (3)
announcements by acquirers about upcoming acquisitions. The first class of announcements
is classified as scheduled news and the latter two as unscheduled news. Chae finds that
the informational asymmetry, measured as the price impact of trade, is lower before both
scheduled and unscheduled announcements. Even though it is not known in advance that
an unscheduled announcement is coming, he hypothesizes that market makers can infer the
higher-than-usual likelihood of informed trading from their order books. Consequently, after
37The results are similar when we shorten the estimation window to 30 days.
28

either scheduled or unscheduled news are announced, the bid-ask spreads should narrow. The
press releases in our dataset are mostly unscheduled, and we indeed find that the spreads
decline following most types of announcements.
Prior literature has researched bid-ask spread responses to a variety of news. Graham,
Koski, and Loewenstein (2006) study changes in bid-ask spreads around dividend announce-
ments. They subdivide such announcements into two groups: those whose timing is highly
predictable because they are made at roughly the same time every quarter and announce-
ments of dividend initiations, which cannot be anticipated in advance. The authors find
that spreads significantly decrease in the period of up to three days following the regularly
scheduled dividend announcements and significantly increase in the following two days for
the unanticipated dividend initiation announcements. We do not attempt to infer whether
the timing of dividend announcements can be predicted in our sample and find that spreads
decrease following all types of dividend announcements with the exception of dividend in-
creases, a category that incidentally includes dividend initiations.
Investigating the effect of earnings announcements on bid-ask spreads, Affleck-Graves,
Callahan, and Chipalkatti (2002) show that spreads significantly decrease in the three days
following earnings announcements for firms with difficult-to-forecast earnings; such firms also
experience widened bid-ask spreads in the three days leading up to the earnings announce-
ment. For firms with easily predictable earnings, spreads are roughly unchanged both before
and after the earnings announcement. In our sample, spreads are unchanged following the
announcements of positive earnings surprises and decline following announcements of nega-
tive earnings surprises. Since during our time period it was not uncommon for management
to guide analysts to beatable earnings forecasts, one could argue that the latter category
includes firms with difficult-to-forecast earnings.
Consistently with our result, Franz, Rao, and Tripathy (1995) show that bid-ask spreads
on NASDAQ-traded stocks narrow after announcements of open-market stock repurchases.
They argue that this happens because such announcements reduce the level of informational
asymmetry by signaling managers’ private information about the future prospects of a firm.
29

Conrad and Niden (1992) look into changes in the bid-ask spreads of 42 NYSE-traded
acquisition targets, following announcements that appeared in the Wall Street Journal. They
find that the spreads significantly decrease on days t = −1 and t = 0. We also find a large,
significant decline in the spreads for target firms; in fact, the magnitude of the decline is the
second largest of all significant categories. The largest decline observed is around negative
earnings pre-announcements, and the third largest is around announcements of class action
lawsuits.
Finally, turning to announcements revealing the progress of firms’ R&D projects, such
as press releases about in-house research outcomes and FDA decisions, all of them show
significant declines in spreads with the exception of announcements about research failures;
for this category the spread decline, though large in magnitude, is insignificant. This is in
line with the evidence presented in Aboody and Lev (2000) that R&D-related information
is a source of considerable informational advantage to corporate insiders who realize large
trading gains. Making this information public should, therefore, greatly reduce the level of
informational asymmetry of firms involved in R&D.
Turnover. Turnover is calculated as the natural logarithm of daily trading volume divided
by shares outstanding. Campbell, Grossman, and Wang (1993) notice that the market log-
turnover series is non-stationary, with a positive time trend, and suggest detrending it by the
moving average to achieve stationarity. We, therefore, detrend individual stocks’ log-turnover
by the past-100-day moving average.38
The results for the turnover event studies are presented in Table VII. The table shows
that turnover changes significantly around 22 out of 60 types of news announcements. The
largest increases in turnover accompany reverse stock splits, positive pre-announcements,
and the announcements of better-than-expected earnings. In general, increases in turnover
tend to be larger around positive announcements (such as new products, FDA approvals,
customer wins, dividend increases, lawsuit settlements, good outcomes of research projects,
38During our sample period, high-frequency algorithmic trading became more prevalent, sometimes causinglarge swings in volume. In order to mitigate the influence of the outliers, we trim the top and bottom 1% ofobservations for both the turnover and the bid-ask spread series. However, the turnover series still remainsquite volatile and, as a consequence, the non-parametric tests tend to indicate more universally significantturnover increases around press releases than the parametric tests, which are more influenced by outliers.
30

etc.) than negative announcements, some of which even lead to significant declines in turnover
(e.g., announcements and pre-announcements of disappointing earnings, low profitability,
SEOs, and class-action lawsuits). This asymmetric volume response is consistent with prior
empirical evidence, summarized by Karpoff (1987), that for equities, volume is positively
correlated with returns (as well as absolute returns). An empirically supported explanation
for the asymmetric volume response to news is costly short sales. Indeed, Barber and Odean
(2008) show that retail investors are more likely to buy stocks that are in the news, however,
short-sale costs may prevent those who do not already hold the stock from selling it in
response to bad news. Additionally, stock owners may be unwilling to sell shares at a loss
following a negative announcement due to the disposition effect.
Prior research on volume reactions to corporate news mainly centered on the response
to earnings and dividend announcements and showed that these types of announcements
are accompanied by higher-than-usual trading volume (e.g., Bajaj and Vijh (1995), Bam-
ber and Cheon (1995), Kandel and Pearson (1995), Bamber, Barron, and Stober (1997),
Affleck-Graves, Callahan, and Chipalkatti (2002), Chae (2005), and Graham, Koski, and
Loewenstein (2006)). We observe the same, with the exception of announcements of disap-
pointing earnings. Earnings and dividend announcements are typically scheduled in advance,
and if liquidity traders can refrain from trading until after the information is made public in
order to avoid adverse selection, post-announcement volume should increase.
The news categories in our dataset that are unrelated to earnings or dividends likely
contain unscheduled news. Reasons other than discretionary liquidity trading, such as belief
revisions or portfolio rebalancing discussed earlier, may be driving investor trading responses
around unscheduled news. There are fewer investigations on the volume reaction around
unscheduled announcements. Among them are the aforementioned paper by Conrad and
Niden (1992) and a study by Sanders Jr. and Zdanowicz (1992) investigating acquisition
announcements for 30 target firms; both find that the target firm trading volume increases
significantly on days t = −1 and t = 0. Based on the non-parametric test, we also find that
target-firm trading volume significantly increases in our event window.
31

IV. Conclusion
For this paper we have collected a unique dataset of corporate press releases. As a conse-
quence of more strenuous reporting requirements mandated by new regulations, these an-
nouncements represent a comprehensive set of corporate news which have the potential to
materially affect firm valuations. Moreover, the time stamp on the press releases accurately
captures the time at which market participants first learned the news. This dataset therefore
allows us to conduct event studies on a comprehensive set of corporate news while apply-
ing the same test design across all news categories. Our contribution lies in describing and
classifying important corporate events into news categories and in analyzing how the market
reacts to the different types of news in terms of immediate changes in firm valuations and in
the firms’ information environments. We confirm earlier findings on the reactions to financial
news and show that less frequently researched news about corporate strategy, products, the
management team, and legal developments are also highly value-relevant. Moreover, we show
that volatility tends to increase following most types of announcements, and attribute these
volatility increases to higher levels of news-induced valuation uncertainty. At the same time,
as expected by regulators, press releases remove the informational advantage of firm insiders,
resulting in lower post-announcement bid-ask spreads.
32

References
Aboody, David, and Baruch Lev, 2000, Information asymmetry, R&D, and insider gains,Journal of Finance 55, 2747–2766.
Admati, Anat, and Paul Pfleiderer, 1988, Theory of intraday patterns: Volume and pricevariability, Review of Financial Studies 1, 3–40.
Affleck-Graves, John, Carolyn M. Callahan, and Niranjan Chipalkatti, 2002, Earnings pre-dictability, information asymmetry, and market liquidity, Journal of Accounting Research40, 561–583.
Akhigbe, Aigbe, John C. Easterwood, and R. Richardson Pettit, 1997, Wealth effects ofcorporate debt issues: The impact of issuer motivations, Financial Management 26, 32–47.
Andersen, Torben G., and Luca Benzoni, 2009, Realized volatility, in Torben G. Andersen,Richard A. Davis, Jens-Peter Kreiss, and Thomas Mikosch, eds.: Handbook of FinancialTime Series (Springer, New York ).
Andersen, Torben G., Tim Bollerslev, and Francis X. Diebold, 2007, Roughing it up: Includ-ing jump components in measuring, modeling, and forecasting of asset return volatility,Review of Economics and Statistics 89, 701–720.
Andersen, Torben G., Tim Bollerslev, Francis X. Diebold, and Paul Labys, 2003, Modelingand forecasting realized volatility, Econometrica 71, 579–625.
Andrade, Gregor, Mark Mitchell, and Erik Stafford, 2001, New evidence and perspectives onmergers, Journal of Economic Perspectives 15, 103–120.
Antweiler, Werner, and Murray Z. Frank, 2004, Information content of internet stock messageboards, Journal of Finance 59, 1259–1294.
Antweiler, Werner, and Murray Z. Frank, 2005, Do US stock markets typically overreact tocorporate news stories?, Working paper.
Asquith, Paul, and David W. Mullins Jr., 1986, Signalling with dividends, stock repurchases,and equity issues, Financial Management 15, 27–44.
Asquith, Paul, and David W. Mullins Jr., 1983, The impact of initiating dividend paymentson shareholders’ wealth, Journal of Business 56, 77–96.
Austin, David H., 1993, An event-study approach to measuring innovative output: The caseof biotechnology, American Economic Review 83, 253–258.
Bajaj, Mukesh, and Anand M. Vijh, 1995, Trading behavior and the unbiasedness of themarket reaction to dividend announcements, Journal of Finance 50, 255–279.
Ball, Ray, and S. P. Kothari, 1991, Security returns around earnings announcements, Ac-counting Review 66, 718–738.
33

Bamber, Linda Smith, Orie E. Barron, and Thomas L. Stober, 1997, Trading volume anddifferent aspects of disagreement coincident with earnings announcements, Accounting Re-view 72, 575–597.
Bamber, Linda Smith, and Youngsoon Susan Cheon, 1995, Differential price and volumereactions to accounting earnings announcements, Accounting Review 70, 417–441.
Barber, Brad M., and Masako N. Darrough, 1996, Product reliability and firm value: Theexperience of American and Japanese automakers, 1973-1992, Journal of Political Economy104, 1084–1099.
Barber, Brad M., and Terrence Odean, 2008, All that glitters: The effect of attention on thebuying behavior of individual and institutional investors, Review of Financial Studies 21,785–818.
Bhagat, Sanjai, James A. Brickley, and Jeffrey L. Coles, 1994, The costs of inefficient bar-gaining and financial distress: Evidence from corporate lawsuits, Journal of FinancialEconomics 35, 221–247.
Bhagat, Sanjai, and Roberta Romano, 2002, Event studies and the law—part I: Techniqueand corporate litigation, American Law and Economics Review 4, 141–168.
Bizjak, John M., and Jeffrey L. Coles, 1995, The effect of private antitrust litigation on thestock-market valuation of the firm, American Economic Review 85, 436–461.
Bloom, Nicholas, and John Van Reenen, 2002, Patents, real options and firm performance,Economic Journal 112, C97–C116.
Bosch, Jean-Claude, and Insup Lee, 1994, Wealth effects of Food and Drug Administration(FDA) decisions, Managerial and Decision Economics 15, 589–599.
Brealey, Richard A., Stewart C. Myers, and Franklin Allen, 2006, Principles of CorporateFinance. (McGraw-Hill New York).
Callen, Jeffrey L., Joshua Livnat, and Dan Segal, 2006, Accounting restatements: Are theyalways bad for investors?, Journal of Investing 15, 57–68.
Campbell, John Y., Sanford J. Grossman, and Jiang Wang, 1993, Trading volume and serialcorrelation in stock returns, Quarterly Journal of Economics 108, 905–939.
Chae, Joon, 2005, Trading volume, information asymmetry, and timing information, Journalof Finance 60, 413–442.
Chan, Wesley S., 2003, Stock price reaction to news and no-news: Drift and reversal afterheadlines, Journal of Financial Economics 70, 223–260.
Chaney, Paul K., Timothy M. Devinney, and Russell S. Winer, 1991, The impact of newproduct introductions on the market value of firms, Journal of Business 64, 573–610.
Clayton, Matthew C., Jay C. Hartzell, and Joshua Rosenberg, 2005, The impact of CEOturnover on equity volatility, Journal of Business 78, 1779–1808.
34

Comment, Robert, and Gregg A. Jarrell, 1991, The relative signalling power of dutch-auctionand fixed-price self-tender offers and open-market repurchases, Journal of Finance 46,1243–1271.
Conrad, Jennifer, and Cathy M. Niden, 1992, Order flow, trading costs and corporate acqui-sition announcements, Financial Management 21, 22–21.
Corwin, Shane A., 2003, The determinants of underpricing for seasoned equity offers, Journalof Finance 58, 2249–2279.
Cready, William M., and David N. Hurtt, 2002, Assessing investor response to informationevents using return and volume metrics, Accounting Review 77, 891–909.
Daniel, Kent, David Hirshleifer, and Avanidhar Subrahmanyam, 1998, Investor psychologyand security market under- and overreactions, Journal of Finance 53, 1839–85.
Das, Sanjiv R., and Michael Chen, 2007, Yahoo for Amazon! Sentiment extraction fromsmall talk on the web, Management Science 53, 1375–1388.
Davidson III, Wallace N., and Dan L. Worrell, 1992, The effect of product recall announce-ments on shareholder wealth, Strategic Management Journal 13, 467–473.
Dougal, Casey, Joseph Engelberg, Diego Garcia, and Christopher Parsons, forthcoming, Jour-nalists and the stock market, Review of Financial Studies.
Dravid, Ajay R., 1987, A note on the behavior of stock returns around ex-dates of stockdistributions, Journal of Finance 42, 163–168.
Dubofsky, David A., 1991, Volatility increases subsequent to NYSE and AMEX stock splits,Journal of Finance 46, 421–432.
Engelberg, Joseph, 2008, Costly information processing: Evidence from earnings announce-ments, Working paper.
Foster, F. Douglas, and S. Viswanathan, 1990, A theory of the interday variations in volume,variance, and trading costs in securities markets, Review of Financial Studies 3, 593–624.
Franks, Julian, Robert Harris, and Sheridan Titman, 1991, The postmerger share-price per-formance of acquiring firms, Journal of Financial Economics 29, 81–96.
Franz, Diana R., Ramesh P. Rao, and Niranjan Tripathy, 1995, Informed trading risk andbid-ask spread changes around open market stock repurchases in the NASDAQ market,Journal of Financial Research 18, 311–327.
Glosten, Lawrence R., and Paul R. Milgrom, 1985, Bid, ask and transaction prices in aspecialist market with heterogeneously informed traders, Journal of Financial Economics14, 71–100.
Graham, John R., Jennifer L. Koski, and Uri Loewenstein, 2006, Information flow and liquid-ity around anticipated and unanticipated dividend announcements, Journal of Business79, 2301–2336.
35

Griffin, Paul A., Joseph Grundfest, and Michael A. Perino, 2004, Stock price response tonews of securities fraud litigation: An analysis of sequential and conditional information,Abacus 40, 21–48.
Grullon, Gustavo, and Roni Michaely, 2004, The information content of share repurchaseprograms, Journal of Finance 59, 651–680.
Grundy, Bruce D., and Youngsoo Kim, 2002, Stock market volatility in a heterogeneousinformation economy, Journal of Financial and Quantitative Analysis 37, 1–27.
Hansen, Peter R., and Asger Lunde, 2006, Realized variance and market microstructure noise,Journal of Business & Economic Statistics 24, 127–161.
Healy, Paul, and Krishna Palepu, 1988, Earnings information conveyed by dividend initiationsor omissions, Journal of Financial Economics 21, 149–175.
Hendricks, Kevin B., and Vinod R. Singhal, 1996, Quality awards and the market value ofthe firm: An empirical investigation, Management Science 42, 415–436.
Ikenberry, David L., Graeme Rankine, and Earl K. Stice, 1996, What do stock splits reallysignal?, Journal of Financial and Quantitative Analysis 31, 357–375.
Jarrell, Gregg, and Sam Peltzman, 1985, The impact of product recalls on the wealth ofsellers, Journal of Political Economy 93, 512–536.
Jensen, Michael C., 1993, The modern industrial revolution, exit, and the failure of internalcontrol systems, Journal of Finance 48, 831–880.
Kandel, Eugene, and Neil D. Pearson, 1995, Differential interpretation of public signals andtrade in speculative markets, Journal of Political Economy 103, 831–72.
Karpoff, Jonathan M., 1986, A theory of trading volume, Journal of Finance 41, 1069–1087.
Karpoff, Jonathan M., 1987, The relation between price changes and trading volume: Asurvey, Journal of Financial and Quantitative Analysis 22, 109–126.
Kim, Oliver, and Robert E. Verrecchia, 1994, Market liquidity and volume around earningsannouncements, Journal of Accounting and Economics 17, 41–67.
Koski, Jennifer L., 1998, Measurement effects and the variance of returns after stock splitsand stock dividends, Review of Financial Studies 11, 143–162.
Kothari, S. P., 2001, Capital markets research in accounting, Journal of Accounting andEconomics 31, 105–231.
Kyle, Albert S., 1985, Continuous auctions and insider trading, Econometrica 53, 1315–1335.
Lakonishok, Josef, and Theo Vermaelen, 1990, Anomalous price behavior around repurchasetender offers, Journal of Finance 45, 455–477.
McConnell, John J., and Timothy J. Nantell, 1985, Corporate combinations and commonstock returns: The case of joint ventures, Journal of Finance 40, 519–536.
36

Merton, Robert C., 1987, A simple model of capital market equilibrium with incompleteinformation, Journal of Finance 42, 483–510.
Miller, Merton H., and Kevin Rock, 1985, Dividend policy under asymmetric information,Journal of Finance 40, 1031–1051.
Myers, Stewart, and Nicholas S. Majluf, 1984, Corporate financing and investment decisionswhen firms have information that investors do not have, Journal of Financial Economics13, 187–221.
Myers, Stewart C., 1984, The capital structure puzzle, Journal of Finance 39, 575–592.
Nanda, Vikram, 1991, On the good news in equity carve-outs, Journal of Finance 46, 1717–37.
Ohlson, James A., and Stephen H. Penman, 1985, Volatility increases subsequent to stocksplits: An empirical aberration, Journal of Financial Economics 14, 251–266.
Raghu, T. S., Wonseok Woo, S. B. Mohan, and H. Raghav Rao, 2008, Market reaction topatent infringement litigations in the information technology industry, Information Sys-tems Frontiers 10, 61–75.
Sanders Jr., Ralph W., and John Zdanowicz, 1992, Target firm abnormal returns and tradingvolume around the initiation of changes in control transactions, Journal of Financial andQuantitative Analysis 27, 109–129.
Schipper, Katherine, and Abbie Smith, 1983, Effects of recontracting on shareholder wealth:The case of voluntary spin-offs, Journal of Financial Economics 12, 437–467.
Shyam-Sunder, Lakshmi, 1991, The stock price effect of risky versus safe debt, Journal ofFinancial and Quantitative Analysis 26, 549–558.
Singh, Ajai K., Mir A. Zaman, and Chandrasekhar Krishnamurti, 1994, Liquidity changesassociated with open market repurchases, Financial Management 23, 47–55.
Smith, Clifford, 1986, Investment banking and the capital acquisition process, Journal ofFinancial Economics 15, 3–29.
Stice, Earl K., 1991, The market reaction to 10-K and 10-Q filings and to subsequent TheWall Street Journal earnings announcements, Accounting Review 66, 42–55.
Tetlock, Paul C., 2007, Giving content to investor sentiment: The role of media in the stockmarket, Journal of Finance 62, 1139–1168.
Tetlock, Paul C., 2010, Does public financial news resolve asymmetric information?, Reviewof Financial Studies 23, 3520–3557.
Tetlock, Paul C., 2011, All the news that’s fit to reprint: Do investors react to stale infor-mation?, Review of Financial Studies 24, 1481–1512.
Tetlock, Paul C., Maytal Saar-Tsechansky, and Sofus Macskassy, 2008, More than words:Quantifying language to measure firms’ fundamentals, Journal of Finance 63, 1437–1467.
37

Vega, Clara, 2006, Stock price reaction to public and private information, Journal of Finan-cial Economics 82, 103–133.
Verrecchia, Robert E., 1981, On the relationship between volume reaction and consensus ofinvestors: Implications for interpreting tests of information content, Journal of AccountingResearch 19, 271–283.
Woolridge, J. Randall, and Donald R. Chambers, 1983, Reverse splits and shareholder wealth,Financial Management 12, 5–15.
Woolridge, J. Randall, and Charles C. Snow, 1990, Stock market reaction to strategic invest-ment decisions, Strategic Management Journal 11, 353–363.
Yildizhan, Celim, 2009, Stock splits, a survey, Working paper.
Yoon, Pyung Sig, and Laura T. Starks, 1995, Signaling, investment opportunities, and divi-dend announcements, Review of Financial Studies 8, 995–1018.
38
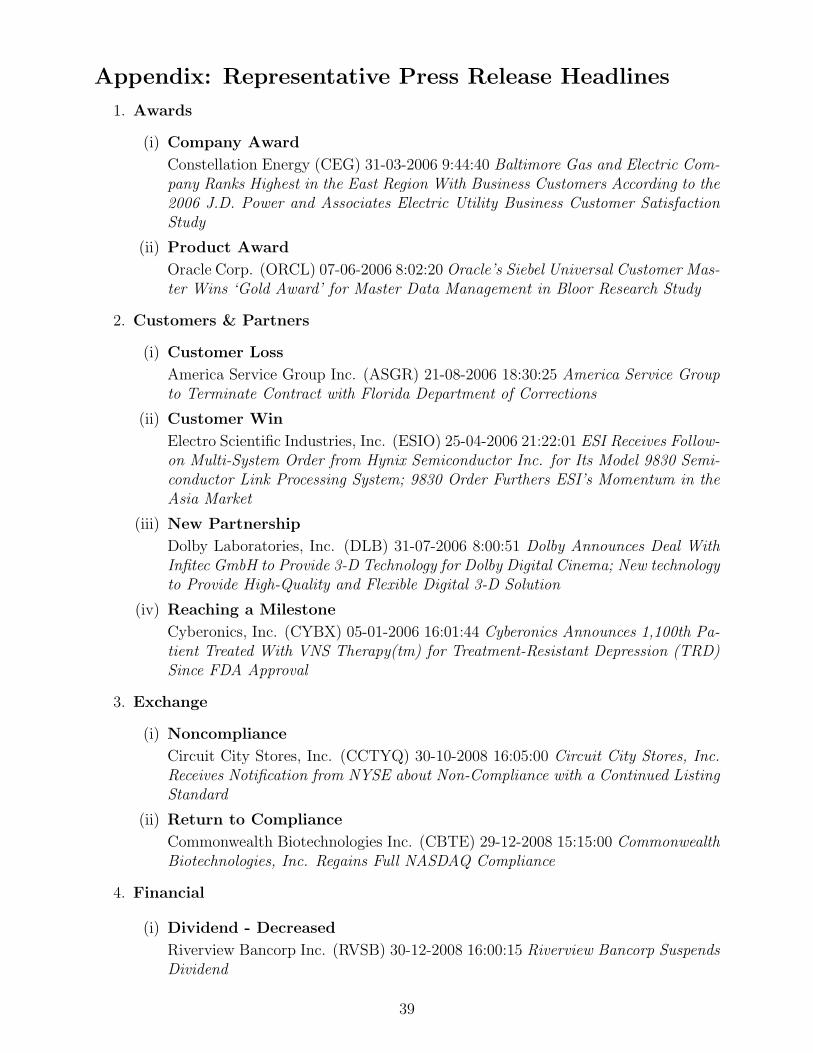
Appendix: Representative Press Release Headlines
1. Awards
(i) Company Award
Constellation Energy (CEG) 31-03-2006 9:44:40 Baltimore Gas and Electric Com-pany Ranks Highest in the East Region With Business Customers According to the2006 J.D. Power and Associates Electric Utility Business Customer SatisfactionStudy
(ii) Product Award
Oracle Corp. (ORCL) 07-06-2006 8:02:20 Oracle’s Siebel Universal Customer Mas-ter Wins ‘Gold Award’ for Master Data Management in Bloor Research Study
2. Customers & Partners
(i) Customer Loss
America Service Group Inc. (ASGR) 21-08-2006 18:30:25 America Service Groupto Terminate Contract with Florida Department of Corrections
(ii) Customer Win
Electro Scientific Industries, Inc. (ESIO) 25-04-2006 21:22:01 ESI Receives Follow-on Multi-System Order from Hynix Semiconductor Inc. for Its Model 9830 Semi-conductor Link Processing System; 9830 Order Furthers ESI’s Momentum in theAsia Market
(iii) New Partnership
Dolby Laboratories, Inc. (DLB) 31-07-2006 8:00:51 Dolby Announces Deal WithInfitec GmbH to Provide 3-D Technology for Dolby Digital Cinema; New technologyto Provide High-Quality and Flexible Digital 3-D Solution
(iv) Reaching a Milestone
Cyberonics, Inc. (CYBX) 05-01-2006 16:01:44 Cyberonics Announces 1,100th Pa-tient Treated With VNS Therapy(tm) for Treatment-Resistant Depression (TRD)Since FDA Approval
3. Exchange
(i) Noncompliance
Circuit City Stores, Inc. (CCTYQ) 30-10-2008 16:05:00 Circuit City Stores, Inc.Receives Notification from NYSE about Non-Compliance with a Continued ListingStandard
(ii) Return to Compliance
Commonwealth Biotechnologies Inc. (CBTE) 29-12-2008 15:15:00 CommonwealthBiotechnologies, Inc. Regains Full NASDAQ Compliance
4. Financial
(i) Dividend - Decreased
Riverview Bancorp Inc. (RVSB) 30-12-2008 16:00:15 Riverview Bancorp SuspendsDividend
39

(ii) Dividend - Generic
NSC Groupe SA (NSC) 25-04-2006 9:41:49 Norfolk Southern Declares QuarterlyDividend
(iii) Dividend - Increased
Transatlantic Holdings Inc. (TRH) 21-05-2009 17:07:00 Transatlantic Holdings,Inc. Raises Quarterly Common Stock Dividend 5.3 Percent
(iv) Dividend - Preferred Stock
Freeport-McMoRan Copper & Gold Inc. (FCX) 30-12-2008 12:21:00 Freeport-McMoRan Copper & Gold Inc. Declares Quarterly Cash Dividends on PreferredStocks
(v) Dividend - Special Dividend
National Technical Systems Inc. (NTSC) 12-05-2009 07:30:01 National TechnicalSystems Declares Special Dividend
(vi) Financial Results - Strong
Kennametal Inc. (KMT) 26-04-2006 7:30:39 Kennametal Reports Strong ThirdQuarter
(vii) Financial Results - Weak
Silicon Motion Technology Corp. (SIMO) 27-04-2006 17:00:43 Silicon MotionTechnology Corporation Announces First Quarter Results for the Period EndedMarch 31, 2006: Market Conditions Contribute to Sequential Weakness but GrowthExpected to Pick Up in Q2
(viii) Pre-Announcement - Negative
Keynote Systems, Inc. (KEYN) 04-03-2006 7:30:02 Keynote’s Preliminary SecondQuarter 2006 Revenue Below Expectations
(ix) Pre-Announcement - Positive
OM Group, Inc. (OMG) 25-04-2006 7:01:50 OM Group Increases Outlook for 2006First Quarter Earnings Per Share
(x) Restatement
Richardson Electronics, Ltd. (RELL) 04-04-2006 19:00:27 Richardson Electronics,Ltd. to Restate its Financial Statements
(xi) Secondary Offering - Debt
Dean Foods Company (DF) 05-10-2006 6:30:27 Dean Foods Announces Launch of$300 Million Senior Notes Public Offering
(xii) Secondary Offering - Equity
Kimco Realty Corporation (KIM) 30-03-2006 8:01:40 Kimco Announces Offeringof 10 Million Shares of Common Stock
(xiii) Share Buyback
AO Smith Corp. (AOS) 02-20-2007 11:00:00 A. O. Smith Announces Stock Re-purchase Program
(xiv) Stock Split - Forward
Cascade Financial Corporation (CASB) 25-04-2006 20:00:10 Cascade FinancialCorporation Declares 5-for-4 Stock Split
40

(xv) Stock Split - Reverse
Idera Pharmaceuticals, Inc. (IDRA) 22-06-2006 9:00:12 Idera Pharmaceuticals toEffect a Reverse Stock Split
5. Legal
(i) Class Action
H&R Block, Inc. (HRB) 30-03-2006 12:49:45 H&R Block – HRB – “Express IRA”Customers Launch Class Action Suit – Lawyers at KGS Announce Filing
(ii) Legal Problems
LifePoint Hospitals, Inc. (LPNT) 17-04-2006 14:07:01 Dissident Stockholder FilesSuit against LifePoint Hospitals, Inc.
(iii) SEC Investigation
One Liberty Properties, Inc. (OLP) 21-06-2006 16:30:01 One Liberty PropertiesReceives Notification of Formal Investigation from the SEC
(iv) Settlement
Freddie Mac (FRE) 18-04-2006 15:53:42 Freddie Mac Settles With Federal ElectionCommission
6. M&A
(i) Acquisition - Certain
Enstar Group Limited (ESGR) 30-03-2006 08:41:45 The Enstar Group, Inc. An-nounces Completion of Acquisition of Reinsurance Company
(ii) Acquisition - Intent
SafeNet Inc. (SFNT) 31-03-2006 07:30:01 U.K. Government Refers PotentialSafeNet Inc. Acquisition of nCipher for Further Review
(iii) Acquisition - Target
Pomeroy IT Solutions Inc. (PMRY) 25-09-2009 16:40:00 Pomeroy IT Solutions,Inc. Announces Agreement To Be Acquired by Platinum Equity for $6.50 PerShare in Cash
(iv) IPO
CapitalSource Inc. (CSE) 06-08-2008 17:35:00 CapitalSource Announces Filing ofRegistration Statement for IPO of Healthcare Net Lease Business
(v) Merger
WebMD Health Corp. (WBMD) 18-06-2009 07:47:00 HLTH Corporation andWebMD Health Corp. Announce Agreement to Merge
(vi) Spinoff - Certain
Level 3 Communications, Inc. (LVLT) 20-07-2006 16:19:01 Level 3 Signs Agree-ment to Sell Software Spectrum Subsidiary for $287 Million
(vii) Spinoff - Intent
International Rectifier Corporation (IRF) 12-04-2006 16:33:01 International Rec-tifier Exploring Potential Sale of All Non-Focus Products Business
41

7. Management
(i) Addition
Guest-Tek Interactive Entertainment Ltd. (GTK) 25-04-2006 9:03:26 Lottery In-dustry Veteran Connie Laverty Joins GTECH as Senior Vice President and ChiefMarketing Officer
(ii) Compensation
Duke Energy Corporation (DUK) 04-06-2006 16:05:31 Duke Energy Releases De-tails of CEO Compensation Package
(iii) Promotion
Health Net Inc. (HNT) 13-04-2006 14:50:05 Health Net of Oregon Names BrendaBruns Chief Medical Officer
(iv) Reorganization
Sony Corporation (SNE) 12-04-2006 18:36:41 Sony Pictures Home EntertainmentAnnounces Reorganization
(v) Retirement
Safeguard Scientifics, Inc. (SFE) 24-05-2006 11:37:01 Safeguard Scientifics An-nounces Retirement of Directors Anthony L. Craig and Robert Ripp
(vi) Termination
Energy Partners, Ltd. (EPL) 19-04-2006 18:07:01 EPL Announces Departure ofDavid Looney as Chief Financial Officer
8. Meetings and Events
(i) Company Sponsored
Arrow Electronics, Inc. (ARW) 26-04-2006 17:16:01 Arrow Electronics Works withTechnology Suppliers to Facilitate 2006 Open Architecture Seminars
(ii) Industry Event
Aspect Medical Systems, Inc. (ASPM) 25-04-2006 9:45:01 Aspect Medical to We-bcast Presentation at Deutsche Bank 31st Annual Health Care Conference on May2, 2006
(iii) Investor Meeting
NS Group Inc. (NSS) 16-06-2006 9:26:01 NS Group to Present at the NIRI Re-gional Investor Conference in Cincinnati, Ohio; Presentation June 20th
9. Products and Services
(i) FDA Approval
General Electric Company (GE) 20-04-2006 9:00:07 U.S. FDA Approves GE Health-care’s Next-Generation Digital Mammography System for Improved Breast Care
(ii) FDA Investigation
Pharmacyclics, Inc. (PCYC) 05-09-2006 7:30:56 Pharmacyclics to Submit NewDrug Application for Xcytrin(R) for Treatment of Lung Cancer Patients WithBrain Metastases
42

(iii) FDA Rejection
Cephalon, Inc. (CEPH) 08-09-2006 17:02:18 Cephalon Receives Non-ApprovableLetter on SPARLON(TM)
(iv) New Product
Nokia Corporation (NOK) 25-04-2006 5:44:57 Digitally Divine Nokia N73 - theUltimate Challenge to the Digital Camera
(v) Patent Award
Assurant, Inc. (AIZ) 28-06-2006 12:50:04 Assurant Awarded Patents for Call Pro-cessing System
(vi) Pharmaceutical Approval EU
Biogen Idec Inc. (BIIB) 29-06-2006 2:30:21 TYSABRI(R) Receives Approval inEuropean Union for the Treatment of Relapsing Remitting Forms of Multiple Scle-rosis
(vii) Product Approval
Broadridge Financial Solutions Inc. (BR) 11-10-2008 9:26:51 Broadridge FinancialSolutions Receives ISO 27001 Certification for Information Security ManagementSystems
(viii) Product Defect
Johnson & Johnson (JNJ) 31-03-2006 17:08:26 Ortho-Clinical Diagnostics Issuesa Voluntary Product Recall for VITROS(R) Immunodiagnostic Products SignalReagent
(ix) Research Failure
Bristol Myers Squibb Co. (BMY) 18-05-2006 14:00:30 Bristol-Myers Squibb An-nounces Discontinuation of Development of Muraglitazar, an Investigational OralTreatment for Type 2 Diabetes
(x) Research Success
CEL-SCI Corp. (CVM) 19-04-2006 09:35:28 CEL-1000 Peptide Shows AdjuvantActivity with Malaria Vaccines
(xi) Updates & Upgrades
Sony Corporation (SNE) 06-01-2006 13:00:28 Sony Strengthens BRAVIA Flat-Panel LCD Line With Full HD Models and 1080p Inputs
10. Strategy & Performance
(i) Credit News - Negative
Affiliated Computer Services, Inc. (ACS) 20-03-2007 15:49:27 Fitch Places Affili-ated Computer Services on Rating Watch Negative on LBO Offer
(ii) Credit News - Positive
Autonation Inc. (AN) 03-04-2006 8:47:50 AutoNation, Inc. Receives Lender Com-mitments for $600 Million Term Loan
(iii) Infrastructure - Downsizing
Furniture Brands International, Inc. (FBN) 05-02-2006 16:46:01 Thomasville Fur-niture Industries Announces Closing of Case Goods Manufacturing Facility
43

(iv) Infrastructure - Expansion
Verizon Communications Inc. (VZ) 25-04-2006 8:57:07 Verizon Wireless ExpandsIts Network in Rensselaer County
(v) Profitability - Declining
Williams-Sonoma, Inc. (WSM) 08-01-2009 06:00:03 Williams-Sonoma, Inc. An-nounces a 22.6% Decrease in 2008 Holiday Revenues
(vi) Profitability - Improving
GlaxoSmithKline plc (GSK) 22-07-2009 08:07:00 GSK - Improving Performanceto Continue in Second Half
44
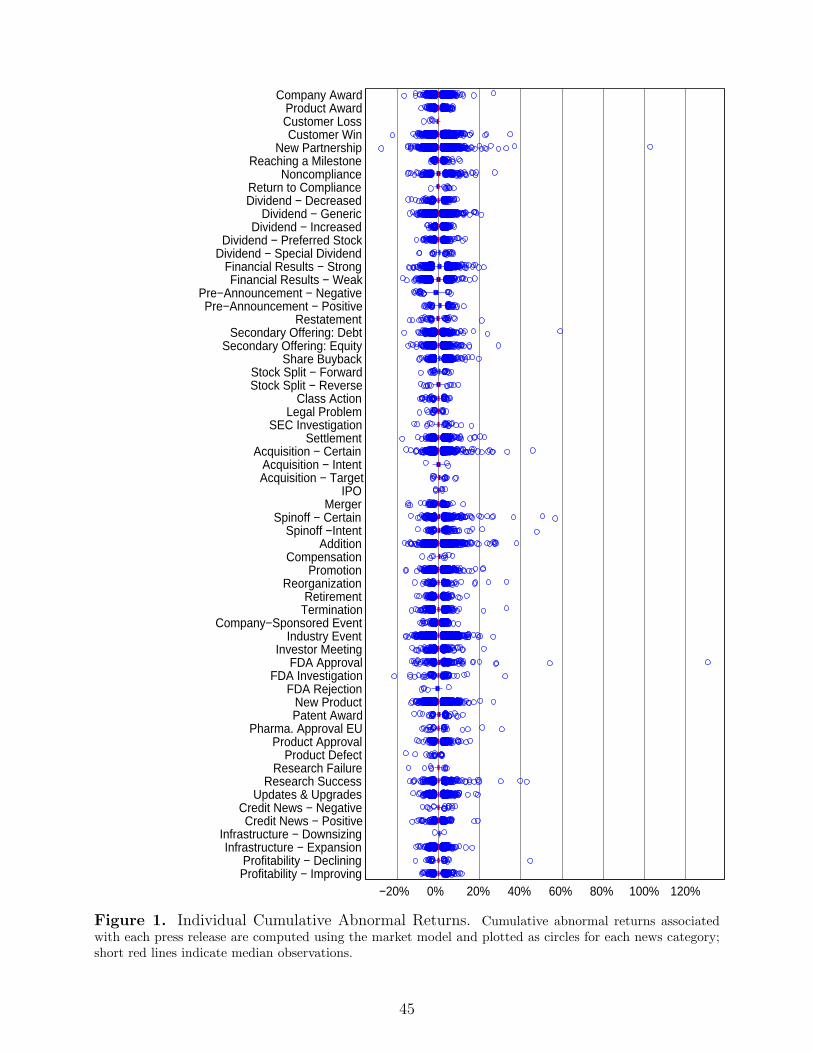
−20% 0% 20% 40% 60% 80% 100% 120%Profitability − ImprovingProfitability − Declining
Infrastructure − ExpansionInfrastructure − Downsizing
Credit News − PositiveCredit News − Negative
Updates & UpgradesResearch Success
Research FailureProduct Defect
Product ApprovalPharma. Approval EU
Patent AwardNew Product
FDA RejectionFDA Investigation
FDA ApprovalInvestor Meeting
Industry EventCompany−Sponsored Event
TerminationRetirement
ReorganizationPromotion
CompensationAddition
Spinoff −IntentSpinoff − Certain
MergerIPO
Acquisition − TargetAcquisition − Intent
Acquisition − CertainSettlement
SEC InvestigationLegal Problem
Class ActionStock Split − ReverseStock Split − Forward
Share BuybackSecondary Offering: Equity
Secondary Offering: DebtRestatement
Pre−Announcement − PositivePre−Announcement − Negative
Financial Results − WeakFinancial Results − Strong
Dividend − Special DividendDividend − Preferred Stock
Dividend − IncreasedDividend − Generic
Dividend − DecreasedReturn to Compliance
NoncomplianceReaching a Milestone
New PartnershipCustomer Win
Customer LossProduct Award
Company Award
Figure 1. Individual Cumulative Abnormal Returns. Cumulative abnormal returns associatedwith each press release are computed using the market model and plotted as circles for each news category;short red lines indicate median observations.
45
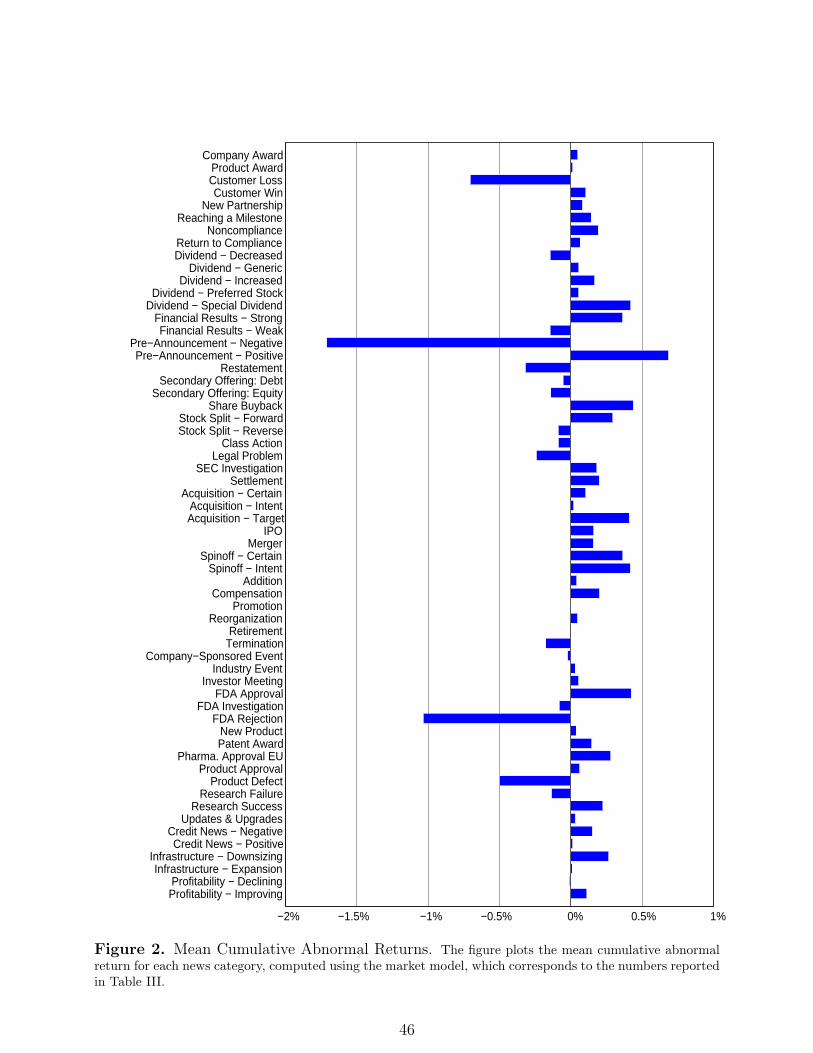
Company AwardProduct AwardCustomer LossCustomer Win
New PartnershipReaching a Milestone
NoncomplianceReturn to ComplianceDividend − Decreased
Dividend − GenericDividend − Increased
Dividend − Preferred StockDividend − Special Dividend
Financial Results − StrongFinancial Results − Weak
Pre−Announcement − NegativePre−Announcement − Positive
RestatementSecondary Offering: Debt
Secondary Offering: EquityShare Buyback
Stock Split − ForwardStock Split − Reverse
Class ActionLegal Problem
SEC InvestigationSettlement
Acquisition − CertainAcquisition − IntentAcquisition − Target
IPOMerger
Spinoff − CertainSpinoff − Intent
AdditionCompensation
PromotionReorganization
RetirementTermination
Company−Sponsored EventIndustry Event
Investor MeetingFDA Approval
FDA InvestigationFDA Rejection
New ProductPatent Award
Pharma. Approval EUProduct Approval
Product DefectResearch Failure
Research SuccessUpdates & Upgrades
Credit News − NegativeCredit News − Positive
Infrastructure − DownsizingInfrastructure − Expansion
Profitability − DecliningProfitability − Improving
−2% −1.5% −1% −0.5% 0% 0.5% 1%
Figure 2. Mean Cumulative Abnormal Returns. The figure plots the mean cumulative abnormalreturn for each news category, computed using the market model, which corresponds to the numbers reportedin Table III.
46
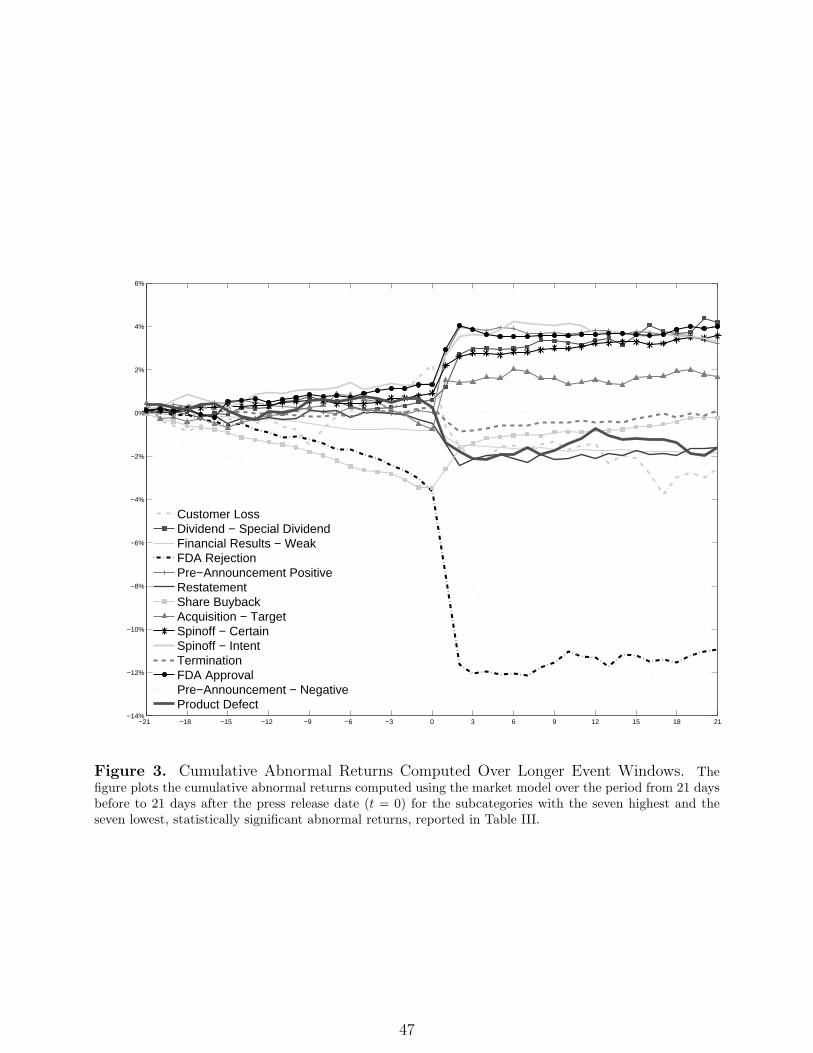
−21 −18 −15 −12 −9 −6 −3 0 3 6 9 12 15 18 21−14%
−12%
−10%
−8%
−6%
−4%
−2%
0%
2%
4%
6%
Customer LossDividend − Special DividendFinancial Results − WeakFDA RejectionPre−Announcement PositiveRestatementShare BuybackAcquisition − TargetSpinoff − CertainSpinoff − IntentTerminationFDA ApprovalPre−Announcement − NegativeProduct Defect
Figure 3. Cumulative Abnormal Returns Computed Over Longer Event Windows. Thefigure plots the cumulative abnormal returns computed using the market model over the period from 21 daysbefore to 21 days after the press release date (t = 0) for the subcategories with the seven highest and theseven lowest, statistically significant abnormal returns, reported in Table III.
47

Pre-Announcement - Positive
−21 −18 −15 −12 −9 −6 −3 0 3 6 9 12 15 18 21−0.5%
0%
0.5%
1%
1.5%
2%
2.5%
3%
3.5%
4%
FDA Approval
−21 −18 −15 −12 −9 −6 −3 0 3 6 9 12 15 18 21−0.5%
0%
0.5%
1%
1.5%
2%
2.5%
3%
3.5%
4%
4.5%
Spinoff - Intent
−21 −18 −15 −12 −9 −6 −3 0 3 6 9 12 15 18 21 0%
0.5%
1%
1.5%
2%
2.5%
3%
3.5%
4%
4.5%
Spinoff - Certain
−21 −18 −15 −12 −9 −6 −3 0 3 6 9 12 15 18 21 0%
0.5%
1%
1.5%
2%
2.5%
3%
3.5%
4%
Share Buyback
−21 −18 −15 −12 −9 −6 −3 0 3 6 9 12 15 18 21−3.5%
−3%
−2.5%
−2%
−1.5%
−1%
−0.5%
0%
Special Dividend
−21 −18 −15 −12 −9 −6 −3 0 3 6 9 12 15 18 21−0.5%
0%
0.5%
1%
1.5%
2%
2.5%
3%
3.5%
4%
4.5%
Acquisition - Target
−21 −18 −15 −12 −9 −6 −3 0 3 6 9 12 15 18 21 −1%
−0.5%
0%
0.5%
1%
1.5%
2%
2.5%
Financial Results - Strong
−21 −18 −15 −12 −9 −6 −3 0 3 6 9 12 15 18 21−0.5%
0%
0.5%
1%
1.5%
Figure 4. Plots of the Cumulative Abnormal Return for the Most Positive News Categories.For the eight news categories with the most positive, significant CARs reported in Table III, the figure plotsthe average cumulative abnormal return, computed using the market model, over the period from 21 daysbefore to 21 after the press release date (t = 0).
48

Pre-Announcement - Negative
−21 −18 −15 −12 −9 −6 −3 0 3 6 9 12 15 18 21−14%
−12%
−10%
−8%
−6%
−4%
−2%
0%
2%
Customer Loss
−21 −18 −15 −12 −9 −6 −3 0 3 6 9 12 15 18 21−4%
−3%
−2%
−1%
0%
1%
2%
3%
Restatement
−21 −18 −15 −12 −9 −6 −3 0 3 6 9 12 15 18 21−2.5%
−2%
−1.5%
−1%
−0.5%
0%
0.5%
Financial Results - Weak
−21 −18 −15 −12 −9 −6 −3 0 3 6 9 12 15 18 21 −2%
−1.8%
−1.6%
−1.4%
−1.2%
−1%
−0.8%
−0.6%
−0.4%
−0.2%
0%
FDA Rejection
−21 −18 −15 −12 −9 −6 −3 0 3 6 9 12 15 18 21−14%
−12%
−10%
−8%
−6%
−4%
−2%
0%
Product Defect
−21 −18 −15 −12 −9 −6 −3 0 3 6 9 12 15 18 21−2.5%
−2%
−1.5%
−1%
−0.5%
0%
0.5%
1%
Management - Termination
−21 −18 −15 −12 −9 −6 −3 0 3 6 9 12 15 18 21 −1%
−0.8%
−0.6%
−0.4%
−0.2%
0%
0.2%
0.4%
Dividend - Decreased
−21 −18 −15 −12 −9 −6 −3 0 3 6 9 12 15 18 21 −3%
−2.5%
−2%
−1.5%
−1%
−0.5%
0%
0.5%
Figure 5. Plots of the Cumulative Abnormal Return for the Most Negative News Categories.For the eight news categories with the most negative, significant CARs reported in Table III, the figure plotsthe average cumulative abnormal return, computed using the market model, over the period from 21 daysbefore to 21 after the press release date t = 0).
49

Table IPress Release Categories
Category Subcategory Obs. Description
1. Awards Company Award 8,445 Company being awarded for its achievements(10,486) Product Award 2,041 Company being awarded for one of its products
2. Customers & Customer Loss 56 Customer lost or orders reducedPartners Customer Win 16,946 New business from a new or an existing customer secured(35,538) New Partnership 17,795 New strategic agreement with another firm signed
Reaching a Milestone 741 Sales milestone or an anniversary reached
3. Exchange Noncompliance 736 Notice of exchange noncompliance/potential delisting received(811) Return to Compliance 75 Problems causing exchange non-compliance successfully addressed
4. Financial Dividend - Decreased 688 Dividend decrease or suspension declared(39,933) Dividend - Generic 14,424 Generic dividend declaration issued
Dividend - Increased 2,276 Dividend increase or initiation declaredDividend - Preferred Stock 852 Dividend to be paid to preferred stockholders declaredDividend - Special Dividend 130 Special dividend declaredFinancial Results - Strong 7,712 Strong financial results, e.g., high earningsFinancial Results - Weak 3,780 Weak financial results, e.g., low earningsPre-Announcement - Negative 348 Pre-announcement of weak financial resultsPre-Announcement - Positive 553 Pre-announcement of strong financial resultsRestatement 293 Revision of fiscal results or restatement of a company’s outlookSecondary Offering: Debt 2,925 Announcement of debt offering/issuanceSecondary Offering: Equity 2,629 Announcement of stock offering/issuanceShare Buyback 2,994 Initiation of a share repurchase planStock Split - Forward 268 Initiation of a forward stock splitStock Split - Reverse 61 Initiation of a reverse stock split
5. Legal Class Action 536 Class action lawsuit filed against company(2,617) Legal Problem 125 Lawsuit filed against company or appeal dropped
SEC Investigation 140 Announcement of initiation or outcome of an SEC investigationSettlement 1,816 Settlement of litigation against the firm
6. M&A Acquisition - Certain 9,376 Completed/secured approval to acquire another firm(13,206) Acquisition - Intent 45 Plan to acquire another firm being considered
Acquisition - Target 85 Target firm’s announcement of being acquiredIPO 56 Filing for Initial Public Offering of a “carved-out” subsidiaryMerger 170 Agreement to merge or completion of a mergerSpinoff - Certain 2,745 Completed/secured approval to spin off a subsidiary/line of businessSpinoff -Intent 729 Plan to spin off a subsidiary/line of business being considered
7. Management Addition 16,113 Recruitment or election of top management or board members(25,142) Compensation 53 Statements on compensation of management and employees
Promotion 5,510 Promotion of top management membersReorganization 869 Organizational change or change among the top managment/boardRetirement 1,157 Retirement of top management or board membersTermination 1,440 Resignation/departure of top management or board members
8. Meetings & Company-Sponsored Event 2,577 Company hosts or sponsors an industry eventEvents Industry Event 31,827 Presentation or participation in an industry event announced(36,793) Investor Meeting 2,389 Presentation or participation in an investor conference or meeting
9. Products & FDA Approval 1,279 Announcement of an FDA product approvalServices FDA Investigation 506 Start of an FDA investigation(31,881) FDA Rejection 36 Rejection of product by the FDA
New Product 22,568 Launch of a new service or introduction of a new productPatent Award 549 Company receives a new patentPharmaceutical Approval EU 238 Approval of a pharmaceutical product in EuropeProduct Approval 1,514 Authorization or certification of a new business or productProduct Defect 150 Issuance of a warning regarding a product or recall of a productResearch Failure 104 Failure of a research effortResearch Success 1,406 Successful completion of a research effortUpdates & Upgrades 3,531 Improvement or update of a product/service
10. Strategy & Credit News - Negative 137 Financing difficulties or debt downgradesPerformance Credit News - Positive 851 Success in securing new credit(7,214) Infrastructure - Downsizing 48 Decision to close facilities or exit certain markets
Infrastructure - Expansion 4,819 Decision to expand the firm’s business or open new facilitiesProfitability - Declining 210 Declining performance, e.g., decrease in sales or revenuesProfitability - Improving 1,149 Improving performance, e.g., increase in sales or revenues
This table provides brief descriptions of the news categories and reports the total number of press release observations in each majornews category (in parenthesis), as well as in each subcategory. The sample period is April 2006 - August 2009.
50

Table IIDescriptive Statistics on Monthly Press Release Activity
Panel A: Sample Statistics
Mean Median Std. Dev. 25% 75% Obs.0.88 0.00 0.20 0.00 1.00 203,621
Panel B: Sample Statistics by Size Quintile
NYSE-Based Quintiles Sample-Based QuintilesSize Mean Median Std. Dev. Obs. Mean Median Std. Dev. Obs.1 (small) 0.21 0.00 0.05 7,505 0.82 0.00 0.21 35,1902 0.44 0.00 0.10 19,976 0.83 0.00 0.18 35,6113 0.67 0.00 0.15 30,969 0.85 0.00 0.20 38,4684 0.96 0.00 0.21 45,642 0.91 0.00 0.23 41,7615 (large) 1.98 1.00 0.52 99,529 1.14 0.00 0.29 52,591This table presents descriptive statistics for monthly press release activity across firms. Panel A shows the statisticsfor the entire sample and Panel B shows the statistics by size quintiles. The size quintiles in Panel B are formed everymonth based on NYSE size breakpoints (left-hand side) and based on sample size breakpoints (right-hand side) whereeach size quintile contains roughly an equal number of stocks.
51

Table IIITest Results for Abnormal Returns
Category Subcategory CAR p-value
1. Awards Company Award 0.049% 0.000Product Award 0.014% 0.586
2. Customers & Customer Loss -0.704% 0.002a
Partners Customer Win 0.106% 0.000New Partnership 0.082% 0.000Reaching a Milestone 0.142% 0.003
3. Exchange Noncompliance 0.192% 0.104Return to Compliance 0.065% 0.747
4. Financial Dividend - Decreased -0.144% 0.035Dividend - Generic 0.057% 0.000Dividend - Increased 0.167% 0.000Dividend - Preferred Stock 0.055% 0.325Dividend - Special Dividend 0.420% 0.012Financial Results - Strong 0.363% 0.000Financial Results - Weak -0.145% 0.000Pre-Announcement - Negative -1.709% 0.000Pre-Announcement - Positive 0.685% 0.000Restatement -0.317% 0.066Secondary Offering: Debt -0.054% 0.152Secondary Offering: Equity -0.139% 0.000Share Buyback 0.438% 0.000Stock Split - Forward 0.295% 0.002Stock Split - Reverse -0.087% 0.807
5. Legal Class Action -0.086% 0.202Legal Problem -0.240% 0.101SEC Investigation 0.183% 0.460Settlement 0.199% 0.000
6. M&A Acquisition - Certain 0.105% 0.000Acquisition - Intent 0.020% 0.948Acquisition - Target 0.410% 0.046c
IPO 0.161% 0.126Merger 0.158% 0.249Spinoff - Certain 0.365% 0.000Spinoff -Intent 0.417% 0.001
7. Management Addition 0.042% 0.003Compensation 0.201% 0.515Promotion 0.002% 0.906Reorganization 0.047% 0.571Retirement -0.004% 0.931Termination -0.174% 0.003
8. Meetings & Company-Sponsored Event -0.021% 0.379Events Industry Event 0.030% 0.000
Investor Meeting 0.055% 0.131
9. Products & FDA Approval 0.423% 0.001Services FDA Investigation -0.080% 0.518
FDA Rejection -1.033% 0.030b
New Product 0.037% 0.000Patent Award 0.147% 0.059Pharma. Approval EU 0.280% 0.104Product Approval 0.062% 0.098Product Defect -0.500% 0.001Research Failure -0.134% 0.461Research Success 0.226% 0.006Updates & Upgrades 0.032% 0.201
10. Strategy & Credit News - Negative 0.151% 0.455Performance Credit News - Positive 0.013% 0.866
Infrastructure - Downsizing 0.266% 0.031c
Infrastructure - Expansion 0.009% 0.620Profitability - Declining -0.009% 0.968Profitability - Improving 0.113% 0.018
This table presents the mean cumulative abnormal return associated with each news category (CAR)computed over the event window [−1,+5] and the p-value for H0: CAR = 0. For categories contain-ing fewer than 100 observations, the p-values are italicized, and the 1%, 5%, and 10% significancelevels of non-parametric tests are indicated by symbols a, b, and c, respectively; categories significantat the 10% level, based on either test, are in bold.
52

Table IVTest Results for Changes in Volatility
Percent of obs.Category Subcategory with volatility increases p-value
1. Awards Company Award 48.43% 0.005Product Award 49.54% 0.360
2. Customers & Customer Loss 57.45% 0.191Partners Customer Win 51.17% 0.003
New Partnership 50.55% 0.089Reaching a Milestone 51.42% 0.249
3. Exchange Noncompliance 44.09% 0.010Return to Compliance 46.15% 0.339
4. Financial Dividend - Decreased 47.50% 0.136Dividend - Generic 51.68% 0.000Dividend - Increased 53.77% 0.001Dividend - Preferred Stock 53.31% 0.042Dividend - Special Dividend 61.84% 0.025Financial Results - Strong 67.94% 0.000Financial Results - Weak 66.61% 0.000Pre-Announcement - Negative 74.76% 0.000Pre-Announcement - Positive 65.73% 0.000Restatement 64.50% 0.000Secondary Offering: Debt 48.32% 0.059Secondary Offering: Equity 47.18% 0.008Share Buyback 50.50% 0.319Stock Split -Forward 58.82% 0.007Stock Split -Reverse 57.14% 0.332
5. Legal Class Action 44.93% 0.014Legal Problem 50.40% 0.542SEC Investigation 57.63% 0.059Settlement 49.43% 0.339
6. M&A Acquisition - Certain 52.17% 0.000Acquisition - Intent 55.88% 0.304Acquisition - Target 50.70% 0.500IPO 54.00% 0.336Merger 47.76% 0.198Spinoff - Certain 49.87% 0.458Spinoff - Intent 53.21% 0.061
7. Management Addition 50.29% 0.257Compensation 52.00% 0.444Promotion 51.17% 0.057Reorganization 51.92% 0.159Retirement 51.96% 0.121Termination 52.15% 0.077
8. Meetings & Company-Sponsored Event 48.99% 0.176Events Industry Event 50.14% 0.323
Investor Meeting 53.53% 0.001
9. Products & FDA Approval 51.73% 0.139Services FDA Investigation 55.94% 0.012
FDA Rejection 60.61% 0.148New Product 50.31% 0.198Patent Award 49.89% 0.500Pharma. Approval EU 47.92% 0.307Product Approval 52.21% 0.067Product Defect 57.14% 0.065Research Failure 54.55% 0.228Research Success 53.49% 0.011Updates & Upgrades 52.22% 0.010
10. Strategy & Credit News - Negative 57.36% 0.056Performance Credit News - Positive 49.86% 0.485
Infrastructure - Downsizing 61.90% 0.082Infrastructure - Expansion 49.68% 0.349Profitability - Declining 60.82% 0.003Profitability - Improving 49.43% 0.374
This table presents the percentage of firms experiencing an increase in realized volatility in the eventwindow [+1,+5] relative to the pre-event window [−5,−1] and the p-value of the non-parametrictest that it is different from 50%. Categories significant at the 10% level are in bold.
53

Table VTest Results for Changes in Volatility on News- and Non-News Days
abnormal non-news sample news samplereturn abnormal % volatility abnormal % volatility p-value of thegroup return increased p-value return increased p-value difference
1 -8.02% 60.80% 0.000 -8.87% 63.44% 0.000 0.0002 -4.02% 54.97% 0.000 -4.07% 56.07% 0.000 0.0003 -2.88% 52.93% 0.000 -2.93% 54.26% 0.000 0.0004 -2.18% 51.60% 0.000 -2.22% 53.01% 0.000 0.0005 -1.68% 50.67% 0.000 -1.71% 52.36% 0.000 0.0006 -1.29% 50.27% 0.015 -1.31% 51.33% 0.000 0.0007 -0.96% 49.83% 0.086 -0.98% 50.95% 0.000 0.0008 -0.67% 49.71% 0.009 -0.69% 50.60% 0.002 0.0019 -0.42% 49.38% 0.000 -0.43% 50.56% 0.003 0.00010 -0.19% 49.62% 0.001 -0.19% 50.52% 0.006 0.00111 0.03% 49.51% 0.000 0.04% 50.44% 0.017 0.00112 0.26% 49.36% 0.000 0.27% 50.81% 0.000 0.00013 0.51% 49.70% 0.007 0.52% 50.92% 0.000 0.00014 0.79% 49.78% 0.038 0.81% 51.50% 0.000 0.00015 1.11% 50.11% 0.187 1.14% 51.91% 0.000 0.00016 1.51% 50.28% 0.011 1.55% 52.47% 0.000 0.00017 2.03% 51.38% 0.000 2.07% 53.20% 0.000 0.00018 2.77% 52.45% 0.000 2.83% 54.17% 0.000 0.00019 4.05% 54.94% 0.000 4.13% 57.46% 0.000 0.00020 9.41% 62.09% 0.000 10.62% 65.36% 0.000 0.000
Every day, stocks are classified into 20 groups based on the abnormal return on that day. Within each abnormal return group,stocks are further classified into two groups based on whether or not a firm-issued press release or a macroeconomic newsannouncement was made on that day. The percentage of firms experiencing an increase in realized volatility estimated duringthe window [+1,+5], relative to the window [−5,−1], with t = 0 being the day on which the groups are formed, is calculated;p-values reported in columns 4 and 7 correspond to the test of the null hypothesis that the frequency of volatility increases forthe stock-day observations in each group is equal to 50%, and the p-value in the last column corresponds to the t-test for the nullhypothesis that the frequency of volatility increases is the same for the news- and the non-news groups.
54

Table VITest Results for Changes in Bid-Ask Spread
Standardized abnormalCategory Subcategory log-spread p-value
1. Awards Company Award -0.024 0.000Product Award -0.011 0.085
2. Customers & Customer Loss -0.082 0.038b
Partners Customer Win -0.016 0.000New Partnership -0.021 0.000Reaching a Milestone -0.038 0.000
3. Exchange Noncompliance -0.017 0.097Return to Compliance -0.009 0.771
4. Financial Dividend - Decreased -0.039 0.000Dividend - Generic 0.005 0.013Dividend - Increased -0.002 0.709Dividend - Preferred Stock -0.015 0.154Dividend - Special Dividend -0.057 0.011Financial Results - Strong -0.004 0.203Financial Results - Weak -0.041 0.000Pre-Announcement - Negative -0.127 0.000Pre-Announcement - Positive -0.019 0.143Restatement -0.016 0.413Secondary Offering: Debt -0.045 0.000Secondary Offering: Equity -0.057 0.000Share Buyback -0.016 0.004Stock Split -Forward -0.010 0.587Stock Split -Reverse -0.002 0.938
5. Legal Class Action -0.089 0.000Legal Problem -0.033 0.128SEC Investigation -0.009 0.708Settlement -0.019 0.006
6. M&A Acquisition - Certain -0.024 0.000Acquisition - Intent 0.000 0.999Acquisition - Target -0.095 0.004a
IPO 0.012 0.764Merger -0.035 0.003Spinoff - Certain -0.025 0.000Spinoff - Intent -0.016 0.127
7. Management Addition -0.024 0.000Compensation -0.026 0.502Promotion -0.026 0.000Reorganization -0.030 0.001Retirement -0.032 0.000Termination -0.029 0.000
8. Meetings & Company-Sponsored Event -0.021 0.000Events Industry Event -0.019 0.000
Investor Meeting -0.026 0.000
9. Products & FDA Approval -0.020 0.009Services FDA Investigation -0.039 0.002
FDA Rejection -0.068 0.129b
New Product -0.022 0.000Patent Award -0.005 0.689Pharma. Approval EU -0.018 0.349Product Approval -0.016 0.030Product Defect -0.061 0.009Research Failure -0.040 0.173Research Success -0.014 0.065Updates & Upgrades -0.013 0.007
10. Strategy & Credit News - Negative 0.010 0.699Performance Credit News - Positive -0.009 0.400
Infrastructure - Downsizing -0.048 0.241Infrastructure - Expansion -0.029 0.000Profitability - Declining -0.005 0.791Profitability - Improving -0.037 0.000
This table presents the standardized abnormal logarithm of the daily time-weighted bid-ask spreadfor each news category, computed over the event window [0,+5], and the p-value for the null hypoth-esis of it being equal to zero. For categories containing fewer than 100 observations, the p-valuesare italicized and, the 1%, 5%, and 10% significance levels of non-parametric tests are indicated bysymbols a, b, and c, respectively; categories significant at the 10% level, based on either test, are inbold. 55

Table VIITest Results for Changes in Turnover
Standardized abnormalCategory Subcategory log-turnover p-value
1. Awards Company Award 0.022 0.234Product Award 0.026 0.479
2. Customers & Customer Loss -0.308 0.152Partners Customer Win 0.053 0.000
New Partnership 0.014 0.254Reaching a Milestone -0.041 0.489
3. Exchange Noncompliance 0.058 0.242Return to Compliance -0.129 0.418b
4. Financial Dividend - Decreased 0.055 0.355Dividend - Generic 0.039 0.001Dividend - Increased 0.084 0.012Dividend - Preferred Stock 0.064 0.245Dividend - Special Dividend -0.040 0.720Financial Results - Strong 0.133 0.000Financial Results - Weak -0.120 0.000Pre-Announcement - Negative -0.482 0.000Pre-Announcement - Positive 0.240 0.001Restatement -0.136 0.197Secondary Offering: Debt 0.027 0.375Secondary Offering: Equity -0.202 0.000Share Buyback -0.013 0.669Stock Split -Forward -0.042 0.697Stock Split -Reverse 0.252 0.123a
5. Legal Class Action -0.251 0.001Legal Problem -0.030 0.791SEC Investigation -0.119 0.450Settlement 0.071 0.060
6. M&A Acquisition - Certain -0.022 0.203Acquisition - Intent 0.108 0.535b
Acquisition - Target 0.198 0.217a
IPO 0.014 0.944Merger 0.125 0.052Spinoff - Certain 0.073 0.019Spinoff - Intent 0.122 0.044
7. Management Addition 0.013 0.307Compensation 0.166 0.479Promotion -0.036 0.103Reorganization -0.082 0.172Retirement 0.010 0.837Termination 0.007 0.868
8. Meetings & Company-Sponsored Event 0.014 0.658Events Industry Event 0.011 0.235
Investor Meeting -0.006 0.875
9. Products & FDA Approval 0.170 0.000Services FDA Investigation -0.028 0.714
FDA Rejection 0.043 0.901New Product 0.081 0.000Patent Award 0.059 0.381Pharma. Approval EU -0.075 0.488Product Approval 0.111 0.010Product Defect -0.035 0.806Research Failure -0.150 0.363Research Success 0.115 0.010Updates & Upgrades 0.019 0.509
10. Strategy & Credit News - Negative -0.021 0.896Performance Credit News - Positive 0.121 0.043
Infrastructure - Downsizing -0.015 0.943Infrastructure - Expansion -0.019 0.418Profitability - Declining -0.185 0.077Profitability - Improving 0.043 0.381
This table presents the standardized abnormal log-turnover for each news category, computed overthe event window [−1,+5], and the p-value for the null hypothesis of it being equal to zero. Forcategories containing fewer than 100 observations, the p-values are italicized, and the 1%, 5%, and10% significance levels of non-parametric tests are indicated by symbols a, b, and c, respectively;categories significant at the 10% level, based on either test, are in bold.
56