Embed Size (px)
Citation preview

Last Updated June 2017
MARKET PROFILE
Brownsville Rd and Sankey Ave Commercial District Carrick
2017 Business Summary (2 Minute Drive Time)
Number of Businesses: 134
Number of Employees: 733
Employees/Residential Population Ratio*:
0.15:1
Major Industries: Food & Beverage Stores, Food Stores,
Home Improvement
For more information on the neighborhood, visit:
Marketplace Profile** Retail Potential
(Demand) Retail Sales
(Supply) Retail Gap
Leakage/ Surplus Factor
Number of Business
Motor Vehicle & Parts Dealers $14,068,822 $2,525,318 $11,543,504 69.6 1
Furniture & Home Furnishing Stores $1,903,369 $0 $1,903,369 100.0 0
Electronics and Appliance Stores $3,069,488 $0 $3,069,488 100.0 0
Building Materials, Garden Equip. & Supply Stores $3,443,295 $727,365 $2,715,930 65.1 2
Food and Beverage Stores $11,932,525 $3,119,904 $8,812,621 58.5 4
Health and Personal Care Stores $3,481,444 $2,143,822 $1,337,622 23.8 1
Gasoline Stations $3,867,829 $4,057,052 -$189,223 -2.4 1
Clothing & Clothing Accessories Stores $2,962,189 $167,463 $2,794,726 89.3 1
Sporting Goods / Hobby / Music / Book Stores $1,617,203 $362,878 $1,254,325 63.3 1
General Merchandise Stores $9,770,255 $0 $9,770,255 100.0 0
Nonstore Retailers $1,498,168 $0 $1,498,168 100.0 0
Food Services & Drinking Places $5,927,420 $5,477,402 $450,018 3.9 15
**Supply (retail sales) estimates sales to consumers by establishments. Sales to businesses are excluded. Demand (retail potential) estimates the expected amount spent by consumers at retail establishments. The Leakage/Surplus Factor measures the relationship between supply and demand that ranges from +100 (total leakage) to -100 (total surplus). A positive value represents 'leakage' of retail opportunity outside the trade area. A negative value represents a surplus of retail sales, a market where customers are drawn in from outside the trade area. The Retail Gap represents the difference between Retail Potential and Retail Sales. The NAICS is used to classify businesses by their primary type of economic activity. *This ratio indicates the number of employees working in the area versus the number of residents. A higher ratio indicates more commercial presence.
Last Updated June 2017
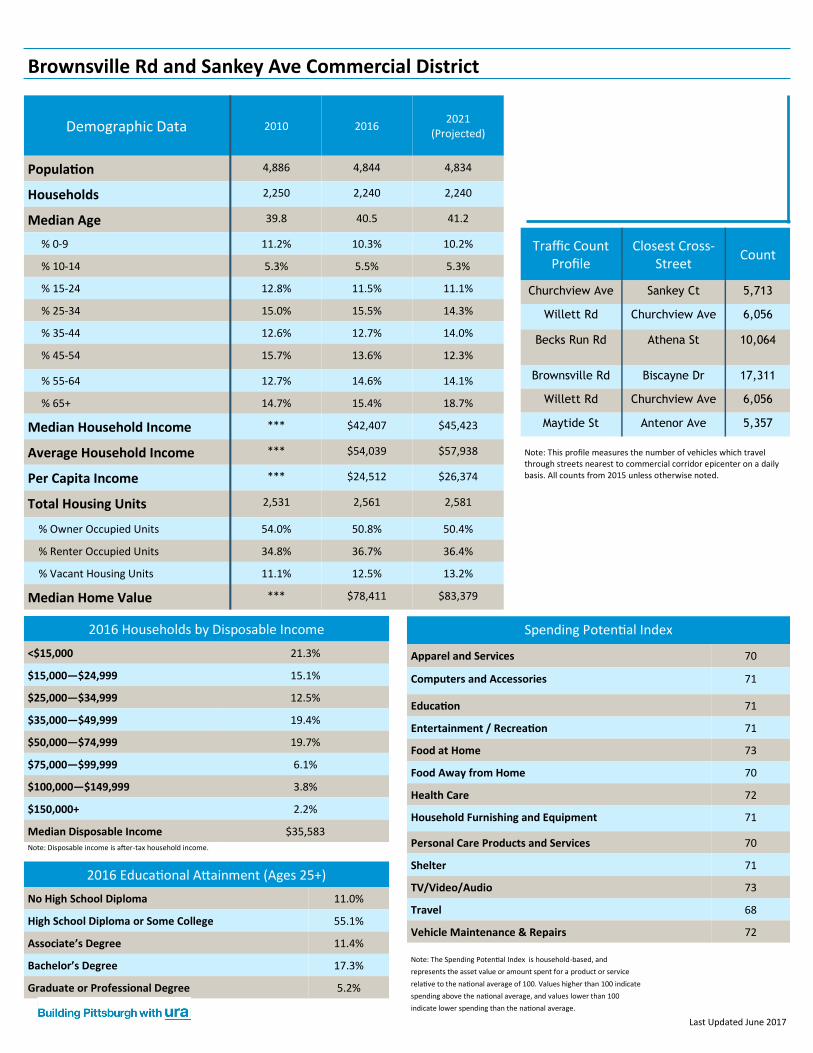
Demographic Data 2010 2016 2021
(Projected)
Population 4,886 4,844 4,834
Households 2,250 2,240 2,240
Median Age 39.8 40.5 41.2
% 0-9 11.2% 10.3% 10.2%
% 10-14 5.3% 5.5% 5.3%
% 15-24 12.8% 11.5% 11.1%
% 25-34 15.0% 15.5% 14.3%
% 35-44 12.6% 12.7% 14.0%
% 45-54 15.7% 13.6% 12.3%
% 55-64 12.7% 14.6% 14.1%
% 65+ 14.7% 15.4% 18.7%
Median Household Income *** $42,407 $45,423
Average Household Income *** $54,039 $57,938
Per Capita Income *** $24,512 $26,374
Total Housing Units 2,531 2,561 2,581
% Owner Occupied Units 54.0% 50.8% 50.4%
% Renter Occupied Units 34.8% 36.7% 36.4%
% Vacant Housing Units 11.1% 12.5% 13.2%
Median Home Value *** $78,411 $83,379
Spending Potential Index
Apparel and Services 70
Computers and Accessories 71
Education 71
Entertainment / Recreation 71
Food at Home 73
Food Away from Home 70
Health Care 72
Household Furnishing and Equipment 71
Personal Care Products and Services 70
Shelter 71
TV/Video/Audio 73
Travel 68
Vehicle Maintenance & Repairs 72
2016 Households by Disposable Income
<$15,000 21.3%
$15,000—$24,999 15.1%
$25,000—$34,999 12.5%
$35,000—$49,999 19.4%
$50,000—$74,999 19.7%
$75,000—$99,999 6.1%
$100,000—$149,999 3.8%
$150,000+ 2.2%
Median Disposable Income $35,583
2016 Educational Attainment (Ages 25+)
No High School Diploma 11.0%
High School Diploma or Some College 55.1%
Associate’s Degree 11.4%
Bachelor’s Degree 17.3%
Graduate or Professional Degree 5.2%
Note: Disposable income is after-tax household income.
Note: The Spending Potential Index is household-based, and
represents the asset value or amount spent for a product or service
relative to the national average of 100. Values higher than 100 indicate
spending above the national average, and values lower than 100
indicate lower spending than the national average.
Traffic Count Profile
Closest Cross-Street
Count
Churchview Ave Sankey Ct 5,713
Willett Rd Churchview Ave 6,056
Becks Run Rd Athena St 10,064
Brownsville Rd Biscayne Dr 17,311
Willett Rd Churchview Ave 6,056
Maytide St Antenor Ave 5,357
Note: This profile measures the number of vehicles which travel through streets nearest to commercial corridor epicenter on a daily basis. All counts from 2015 unless otherwise noted.
Brownsville Rd and Sankey Ave Commercial District

Last Updated June 2017
Residents in this segment live primarily in low-density, settled neighborhoods in the Midwest. The households are a mix of married-couple families and singles. Many families encompass two generations who have lived and worked in the community; their children are likely to follow suit. The manufacturing, retail trade, and health care sectors are the primary sources of employment for these residents. This is a younger market—beginning householders who are juggling the responsibilities of living on their own or a new marriage, while retaining their youthful interests in style and fun.
Front Porches
Front Porches blends household types, with more young families with children or single households than average. This group is also more diverse than the US. Half of householders are renters, and many of the homes are older town homes or duplexes. Friends and family are central to Front Porches residents and help to influence household buying decisions. Residents enjoy their automobiles and like cars that are fun to drive. Income and net worth are well be-low the US average, and many families have taken out loans to make ends meet.
Traditional Living
Midlife Constants
Midlife Constants residents are seniors, at or approaching retirement, with below average labor force participation and above average net worth. Although located in predominantly metropolitan areas, they live outside the central cities, in smaller communities. Their lifestyle is more country than urban. They are generous, but not spendthrifts.
Note: ESRI is an independent geographic information systems (GIS) corporation and is not affiliated with the Urban Redevelopment Authority of Pitts-burgh. This analysis utilizes socioeconomic and marketing data to identify distinct segments of the population, map where they reside, and describe their
socioeconomic qualities and consumer preferences. More information on tapestry segments and segment descriptions can be found at: http://www.esri.com/library/whitepapers/pdfs/community
ESRI Tapestry Segmentation Area Profile
TAPESTRY SEGMENT DESCRIPTIONS
Neighborhood Quick Facts*
• 13th largest neighborhood in Pittsburgh by area
• Number of bus lines in neighborhood: 6
• Persons per sq. mile: 5,858 (City average: 5,646)
• Walk Score: 66
* The Walk Score is a measure between 0 and 100 that measures the ease of accessing amenities and running errands by walking. For more information, see http://www.walkscore.com/
Brownsville Rd and Sankey Ave Commercial District

Last Updated June 2017
Carrick Photo Credit: Dan Buczynski
Contacts
Economic Development South: www.
economicdevelopmentsouth.org
Urban Redevelopment Authority of Pittsburgh: www.ura.org/
All data from ESRI Business Analyst 2017 unless otherwise noted. ¹Data applies to neighborhood boundary and not study area. Source: PGHSNAP, Dept. of City Planning
For More Information: For additional market value analysis data, contact Josette Fitzgibbons at [email protected] Department of City Planning SNAP Neighborhood Data: http://www.pittsburghpa.gov/dcp/snap/ Pittsburgh Neighborhood Community Indicator Systems (PNCIS) ACS 2005-2009 Neighborhood Profiles: http://www.ucsur.pitt.edu/neighborhood_reports_acs.php
Business District Programs
Brownsville Rd and Sankey Ave Commercial District
The Pittsburgh Biz Buzz Small Grant Program
This program is designed for community organizations that are working to spur neighborhood business district revitalization using the 48x48x48 strategy of short and medium term achievable projects, determining what you can do in 48 hours, 48 days and 48 weeks. The program aims to bring newcomers into your neighborhood business district and create a “buzz” about your business district through media and word of mouth. For more information about applications and eligibility, visit: http://www.ura.org/business_owners/mainstreets.php
Façade Improvement Programs
Restored storefronts improve the pedestrian environment, attract more customers, and encourage economic development and investment. The URA offers several different façade improvement programs designed for commercial building owners and tenants to improve their storefronts. Your location determines your building’s façade improvement program eligibility. For more information about applications and eligibility, contact Quianna Wasler at (412) 255-6550 or visit: http://www.ura.org/business_owners/facade_program.php
Neighborhood Business District Program
This program strives to ensure the health of the City’s traditional neighborhood commercial districts using the National Main Street Center’s Four Point Approach which considers: economic restructuring, promotion, design and sustainability. To learn more about this program, contact Josette Fitzgibbons at (412) 255-6686 or visit: http://www.ura.org/business_owners/mainstreets.php