Embed Size (px)
Citation preview
Market Outlook
June 2018

EQUITY MARKET
Global equity market snapshot: May 2018
Source: Bloomberg, SBIMF Research
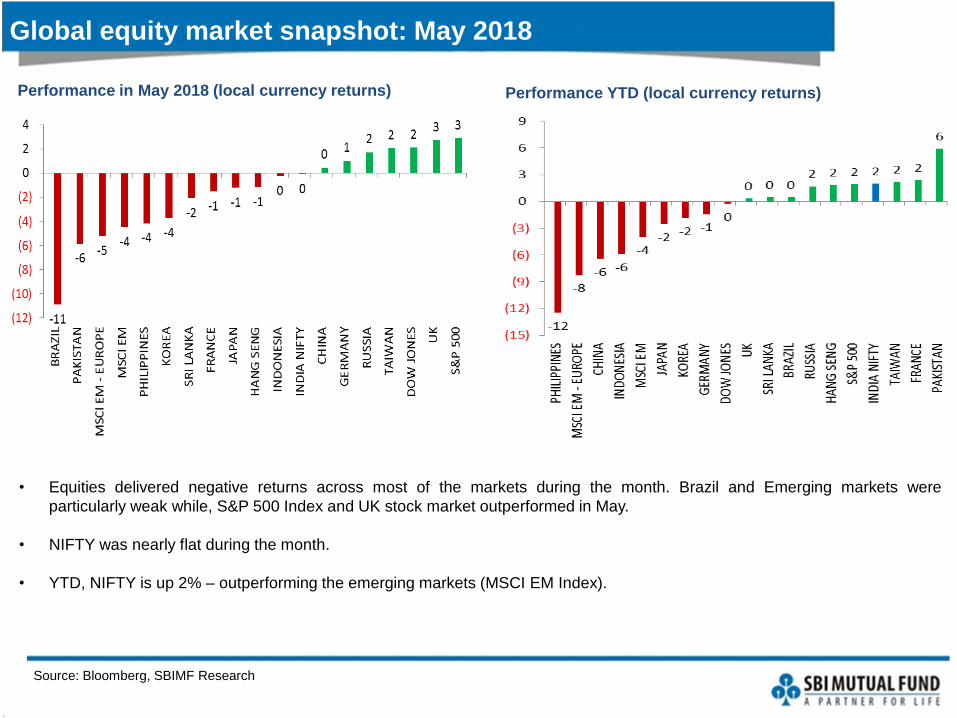
• Equities delivered negative returns across most of the markets during the month. Brazil and Emerging markets were
particularly weak while, S&P 500 Index and UK stock market outperformed in May.
• NIFTY was nearly flat during the month.
• YTD, NIFTY is up 2% – outperforming the emerging markets (MSCI EM Index).
Performance in May 2018 (local currency returns) Performance YTD (local currency returns)

Indian stock market snapshot: May 2018
Source: Bloomberg, SBIMF Research
Performance in May 2018 (local currency returns) Performance YTD (local currency returns)
• Indian equity market delivered negative returns across most of the sectors (barring Banks) in May after delivering positive
returns in the last month. Pharma and Real Estate were the worst performers during the month.
• Sensex is up by 0.5% and Nifty is down up 0.03% in May.
• Both Mid-cap index and small-cap index were down by 6% each. YTD, small and mid-caps have under-performed NIFTY.
• YTD, Nifty is up 2% and Sensex is up 4%. Sector-wise performance has been negative across most of the sectors on a YTD
basis (barring IT, FMCG and Bank index). Real Estate and PSUs are the laggards (down 14% each respectively).

Source: CMIE economic outlook, SBIMF Research,
Growth recovery seen in last three quarters
• GDP showed 3rd consecutive quarter of growth recovery. 4Q FY18 GDP growth surged to 7.7% y-o-y
vs. downwardly revised 7.0% in 3Q (previous figure was 7.2%).
• GVA grew by 7.6% in Q4 FY18 vs. 6.6% in 3Q FY18.
India's growth continued to recover for 3rd consecutive quarter

Source: CMIE economic outlook, SBIMF Research,
Supply and demand side break-up of growth
Supply side (% growth)% share in
GDPFY17
Q1 FY18
Q2 FY18
Q3 FY18
Q4 FY18
FY18
Real GVA 100 7.1 5.6 6.1 6.6 7.6 6.5
Agriculture, forestry and fishing 16.5 6.3 3.0 2.6 3.1 4.5 3.4
Industry 31.6 6.8 0.1 6.1 7.1 8.8 5.5
Mining and quarrying 3.1 13.0 1.7 6.9 1.4 2.7 2.9
Manufacturing 17.7 7.9 -1.8 7.1 8.5 9.1 5.7
Utilities 2.2 9.2 7.1 7.7 6.1 7.7 7.2
Construction 8.6 1.3 1.8 3.1 6.6 11.5 5.7
Services 51.9 7.5 9.5 6.8 7.7 7.7 7.9
Demand side (% growth)% share in GDP
FY17Q1
FY18Q2
FY18Q3
FY18Q4
FY18FY18
Real GDP 100 7.1 5.6 6.3 7.0 7.7 6.7
Private Consumption 56.1 7.3 6.9 6.8 5.9 6.7 6.6
Government Consumption 10.3 12.2 17.6 3.8 6.8 16.8 10.9
Gross Capital Formation 35.2 4.7 5.1 8.0 10.1 14.9 9.6
Investment 31.8 10.1 0.8 6.1 9.1 14.4 7.6
Exports of G&S 1.6 5.0 5.9 6.8 6.2 3.6 5.6
Imports of G&S 1.8 4.0 18.5 10.0 10.5 10.9 12.4
Both supply side and demand side growth accelerated in Q4 FY18
• 4Q FY18 GDP growth surged to 7.7% y-o-y (vs. 7.0% in 3Q) and 6.7% for the full year. Implying that even though economic
momentum picked up in 2H, it wasn’t enough to offset the sharply reduced growth in 1H.
• This growth can primarily be explained by rise in investment and pick-up in government spending. Consumption picked up too.
Exports growth was flat while imports moderated leading to lower negative contribution to growth.
• On the supply side, GVA grew by 7.6% (vs. 6.6% in 3Q) and at 6.5% for the full year.
• Agriculture posted a strong growth while, growth in industry and services were flat. Surprisingly, all engines of industry (mining,
manufacturing, utilities and construction) picked momentum. Services were primarily supported by government spending.
• The momentum in Indian economy is picking up. While part of it stems from fading of demonetization and GST effects, other
part rests on government spending (both revex and infrastructure capex). To our dismay, India is not participating fully in the
global growth. Exports made an even lower contribution to growth this quarter.
• For FY19, we expect Real GDP growth rate to increase 7.6%.

Source: CMIE economic outlook, SBIMF Research,
High Frequency indicators point to improving growth
We track 40-50 high frequency indicators to gauge economic health. Increasing number of high frequency indicators are pointing
to improved growth. Interestingly, apart from bank credit, all indicators used to track the investment trends are encouraging.
Goods exports are languishing, but services exports is rising fast. While the agri-prices are low, rural wage growth is tepid and
there is an incessant cry of farm loan waiver, perhaps the increased access to roads, electricity, and finance is leading to
increased rural oriented demand in select segment. Weak bank credit to industry is a major constraint.
Pink denotes deterioration in growth than previous month Green denotes improvement in growth than previous month
% growth Nov-17 Dec-17 Jan-18 Feb-18 Mar-18 Apr-18 5yr average (May13-Apr18)
Sale of Commercial Vehicles 50.4 52.6 39.7 31.1 24.6 76.0 3.9
Domestic Sale of two-wheelers 23.5 41.5 33.4 23.8 18.3 16.9 8.6
Foreign tourist arrivals 14.4 15.2 8.4 10.1 13.4 4.4 9.8
Domestic air traffic 16.5 17.4 18.2 23.3 26.9 N/A 16.5
Bank personal loans 17.3 18.9 20.0 20.4 17.8 19.1 16.0
Currency in circulation 39.7 80.0 75.5 57.1 37.0 32.9 9.7
Production of consumer non-durables 23.7 16.8 11.0 7.3 10.9 N/A 5.7
Aluminium production 8.8 9.0 9.1 8.3 4.3 8.0 1.9
Cement production 16.9 17.7 19.6 23.0 13.0 16.6 4.3
Bitumen consumption 15.5 9.4 12.1 15.2 10.2 16.4 6.7
AUM of Mutual Funds 38.1 29.8 29.0 24.1 21.7 20.7 23.2
Production of consumer durables 3.1 2.1 7.8 7.5 2.9 N/A 3.4
Services exports 15.4 15.9 20.4 20.3 18.7 N/A 4.0
Capital goods imports 15.6 9.8 28.1 28.1 26.2 12.4 -1.2
Coal production 0.7 0.3 3.8 1.4 9.1 16.0 4.2
Rural wage growth -0.6 -1.0 -2.1 N/A N/A N/A 1.1
Good exports 29.2 12.5 11.6 4.3 -0.4 4.4 1.0
Bank industrial credit 1.0 2.1 1.1 1.0 0.7 N/A 5.1
Bank credit to infrastructure sector -2.3 -0.7 -2.9 -1.9 -1.7 N/A 5.7
Production of crude oil -0.1 -0.8 -1.7 -2.6 -2.4 -1.6 -1.1
Production of Natural Gas 2.4 1.2 -1.2 -1.5 0.9 7.4 -3.7
Indicators that are Robust
Indicators that have recently showed stronger growth
Indicators that have recently showed weaker growth
Indicators that are weak for long

Source: IMD, SBIMF Research,
IMD predicts a normal south-west monsoon in 2018
CategoryRainfall Range (%
of LPA)Forecast
probability (%)Climatological Probability (%)
Deficient < 90 13 16
Below Normal 90 - 96 28 17
Normal 96 - 104 43 33
Above Normal 104 - 110 13 16
Excess > 110 3 17
Meteorological Sub-Divisions
IMD 2nd stage forecasts for South-West Monsoon 2018
East & North-East India 93% of LPA
North West India 100% of LPA
Central India 99% of LPA
South Peninsula 95% of LPA
July 101% of LPA, error +/- 9%
August 94% of LPA, error +/- 9%
September 97% of LPA, error +/- 4%
South-West Monsoon 2018 is most likely to be normal North-West and Central India are predicted to be normal
• IMD has predicted 43% probability of a normal monsoon (97% of LPA) in their second stage forecast of south-west
monsoon 2018.
• South Peninsula and North-east India are predicted to receive below normal rainfall while it is likely to be normal for
Central and North-West India.
• July to receive good rainfall, problems might rise during crucial sowing month of August.
• All in all, monsoon is predicted to be normal that said, spatial distribution could be a risk.

Source: CMIE economic outlook, Ministry of Agriculture, SBIMF Research, NB: ***Average Wage Rates in Rural India for
Men: Adjusted Series; *2016-17 figures are Final Estimates, **2017-18 Kharif and Rabi figures are 3rd advance estimates respectively.
Rural demand has strengthened
…but agriculture output has improved for 3rd consecutive
season…Rural wage growth is moderating***…
…leading to increased tractor and two-wheeler demand• Rural economy appears to have strengthened
• While the rural wage growth is still muted, the farm output
has been healthy for 3rd consecutive season. The rural
access to formal sector lending channel has increased.
• Focus of budget (both center and state) in last 3 years have
shifted towards rural population and outlay on rural road
development, housing, irrigation, electricity penetration and
employment has increased.
• Some of the indicators like sales of two-wheelers, FMCG
goods, tractors and fertilizer – which provides a gauge to
rural demand have picked up in last two-three quarters.

Source: CMIE economic outlook, SBIMF Research, NB: * As per April 2018 data
Manufacturing sector is on the recovery path
PMI Manufacturing indicates expansion since September 2017Manufacturing production is on the recovery path
Imports are growing faster than exports • In FY18, IIP manufacturing witnessed a marginal
improvement in the growth (4.6% in FY18 vs. 4.3% in FY17)
primarily contributed by pharmaceuticals, metals and motor-
vehicles.
• PMI manufacturing has been expanding for last 9 months on
account of improvement in the new orders, output and
purchases.
• Imports are growing faster than exports. Imports of capital
goods, in particular, are buoyant. On the exports front, 28%*
of the total exports are coming from engineering goods alone.
• Going forward, we expect manufacturing sector to remain
above trend for most part of the year, barring growth
intermittent aberrations.
Source: RBI, SBIMF Research, NB: *ECB data till Dec 2017
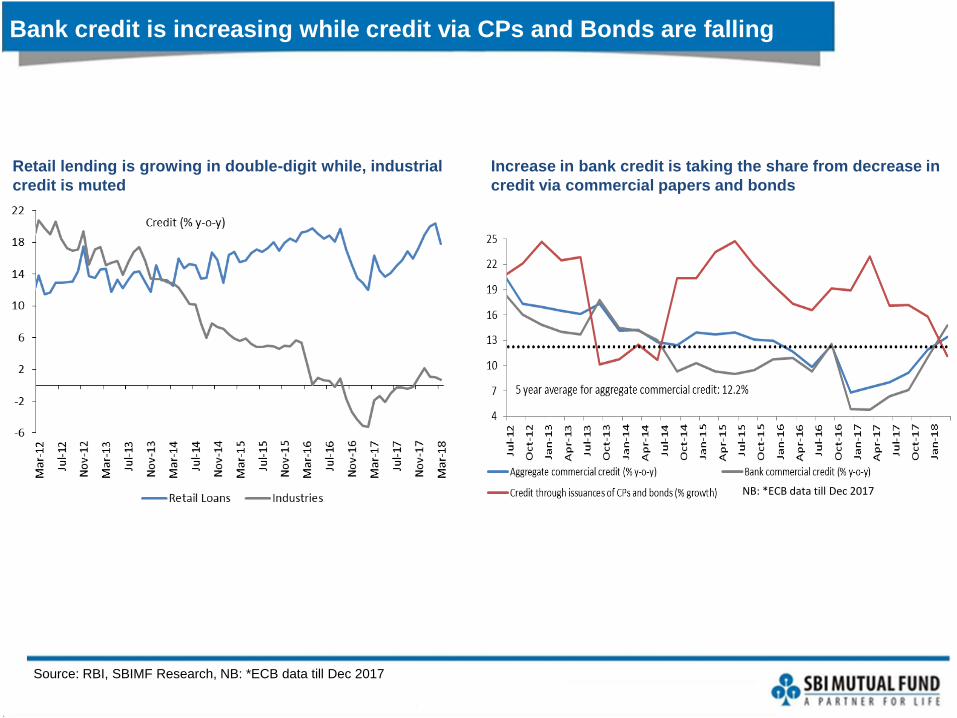
Bank credit is increasing while credit via CPs and Bonds are falling
Retail lending is growing in double-digit while, industrial
credit is muted
Increase in bank credit is taking the share from decrease in
credit via commercial papers and bonds
NB: *ECB data till Dec 2017

Source: CMIE economic outlook, SBIMF Research,
Outlook: FY19 growth is expected to surge to 7.6%
Growth is likely to improve further to 7.6% y-o-y in FY18
• FY19 growth is expected to surge to 7.6% y-o-y.
• Higher oil prices, widening of trade deficit and any shortfall in monsoon pose downward risk, while government infrastructure
push, fading away of GST disruptions, rising global growth and improved business sentiments will provide the positive support.
5.5
6.4
7.4
8.2
7.1
6.7
7.6
4.0
4.5
5.0
5.5
6.0
6.5
7.0
7.5
8.0
8.5
FY13 FY14 FY15 FY16 FY17 FY18 FY19 E
% growth
Source: Antique, SBIFM Research;
NB: * FY18 numbers are based on the companies which have reported their numbers so far
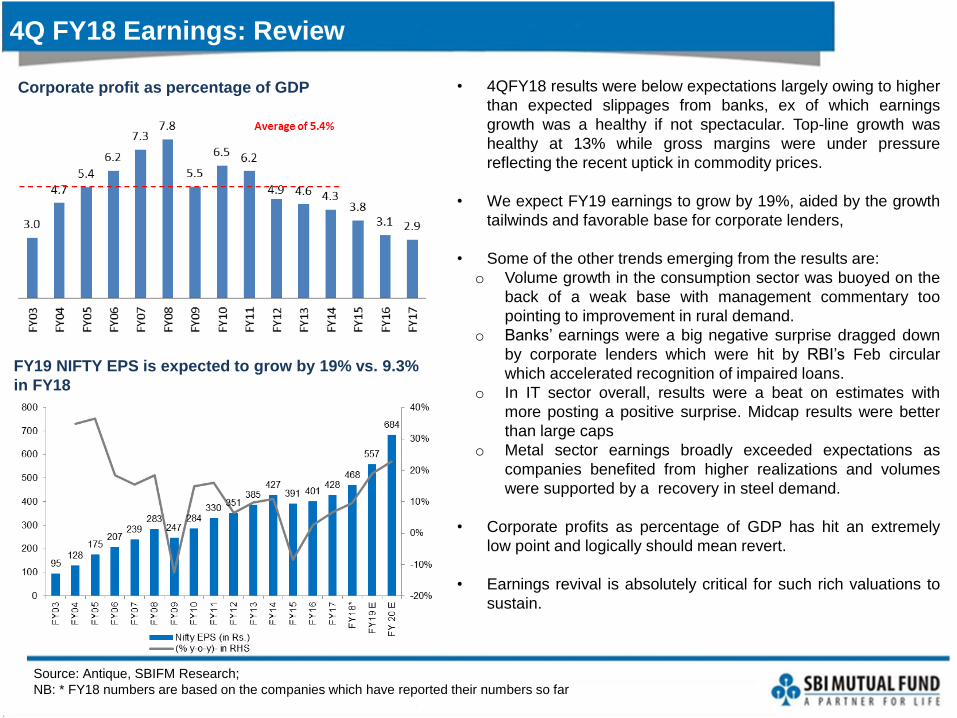
FY19 NIFTY EPS is expected to grow by 19% vs. 9.3%
in FY18
Corporate profit as percentage of GDP
4Q FY18 Earnings: Review
• 4QFY18 results were below expectations largely owing to higher
than expected slippages from banks, ex of which earnings
growth was a healthy if not spectacular. Top-line growth was
healthy at 13% while gross margins were under pressure
reflecting the recent uptick in commodity prices.
• We expect FY19 earnings to grow by 19%, aided by the growth
tailwinds and favorable base for corporate lenders,
• Some of the other trends emerging from the results are:
o Volume growth in the consumption sector was buoyed on the
back of a weak base with management commentary too
pointing to improvement in rural demand.
o Banks’ earnings were a big negative surprise dragged down
by corporate lenders which were hit by RBI’s Feb circular
which accelerated recognition of impaired loans.
o In IT sector overall, results were a beat on estimates with
more posting a positive surprise. Midcap results were better
than large caps
o Metal sector earnings broadly exceeded expectations as
companies benefited from higher realizations and volumes
were supported by a recovery in steel demand.
• Corporate profits as percentage of GDP has hit an extremely
low point and logically should mean revert.
• Earnings revival is absolutely critical for such rich valuations to
sustain.

Liquidity: FIIs pulled out while DIIs were net investors in May
FIIs sold US$ 1.2 billion during the month
Source: MOSL, SBIMF Research
Mutual funds continue to invest in Indian equities Insurance companies were net buyers during the month
-0.1
-1.0
0.9
-2.6
-0.9
0.8
-1.1
0.0
-1.7
-1.2
4.1
0.60.40.8
1.71.51.4
-0.7
-2.6
-1.2
0.0
1.6
5.1
-0.3
1.5
0.60.4
-2.0-1.7
0.3
3.0
-0.7
2.0
-1.9
2.0
-0.9-1.2M
ay-1
5
Au
g-1
5
No
v-1
5
Feb
-16
May
-16
Au
g-1
6
No
v-1
6
Feb
-17
May
-17
Au
g-1
7
No
v-1
7
Feb
-18
May
-18
US$ billion
0.7
1.6
0.9
1.61.4
0.51.00.7
1.1
0.9
-1.5
-0.1
1.1
0.00.0
0.40.6
1.4
2.0
1.4
0.80.3
0.7
1.71.51.4
1.8
2.82.7
1.51.9
1.31.4
2.5
1.4
1.71.8
May
-15
Au
g-1
5
No
v-1
5
Feb
-16
May
-16
Au
g-1
6
No
v-1
6
Feb
-17
May
-17
Au
g-1
7
No
v-1
7
Feb
-18
May
-18
US$ billion 0.7
0.3
-0.7
0.9
0.1
-0.7
0.30.3
0.80.7
-1.0
-0.3
0.0
-0.3
-0.9-1.1
-0.3-0.2
0.7
0.0-0.1 -0.2
-1.3
-0.3
-0.8
-0.4
-1.1
-0.3
0.5
0.0
-0.4
0.0
-1.4
0.3
-0.4-0.4
0.4
May
-15
Au
g-1
5
No
v-1
5
Feb
-16
May
-16
Au
g-1
6
No
v-1
6
Feb
-17
May
-17
Au
g-1
7
No
v-1
7
Feb
-18
May
-18
US$ billion

Source: Morgan Stanley, SBIMF Research,
Indian Equity Valuations relative to emerging markets
India’s valuation relative to other EMs is slightly above
historical average
…and the relative return on equity (RoE) has fallen
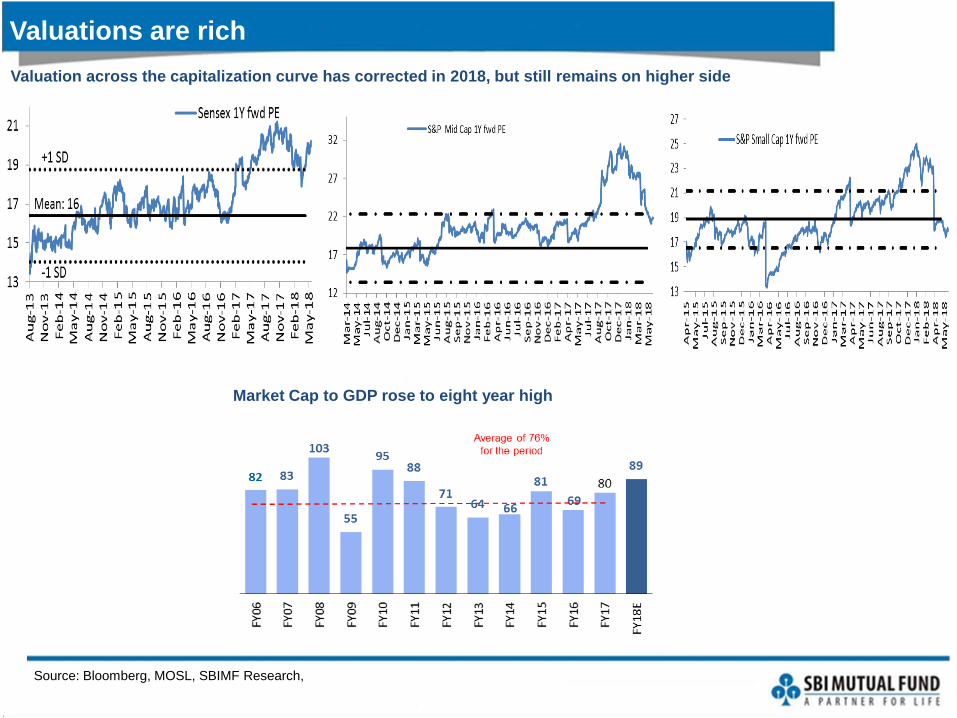
Valuations are rich
Valuation across the capitalization curve has corrected in 2018, but still remains on higher side
Source: Bloomberg, MOSL, SBIMF Research,
Market Cap to GDP rose to eight year high
Equity Market outlook
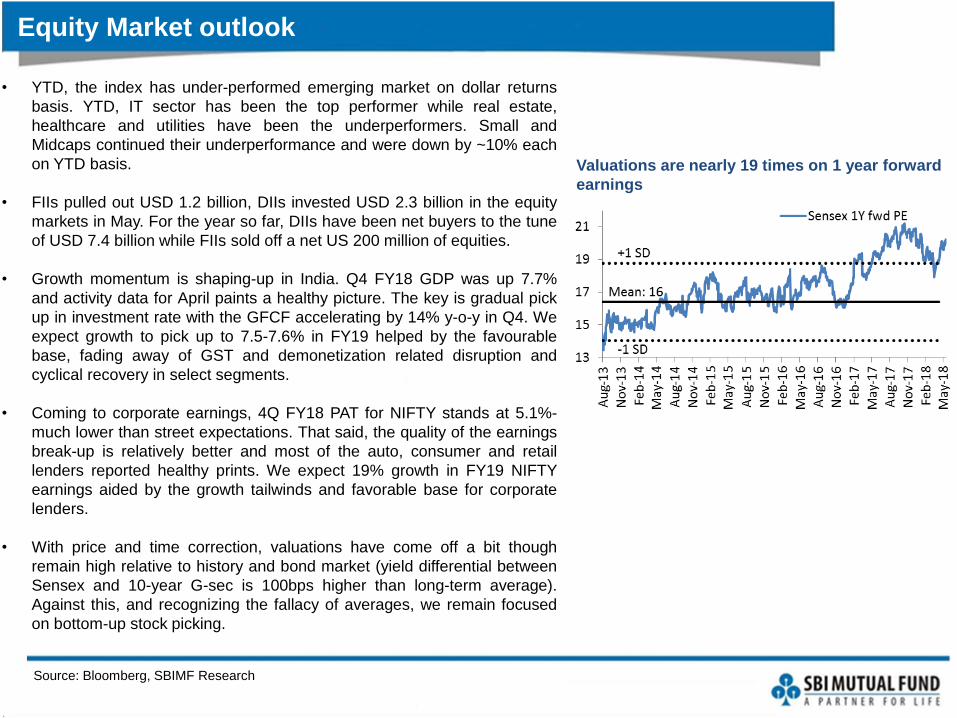
Valuations are nearly 19 times on 1 year forward
earnings
Source: Bloomberg, SBIMF Research
• YTD, the index has under-performed emerging market on dollar returns
basis. YTD, IT sector has been the top performer while real estate,
healthcare and utilities have been the underperformers. Small and
Midcaps continued their underperformance and were down by ~10% each
on YTD basis.
• FIIs pulled out USD 1.2 billion, DIIs invested USD 2.3 billion in the equity
markets in May. For the year so far, DIIs have been net buyers to the tune
of USD 7.4 billion while FIIs sold off a net US 200 million of equities.
• Growth momentum is shaping-up in India. Q4 FY18 GDP was up 7.7%
and activity data for April paints a healthy picture. The key is gradual pick
up in investment rate with the GFCF accelerating by 14% y-o-y in Q4. We
expect growth to pick up to 7.5-7.6% in FY19 helped by the favourable
base, fading away of GST and demonetization related disruption and
cyclical recovery in select segments.
• Coming to corporate earnings, 4Q FY18 PAT for NIFTY stands at 5.1%-
much lower than street expectations. That said, the quality of the earnings
break-up is relatively better and most of the auto, consumer and retail
lenders reported healthy prints. We expect 19% growth in FY19 NIFTY
earnings aided by the growth tailwinds and favorable base for corporate
lenders.
• With price and time correction, valuations have come off a bit though
remain high relative to history and bond market (yield differential between
Sensex and 10-year G-sec is 100bps higher than long-term average).
Against this, and recognizing the fallacy of averages, we remain focused
on bottom-up stock picking.

Fixed Income Market

Global rates snapshot for May 2018
Source: Bloomberg, SBIMF Research
• US bond yields inched down by 9 bps during the month due to rekindling fears of trade war.
• Italy and Spain witnessed an increase in the bond yields by 100 bps and 22 bps respectively during the month as political
concerns have risen.
• Bonds yields decreased in other key developed markets.
• Bond yields inched up or remained same across all of the emerging markets in May (barring South Korea).
10 Year Gsec Yield (% mth end)
2015 end 2016 end 2017 end Feb-18 Mar-18 Apr-18 May-18m-o-m change
(in bps)3m Change (in
bps)% change in YTD (in bps)
Developed market
US 2.27 2.44 2.41 2.86 2.74 2.95 2.86 -9 0 45
Germany 0.63 0.21 0.43 0.66 0.50 0.56 0.34 -22 -32 -9
Italy 1.35 1.82 1.75 1.71 1.53 1.53 2.53 100 82 78
Japan 0.27 0.05 0.05 0.05 0.05 0.06 0.04 -2 -1 -1
Spain 1.77 1.38 1.57 1.54 1.16 1.28 1.50 22 -4 -6
Switzerland -0.06 -0.19 -0.15 0.09 0.03 0.09 -0.07 -15 -16 8
UK 1.96 1.24 1.19 1.50 1.35 1.42 1.23 -19 -27 4
Emerging Market
Brazil 16.51 11.40 10.26 9.61 9.49 9.84 11.46 162 185 120
China 2.83 3.03 3.88 3.84 3.74 3.63 3.63 0 -21 -25
India 7.76 6.52 7.33 7.73 7.40 7.77 7.83 6 10 50
Indonesia 8.69 7.91 6.29 6.59 6.65 6.88 6.95 7 36 66
Korea 2.08 2.07 2.47 2.74 2.63 2.74 2.70 -5 -4 23
Malaysia 4.19 4.19 3.91 4.03 3.94 4.12 4.19 6 16 28
Philippines 3.95 4.64 4.93 4.93 4.93 6.05 6.24 19 132 132
Russia 9.62 8.36 7.49 7.02 7.05 7.27 7.35 8 33 -14
Taiwan 1.02 1.20 1.03 0.97 0.97 0.97 0.97 0 0 -6
Thailand 2.49 2.65 2.32 2.39 2.40 2.44 2.60 16 22 28
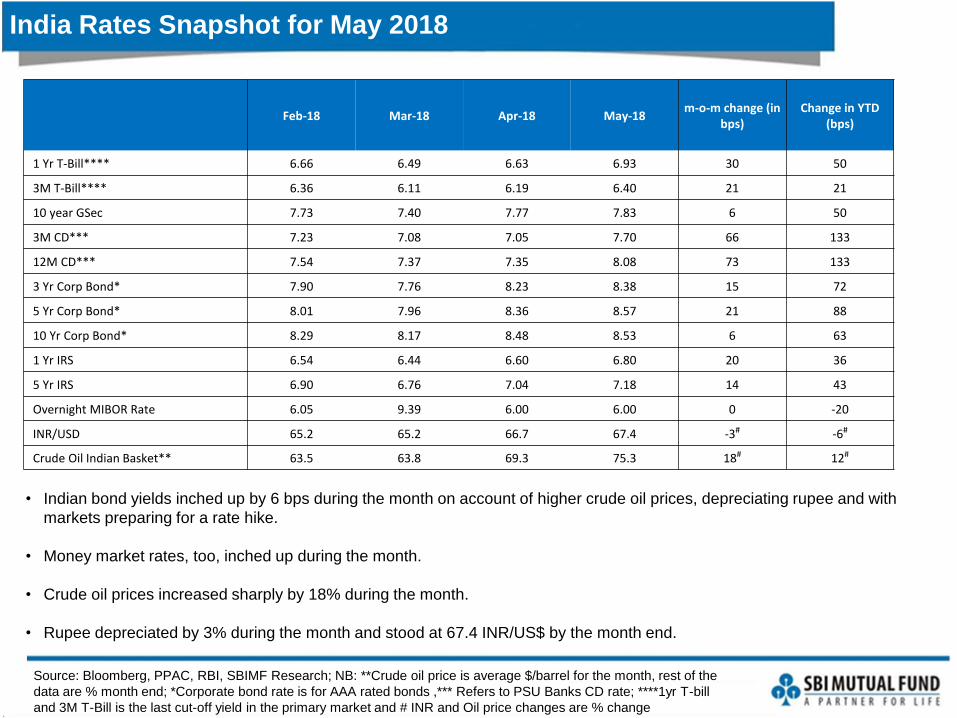
India Rates Snapshot for May 2018
Source: Bloomberg, PPAC, RBI, SBIMF Research; NB: **Crude oil price is average $/barrel for the month, rest of the
data are % month end; *Corporate bond rate is for AAA rated bonds ,*** Refers to PSU Banks CD rate; ****1yr T-bill
and 3M T-Bill is the last cut-off yield in the primary market and # INR and Oil price changes are % change
• Indian bond yields inched up by 6 bps during the month on account of higher crude oil prices, depreciating rupee and with
markets preparing for a rate hike.
• Money market rates, too, inched up during the month.
• Crude oil prices increased sharply by 18% during the month.
• Rupee depreciated by 3% during the month and stood at 67.4 INR/US$ by the month end.
Feb-18 Mar-18 Apr-18 May-18m-o-m change (in
bps)Change in YTD
(bps)
1 Yr T-Bill**** 6.66 6.49 6.63 6.93 30 50
3M T-Bill**** 6.36 6.11 6.19 6.40 21 21
10 year GSec 7.73 7.40 7.77 7.83 6 50
3M CD*** 7.23 7.08 7.05 7.70 66 133
12M CD*** 7.54 7.37 7.35 8.08 73 133
3 Yr Corp Bond* 7.90 7.76 8.23 8.38 15 72
5 Yr Corp Bond* 8.01 7.96 8.36 8.57 21 88
10 Yr Corp Bond* 8.29 8.17 8.48 8.53 6 63
1 Yr IRS 6.54 6.44 6.60 6.80 20 36
5 Yr IRS 6.90 6.76 7.04 7.18 14 43
Overnight MIBOR Rate 6.05 9.39 6.00 6.00 0 -20
INR/USD 65.2 65.2 66.7 67.4 -3# -6#
Crude Oil Indian Basket** 63.5 63.8 69.3 75.3 18# 12#
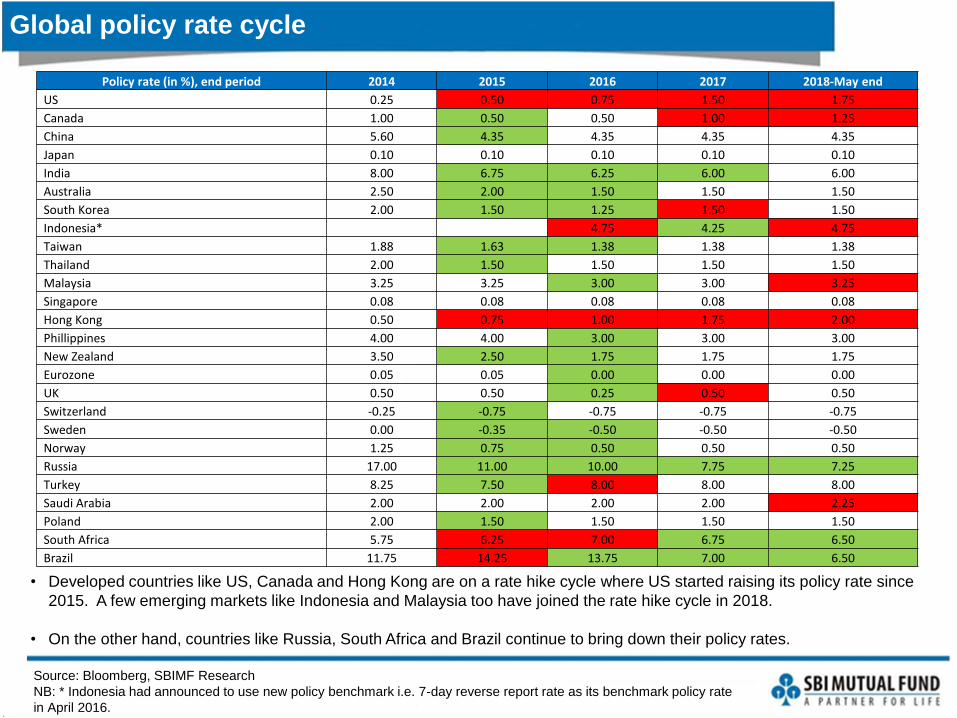
Global policy rate cycle
Source: Bloomberg, SBIMF Research
NB: * Indonesia had announced to use new policy benchmark i.e. 7-day reverse report rate as its benchmark policy rate
in April 2016.
• Developed countries like US, Canada and Hong Kong are on a rate hike cycle where US started raising its policy rate since
2015. A few emerging markets like Indonesia and Malaysia too have joined the rate hike cycle in 2018.
• On the other hand, countries like Russia, South Africa and Brazil continue to bring down their policy rates.
Policy rate (in %), end period 2014 2015 2016 2017 2018-May end
US 0.25 0.50 0.75 1.50 1.75
Canada 1.00 0.50 0.50 1.00 1.25
China 5.60 4.35 4.35 4.35 4.35
Japan 0.10 0.10 0.10 0.10 0.10
India 8.00 6.75 6.25 6.00 6.00
Australia 2.50 2.00 1.50 1.50 1.50
South Korea 2.00 1.50 1.25 1.50 1.50
Indonesia* 4.75 4.25 4.75
Taiwan 1.88 1.63 1.38 1.38 1.38
Thailand 2.00 1.50 1.50 1.50 1.50
Malaysia 3.25 3.25 3.00 3.00 3.25
Singapore 0.08 0.08 0.08 0.08 0.08
Hong Kong 0.50 0.75 1.00 1.75 2.00
Phillippines 4.00 4.00 3.00 3.00 3.00
New Zealand 3.50 2.50 1.75 1.75 1.75
Eurozone 0.05 0.05 0.00 0.00 0.00
UK 0.50 0.50 0.25 0.50 0.50
Switzerland -0.25 -0.75 -0.75 -0.75 -0.75
Sweden 0.00 -0.35 -0.50 -0.50 -0.50
Norway 1.25 0.75 0.50 0.50 0.50
Russia 17.00 11.00 10.00 7.75 7.25
Turkey 8.25 7.50 8.00 8.00 8.00
Saudi Arabia 2.00 2.00 2.00 2.00 2.25
Poland 2.00 1.50 1.50 1.50 1.50
South Africa 5.75 6.25 7.00 6.75 6.50
Brazil 11.75 14.25 13.75 7.00 6.50
India 10 year G-sec yields: Increased Volatility
Source: Bloomberg, SBIMF Research,
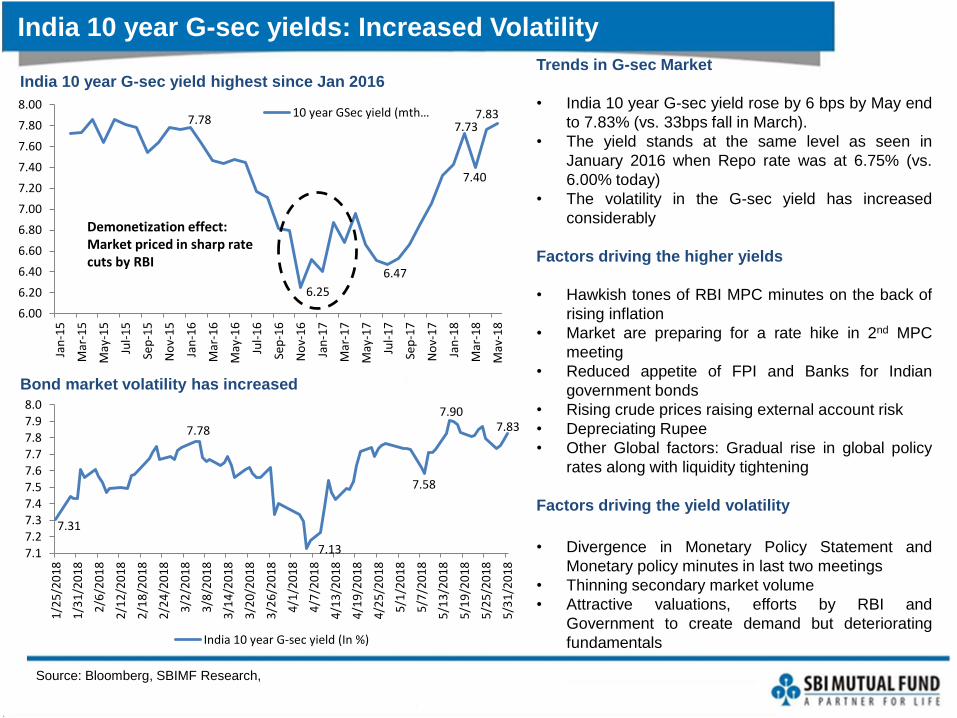
Trends in G-sec Market
• India 10 year G-sec yield rose by 6 bps by May end
to 7.83% (vs. 33bps fall in March).
• The yield stands at the same level as seen in
January 2016 when Repo rate was at 6.75% (vs.
6.00% today)
• The volatility in the G-sec yield has increased
considerably
Factors driving the higher yields
• Hawkish tones of RBI MPC minutes on the back of
rising inflation
• Market are preparing for a rate hike in 2nd MPC
meeting
• Reduced appetite of FPI and Banks for Indian
government bonds
• Rising crude prices raising external account risk
• Depreciating Rupee
• Other Global factors: Gradual rise in global policy
rates along with liquidity tightening
Factors driving the yield volatility
• Divergence in Monetary Policy Statement and
Monetary policy minutes in last two meetings
• Thinning secondary market volume
• Attractive valuations, efforts by RBI and
Government to create demand but deteriorating
fundamentals
India 10 year G-sec yield highest since Jan 2016
Bond market volatility has increased
7.78
6.25
6.47
7.73
7.40
7.83
6.00
6.20
6.40
6.60
6.80
7.00
7.20
7.40
7.60
7.80
8.00
Jan
-15
Mar
-15
May
-15
Jul-
15
Sep
-15
No
v-1
5
Jan
-16
Mar
-16
May
-16
Jul-
16
Sep
-16
No
v-1
6
Jan
-17
Mar
-17
May
-17
Jul-
17
Sep
-17
No
v-1
7
Jan
-18
Mar
-18
May
-18
10 year GSec yield (mth…
Demonetization effect: Market priced in sharp rate cuts by RBI
7.31
7.78
7.13
7.58
7.907.83
7.17.27.37.47.57.67.77.87.98.0
1/2
5/2
01
8
1/3
1/2
01
8
2/6
/20
18
2/1
2/2
01
8
2/1
8/2
01
8
2/2
4/2
01
8
3/2
/20
18
3/8
/20
18
3/1
4/2
01
8
3/2
0/2
01
8
3/2
6/2
01
8
4/1
/20
18
4/7
/20
18
4/1
3/2
01
8
4/1
9/2
01
8
4/2
5/2
01
8
5/1
/20
18
5/7
/20
18
5/1
3/2
01
8
5/1
9/2
01
8
5/2
5/2
01
8
5/3
1/2
01
8
India 10 year G-sec yield (In %)
CPI inflation inched up in April
Source: CMIE economic outlook, CSO, SBIMF Research
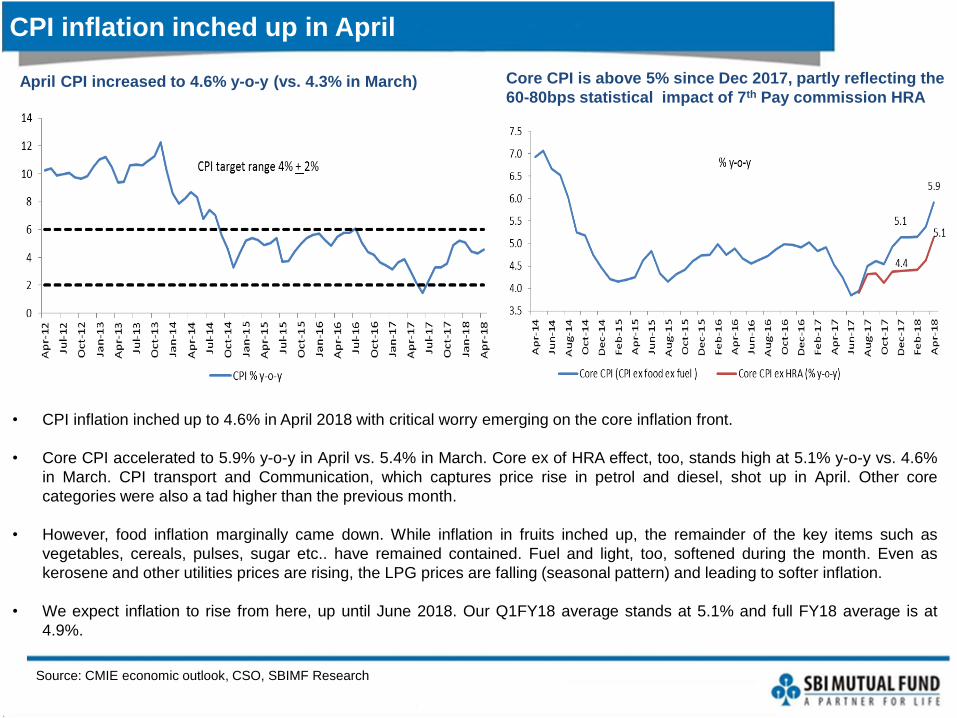
April CPI increased to 4.6% y-o-y (vs. 4.3% in March) Core CPI is above 5% since Dec 2017, partly reflecting the
60-80bps statistical impact of 7th Pay commission HRA
• CPI inflation inched up to 4.6% in April 2018 with critical worry emerging on the core inflation front.
• Core CPI accelerated to 5.9% y-o-y in April vs. 5.4% in March. Core ex of HRA effect, too, stands high at 5.1% y-o-y vs. 4.6%
in March. CPI transport and Communication, which captures price rise in petrol and diesel, shot up in April. Other core
categories were also a tad higher than the previous month.
• However, food inflation marginally came down. While inflation in fruits inched up, the remainder of the key items such as
vegetables, cereals, pulses, sugar etc.. have remained contained. Fuel and light, too, softened during the month. Even as
kerosene and other utilities prices are rising, the LPG prices are falling (seasonal pattern) and leading to softer inflation.
• We expect inflation to rise from here, up until June 2018. Our Q1FY18 average stands at 5.1% and full FY18 average is at
4.9%.
GST Trends: Walking a tight rope
Source: pib.nic.in, CGA, SBIMF Research
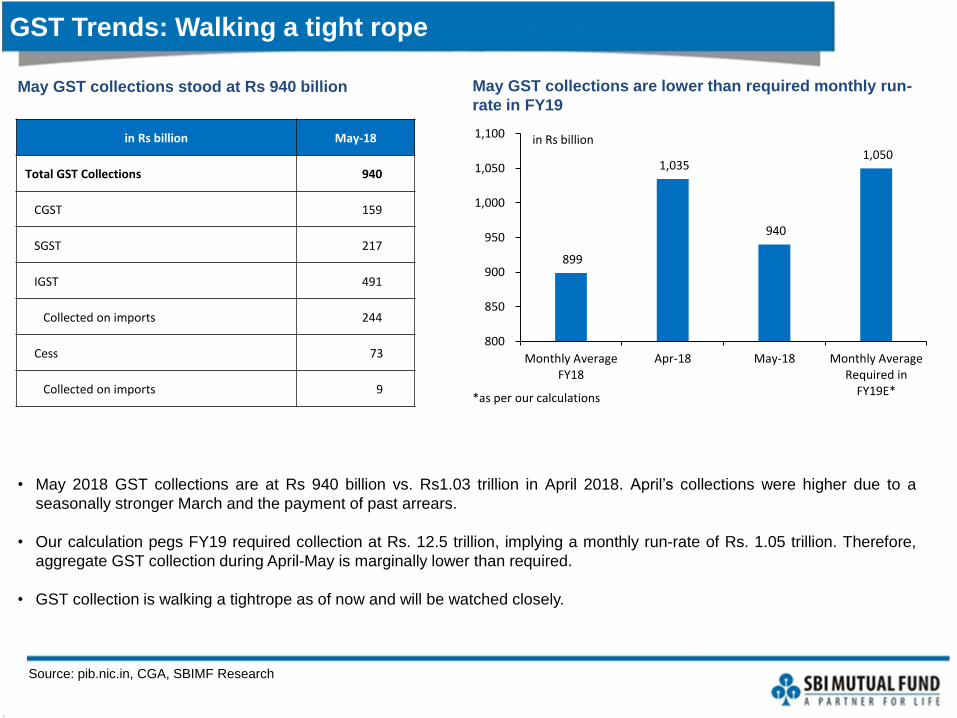
May GST collections stood at Rs 940 billion
• May 2018 GST collections are at Rs 940 billion vs. Rs1.03 trillion in April 2018. April’s collections were higher due to a
seasonally stronger March and the payment of past arrears.
• Our calculation pegs FY19 required collection at Rs. 12.5 trillion, implying a monthly run-rate of Rs. 1.05 trillion. Therefore,
aggregate GST collection during April-May is marginally lower than required.
• GST collection is walking a tightrope as of now and will be watched closely.
May GST collections are lower than required monthly run-
rate in FY19
in Rs billion May-18
Total GST Collections 940
CGST 159
SGST 217
IGST 491
Collected on imports 244
Cess 73
Collected on imports 9
899
1,035
940
1,050
800
850
900
950
1,000
1,050
1,100
Monthly AverageFY18
Apr-18 May-18 Monthly AverageRequired in
FY19E*
in Rs billion
*as per our calculations

Prices for most commodities have been on the rise
Source: Bloomberg, SBIMF Research
Commodities prices have been on a broad ascending path since 2016
Energy prices have witnessed a broad-based rise, agriculture commodities, precious metals and basic metals
show mixed trends
129.3
154.0
126
136
146
156
166
176M
ar-1
3
May
-13
Jul-
13
Sep
-13
No
v-1
3
Jan
-14
Mar
-14
May
-14
Jul-
14
Sep
-14
No
v-1
4
Jan
-15
Mar
-15
May
-15
Jul-
15
Sep
-15
No
v-1
5
Jan
-16
Mar
-16
May
-16
Jul-
16
Sep
-16
No
v-1
6
Jan
-17
Mar
-17
May
-17
Jul-
17
Sep
-17
No
v-1
7
Jan
-18
Mar
-18
May
-18
CRB Commodity Index
-18
-10
-6 -5 -5 -4 -20
2 2 3 3 47
9 11 1214 14 15
1720 21
23 24
-20
-15
-10
-5
0
5
10
15
20
25
30
Sugar Coffee Palladium Copper Silver Iron Ore NaturalGas
Corn Coal Gasoline Heating Oil WTI Nickel
% Change YTD
Crude uptick pushes yields higher
Source: Bloomberg, CMIE Economic Outlook, PPAC, SBIMF Research,
25
35
45
55
65
75
85
95
105
115
125
Sep
-11
Jan
-12
May
-12
Sep
-12
Jan
-13
May
-13
Sep
-13
Jan
-14
May
-14
Sep
-14
Jan
-15
May
-15
Sep
-15
Jan
-16
May
-16
Sep
-16
Jan
-17
May
-17
Sep
-17
Jan
-18
May
-18
Prices of Crude Oil in Global Market (Indian Basket; USD/Barrel)
0
20
40
60
80
100
120
140
5.0
5.5
6.0
6.5
7.0
7.5
8.0
8.5
9.0
9.5
10.0
Jan
-05
Oct
-05
Jul-
06
Ap
r-0
7
Jan
-08
Oct
-08
Jul-
09
Ap
r-1
0
Jan
-11
Oct
-11
Jul-
12
Ap
r-1
3
Jan
-14
Oct
-14
Jul-
15
Ap
r-1
6
Jan
-17
Oct
-17
10 year GSec yield (mth end, %)
Crude Oil Price Indian Basket (Average Price) - RHS
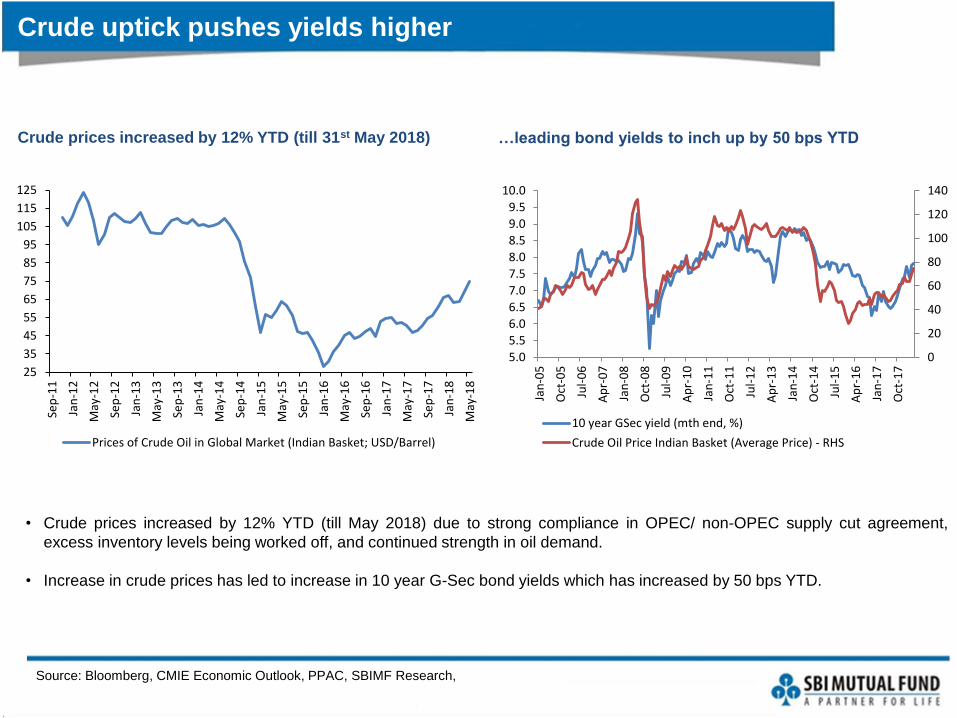
Crude prices increased by 12% YTD (till 31st May 2018) …leading bond yields to inch up by 50 bps YTD
• Crude prices increased by 12% YTD (till May 2018) due to strong compliance in OPEC/ non-OPEC supply cut agreement,
excess inventory levels being worked off, and continued strength in oil demand.
• Increase in crude prices has led to increase in 10 year G-Sec bond yields which has increased by 50 bps YTD.

Source: : International Energy Statistics, PPAC, SBIMF Research
India is the third largest importer of Crude Oil…
India accounts for 10% of global crude import
2015 Net import of Crude Oil
2015 Net import of Crude Oil (In billion barrel)
% share
US 2.4 17.1
China 2.3 16.3
India 1.4 9.9
Japan 1.2 8.1
Korea 1.0 6.8
Germany 0.6 4.5
Italy 0.5 3.3
Spain 0.5 3.2
Netherlands 0.4 2.9
France 0.4 2.8
Others 3.6 25.2
Total 14.3 100.0
100
205
0
2
4
6
8
10
12
14
0
50
100
150
200
250
19
97
-98
19
98
-99
19
99
-00
20
00
-01
20
01
-02
20
02
-03
20
03
-04
20
04
-05
20
05
-06
20
06
-07
20
07
-08
20
08
-09
20
09
-10
20
10
-11
20
11
-12
20
12
-13
20
13
-14
20
14
-15
20
15
-16
20
16
-17
20
17
-18
India Total Consumption of Petreolum Products (Billion Litre)
% growth- RHS
…and imports 86% of its consumption needs
Source: PPAC, SBIMF Research
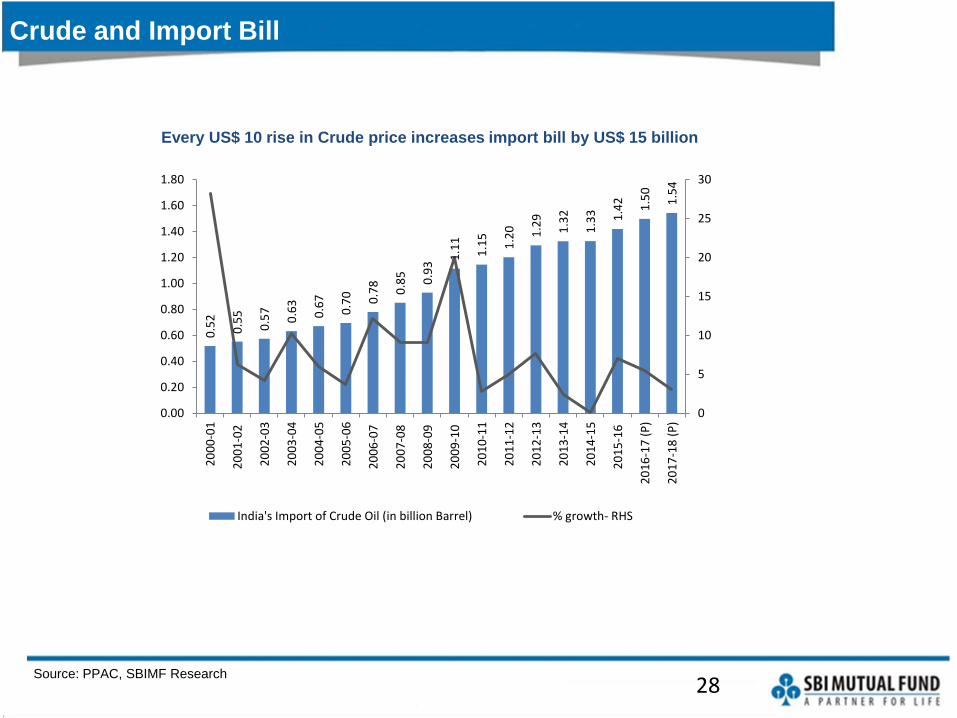
Crude and Import Bill
Every US$ 10 rise in Crude price increases import bill by US$ 15 billion
28
0.5
2
0.5
5
0.5
7
0.6
3
0.6
7
0.7
0 0.7
8
0.8
5
0.9
3
1.1
1
1.1
5
1.2
0 1.2
9
1.3
2
1.3
3 1.4
2
1.5
0
1.5
4
0
5
10
15
20
25
30
0.00
0.20
0.40
0.60
0.80
1.00
1.20
1.40
1.60
1.80
20
00
-01
20
01
-02
20
02
-03
20
03
-04
20
04
-05
20
05
-06
20
06
-07
20
07
-08
20
08
-09
20
09
-10
20
10
-11
20
11
-12
20
12
-13
20
13
-14
20
14
-15
20
15
-16
20
16
-17
(P
)
20
17
-18
(P
)
India's Import of Crude Oil (in billion Barrel) % growth- RHS
Source: PPAC, SBIMF Research
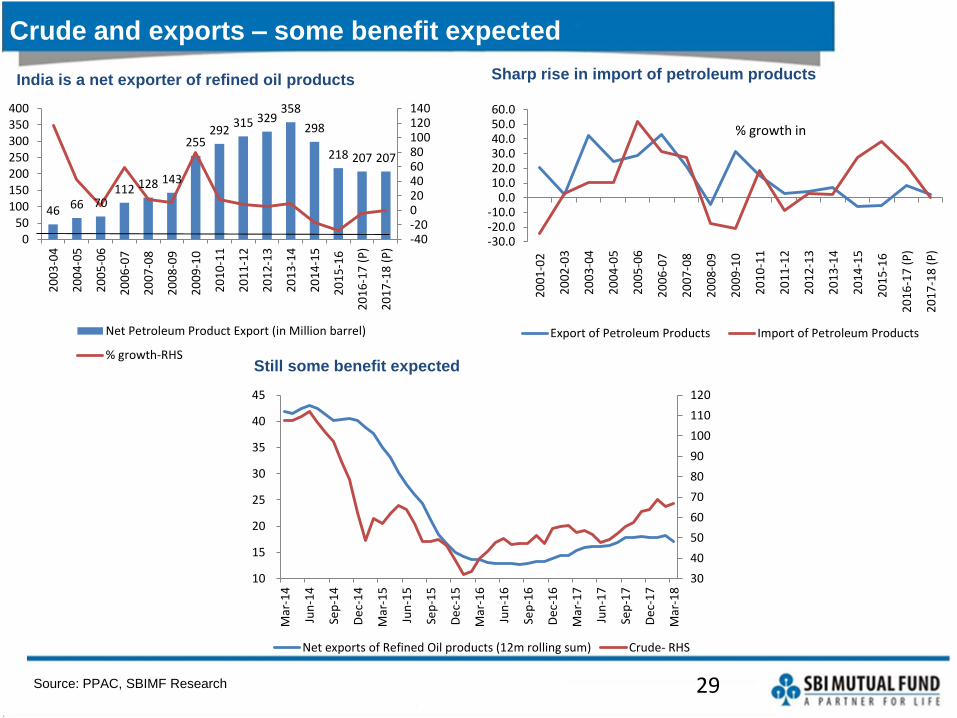
Crude and exports – some benefit expected
India is a net exporter of refined oil products
29
30
40
50
60
70
80
90
100
110
120
10
15
20
25
30
35
40
45
Mar
-14
Jun
-14
Sep
-14
De
c-1
4
Mar
-15
Jun
-15
Sep
-15
De
c-1
5
Mar
-16
Jun
-16
Sep
-16
De
c-1
6
Mar
-17
Jun
-17
Sep
-17
De
c-1
7
Mar
-18
Net exports of Refined Oil products (12m rolling sum) Crude- RHS
46 66 70112 128 143
255292
315 329358
298
218 207 207
-40-20020406080100120140
050
100150200250300350400
20
03
-04
20
04
-05
20
05
-06
20
06
-07
20
07
-08
20
08
-09
20
09
-10
20
10
-11
20
11
-12
20
12
-13
20
13
-14
20
14
-15
20
15
-16
20
16
-17
(P
)
20
17
-18
(P
)
Net Petroleum Product Export (in Million barrel)
% growth-RHS
-30.0-20.0-10.0
0.010.020.030.040.050.060.0
20
01
-02
20
02
-03
20
03
-04
20
04
-05
20
05
-06
20
06
-07
20
07
-08
20
08
-09
20
09
-10
20
10
-11
20
11
-12
20
12
-13
20
13
-14
20
14
-15
20
15
-16
20
16
-17
(P
)
20
17
-18
(P
)
Export of Petroleum Products Import of Petroleum Products
% growth in
Sharp rise in import of petroleum products
Still some benefit expected

Source: Bloomberg, RBI, SBIMF Research
Rising crude prices: Positive bearing on Remittances
Rising oil leads to increased remittances from Indian workers in oil-exporting countries
30
1315 16
22 21
24
30
4245
52 53
63 64 65 6663
5759
20
30
40
50
60
70
80
90
100
110
120
10
20
30
40
50
60
70
FY0
1
FY0
2
FY0
3
FY0
4
FY0
5
FY0
6
FY0
7
FY0
8
FY0
9
FY1
0
FY1
1
FY1
2
FY1
3
FY1
4
FY1
5
FY1
6
FY1
7
FY1
8E
Remittances (US$ billion) Brent (US$/barrel)- RHS
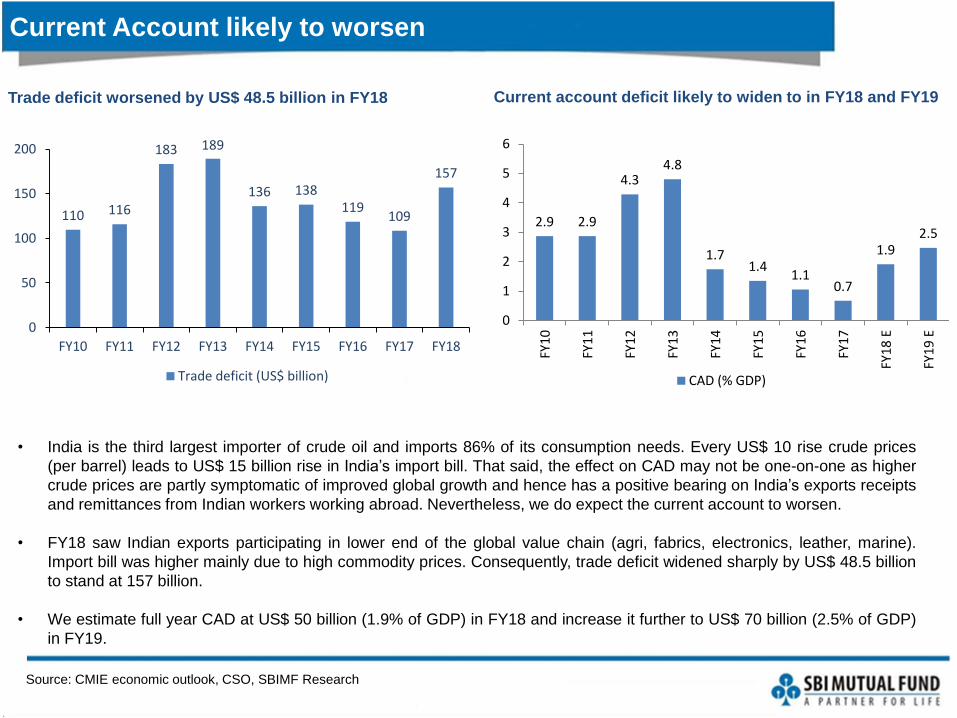
Current Account likely to worsen
Source: CMIE economic outlook, CSO, SBIMF Research
Trade deficit worsened by US$ 48.5 billion in FY18
• India is the third largest importer of crude oil and imports 86% of its consumption needs. Every US$ 10 rise crude prices
(per barrel) leads to US$ 15 billion rise in India’s import bill. That said, the effect on CAD may not be one-on-one as higher
crude prices are partly symptomatic of improved global growth and hence has a positive bearing on India’s exports receipts
and remittances from Indian workers working abroad. Nevertheless, we do expect the current account to worsen.
• FY18 saw Indian exports participating in lower end of the global value chain (agri, fabrics, electronics, leather, marine).
Import bill was higher mainly due to high commodity prices. Consequently, trade deficit widened sharply by US$ 48.5 billion
to stand at 157 billion.
• We estimate full year CAD at US$ 50 billion (1.9% of GDP) in FY18 and increase it further to US$ 70 billion (2.5% of GDP)
in FY19.
Current account deficit likely to widen to in FY18 and FY19
110 116
183 189
136 138119
109
157
0
50
100
150
200
FY10 FY11 FY12 FY13 FY14 FY15 FY16 FY17 FY18
Trade deficit (US$ billion)
2.9 2.9
4.34.8
1.71.4
1.10.7
1.92.5
0
1
2
3
4
5
6
FY1
0
FY1
1
FY12
FY1
3
FY1
4
FY1
5
FY1
6
FY1
7
FY1
8 E
FY1
9 E
CAD (% GDP)
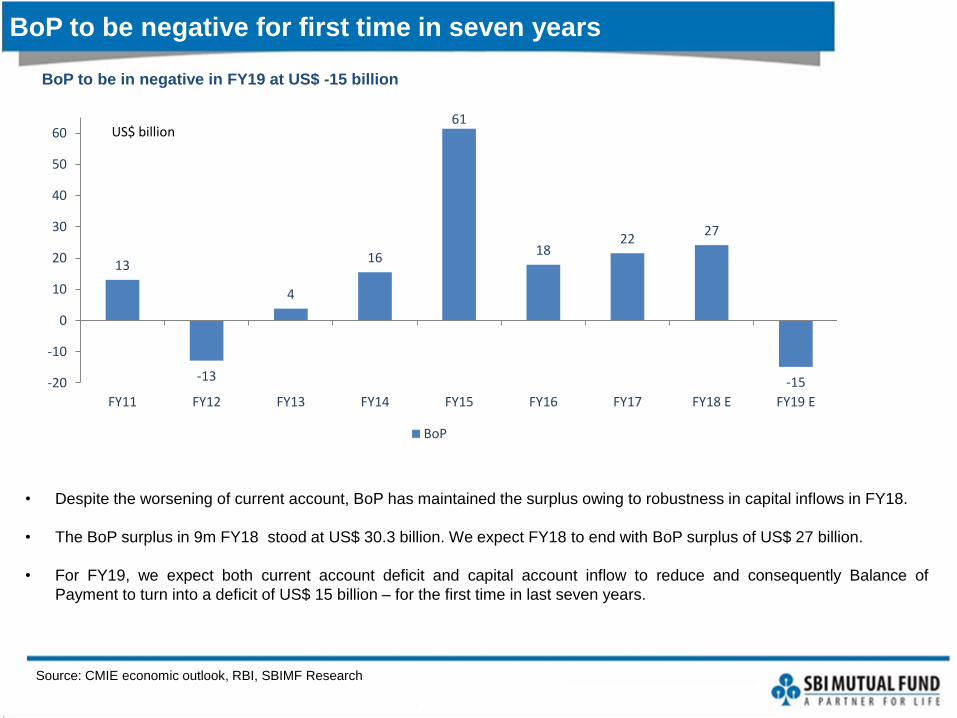
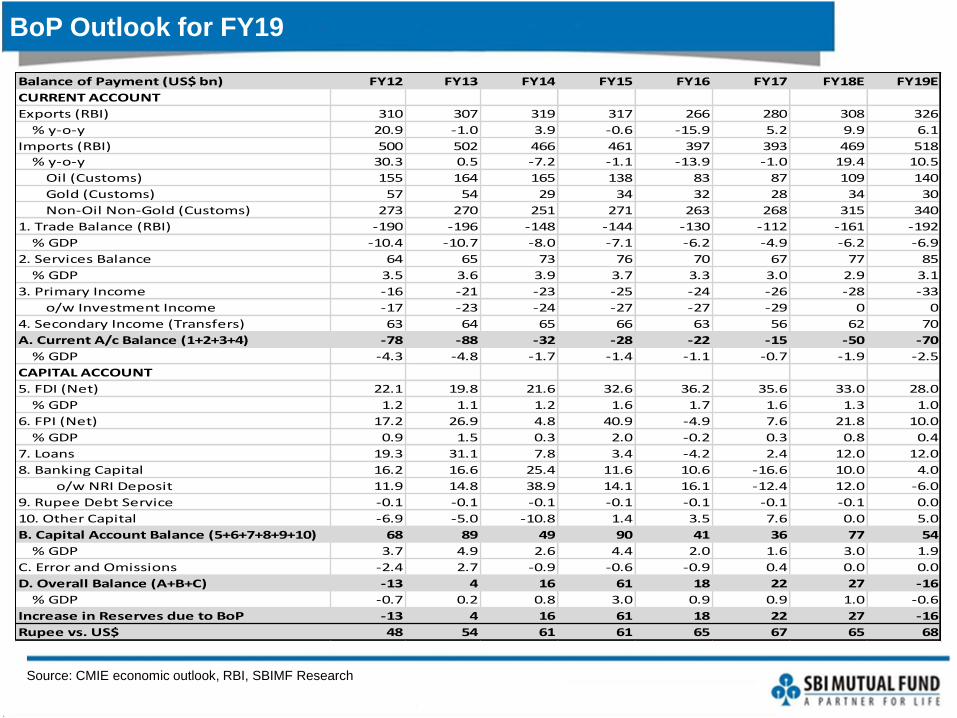
BoP to be negative for first time in seven years
Source: CMIE economic outlook, RBI, SBIMF Research
BoP to be in negative in FY19 at US$ -15 billion
• Despite the worsening of current account, BoP has maintained the surplus owing to robustness in capital inflows in FY18.
• The BoP surplus in 9m FY18 stood at US$ 30.3 billion. We expect FY18 to end with BoP surplus of US$ 27 billion.
• For FY19, we expect both current account deficit and capital account inflow to reduce and consequently Balance of
Payment to turn into a deficit of US$ 15 billion – for the first time in last seven years.
13
-13
4
16
61
1822
27
-15-20
-10
0
10
20
30
40
50
60
FY11 FY12 FY13 FY14 FY15 FY16 FY17 FY18 E FY19 E
BoP
US$ billion
BoP Outlook for FY19
Source: CMIE economic outlook, RBI, SBIMF Research
Balance of Payment (US$ bn) FY12 FY13 FY14 FY15 FY16 FY17 FY18E FY19E
CURRENT ACCOUNT
Exports (RBI) 310 307 319 317 266 280 308 326
% y-o-y 20.9 -1.0 3.9 -0.6 -15.9 5.2 9.9 6.1
Imports (RBI) 500 502 466 461 397 393 469 518
% y-o-y 30.3 0.5 -7.2 -1.1 -13.9 -1.0 19.4 10.5
Oil (Customs) 155 164 165 138 83 87 109 140
Gold (Customs) 57 54 29 34 32 28 34 30
Non-Oil Non-Gold (Customs) 273 270 251 271 263 268 315 340
1. Trade Balance (RBI) -190 -196 -148 -144 -130 -112 -161 -192
% GDP -10.4 -10.7 -8.0 -7.1 -6.2 -4.9 -6.2 -6.9
2. Services Balance 64 65 73 76 70 67 77 85
% GDP 3.5 3.6 3.9 3.7 3.3 3.0 2.9 3.1
3. Primary Income -16 -21 -23 -25 -24 -26 -28 -33
o/w Investment Income -17 -23 -24 -27 -27 -29 0 0
4. Secondary Income (Transfers) 63 64 65 66 63 56 62 70
A. Current A/c Balance (1+2+3+4) -78 -88 -32 -28 -22 -15 -50 -70
% GDP -4.3 -4.8 -1.7 -1.4 -1.1 -0.7 -1.9 -2.5
CAPITAL ACCOUNT
5. FDI (Net) 22.1 19.8 21.6 32.6 36.2 35.6 33.0 28.0
% GDP 1.2 1.1 1.2 1.6 1.7 1.6 1.3 1.0
6. FPI (Net) 17.2 26.9 4.8 40.9 -4.9 7.6 21.8 10.0
% GDP 0.9 1.5 0.3 2.0 -0.2 0.3 0.8 0.4
7. Loans 19.3 31.1 7.8 3.4 -4.2 2.4 12.0 12.0
8. Banking Capital 16.2 16.6 25.4 11.6 10.6 -16.6 10.0 4.0
o/w NRI Deposit 11.9 14.8 38.9 14.1 16.1 -12.4 12.0 -6.0
9. Rupee Debt Service -0.1 -0.1 -0.1 -0.1 -0.1 -0.1 -0.1 0.0
10. Other Capital -6.9 -5.0 -10.8 1.4 3.5 7.6 0.0 5.0
B. Capital Account Balance (5+6+7+8+9+10) 68 89 49 90 41 36 77 54
% GDP 3.7 4.9 2.6 4.4 2.0 1.6 3.0 1.9
C. Error and Omissions -2.4 2.7 -0.9 -0.6 -0.9 0.4 0.0 0.0
D. Overall Balance (A+B+C) -13 4 16 61 18 22 27 -16
% GDP -0.7 0.2 0.8 3.0 0.9 0.9 1.0 -0.6
Increase in Reserves due to BoP -13 4 16 61 18 22 27 -16
Rupee vs. US$ 48 54 61 61 65 67 65 68
Source: CMIE Economic Outlook, Bloomberg, SBIMF Research
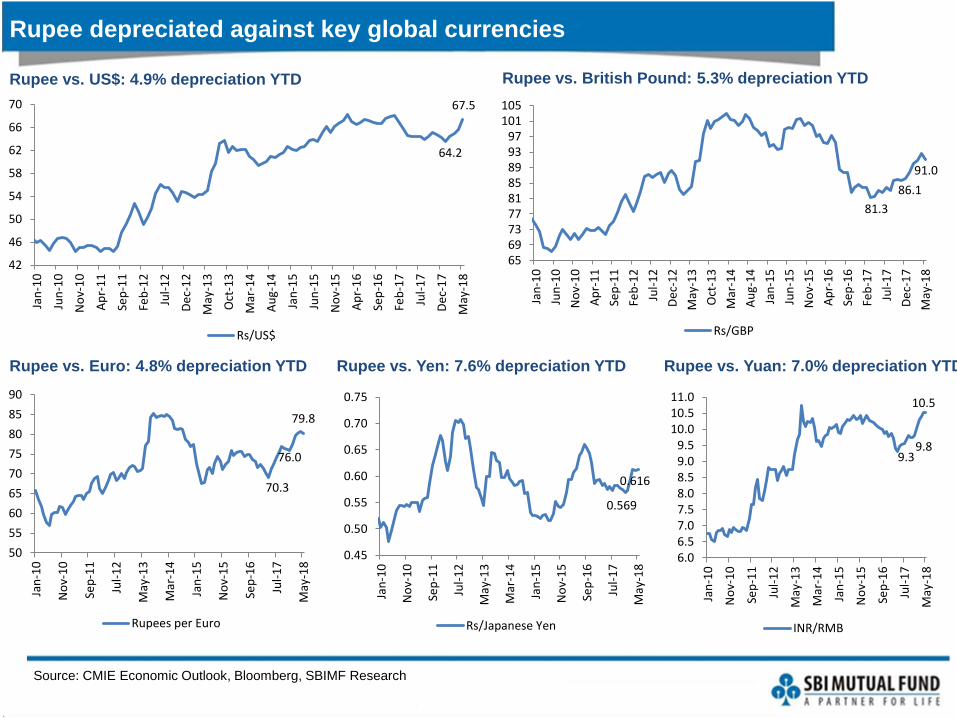
Rupee depreciated against key global currencies
Rupee vs. Yuan: 7.0% depreciation YTD
Rupee vs. British Pound: 5.3% depreciation YTD
Rupee vs. Euro: 4.8% depreciation YTD
70.3
76.0
79.8
50
55
60
65
70
75
80
85
90
Jan
-10
No
v-1
0
Sep
-11
Jul-
12
May
-13
Mar
-14
Jan
-15
No
v-1
5
Sep
-16
Jul-
17
May
-18
Rupees per Euro
Rupee vs. Yen: 7.6% depreciation YTD
9.39.8
10.5
6.06.57.07.58.08.59.09.5
10.010.511.0
Jan
-10
No
v-1
0
Sep
-11
Jul-
12
May
-13
Mar
-14
Jan
-15
No
v-1
5
Sep
-16
Jul-
17
May
-18
INR/RMB
81.3
86.1
91.0
656973778185899397
101105
Jan
-10
Jun
-10
No
v-1
0
Ap
r-1
1
Sep
-11
Feb
-12
Jul-
12
De
c-1
2
May
-13
Oct
-13
Mar
-14
Au
g-1
4
Jan
-15
Jun
-15
No
v-1
5
Ap
r-1
6
Sep
-16
Feb
-17
Jul-
17
De
c-1
7
May
-18
Rs/GBP
0.569
0.616
0.45
0.50
0.55
0.60
0.65
0.70
0.75Ja
n-1
0
No
v-1
0
Sep
-11
Jul-
12
May
-13
Mar
-14
Jan
-15
No
v-1
5
Sep
-16
Jul-
17
May
-18
Rs/Japanese Yen
64.2
67.5
42
46
50
54
58
62
66
70
Jan
-10
Jun
-10
No
v-1
0
Ap
r-1
1
Sep
-11
Feb
-12
Jul-
12
De
c-1
2
May
-13
Oct
-13
Mar
-14
Au
g-1
4
Jan
-15
Jun
-15
No
v-1
5
Ap
r-1
6
Sep
-16
Feb
-17
Jul-
17
De
c-1
7
May
-18
Rs/US$
Rupee vs. US$: 4.9% depreciation YTD

DXY strengthened; ADXY weakened; Rupee is an under-performer
Source: Bloomberg, SBIMF Research
94.9
89.4
94.1
87
90
93
96
99
102
Ap
r-1
6M
ay-1
6Ju
n-1
6Ju
l-1
6A
ug-
16
Sep
-16
Oct
-16
No
v-1
6D
ec-
16
Jan
-17
Feb
-17
Mar
-17
Ap
r-1
7M
ay-1
7Ju
n-1
7Ju
l-1
7A
ug-
17
Sep
-17
Oct
-17
No
v-1
7D
ec-
17
Jan
-18
Feb
-18
Mar
-18
Ap
r-1
8M
ay-1
8
DXY Index
Dollar strengthened by 4.3% FYTD
112.1
109.4
102
107
112
117
122
Jan
-13
May
-13
Sep
-13
Jan
-14
May
-14
Sep
-14
Jan
-15
May
-15
Sep
-15
Jan
-16
May
-16
Sep
-16
Jan
-17
May
-17
Sep
-17
Jan
-18
May
-18
ADXY Index
Asian currencies weakened by 1.9% FYTD
-15.7
-11.2
-7.2-5.6 -5.3 -5.2 -5.0
-2.3 -1.5 -0.8 -0.7 -0.5
1.6 1.7 1.8 3.9
-20
-15
-10
-5
0
5
Turk
ey
Lira
Bra
zil R
eal
Ru
ssia
n R
ou
ble
Po
lish
Zlo
ty
Ind
ian
Ru
pe
e
Hu
nga
rian
Fo
rin
t
Ph
ilip
pin
e P
eso
Ind
on
esi
an R
up
iah
Afr
ican
Ran
d
Me
xica
n P
eso
Ko
rean
Wo
n
Taiw
anes
e D
olla
r
Ch
ine
se r
enm
inb
i
Mal
aysi
an R
ingi
tt
Thai
Bah
t
Co
lom
bia
n P
eso
% change YTD
Rupee has been an under-performer in the EM currency Basket YTD

2013 and today: Definitely better
May-13 May-18 Better or Worse Comments
Fiscal Situation- Worse
Central Fiscal Deficit (% GDP) 4.9% 3.5% Better FY13 vs. FY18 figure
State Fiscal Deficit (% GDP) 2.0% 3.0% Worse FY13 vs. FY18 figure
Total Bond Supply Rs. Tril l ion 7.6 11.5 Worse FY14 vs. FY19; A major buyer PSU Banks are out of market
Inflation- Better
CPI % y-o-y 10.4 4.7 Better Preceeding 6 month avg
CPI- Outlook % y-o-y 10.0 5.0 Better FY14 vs. FY19
External Account- Better
CAD US$ bn 88 50 Better FY13 vs. FY18E
CAD % GDP 4.8 1.9 Better FY13 vs. FY18E
BoP US$ bn 4 27 Better FY13 vs. FY18E
FX Reserves US$ bn 259 420 Better May 2013 vs. May 2018
Import Cover months 7.2 10.9 Better May 2013 vs. Latest as of Mar 2018
FX Reserves/St Debt Ratio 3.1 4.1 Better May 2013 vs. Latest as of Mar 2018
FX Reserves/ (1 yr CAD+ ST Debt) Ratio 1.6 2.9 Better May 2013 vs. Latest as of Mar 2018
FX Reserves/ Outstanding FII Stock Ratio 0.6 0.6 Same May 2013 vs. Latest as of Mar 2018
Gold Imports US$ bn 54 34 Better FY13 vs. FY18
Growth- Better
GDP % y-o-y 4.8 6.8 Better 2H FY13 vs. 2H FY18
GDP- Outlook % y-o-y 6.5 7.6 Better FY14 vs. FY19
External Situation- Better
Crude Oil - Brent US$ bbl 103 78 Better During the month
DXY % Change 4.0 0.0 Better In preceeding 6 months
Rs./US$ % Change -4.0 -5.2 Same In preceeding 6 months
REER Trade wt 6 ccy 121 125 Same May 2013 vs. Latest as of Mar 2018
Rates- Better
India Real Rate (Policy rate- CPI) bps -120 130 Better April 2018 vs. May 2013
India-US Real Rate Differential (10 yr-CPI) bps -190 270 Worse April 2018 vs. May 2013
Proximity to Election
General election months 12 12 Same
Source: CMIE Economic Outlook, RBI, Bloomberg, SBIMF Research
Source: State Budgets, RBI, Union Budgets, SBIMF Research;
NB: * 20 states analyzed are AP, Bihar, Chhattisgarh, Gujarat, Haryana, HP, Jharkhand, Karnataka, Kerala, MP,
Maharashtra, Mizoram, Odisha, Punjab, Rajasthan, TN, UP and WB.
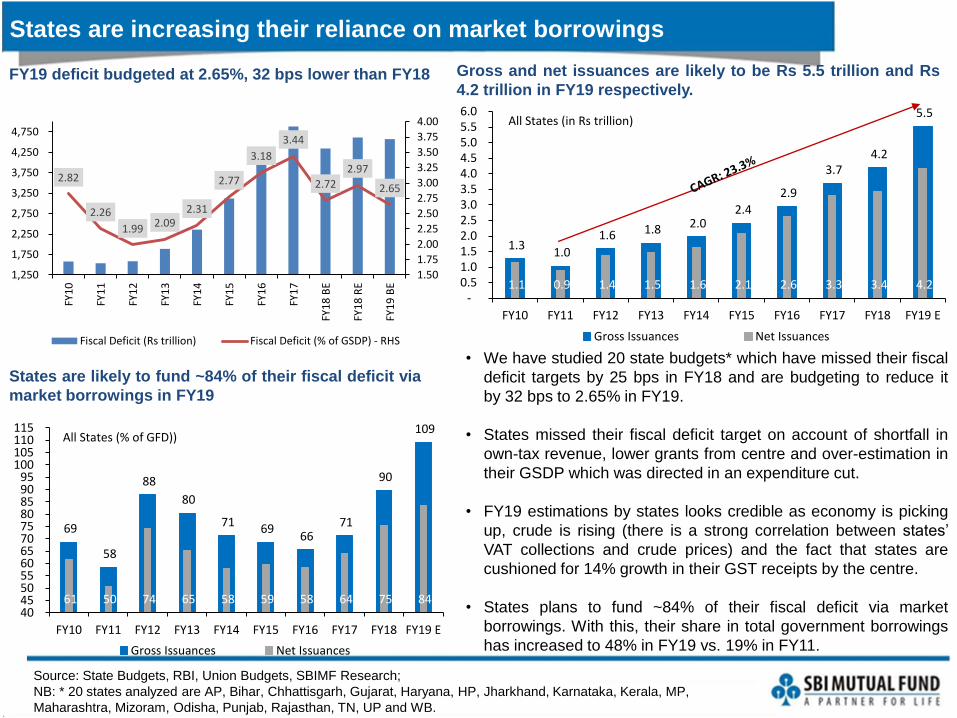
States are increasing their reliance on market borrowings
FY19 deficit budgeted at 2.65%, 32 bps lower than FY18
2.82
2.26
1.99 2.092.31
2.77
3.18
3.44
2.72
2.97
2.65
1.50
1.75
2.00
2.25
2.50
2.75
3.00
3.25
3.50
3.75
4.00
1,250
1,750
2,250
2,750
3,250
3,750
4,250
4,750
FY1
0
FY1
1
FY1
2
FY1
3
FY1
4
FY1
5
FY1
6
FY1
7
FY1
8 B
E
FY1
8 R
E
FY1
9 B
E
Fiscal Deficit (Rs trillion) Fiscal Deficit (% of GSDP) - RHS
1.3 1.0
1.6 1.8 2.0 2.4
2.9
3.7 4.2
5.5
1.1 0.9 1.4 1.5 1.6 2.1 2.6 3.3 3.4 4.2 -
0.5 1.0 1.5 2.0 2.5 3.0 3.5 4.0 4.5 5.0 5.5 6.0
FY10 FY11 FY12 FY13 FY14 FY15 FY16 FY17 FY18 FY19 E
All States (in Rs trillion)
Gross Issuances Net Issuances
69
58
88
80
71 69 66
71
90
109
61 50 74 65 58 59 58 64 75 84 40 45 50 55 60 65 70 75 80 85 90 95
100 105 110 115
FY10 FY11 FY12 FY13 FY14 FY15 FY16 FY17 FY18 FY19 E
All States (% of GFD))
Gross Issuances Net Issuances
Gross and net issuances are likely to be Rs 5.5 trillion and Rs
4.2 trillion in FY19 respectively.
States are likely to fund ~84% of their fiscal deficit via
market borrowings in FY19
• We have studied 20 state budgets* which have missed their fiscal
deficit targets by 25 bps in FY18 and are budgeting to reduce it
by 32 bps to 2.65% in FY19.
• States missed their fiscal deficit target on account of shortfall in
own-tax revenue, lower grants from centre and over-estimation in
their GSDP which was directed in an expenditure cut.
• FY19 estimations by states looks credible as economy is picking
up, crude is rising (there is a strong correlation between states’
VAT collections and crude prices) and the fact that states are
cushioned for 14% growth in their GST receipts by the centre.
• States plans to fund ~84% of their fiscal deficit via market
borrowings. With this, their share in total government borrowings
has increased to 48% in FY19 vs. 19% in FY11.
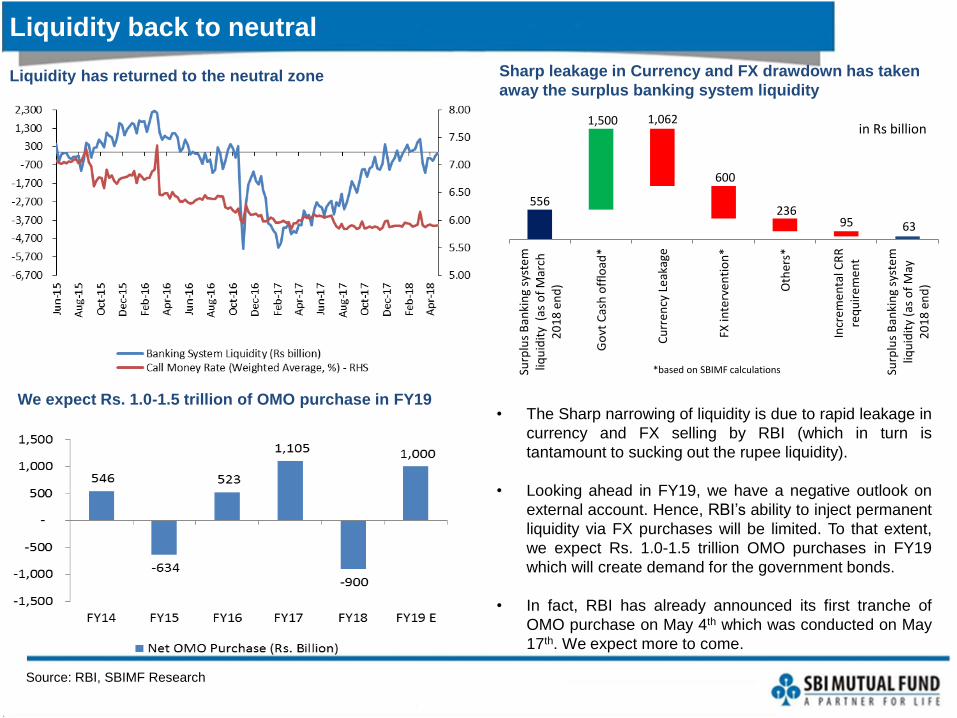
Liquidity back to neutral
Source: RBI, SBIMF Research
Sharp leakage in Currency and FX drawdown has taken
away the surplus banking system liquidity
• The Sharp narrowing of liquidity is due to rapid leakage in
currency and FX selling by RBI (which in turn is
tantamount to sucking out the rupee liquidity).
• Looking ahead in FY19, we have a negative outlook on
external account. Hence, RBI’s ability to inject permanent
liquidity via FX purchases will be limited. To that extent,
we expect Rs. 1.0-1.5 trillion OMO purchases in FY19
which will create demand for the government bonds.
• In fact, RBI has already announced its first tranche of
OMO purchase on May 4th which was conducted on May
17th. We expect more to come.
We expect Rs. 1.0-1.5 trillion of OMO purchase in FY19
Liquidity has returned to the neutral zone
556
1,500 1,062
600
236 95 63
Surp
lus
Ban
kin
g sy
stem
liqu
idit
y (
as o
f M
arch
20
18
en
d)
Go
vt C
ash
off
load
*
Cu
rre
ncy
Le
akag
e
FX in
terv
en
tio
n*
Oth
ers*
Incr
em
en
tal C
RR
req
uir
em
en
t
Surp
lus
Ban
kin
g sy
stem
liqu
idit
y (a
s o
f M
ay2
01
8 e
nd
)
in Rs billion
*based on SBIMF calculations

Thinning Volume in the secondary market
Source: CEIC, CCIL, RBI, SBIMF Research
Trading activity in secondary Market has fallen considerably in
last one year
• Markets turned jittery over concerns of diminishing appetite for government securities and poor participation by banks.
• In FY18, average monthly trading volume for G-sec has fallen considerably (16% of total outstanding securities vs. 26% in
FY17).
• Treasury bills and State Development Loans (SDLs) also witnessed weaker traction during the year.
• Bank CDs and Corporate Bonds, however, saw some pick-up in volumes.
• Thinning volumes for government papers has also added to volatility in the bond market space.
All government papers (G-sec, T-Bill and SDL) saw
weaker volumes in FY18
Total Monthly Traded Volume (% Outstanding)
G-sec T Bill SDL CPs CDsCorp
Bonds
FY13 16.0 14.5 1.2 18.8 22.7 5.4
FY14 18.6 19.7 1.3 31.8 41.0 5.9
FY15 19.1 17.7 1.3 30.6 43.5 5.4
FY16 16.1 17.8 1.9 24.6 48.4 4.1
FY17 26.4 17.9 2.7 25.8 45.9 4.3
FY18 15.8 15.8 2.1 23.3 51.8 4.4

Debt Market Valuations: attractive
Source: Bloomberg, SBIMF Research
3.2% is an attractive real returns for foreign investors Differential between 10-year yield and Repo rate is higher
than average
G-sec yield relative to equity earnings yield higher than long-term trend
10 Year Gsec Yield
(% mth end)-May
2018
CPI Inflation-April 2018
2018
Real Rate (in %)
Sovereign Credit
Rating by Moody’s
Sovereign Credit
Rating by S&P
Brazil 11.46 2.8 8.7 Ba2- BB-
Russia 7.35 2.4 4.9 Ba1 BB+
South Africa 8.72 4.5 4.2 Baa3- BB+
Indonesia 6.95 3.4 3.6 Baa3 BBB-
India 7.83 4.6 3.2 Baa2 BBB-
China 3.63 1.8 1.8 A1 A+
Thailand 2.60 1.1 1.5 Baa2 BBB
Korea 2.70 1.6 1.1 Baa1 BBB+
Malaysia 4.19 1.4 2.8 Aa2 AA
Philippines 6.24 4.5 1.7 A3 A-
US 2.86 2.5 0.4 Aaa AA+
Taiwan 0.97 2.0 -1.0 Aa3 AA-
4.00
5.00
6.00
7.00
8.00
9.00
10.00
11.00
No
v-0
5
May
-06
No
v-0
6
May
-07
No
v-0
7
May
-08
No
v-0
8
May
-09
No
v-0
9
May
-10
No
v-1
0
May
-11
No
v-1
1
May
-12
No
v-1
2
May
-13
No
v-1
3
May
-14
No
v-1
4
May
-15
No
v-1
5
May
-16
No
v-1
6
May
-17
No
v-1
7
May
-18
India Earnings Yield (in %) India 10 Year G-sec (in %)
-150-100
-500
50100150200250300350
Oct
-01
Ap
r-0
2O
ct-0
2A
pr-
03
Oct
-03
Ap
r-0
4O
ct-0
4A
pr-
05
Oct
-05
Ap
r-0
6O
ct-0
6A
pr-
07
Oct
-07
Ap
r-0
8O
ct-0
8A
pr-
09
Oct
-09
Ap
r-1
0O
ct-1
0A
pr-
11
Oct
-11
Ap
r-1
2O
ct-1
2A
pr-
13
Oct
-13
Ap
r-1
4O
ct-1
4A
pr-
15
Oct
-15
Ap
r-1
6O
ct-1
6A
pr-
17
Oct
-17
Ap
r-1
8
India 10 year minus Repo Rate (in bps)
Long Period Average: 88 bps
Policy Rate Outlook
Source: RBI, SBIFM Research
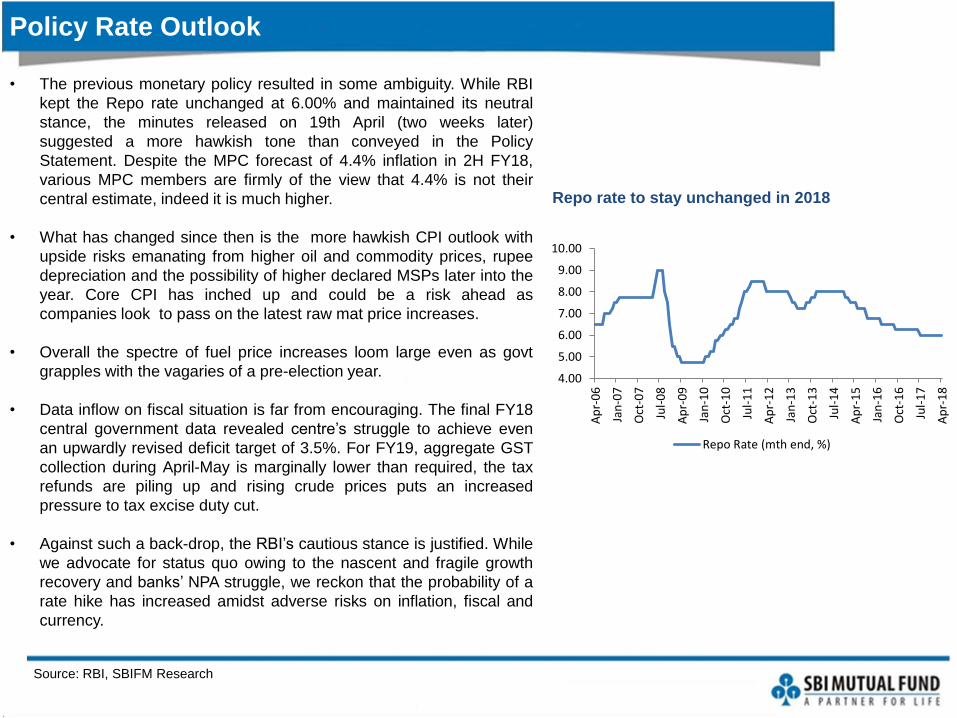
Repo rate to stay unchanged in 2018
• The previous monetary policy resulted in some ambiguity. While RBI
kept the Repo rate unchanged at 6.00% and maintained its neutral
stance, the minutes released on 19th April (two weeks later)
suggested a more hawkish tone than conveyed in the Policy
Statement. Despite the MPC forecast of 4.4% inflation in 2H FY18,
various MPC members are firmly of the view that 4.4% is not their
central estimate, indeed it is much higher.
• What has changed since then is the more hawkish CPI outlook with
upside risks emanating from higher oil and commodity prices, rupee
depreciation and the possibility of higher declared MSPs later into the
year. Core CPI has inched up and could be a risk ahead as
companies look to pass on the latest raw mat price increases.
• Overall the spectre of fuel price increases loom large even as govt
grapples with the vagaries of a pre-election year.
• Data inflow on fiscal situation is far from encouraging. The final FY18
central government data revealed centre’s struggle to achieve even
an upwardly revised deficit target of 3.5%. For FY19, aggregate GST
collection during April-May is marginally lower than required, the tax
refunds are piling up and rising crude prices puts an increased
pressure to tax excise duty cut.
• Against such a back-drop, the RBI’s cautious stance is justified. While
we advocate for status quo owing to the nascent and fragile growth
recovery and banks’ NPA struggle, we reckon that the probability of a
rate hike has increased amidst adverse risks on inflation, fiscal and
currency.
4.00
5.00
6.00
7.00
8.00
9.00
10.00
Ap
r-0
6
Jan
-07
Oct
-07
Jul-
08
Ap
r-0
9
Jan
-10
Oct
-10
Jul-
11
Ap
r-1
2
Jan
-13
Oct
-13
Jul-
14
Ap
r-1
5
Jan
-16
Oct
-16
Jul-
17
Ap
r-1
8
Repo Rate (mth end, %)

Debt Market Outlook
Source: Bloomberg, SBIFM Research
Valuations look attractive at G-sec vs. Repo rate
• Bond market has been particularly volatile with 10 year G-sec gyrating
55bps within a fortnight. The yield hugged 7.13% on the day of monetary
policy (5th April) and shot past 7.75% on release of monetary policy
minutes on 19th April.
• In the policy statement, RBI appeared sanguine on inflation and even
revised their inflation projections lower. However, the minutes released two
weeks later seemed relatively hawkish. Market participants are finding it
difficult to decipher the forward guidance given the divergence between the
Policy Statement and the minutes.
• Our call is that we are in the phase of a prolonged pause, but for the risks
arising from higher commodity prices and any untoward actions by the
government in an election year.
• With crude flanking above US$ 70 per barrel, some familiar problems,
namely budget shortfalls, high inflation, current-account deficits and
pressure on rupee have and could make an unwelcome return.
• Thinning volumes and higher volatility create a vicious cycle with potential
ramifications on risk premium.
• RBI has announced an OMO purchase (due on 17th May), have spelled
out some relaxation in the FPI debt inflow as well as ECB norms so as to
attract foreign capital. We believe, the unfolding fiscal dynamics, MSP
announcements, bank credit demand and global developments remain
important variables where considerable uncertainties persist.
• Looking ahead, given the mix of attractive valuations and prospects of
favourable demand-supply in second half (we expect OMO purchase) but
concerning fundamentals, we would be tactical in taking duration exposure.
6.006.507.007.508.008.509.009.50
May
-11
No
v-1
1
May
-12
No
v-1
2
May
-13
No
v-1
3
May
-14
No
v-1
4
May
-15
No
v-1
5
May
-16
No
v-1
6
May
-17
No
v-1
7
May
-18
10 year GSec yield (mth end, %)
Repo Rate (mth end, %)

Thank you
Disclaimer
This presentation is for information purposes only and is not an offer to sell or a solicitation to buy anymutual fund units/securities. These views alone are not sufficient and should not be used for thedevelopment or implementation of an investment strategy. It should not be construed as investmentadvice to any party. All opinions and estimates included here constitute our view as of this date and aresubject to change without notice. Neither SBI Funds Management Private Limited, nor any personconnected with it, accepts any liability arising from the use of this information. The recipient of thismaterial should rely on their investigations and take their own professional advice.
Mutual Funds investments are subject to market risks, read all scheme related documentscarefully.
Asset Management Company: SBI Funds Management Private Limited (A joint venture with SBI andAMUNDI). Trustee Company: SBI Mutual Fund Trustee Company Private Limited.

Contact Details
SBI Funds Management Private Limited
(A joint venture between SBI and AMUNDI)
Corporate Office:
9th Floor, Crescenzo, C-38 & 39, G Block,Bandra Kurla Complex,Bandra (East), Mumbai - 400 051Tel: +91 22 6179 3000Fax: +91 22 6742 5687/88/89/90/91
Website: www.sbimf.com
Call: 1800 425 5425
Visit us @ www.youtube.com/user/sbimutualfund
SMS: “SBIMF” to 56161
Email: [email protected]
Visit us @ www.facebook.com/SBIMF