Embed Size (px)
Citation preview

Market Outlook
January
2017
1

EQUITY
MARKETS
2
3
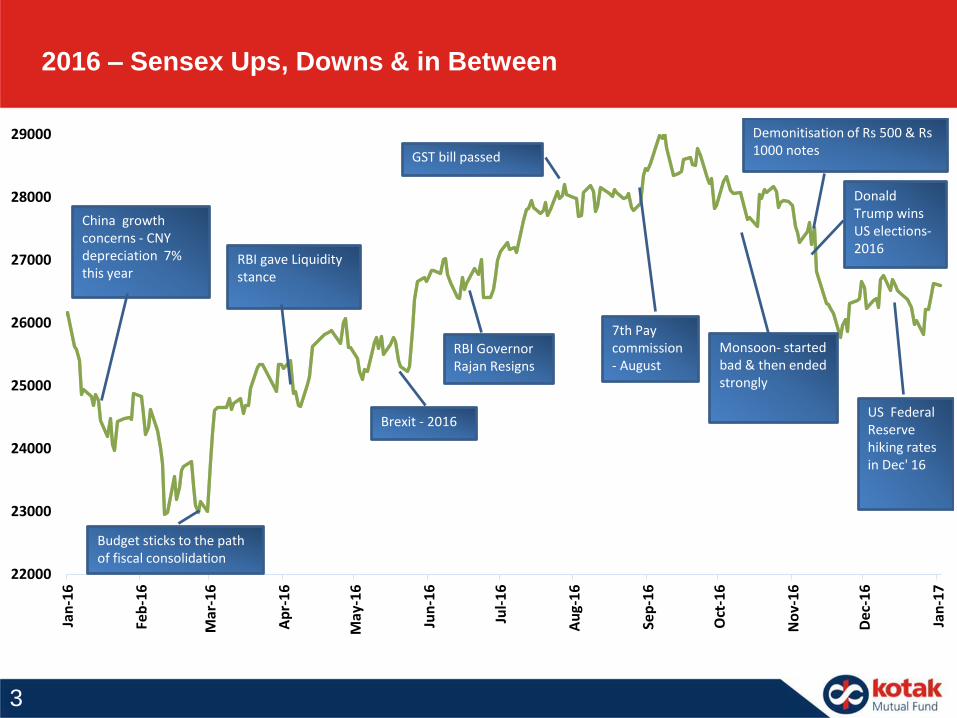
2016 – Sensex Ups, Downs & in Between
22000
23000
24000
25000
26000
27000
28000
29000
Jan
-16
Feb
-16
Mar
-16
Ap
r-1
6
May
-16
Jun
-16
Jul-
16
Au
g-1
6
Sep
-16
Oct
-16
No
v-1
6
Dec
-16
Jan
-17
RBI gave Liquidity stance
China growth concerns - CNY depreciation 7% this year
Budget sticks to the path of fiscal consolidation
GST bill passed
7th Pay commission - August
Monsoon- started bad & then ended strongly
Demonitisation of Rs 500 & Rs1000 notes
Donald Trump wins US elections-2016
US Federal Reserve hiking rates in Dec' 16
RBI Governor Rajan Resigns
Brexit - 2016
4
2016 In Review
Equities gave modest positive returns, yet below initial investor expectation
Midcaps outperform though the extent of outperformance has reduced compared to CY2015
Continued surge in financial savings from physical savings – domestic flows into equities maintained
Earnings came along with expectation – till demonetization impacted near term earnings expectations
5
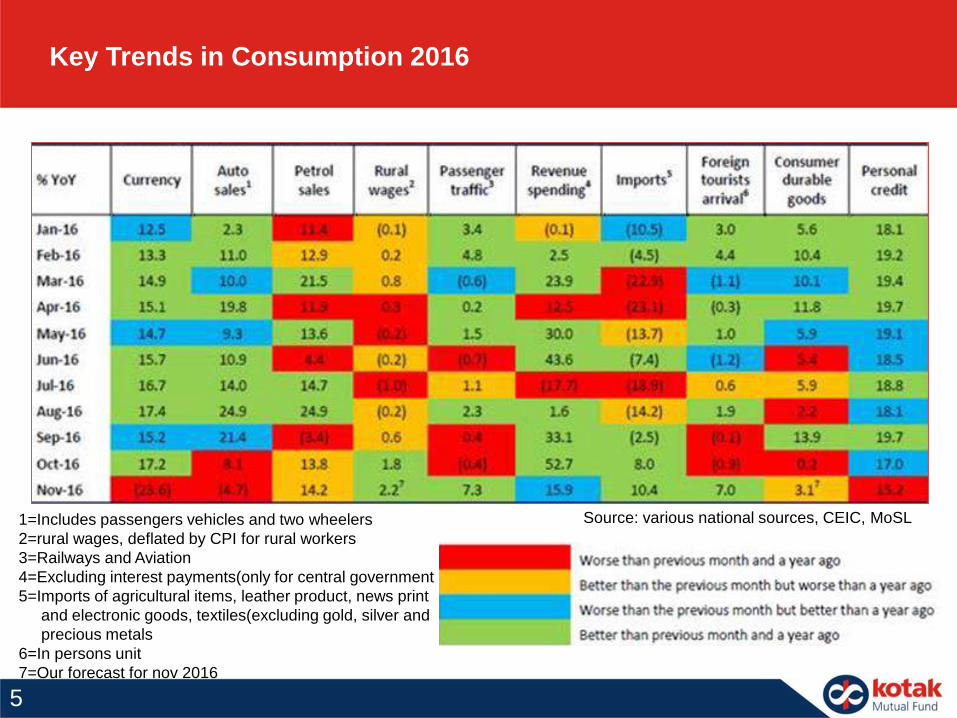
Key Trends in Consumption 2016
Source: various national sources, CEIC, MoSL1=Includes passengers vehicles and two wheelers
2=rural wages, deflated by CPI for rural workers
3=Railways and Aviation
4=Excluding interest payments(only for central government
5=Imports of agricultural items, leather product, news print
and electronic goods, textiles(excluding gold, silver and
precious metals
6=In persons unit
7=Our forecast for nov 2016
6
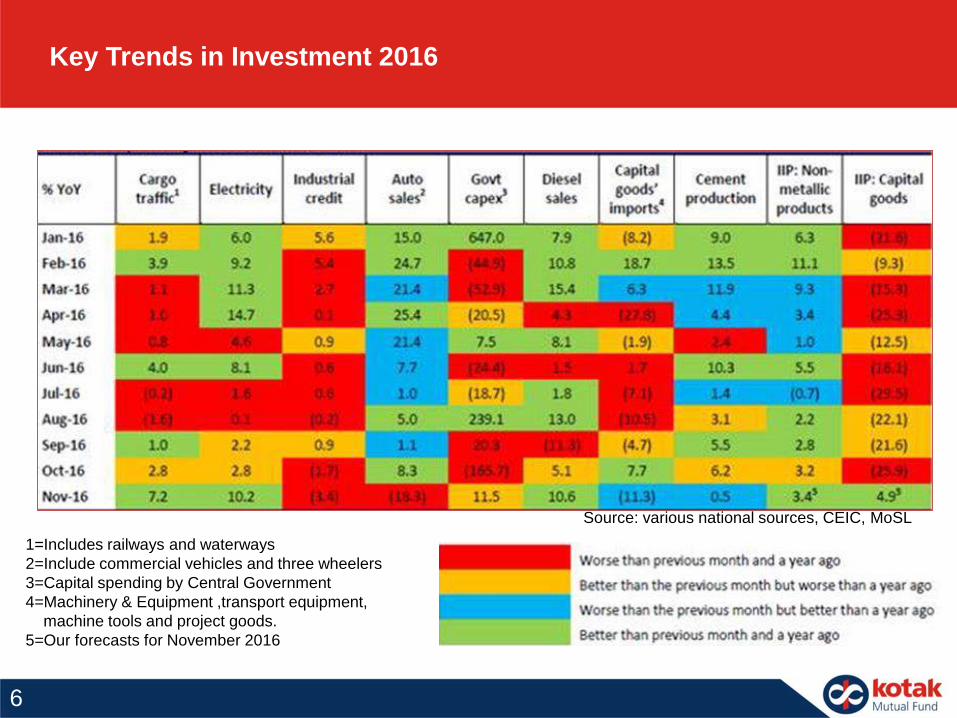
Key Trends in Investment 2016
1=Includes railways and waterways
2=Include commercial vehicles and three wheelers
3=Capital spending by Central Government
4=Machinery & Equipment ,transport equipment,
machine tools and project goods.
5=Our forecasts for November 2016
Source: various national sources, CEIC, MoSL
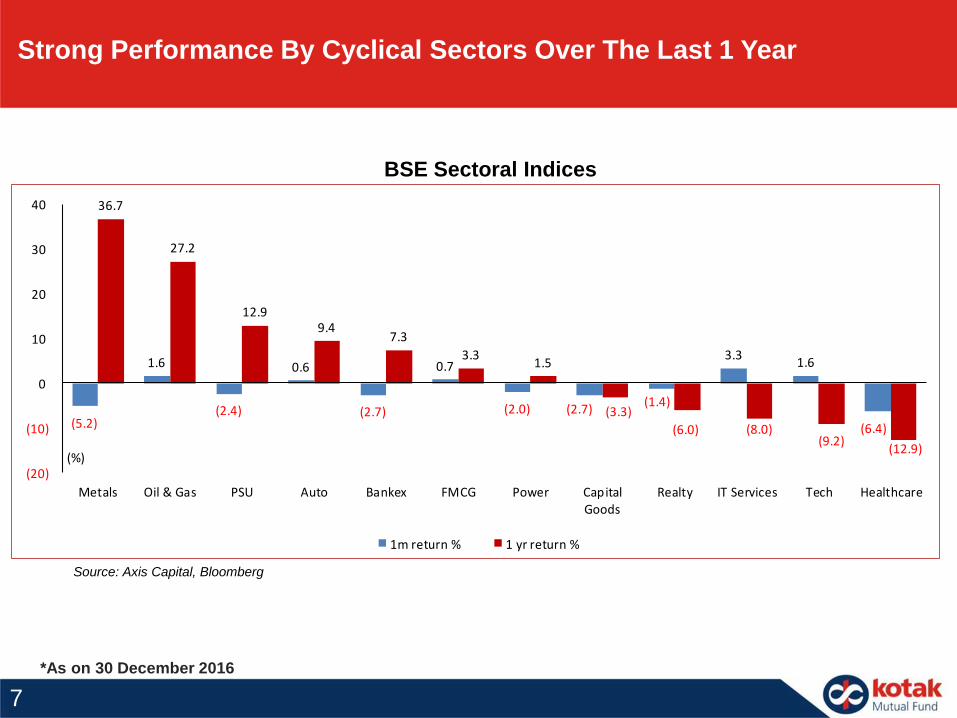
*As on 30 December 2016
Source: Axis Capital, Bloomberg
BSE Sectoral Indices
(5.2)
1.6
(2.4)
0.6
(2.7)
0.7
(2.0) (2.7)(1.4)
3.3 1.6
(6.4)
36.7
27.2
12.9 9.4
7.3
3.3 1.5
(3.3)
(6.0) (8.0)(9.2)
(12.9)
(20)
(10)
0
10
20
30
40
Metals Oil & Gas PSU Auto Bankex FMCG Power CapitalGoods
Realty IT Services Tech Healthcare
(%)
1m return % 1 yr return %
Strong Performance By Cyclical Sectors Over The Last 1 Year
7
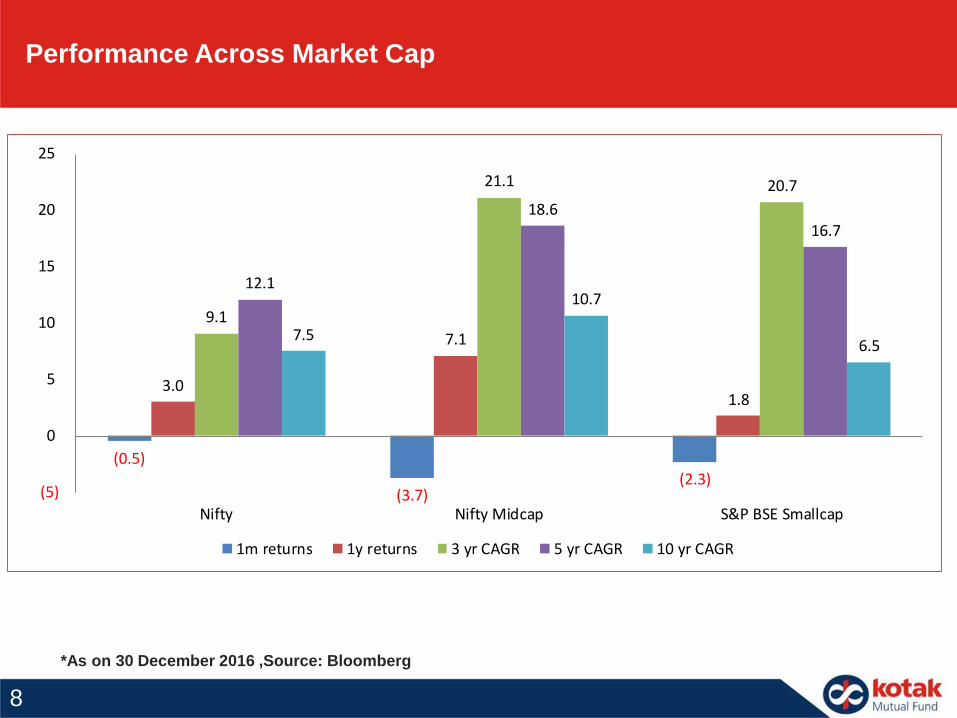
*As on 30 December 2016 ,Source: Bloomberg
Performance Across Market Cap
(0.5)
(3.7)(2.3)
3.0
7.1
1.8
9.1
21.1 20.7
12.1
18.6 16.7
7.5
10.7
6.5
(5)
0
5
10
15
20
25
Nifty Nifty Midcap S&P BSE Smallcap
1m returns 1y returns 3 yr CAGR 5 yr CAGR 10 yr CAGR
8
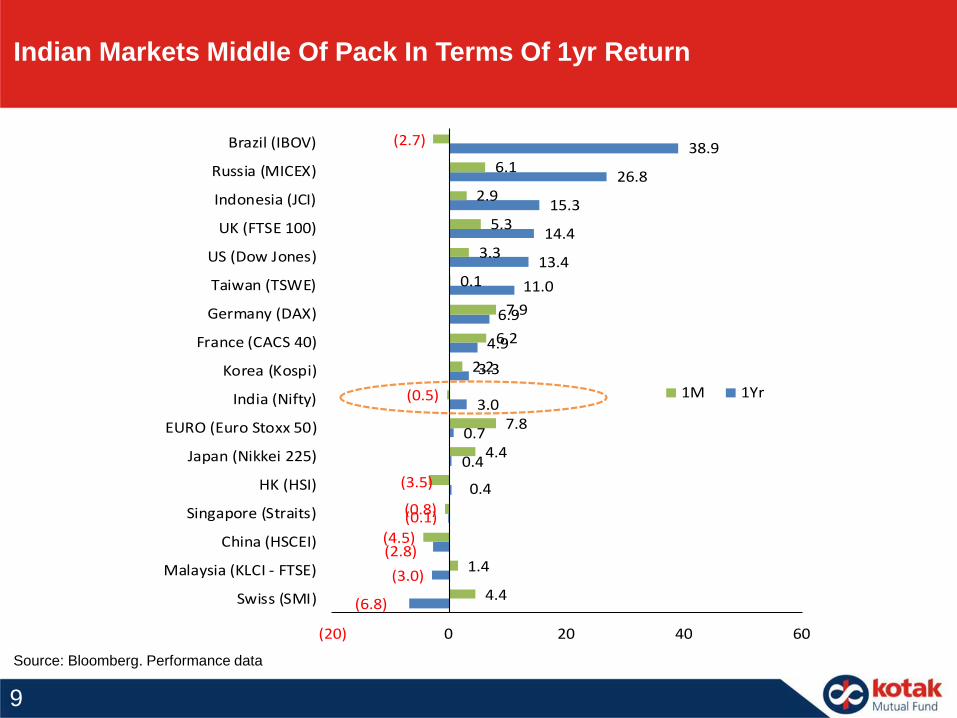
Indian Markets Middle Of Pack In Terms Of 1yr Return
Source: Bloomberg. Performance data
(6.8)
(3.0)
(2.8)
(0.1)
0.4
0.4
0.7
3.0
3.3
4.9
6.9
11.0
13.4
14.4
15.3
26.8
38.9
4.4
1.4
(4.5)
(0.8)
(3.5)
4.4
7.8
(0.5)
2.2
6.2
7.9
0.1
3.3
5.3
2.9
6.1
(2.7)
(20) 0 20 40 60
Swiss (SMI)
Malaysia (KLCI - FTSE)
China (HSCEI)
Singapore (Straits)
HK (HSI)
Japan (Nikkei 225)
EURO (Euro Stoxx 50)
India (Nifty)
Korea (Kospi)
France (CACS 40)
Germany (DAX)
Taiwan (TSWE)
US (Dow Jones)
UK (FTSE 100)
Indonesia (JCI)
Russia (MICEX)
Brazil (IBOV)
1M 1Yr
9
10
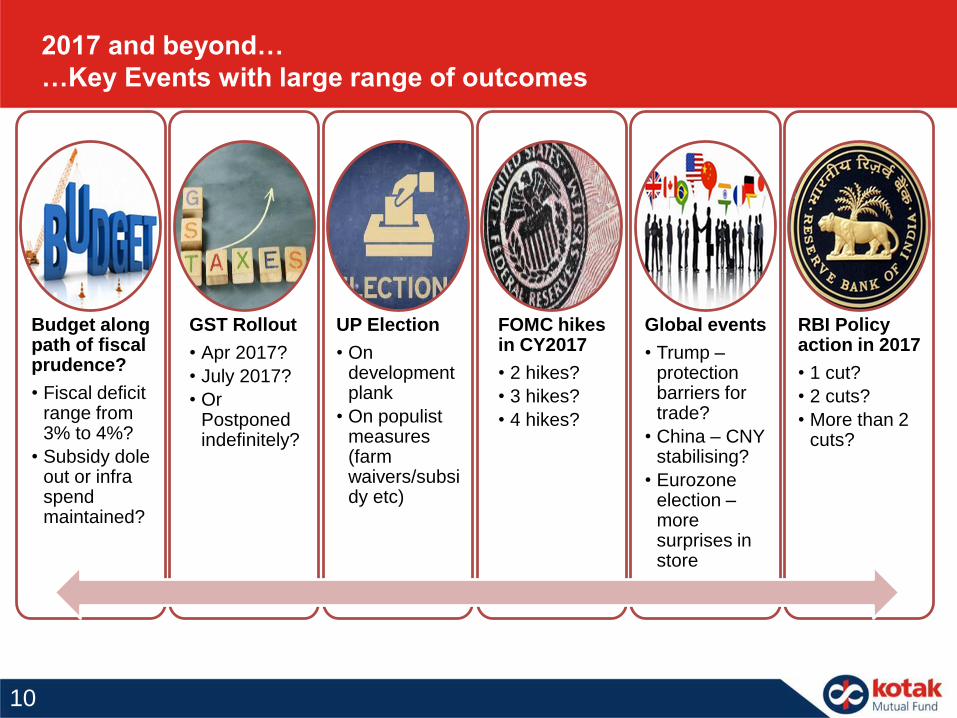
2017 and beyond…
…Key Events with large range of outcomes
Budget along path of fiscal prudence?
• Fiscal deficit range from 3% to 4%?
• Subsidy dole out or infra spend maintained?
GST Rollout
• Apr 2017?
• July 2017?
• Or Postponed indefinitely?
UP Election
• On development plank
• On populist measures (farm waivers/subsidy etc)
FOMC hikes in CY2017
• 2 hikes?
• 3 hikes?
• 4 hikes?
Global events
• Trump –protection barriers for trade?
• China – CNY stabilising?
• Eurozone election –more surprises in store
RBI Policy action in 2017
• 1 cut?
• 2 cuts?
• More than 2 cuts?
11
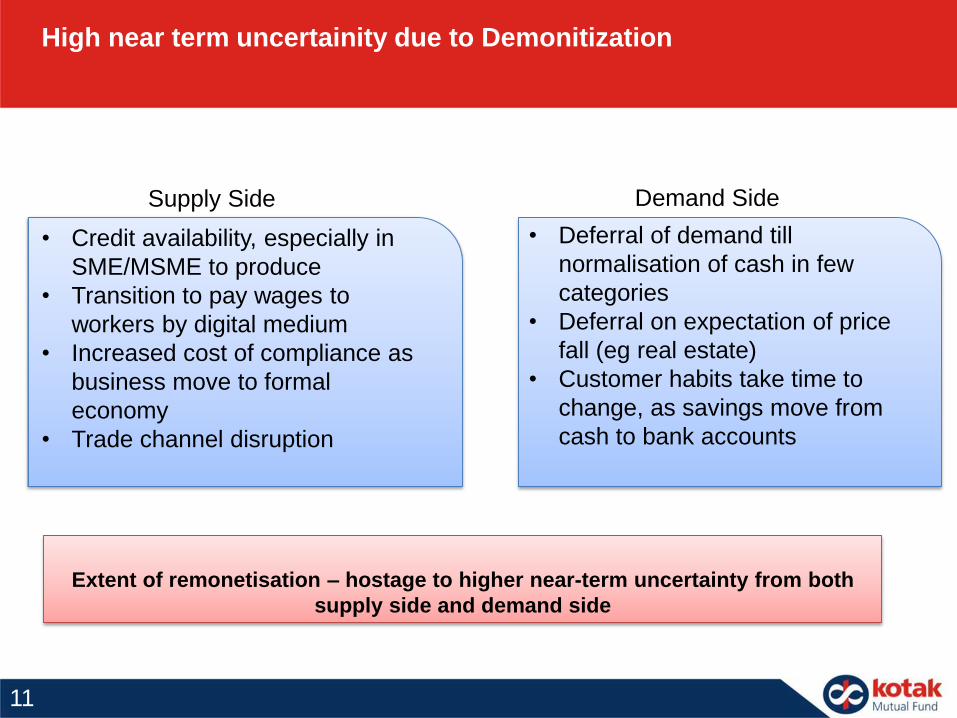
High near term uncertainity due to Demonitization
• Credit availability, especially in
SME/MSME to produce
• Transition to pay wages to
workers by digital medium
• Increased cost of compliance as
business move to formal
economy
• Trade channel disruption
• Deferral of demand till
normalisation of cash in few
categories
• Deferral on expectation of price
fall (eg real estate)
• Customer habits take time to
change, as savings move from
cash to bank accounts
Supply Side Demand Side
Extent of remonetisation – hostage to higher near-term uncertainty from both
supply side and demand side
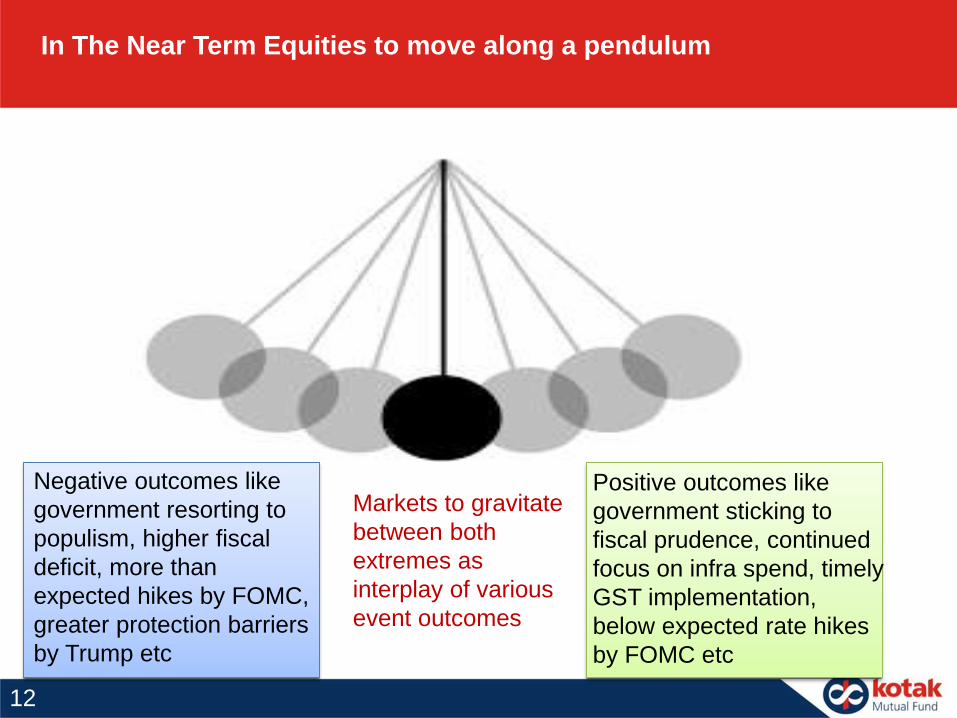
Negative outcomes like
government resorting to
populism, higher fiscal
deficit, more than
expected hikes by FOMC,
greater protection barriers
by Trump etc
12
In The Near Term Equities to move along a pendulum
Positive outcomes like
government sticking to
fiscal prudence, continued
focus on infra spend, timely
GST implementation,
below expected rate hikes
by FOMC etc
Markets to gravitate
between both
extremes as
interplay of various
event outcomes
13
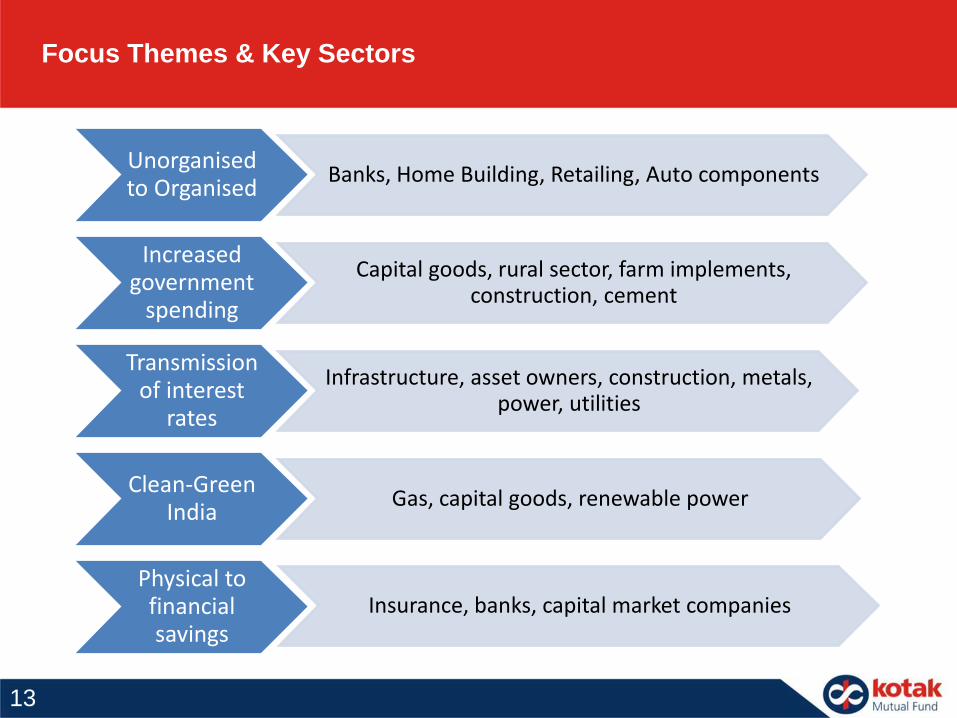
Focus Themes & Key Sectors
Unorganised to Organised
Banks, Home Building, Retailing, Auto components
Increased government
spending
Capital goods, rural sector, farm implements, construction, cement
Transmission of interest
rates
Infrastructure, asset owners, construction, metals, power, utilities
Clean-Green India
Gas, capital goods, renewable power
Physical to financial savings
Insurance, banks, capital market companies

Valuations
14

0
10
20
30
40
50
60
70
Auto BFSI Engg FMCG IT Metals Oil Pharma Power Telecom Sensex
0
10
20
30
40
50
60
Auto BFSI Engg FMCG IT Services Metals Oil & Gas Pharma Power Telecom Sensex
-1 SD +1 SD Current Max Min
Top Quartile
Current
Lower Quartile
Min
Max
Banking , IT , Metals and oil are at lower end of valuations, other sectors have seen some
moderation in valuation
Source: Axis Capital, Bloomberg Note: * Since April-2005
Sensex sectoral long-term valuation snapshot: Forward PE*
Stock Picking Will Be Critical
*As on 30 December 2016
15
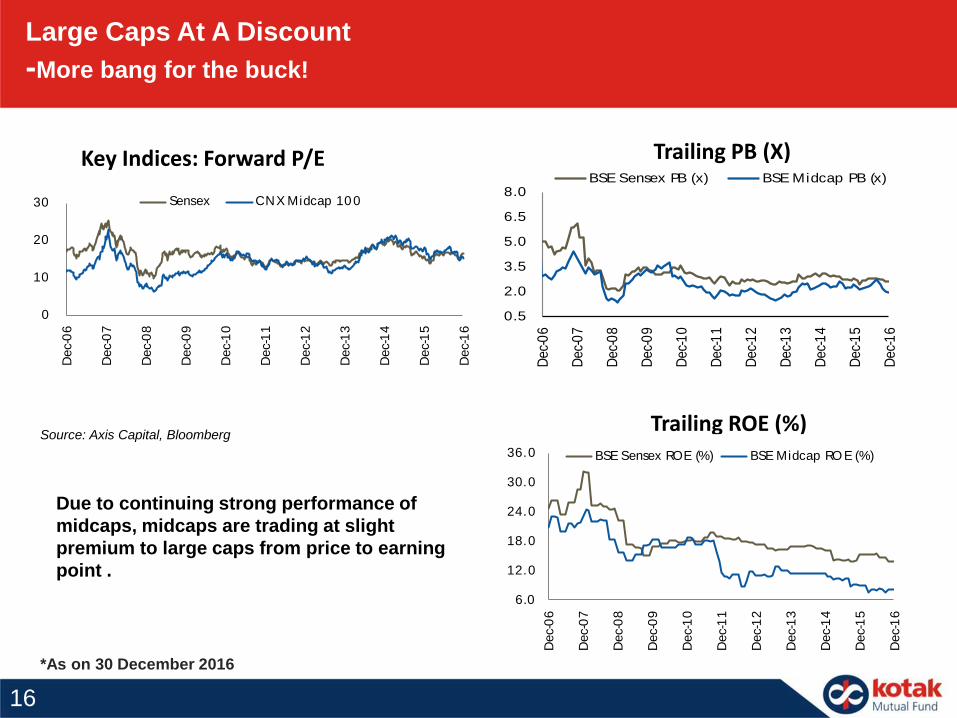
*As on 30 December 2016
Due to continuing strong performance of
midcaps, midcaps are trading at slight
premium to large caps from price to earning
point .
Source: Axis Capital, Bloomberg
Key Indices: Forward P/E
Large Caps At A Discount
-More bang for the buck!
Trailing ROE (%)
0.5
2.0
3.5
5.0
6.5
8.0
Dec
-06
Dec
-07
Dec
-08
Dec
-09
Dec
-10
Dec
-11
Dec
-12
Dec
-13
Dec
-14
Dec
-15
Dec
-16
BSE Sensex PB (x) BSE Midcap PB (x)
6.0
12.0
18.0
24.0
30.0
36.0
Dec-
06
Dec-
07
Dec-
08
Dec-
09
Dec-
10
Dec-
11
Dec-
12
Dec-
13
Dec-
14
Dec-
15
Dec-
16
BSE Sensex ROE (%) BSE Midcap RO E (%)
Trailing PB (X)
0
10
20
30
Dec-
06
Dec-
07
Dec-
08
Dec-
09
Dec-
10
Dec-
11
Dec-
12
Dec-
13
Dec-
14
Dec-
15
Dec-
16
Sensex CNX Midcap 100
16
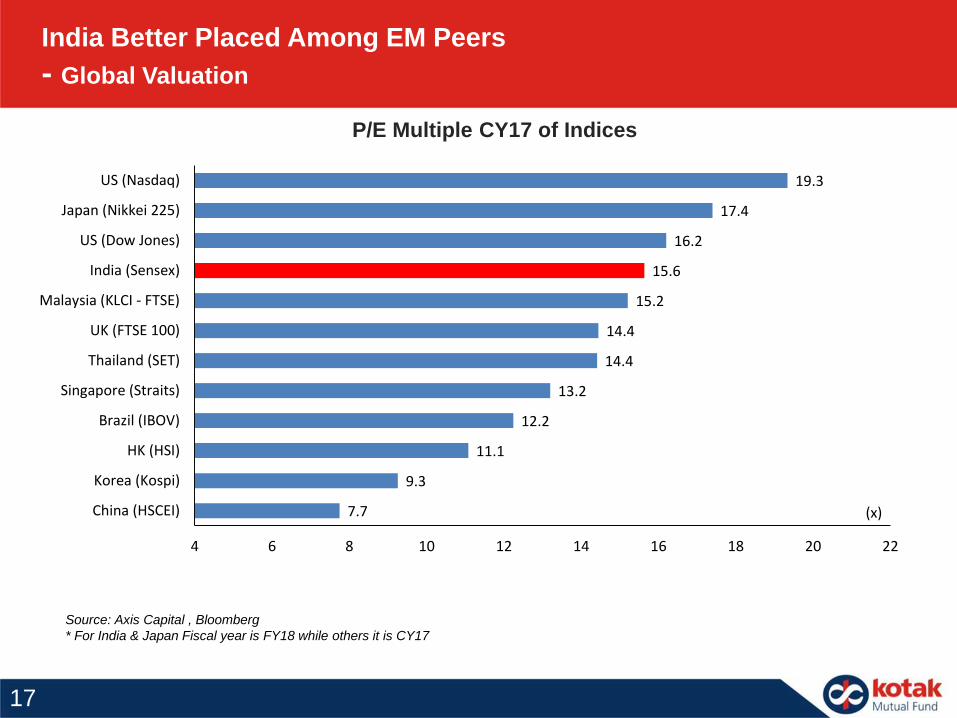
P/E Multiple CY17 of Indices
Source: Axis Capital , Bloomberg
* For India & Japan Fiscal year is FY18 while others it is CY17
India Better Placed Among EM Peers
- Global Valuation
17
7.7
9.3
11.1
12.2
13.2
14.4
14.4
15.2
15.6
16.2
17.4
19.3
4 6 8 10 12 14 16 18 20 22
China (HSCEI)
Korea (Kospi)
HK (HSI)
Brazil (IBOV)
Singapore (Straits)
Thailand (SET)
UK (FTSE 100)
Malaysia (KLCI - FTSE)
India (Sensex)
US (Dow Jones)
Japan (Nikkei 225)
US (Nasdaq)
(x)
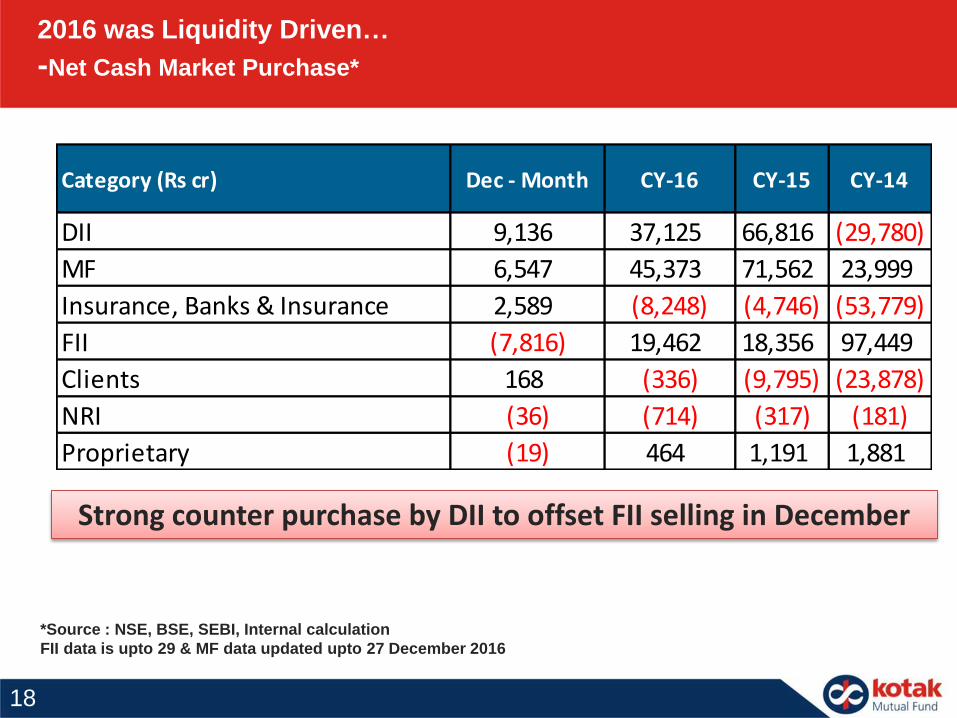
*Source : NSE, BSE, SEBI, Internal calculation
FII data is upto 29 & MF data updated upto 27 December 2016
Strong counter purchase by DII to offset FII selling in December
2016 was Liquidity Driven…
-Net Cash Market Purchase*
Category (Rs cr) Dec - Month CY-16 CY-15 CY-14
DII 9,136 37,125 66,816 (29,780)
MF 6,547 45,373 71,562 23,999
Insurance, Banks & Insurance 2,589 (8,248) (4,746) (53,779)
FII (7,816) 19,462 18,356 97,449
Clients 168 (336) (9,795) (23,878)
NRI (36) (714) (317) (181)
Proprietary (19) 464 1,191 1,881
18
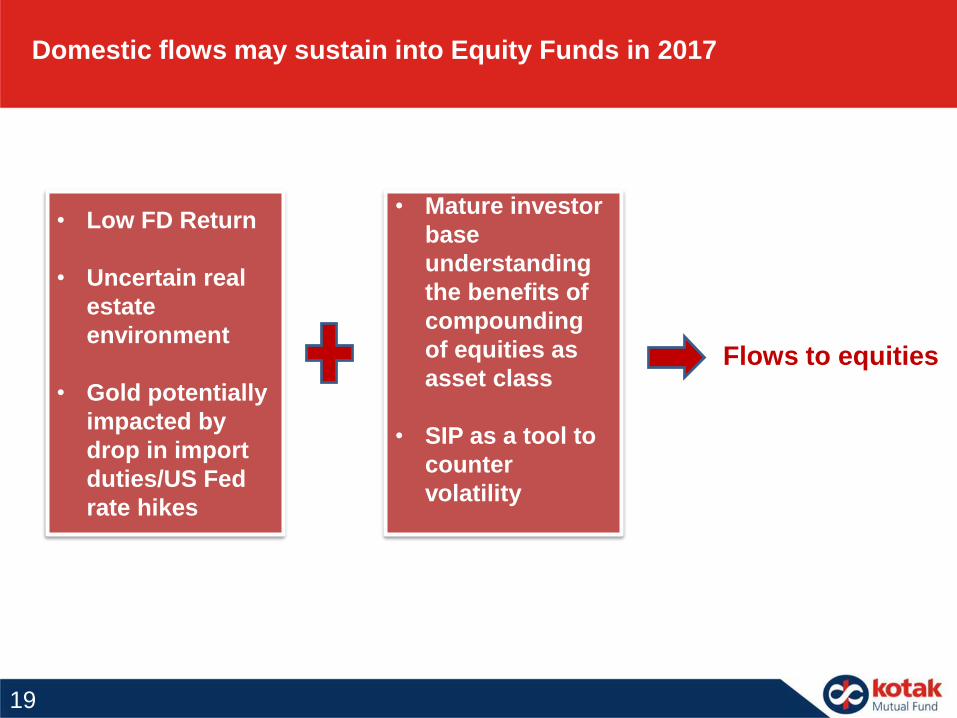
Flows to equities
Domestic flows may sustain into Equity Funds in 2017
• Low FD Return
• Uncertain real
estate
environment
• Gold potentially
impacted by
drop in import
duties/US Fed
rate hikes
19
• Mature investor
base
understanding
the benefits of
compounding
of equities as
asset class
• SIP as a tool to
counter
volatility
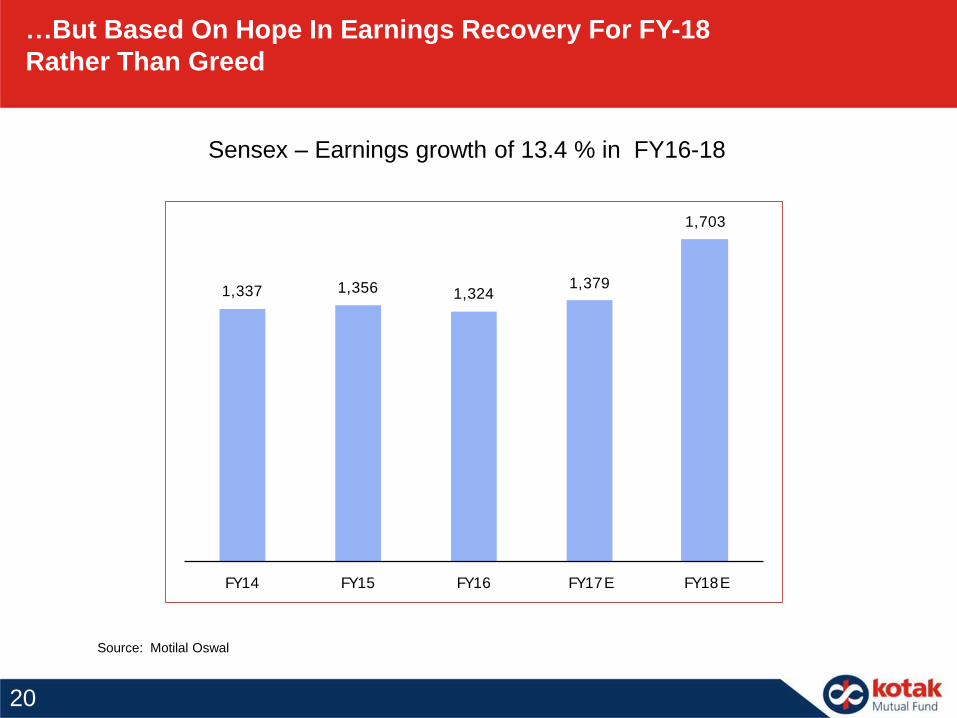
…But Based On Hope In Earnings Recovery For FY-18
Rather Than Greed
Sensex – Earnings growth of 13.4 % in FY16-18
Source: Motilal Oswal
1,337 1,356 1,3241,379
1,703
FY14 FY15 FY16 FY17E FY18E
20
21
4
6
8
10
12
14
16
18
Jan
-00
Jan
-01
Jan
-02
Jan
-03
Jan
-04
Jan
-05
Jan
-06
Jan
-07
Jan
-08
Jan
-09
Jan
-10
Jan
-11
Jan
-12
Jan
-13
Jan
-14
Jan
-15
Jan
-16
0
5000
10000
15000
20000
25000
30000
35000
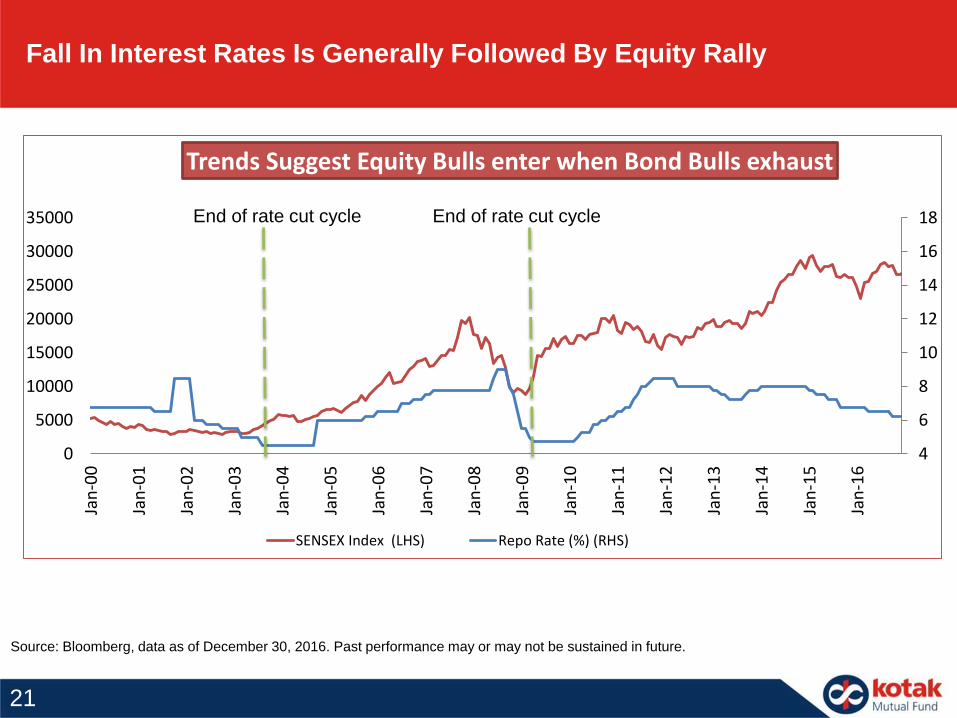
Trends Suggest Equity Bulls enter when Bond Bulls exhaust
SENSEX Index (LHS) Repo Rate (%) (RHS)
Fall In Interest Rates Is Generally Followed By Equity Rally
Source: Bloomberg, data as of December 30, 2016. Past performance may or may not be sustained in future.
End of rate cut cycle End of rate cut cycle
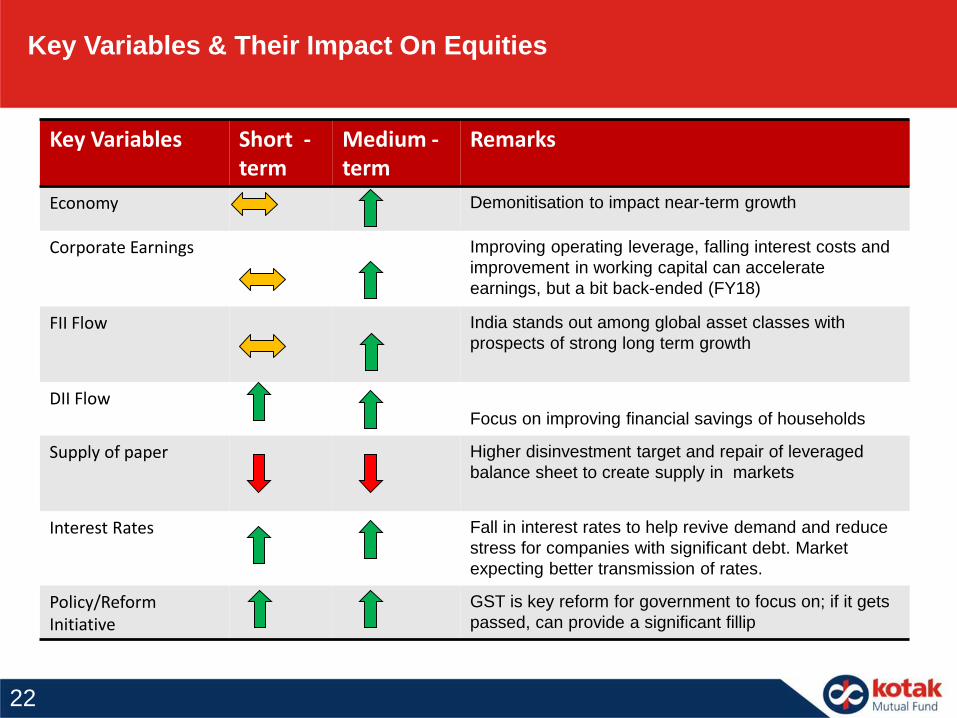
Key Variables & Their Impact On Equities
Key Variables Short -term
Medium -term
Remarks
Economy Demonitisation to impact near-term growth
Corporate Earnings Improving operating leverage, falling interest costs and
improvement in working capital can accelerate
earnings, but a bit back-ended (FY18)
FII Flow India stands out among global asset classes with
prospects of strong long term growth
DII FlowFocus on improving financial savings of households
Supply of paper Higher disinvestment target and repair of leveraged
balance sheet to create supply in markets
Interest Rates Fall in interest rates to help revive demand and reduce
stress for companies with significant debt. Market
expecting better transmission of rates.
Policy/Reform Initiative
GST is key reform for government to focus on; if it gets
passed, can provide a significant fillip
22

Asset Allocation
This asset allocation guide helps you to determine the suggested equity exposure at different
valuations levels based on the Sensex.
Valuation levels of the Sensex based on rolling 12month fwd EPS estimate of 1625
Suggested equity allocation (Assuming 50% equity allocation as neutral)
Market Cheap Attractive Fair Fair Value Plus Stretched Bubble
Over Invested Neutral + Neutral Neutral - Under Invested Exit
80% - 90% 65% - 75% 50% 35% - 45% 15%- 25% 5% - 10%Equity Allocaion
15000
18000
21000
24000
27000
30000
33000
Dec
-13
Jan-
14
Feb-
14
Mar
-14
Apr
-14
May
-14
Jun-
14
Jul-1
4
Aug
-14
Sep-
14
Oct
-14
Nov
-14
Dec
-14
Feb-
15
Mar
-15
Apr
-15
May
-15
Jun-
15
Jul-1
5
Aug
-15
Sep-
15
Oct
-15
Nov
-15
Dec
-15
Jan-
16
Feb-
16
Mar
-16
May
-16
Jun-
16
Jul-1
6
Aug
-16
Sep-
16
Oct
-16
Nov
-16
Dec
-16
Cheap 9x-10x
Attractive 10x-12x
Fair 12x-16x
Fair Value Plus 16-18x
Stretched 18x-20x
23

Strategy For Investment in 2017
• Assuming an agnostic perspective on risk, the following recommendations can be
prescribed:-
• Around half the money in SIP with 5 year horizon
• The rest of the corpus can be placed aside for event related volatility, such as:
• US fed raising interest rates
• India Quarterly Earnings
• UP Election Outcome
• European Banking Crisis
• China Slow down
• GST Roll Out
• In the absence of significant event risk, one can look at fresh issuance opportunities with
attractive valuations in
• IPO, OFS and FPO
• Any IPO in which NBFC are providing leveraged financing for applications might be
a good bet for retail application
24
25
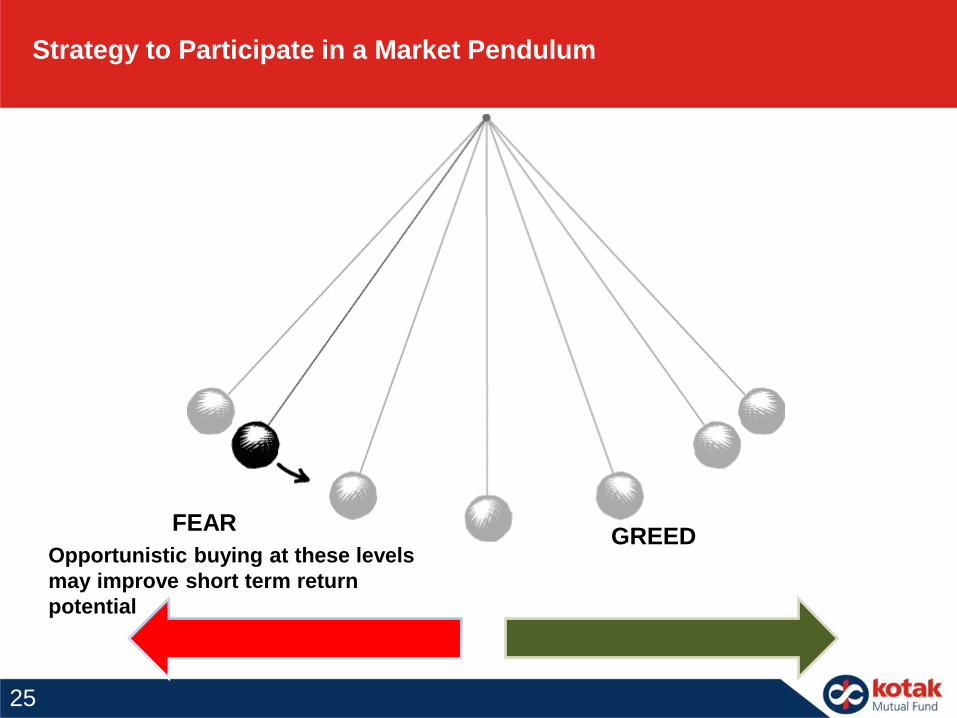
Strategy to Participate in a Market Pendulum
FEARGREED
Opportunistic buying at these levels
may improve short term return
potential
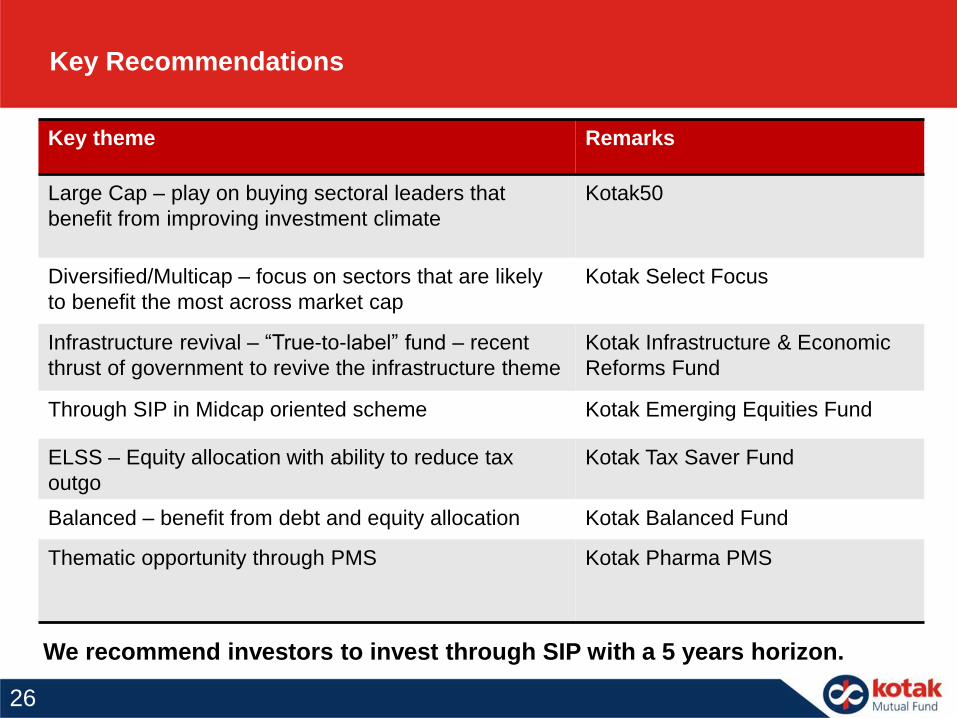
Key Recommendations
Key theme Remarks
Large Cap – play on buying sectoral leaders that
benefit from improving investment climate
Kotak50
Diversified/Multicap – focus on sectors that are likely
to benefit the most across market cap
Kotak Select Focus
Infrastructure revival – “True-to-label” fund – recent
thrust of government to revive the infrastructure theme
Kotak Infrastructure & Economic
Reforms Fund
Through SIP in Midcap oriented scheme Kotak Emerging Equities Fund
ELSS – Equity allocation with ability to reduce tax
outgo
Kotak Tax Saver Fund
Balanced – benefit from debt and equity allocation Kotak Balanced Fund
Thematic opportunity through PMS Kotak Pharma PMS
We recommend investors to invest through SIP with a 5 years horizon.
26

DEBT
MARKETS
27

Market Outlook
January
2017
28
6
6.2
6.4
6.6
6.8
7
7.2
7.4
7.6
7.8
8
Jan
-16
Feb
-16
Mar
-16
Ap
r-1
6
May
-16
Jun
-16
Jul-
16
Au
g-1
6
Sep
-16
Oct
-16
No
v-1
6
De
c-1
6
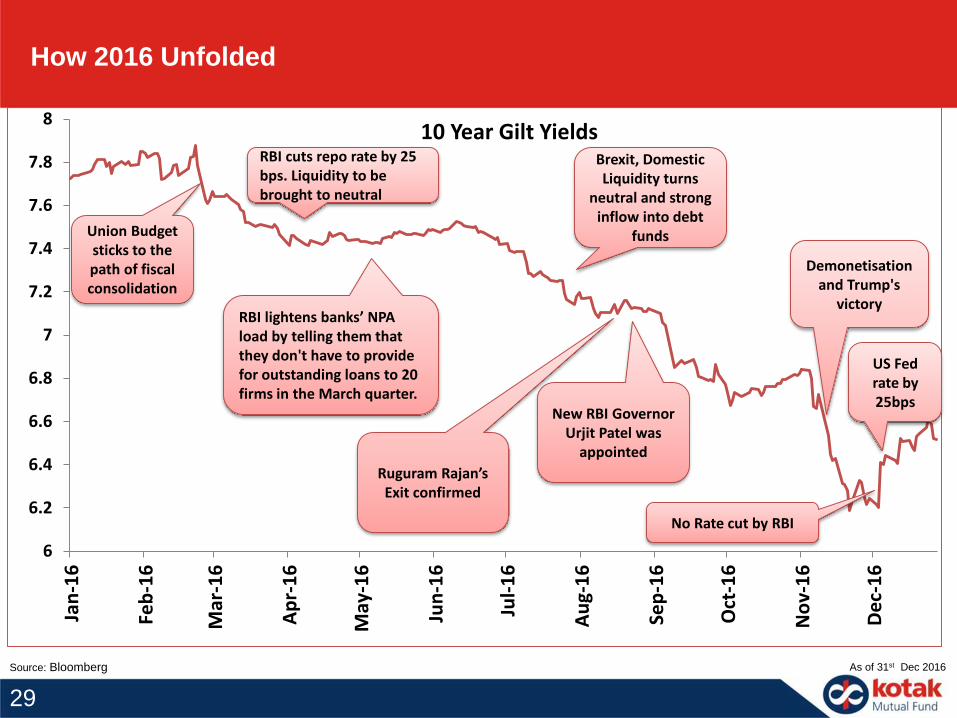
10 Year Gilt Yields
How 2016 Unfolded
Source: Bloomberg As of 31st Dec 2016
29
Union Budget sticks to the path of fiscal consolidation
Demonetisationand Trump's
victory
Brexit, Domestic Liquidity turns
neutral and strong inflow into debt
funds
US Fed rate by 25bps
New RBI Governor Urjit Patel was
appointed
RBI lightens banks’ NPA load by telling them that they don't have to provide for outstanding loans to 20 firms in the March quarter.
RBI cuts repo rate by 25 bps. Liquidity to be brought to neutral
Ruguram Rajan’sExit confirmed
No Rate cut by RBI
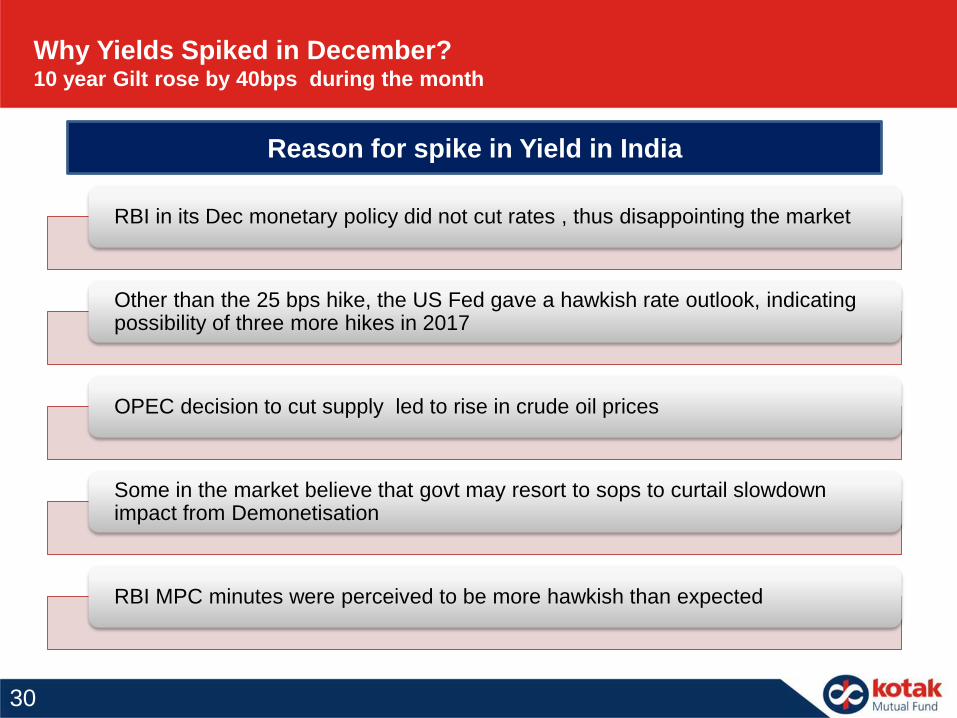
Why Yields Spiked in December?10 year Gilt rose by 40bps during the month
Reason for spike in Yield in India
30
RBI in its Dec monetary policy did not cut rates , thus disappointing the market
Other than the 25 bps hike, the US Fed gave a hawkish rate outlook, indicating possibility of three more hikes in 2017
OPEC decision to cut supply led to rise in crude oil prices
Some in the market believe that govt may resort to sops to curtail slowdown impact from Demonetisation
RBI MPC minutes were perceived to be more hawkish than expected
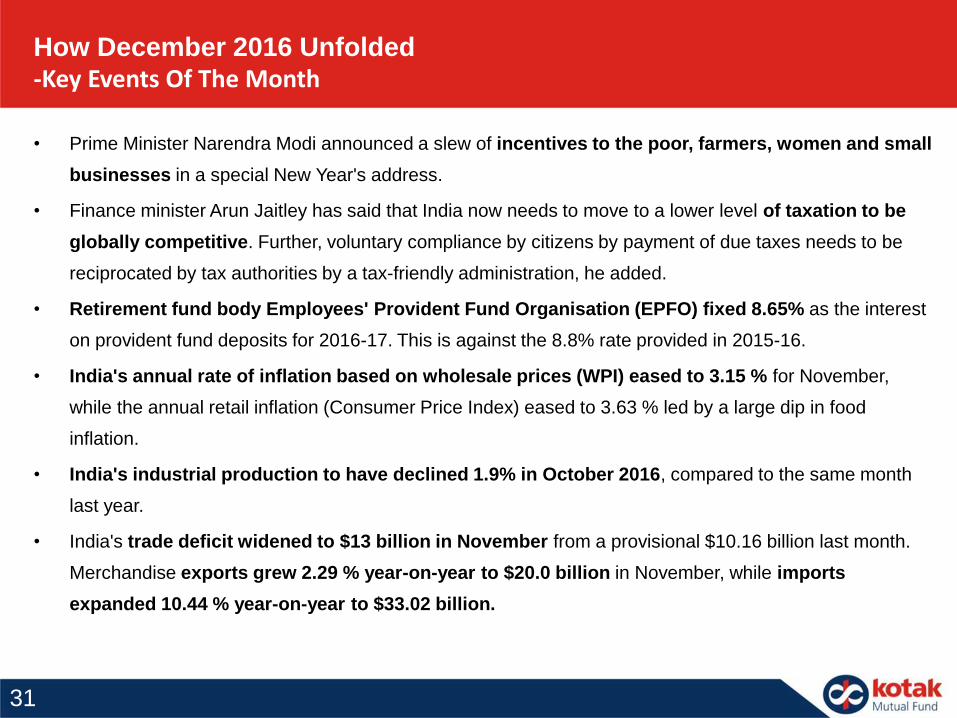
How December 2016 Unfolded-Key Events Of The Month
• Prime Minister Narendra Modi announced a slew of incentives to the poor, farmers, women and small
businesses in a special New Year's address.
• Finance minister Arun Jaitley has said that India now needs to move to a lower level of taxation to be
globally competitive. Further, voluntary compliance by citizens by payment of due taxes needs to be
reciprocated by tax authorities by a tax-friendly administration, he added.
• Retirement fund body Employees' Provident Fund Organisation (EPFO) fixed 8.65% as the interest
on provident fund deposits for 2016-17. This is against the 8.8% rate provided in 2015-16.
• India's annual rate of inflation based on wholesale prices (WPI) eased to 3.15 % for November,
while the annual retail inflation (Consumer Price Index) eased to 3.63 % led by a large dip in food
inflation.
• India's industrial production to have declined 1.9% in October 2016, compared to the same month
last year.
• India's trade deficit widened to $13 billion in November from a provisional $10.16 billion last month.
Merchandise exports grew 2.29 % year-on-year to $20.0 billion in November, while imports
expanded 10.44 % year-on-year to $33.02 billion.
31

How December 2016 Unfolded-Key Events Of The Month
• Defying expectations, the Monetary Policy Committee kept short-term lending rate unchanged and
also lowered GDP growth rate to 7.1 % in the midst of short-term disruption in economic activities due
to demonetisation
• The US Federal Reserve raised interest rates by 25 basis points to 0.5%-0.75% , making it the
second hike in a decade. The Fed also hinted at three more rate hikes over the next year, reportedly
indicating a stable economic situation
• Globally, the Bank of Japan maintained the 0.1% interest it charges on a portion of excess reserves
that financial institutions park with the central bank. The Japanese cabinet approved a $830 billion
spending for the current financial year
• The European Central Bank announced that it will continue asset purchases after the previous end-
date of March 2017, but at €60 billion a month instead of the current €80 billion.
• OPEC has persuaded 11 non-members to cut oil production. Officials said that non-members agreed to
cut 558,000 barrels per day for six months starting Jan. 1, and that the deal was renewable for another
six months after that.
32
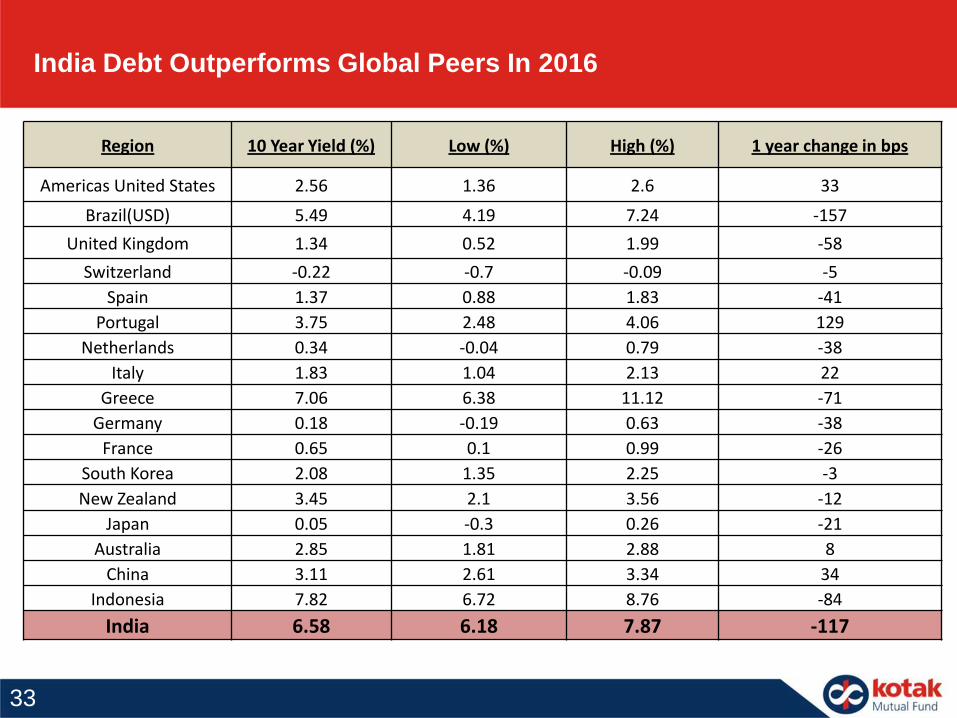
India Debt Outperforms Global Peers In 2016
33
Region 10 Year Yield (%) Low (%) High (%) 1 year change in bps
Americas United States 2.56 1.36 2.6 33
Brazil(USD) 5.49 4.19 7.24 -157
United Kingdom 1.34 0.52 1.99 -58
Switzerland -0.22 -0.7 -0.09 -5
Spain 1.37 0.88 1.83 -41
Portugal 3.75 2.48 4.06 129
Netherlands 0.34 -0.04 0.79 -38
Italy 1.83 1.04 2.13 22
Greece 7.06 6.38 11.12 -71
Germany 0.18 -0.19 0.63 -38
France 0.65 0.1 0.99 -26
South Korea 2.08 1.35 2.25 -3
New Zealand 3.45 2.1 3.56 -12
Japan 0.05 -0.3 0.26 -21
Australia 2.85 1.81 2.88 8
China 3.11 2.61 3.34 34
Indonesia 7.82 6.72 8.76 -84
India 6.58 6.18 7.87 -117
34
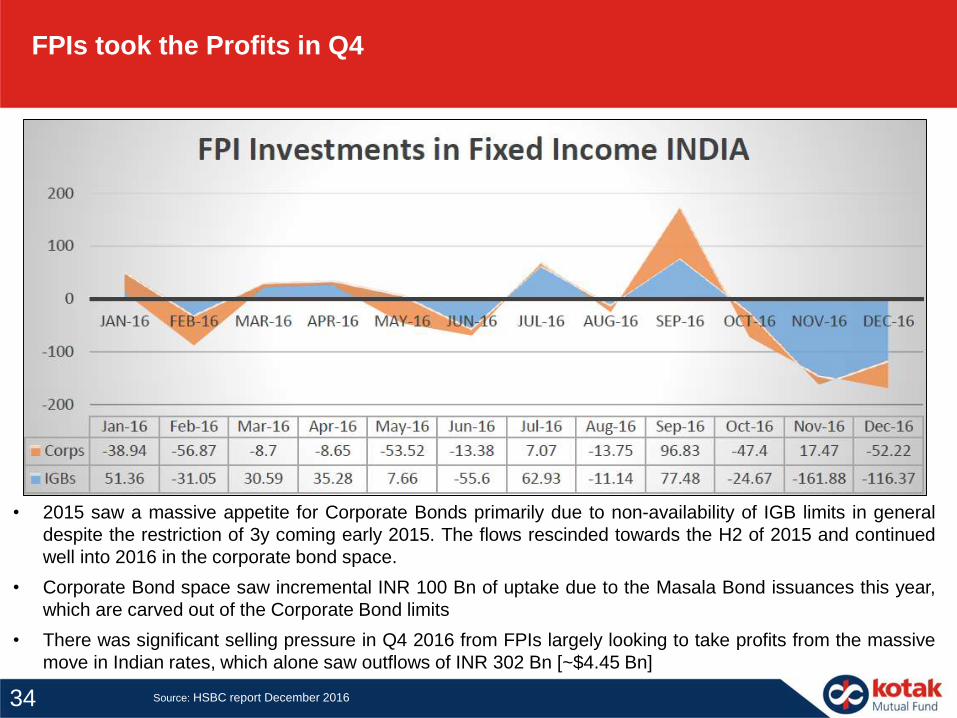
• 2015 saw a massive appetite for Corporate Bonds primarily due to non-availability of IGB limits in general
despite the restriction of 3y coming early 2015. The flows rescinded towards the H2 of 2015 and continued
well into 2016 in the corporate bond space.
• Corporate Bond space saw incremental INR 100 Bn of uptake due to the Masala Bond issuances this year,
which are carved out of the Corporate Bond limits
• There was significant selling pressure in Q4 2016 from FPIs largely looking to take profits from the massive
move in Indian rates, which alone saw outflows of INR 302 Bn [~$4.45 Bn]
FPIs took the Profits in Q4
Source: HSBC report December 2016
35
Understanding FII Strategy on Indian Debt
• India is not part of the JP Morgan Emerging Market Bond Index
• Yet, FII allocation in Indian Gilt and Bonds has been around US$ 40 bn
• Bond rally in India in 2016 provided significant gains through combination of high
Carry, MTM gains and a stable currency vis-à-vis other emerging market where their
currencies declined against dollar
• This effectively implies that ‘out of Index’ allocation to India generated a high Alpha
for the FIIs.
• FIIs therefore booked profits at these levels since their conviction call on India has
paid off effectively now
• Thus, FII selling does not reflect their long term view on India as an investment
destination

Gilt Yields in Policy Perspective
5.283
4
5
6
7
8
9
10
11
12
13
No
v-9
8
Feb
-99
May
-99
Au
g-9
9
No
v-9
9
Feb
-00
May
-00
Au
g-0
0
No
v-0
0
Feb
-01
May
-01
Au
g-0
1
No
v-0
1
Feb
-02
May
-02
Au
g-0
2
No
v-0
2
Feb
-03
May
-03
Au
g-0
3
No
v-0
3
Feb
-04
May
-04
NDA 1( 1998 to 2004)
“Remember Prime Minister Vajpayee did 5.6-6% loans and how it gave a boost
every middle class, low-income person had the desire to own a house of his own” :
Piyush Goyal, Minister, GOI.
36
6.515
6
6.5
7
7.5
8
8.5
9
May
-14
Jul-
14
Sep
-14
No
v-1
4
Jan
-15
Mar
-15
May
-15
Jul-
15
Sep
-15
No
v-1
5
Jan
-16
Mar
-16
May
-16
Jul-
16
Sep
-16
No
v-1
6
NDA 2 (2014 to date)
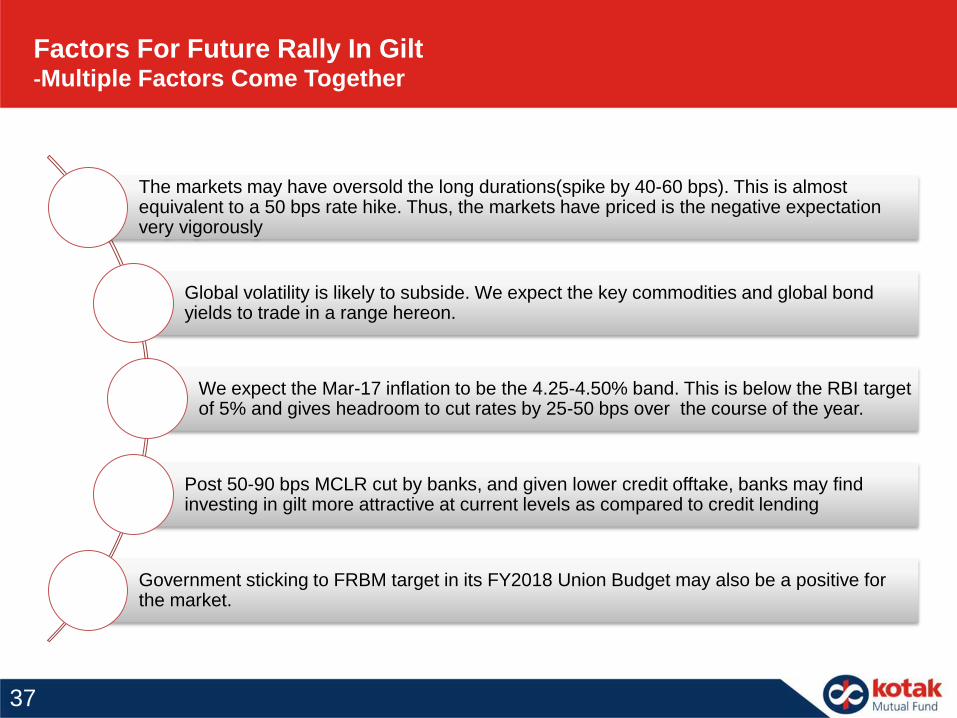
The markets may have oversold the long durations(spike by 40-60 bps). This is almost equivalent to a 50 bps rate hike. Thus, the markets have priced is the negative expectation very vigorously
Global volatility is likely to subside. We expect the key commodities and global bond yields to trade in a range hereon.
We expect the Mar-17 inflation to be the 4.25-4.50% band. This is below the RBI target of 5% and gives headroom to cut rates by 25-50 bps over the course of the year.
Post 50-90 bps MCLR cut by banks, and given lower credit offtake, banks may find investing in gilt more attractive at current levels as compared to credit lending
Government sticking to FRBM target in its FY2018 Union Budget may also be a positive for the market.
37
Factors For Future Rally In Gilt-Multiple Factors Come Together
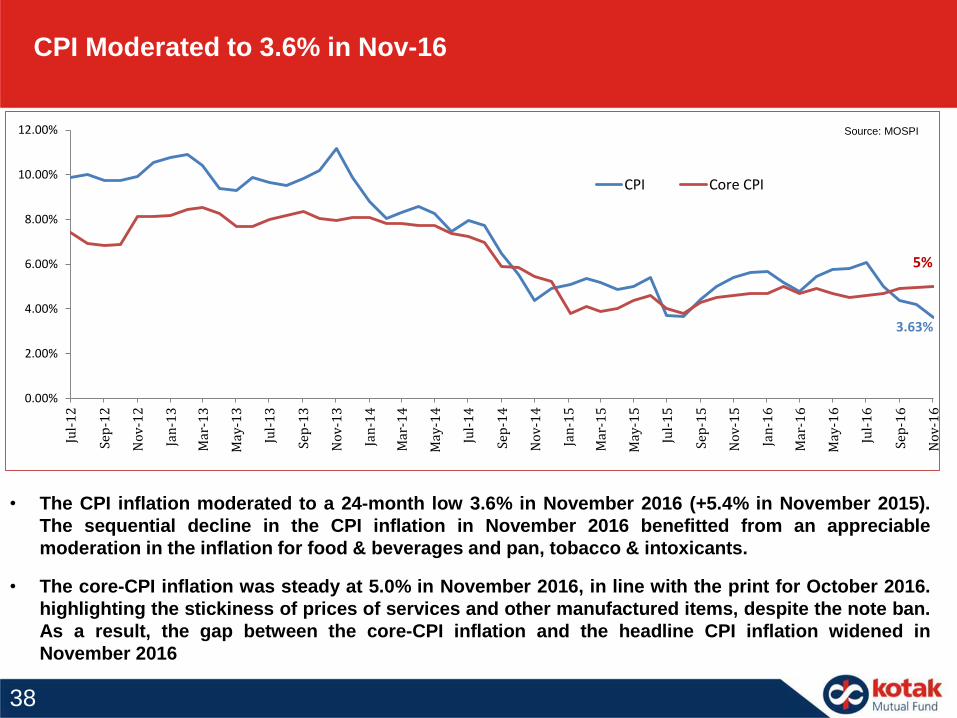
CPI Moderated to 3.6% in Nov-16
Source: MOSPI
• The CPI inflation moderated to a 24-month low 3.6% in November 2016 (+5.4% in November 2015).
The sequential decline in the CPI inflation in November 2016 benefitted from an appreciable
moderation in the inflation for food & beverages and pan, tobacco & intoxicants.
• The core-CPI inflation was steady at 5.0% in November 2016, in line with the print for October 2016.
highlighting the stickiness of prices of services and other manufactured items, despite the note ban.
As a result, the gap between the core-CPI inflation and the headline CPI inflation widened in
November 2016
38
3.63%
5%
0.00%
2.00%
4.00%
6.00%
8.00%
10.00%
12.00%
Jul-12
Sep-12
Nov-12
Jan-13
Mar-13
May-13
Jul-13
Sep-13
Nov-13
Jan-14
Mar-14
May-14
Jul-14
Sep-14
Nov-14
Jan-15
Mar-15
May-15
Jul-15
Sep-15
Nov-15
Jan-16
Mar-16
May-16
Jul-16
Sep-16
Nov-16
CPI Core CPI

Crude Prices Remain Range Bound
-Brent Crude Oil Prices (USD)
Source:Bloombergas on 31st Dec 2016
• Crude Oil prices increased to $56.82/barrel (12.58% MoM) during the month.
• Prices soared on the implementation of OPEC’s output cut scheme on Jan month
• Post spike, we believe the prices should trade in the narrow band since the demand levels remain largely
unchanged
• At current levels, this may not have a meaningful impact on the Fiscal.
39
56.82
25
30
35
40
45
50
55
60
Jan-16 Feb-16 Mar-16 Apr-16 May-16 Jun-16 Jul-16 Aug-16 Sep-16 Oct-16 Nov-16 Dec-16
Brent Crude(USD)
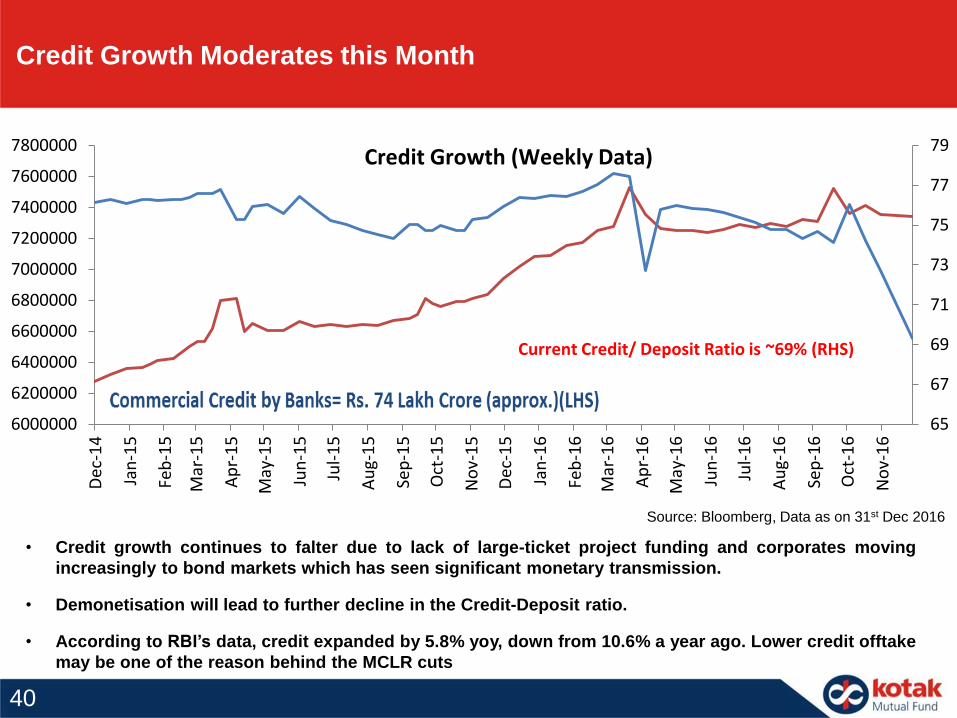
• Credit growth continues to falter due to lack of large-ticket project funding and corporates moving
increasingly to bond markets which has seen significant monetary transmission.
• Demonetisation will lead to further decline in the Credit-Deposit ratio.
• According to RBI’s data, credit expanded by 5.8% yoy, down from 10.6% a year ago. Lower credit offtake
may be one of the reason behind the MCLR cuts
Credit Growth Moderates this Month
Source: Bloomberg, Data as on 31st Dec 2016
40
65
67
69
71
73
75
77
79
6000000
6200000
6400000
6600000
6800000
7000000
7200000
7400000
7600000
7800000
Dec
-14
Jan
-15
Feb
-15
Mar
-15
Ap
r-1
5
May
-15
Jun
-15
Jul-
15
Au
g-1
5
Sep
-15
Oct
-15
No
v-1
5
Dec
-15
Jan
-16
Feb
-16
Mar
-16
Ap
r-1
6
May
-16
Jun
-16
Jul-
16
Au
g-1
6
Sep
-16
Oct
-16
No
v-1
6
Credit Growth (Weekly Data)
Current Credit/ Deposit Ratio is ~69% (RHS)
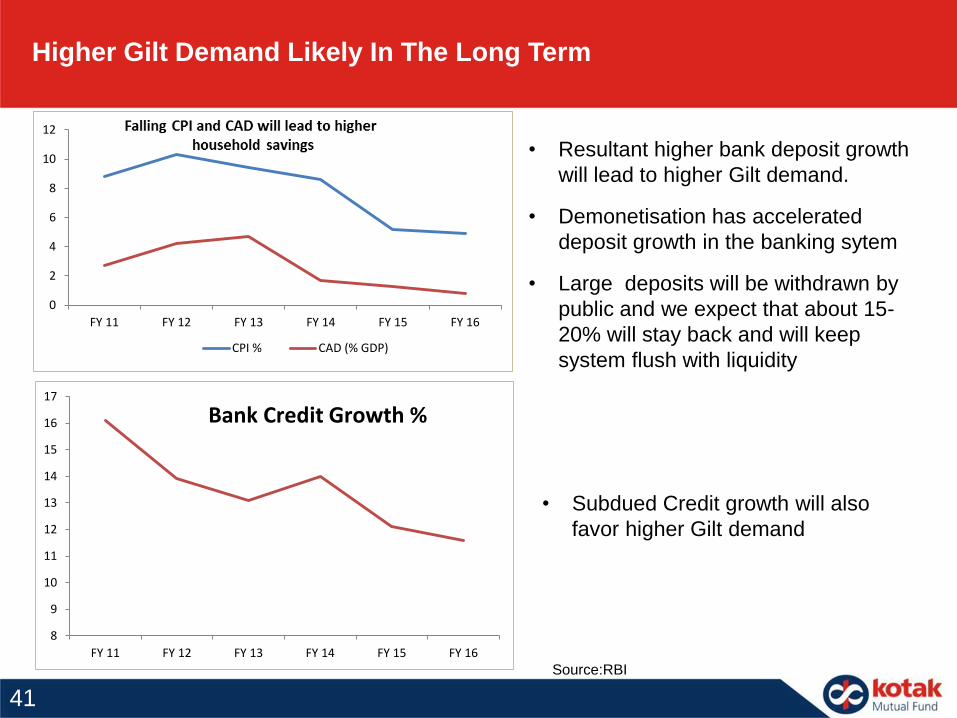
• Resultant higher bank deposit growth
will lead to higher Gilt demand.
• Demonetisation has accelerated
deposit growth in the banking sytem
• Large deposits will be withdrawn by
public and we expect that about 15-
20% will stay back and will keep
system flush with liquidity
Higher Gilt Demand Likely In The Long Term
• Subdued Credit growth will also
favor higher Gilt demand
Source:RBI
8
9
10
11
12
13
14
15
16
17
FY 11 FY 12 FY 13 FY 14 FY 15 FY 16
Bank Credit Growth %
0
2
4
6
8
10
12
FY 11 FY 12 FY 13 FY 14 FY 15 FY 16
CPI % CAD (% GDP)
41
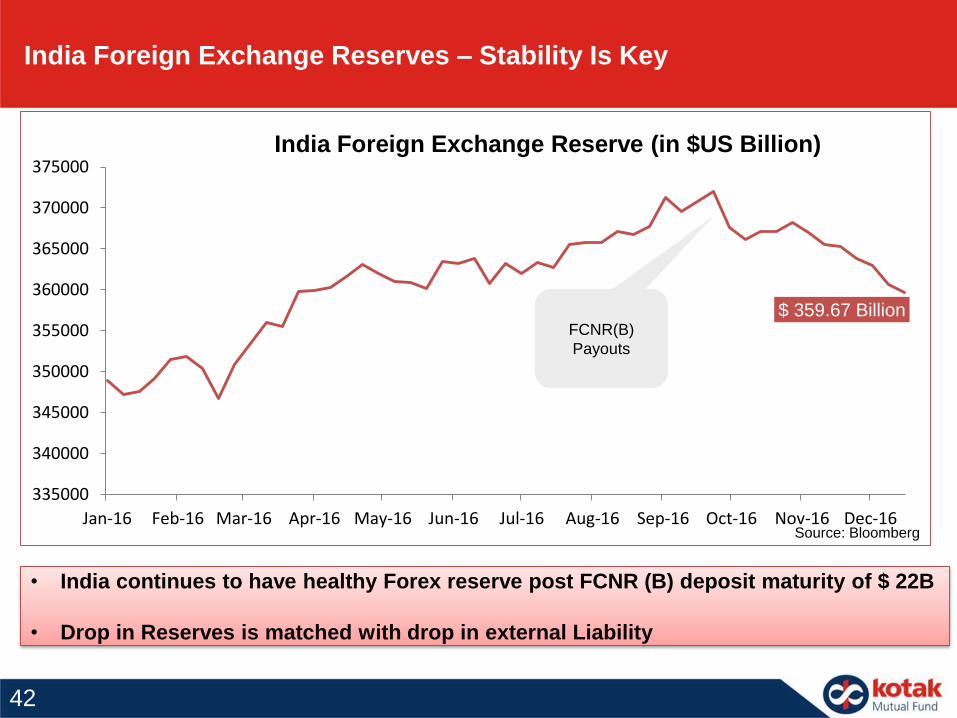
India Foreign Exchange Reserves – Stability Is Key
• India continues to have healthy Forex reserve post FCNR (B) deposit maturity of $ 22B
• Drop in Reserves is matched with drop in external Liability
Source: Bloomberg
42
$ 359.67 Billion
335000
340000
345000
350000
355000
360000
365000
370000
375000
Jan-16 Feb-16 Mar-16 Apr-16 May-16 Jun-16 Jul-16 Aug-16 Sep-16 Oct-16 Nov-16 Dec-16
India Foreign Exchange Reserve (in $US Billion)
FCNR(B)
Payouts
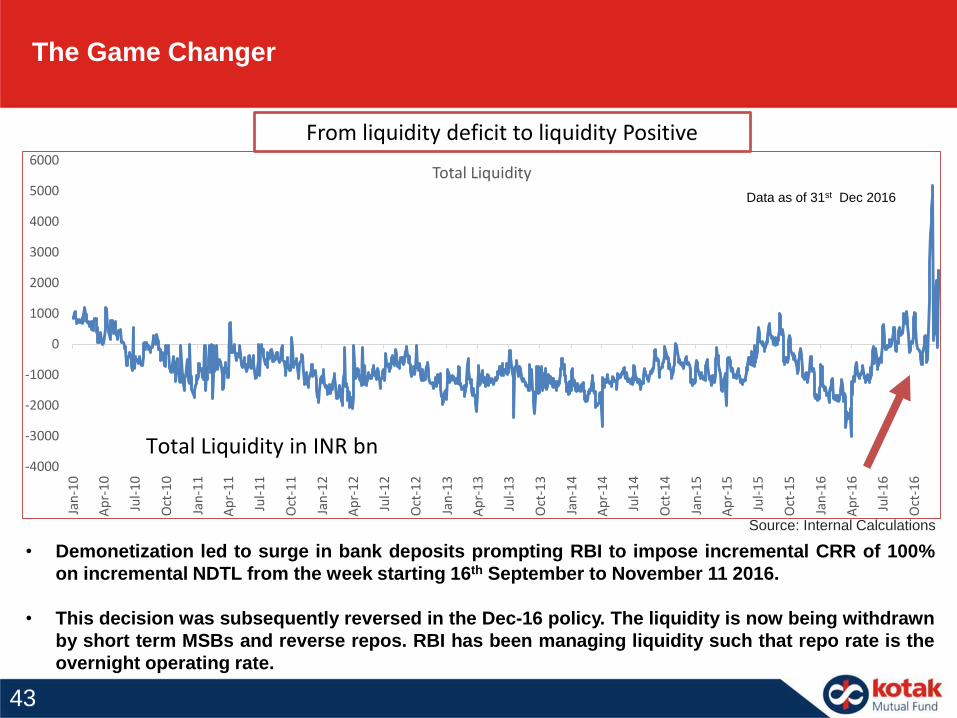
• Demonetization led to surge in bank deposits prompting RBI to impose incremental CRR of 100%
on incremental NDTL from the week starting 16th September to November 11 2016.
• This decision was subsequently reversed in the Dec-16 policy. The liquidity is now being withdrawn
by short term MSBs and reverse repos. RBI has been managing liquidity such that repo rate is the
overnight operating rate.
-4000
-3000
-2000
-1000
0
1000
2000
3000
4000
5000
6000
Jan
-10
Ap
r-1
0
Jul-
10
Oct
-10
Jan
-11
Ap
r-1
1
Jul-
11
Oct
-11
Jan
-12
Ap
r-1
2
Jul-
12
Oct
-12
Jan
-13
Ap
r-1
3
Jul-
13
Oct
-13
Jan
-14
Ap
r-1
4
Jul-
14
Oct
-14
Jan
-15
Ap
r-1
5
Jul-
15
Oct
-15
Jan
-16
Ap
r-1
6
Jul-
16
Oct
-16
Total Liquidity
Total Liquidity in INR bn
The Game Changer
From liquidity deficit to liquidity Positive
Source: Internal Calculations
Data as of 31st Dec 2016
43
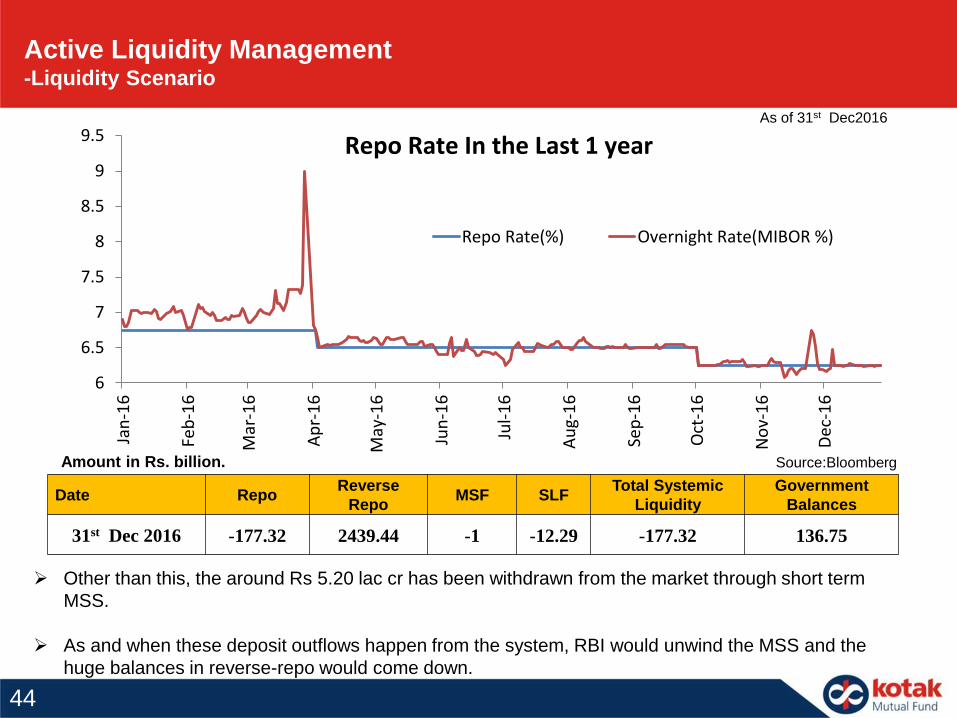
Other than this, the around Rs 5.20 lac cr has been withdrawn from the market through short term
MSS.
As and when these deposit outflows happen from the system, RBI would unwind the MSS and the
huge balances in reverse-repo would come down.
Source:Bloomberg
Date RepoReverse
RepoMSF SLF
Total Systemic
Liquidity
Government
Balances
31st Dec 2016 -177.32 2439.44 -1 -12.29 -177.32 136.75
Amount in Rs. billion.
Active Liquidity Management-Liquidity Scenario
As of 31st Dec2016
44
6
6.5
7
7.5
8
8.5
9
9.5Ja
n-1
6
Feb
-16
Mar
-16
Ap
r-1
6
May
-16
Jun
-16
Jul-
16
Au
g-1
6
Sep
-16
Oct
-16
No
v-1
6
Dec
-16
Repo Rate(%) Overnight Rate(MIBOR %)
Repo Rate In the Last 1 year
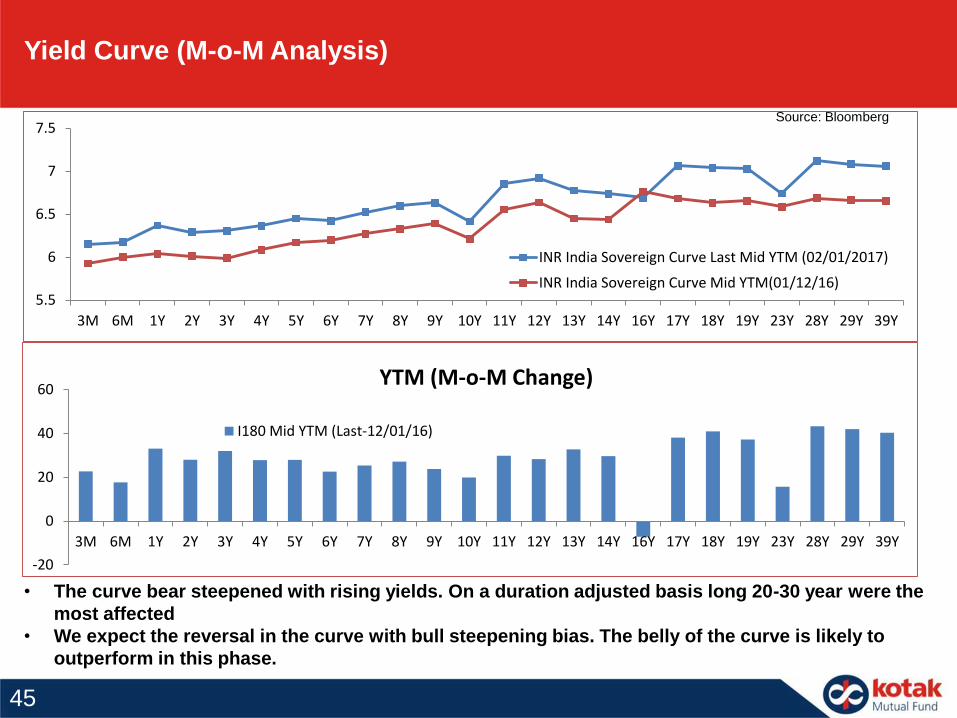
Yield Curve (M-o-M Analysis)
• The curve bear steepened with rising yields. On a duration adjusted basis long 20-30 year were the
most affected
• We expect the reversal in the curve with bull steepening bias. The belly of the curve is likely to
outperform in this phase.
Source: Bloomberg
45
-20
0
20
40
60
3M 6M 1Y 2Y 3Y 4Y 5Y 6Y 7Y 8Y 9Y 10Y 11Y 12Y 13Y 14Y 16Y 17Y 18Y 19Y 23Y 28Y 29Y 39Y
YTM (M-o-M Change)
I180 Mid YTM (Last-12/01/16)
5.5
6
6.5
7
7.5
3M 6M 1Y 2Y 3Y 4Y 5Y 6Y 7Y 8Y 9Y 10Y 11Y 12Y 13Y 14Y 16Y 17Y 18Y 19Y 23Y 28Y 29Y 39Y
INR India Sovereign Curve Last Mid YTM (02/01/2017)
INR India Sovereign Curve Mid YTM(01/12/16)
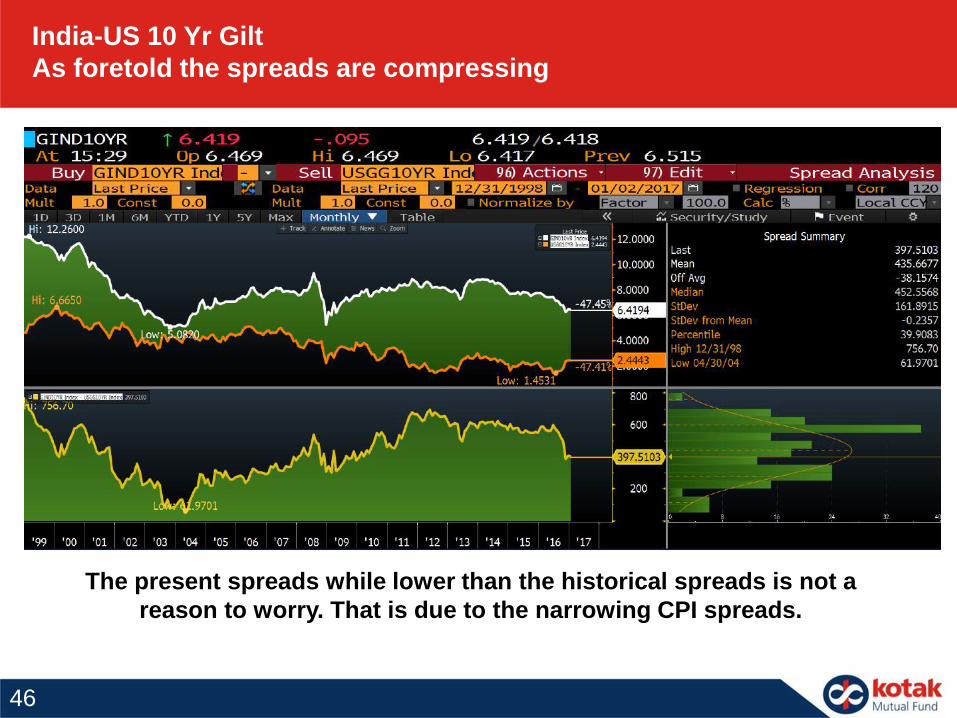
India-US 10 Yr Gilt
As foretold the spreads are compressing
46
The present spreads while lower than the historical spreads is not a
reason to worry. That is due to the narrowing CPI spreads.
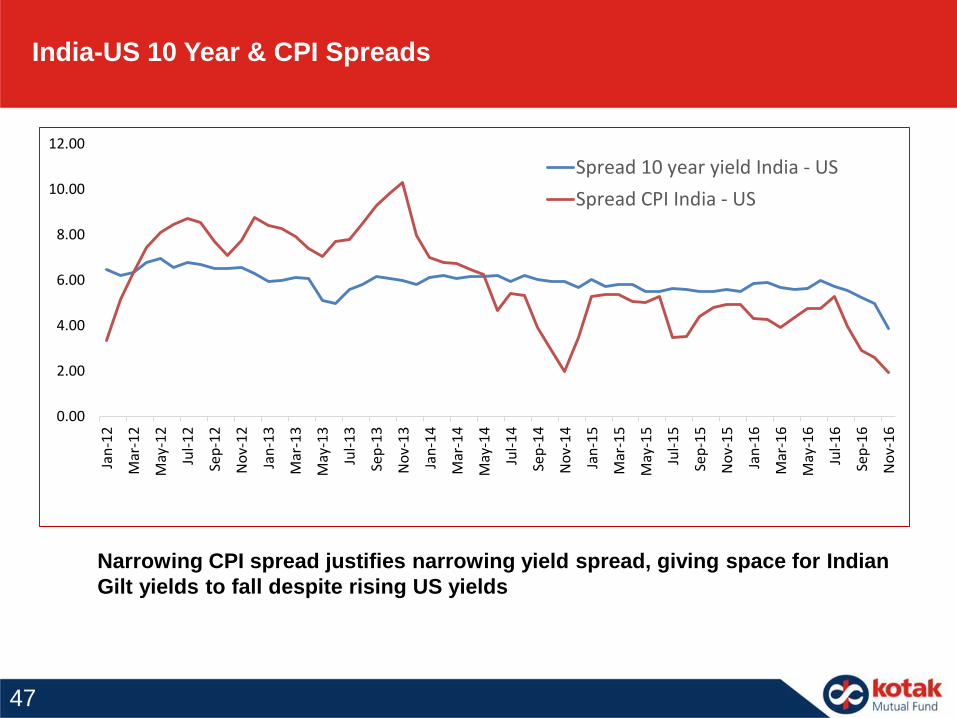
India-US 10 Year & CPI Spreads
Narrowing CPI spread justifies narrowing yield spread, giving space for Indian
Gilt yields to fall despite rising US yields
47
0.00
2.00
4.00
6.00
8.00
10.00
12.00
Jan
-12
Mar
-12
May
-12
Jul-
12
Sep
-12
No
v-1
2
Jan
-13
Mar
-13
May
-13
Jul-
13
Sep
-13
No
v-1
3
Jan
-14
Mar
-14
May
-14
Jul-
14
Sep
-14
No
v-1
4
Jan
-15
Mar
-15
May
-15
Jul-
15
Sep
-15
No
v-1
5
Jan
-16
Mar
-16
May
-16
Jul-
16
Sep
-16
No
v-1
6
Spread 10 year yield India - US
Spread CPI India - US
Source:Bloomberg
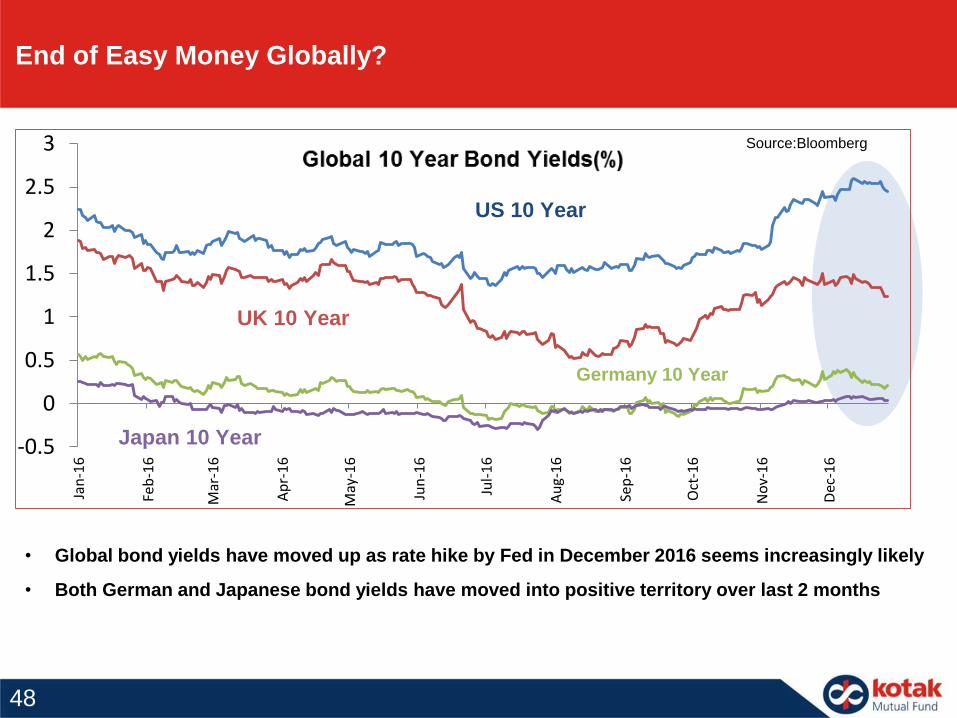
End of Easy Money Globally?
• Global bond yields have moved up as rate hike by Fed in December 2016 seems increasingly likely
• Both German and Japanese bond yields have moved into positive territory over last 2 months
48
-0.5
0
0.5
1
1.5
2
2.5
3
Jan
-16
Feb
-16
Mar
-16
Ap
r-1
6
May
-16
Jun
-16
Jul-
16
Au
g-1
6
Sep
-16
Oct
-16
No
v-1
6
Dec
-16
US 10 Year
UK 10 Year
Germany 10 Year
Japan 10 Year
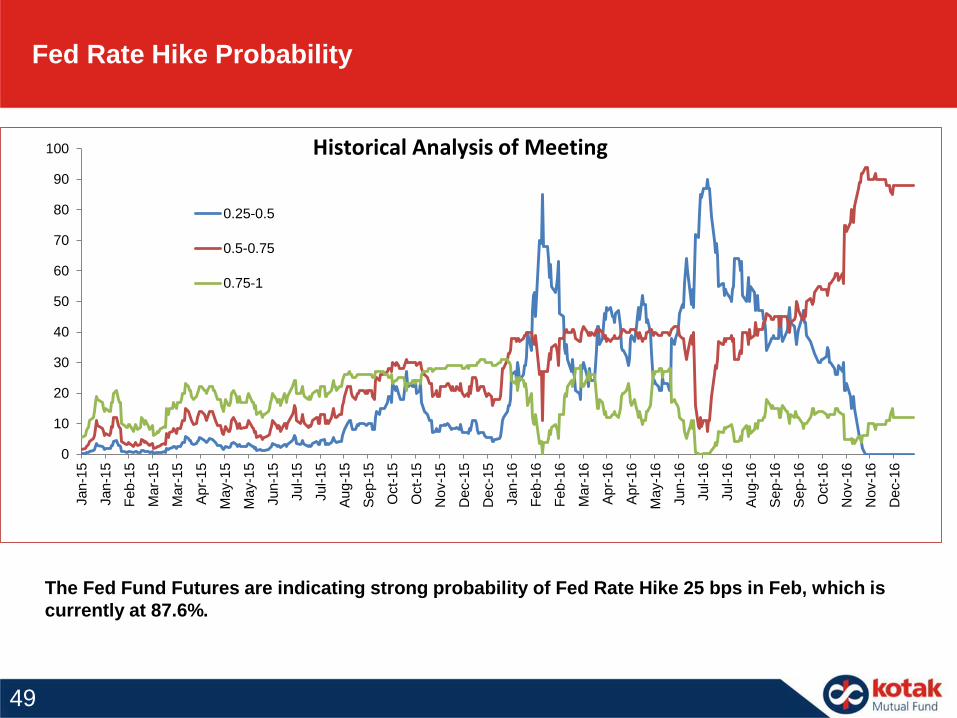
Fed Rate Hike Probability
The Fed Fund Futures are indicating strong probability of Fed Rate Hike 25 bps in Feb, which is
currently at 87.6%.
49
0
10
20
30
40
50
60
70
80
90
100
Jan
-15
Jan
-15
Fe
b-1
5
Ma
r-15
Ma
r-15
Ap
r-1
5
Ma
y-1
5
Ma
y-1
5
Jun
-15
Jul-
15
Jul-
15
Au
g-1
5
Se
p-1
5
Oct-
15
Oct-
15
No
v-1
5
De
c-1
5
De
c-1
5
Jan
-16
Fe
b-1
6
Fe
b-1
6
Ma
r-16
Ap
r-1
6
Ap
r-1
6
Ma
y-1
6
Jun
-16
Jul-
16
Jul-
16
Au
g-1
6
Se
p-1
6
Se
p-1
6
Oct-
16
No
v-1
6
No
v-1
6
De
c-1
6
0.25-0.5
0.5-0.75
0.75-1
Historical Analysis of Meeting
Source: Bloomberg
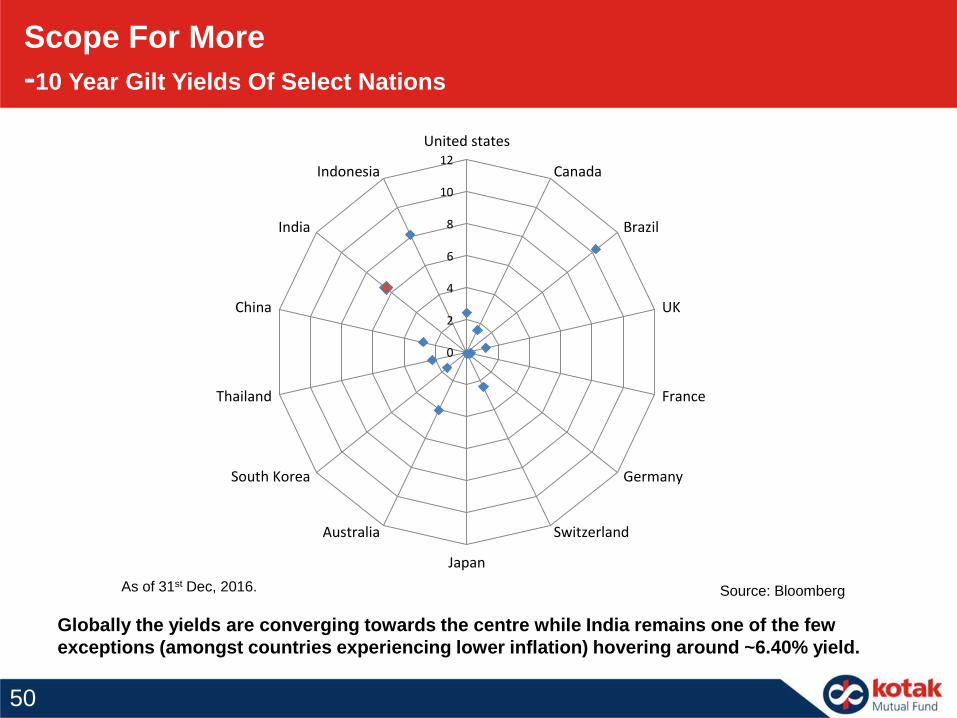
Scope For More
-10 Year Gilt Yields Of Select Nations
As of 31st Dec, 2016.
Globally the yields are converging towards the centre while India remains one of the few
exceptions (amongst countries experiencing lower inflation) hovering around ~6.40% yield.
50
0
2
4
6
8
10
12
United states
Canada
Brazil
UK
France
Germany
Switzerland
Japan
Australia
South Korea
Thailand
China
India
Indonesia
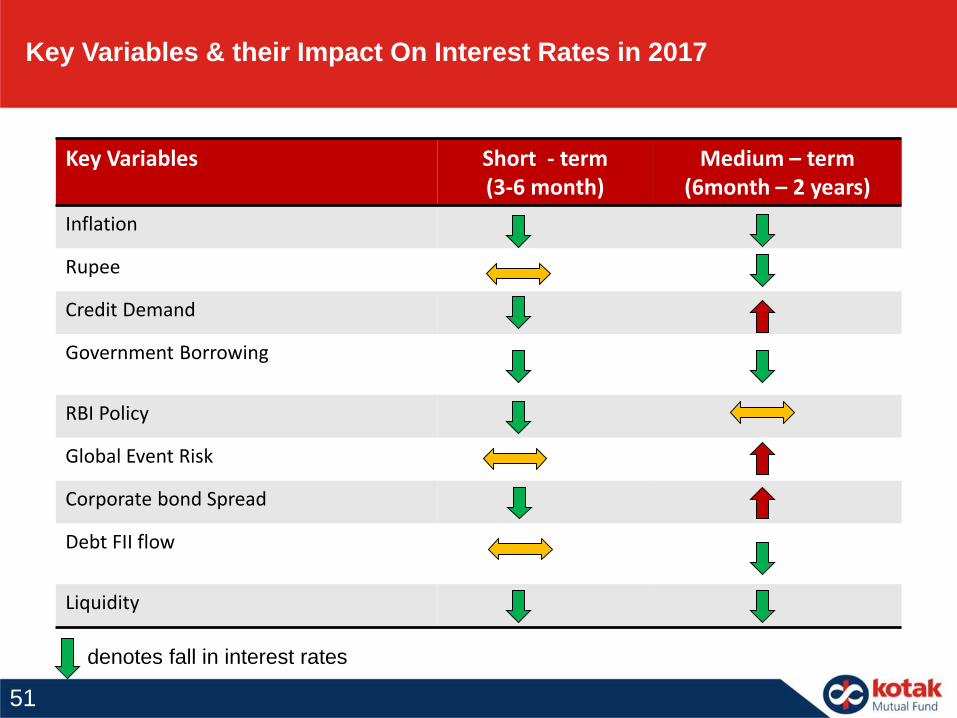
Key Variables & their Impact On Interest Rates in 2017
Key Variables Short - term (3-6 month)
Medium – term (6month – 2 years)
Inflation
Rupee
Credit Demand
Government Borrowing
RBI Policy
Global Event Risk
Corporate bond Spread
Debt FII flow
Liquidity
denotes fall in interest rates
51
Debt Outlook
The month of December caught all market participants by a surprise. The RBI decision of ‘no rate cut’, the FOMC
decision of a rate hike and projection both added to bear sentiment.
We maintain our view of soft interest rates on the over all bond market and thus held on our positions in
duration funds
This chase of assets is likely to continue and will lead to spread compression
SBI has cut MCLR rates across the bucket upto 90 bp and other are following, including private sector banks. This
augurs well for the future of bond yields
The impact of demonetization may lead to moderation in GDP growth. Thus, monetary stimulus may be required
to support growth in the coming period
The CPI prints going forward is likely to be softer and better than RBI base line projections and the government
is likely to stick with FRBM targets in the Budget. This will help RBI to continue with the monetary stimulus
52
Possibility of 25-50 bps rate cut in the coming period is emerging again as banks have passed on the balance
amount rate cut benefit to the borrower's. However RBI may want to gauge the period of impact, and were the
possible slowdown to last more than 2 quarters, RBI may take stronger measures to boost growth. In other words,
RBI may up front the rate cut in the Feb policy or just manage by easy liquidity and while await for more data
US 10 year yield have shown significant technical resistance at 2.55% levels and closed the month at 2.44%. If the
trend continues, then we may have seen the worst for the near term unless fresh data emerges indicating
otherwise
We still don’t know the exact computation of total currency demonetized and whether govt has any one time
benefit or not. However this is a long-term phenomena and will definitely impact the economy positively in terms
of non inflationary growth
If all goes as per expectations the new 10 year gilt may inch towards 5.9% mark by March 2017. Moreover, if the
possibility of the GDP slowdown persists, then it may trend even lower
The 3m to 12 m curve will move down to the extent of rate cut delivered, this curve will remain stable of fall from
current levels
Given the cut in MCLR the 12-36m, Corporate bond spreads are likely to compress with falling yields
53
Debt Outlook
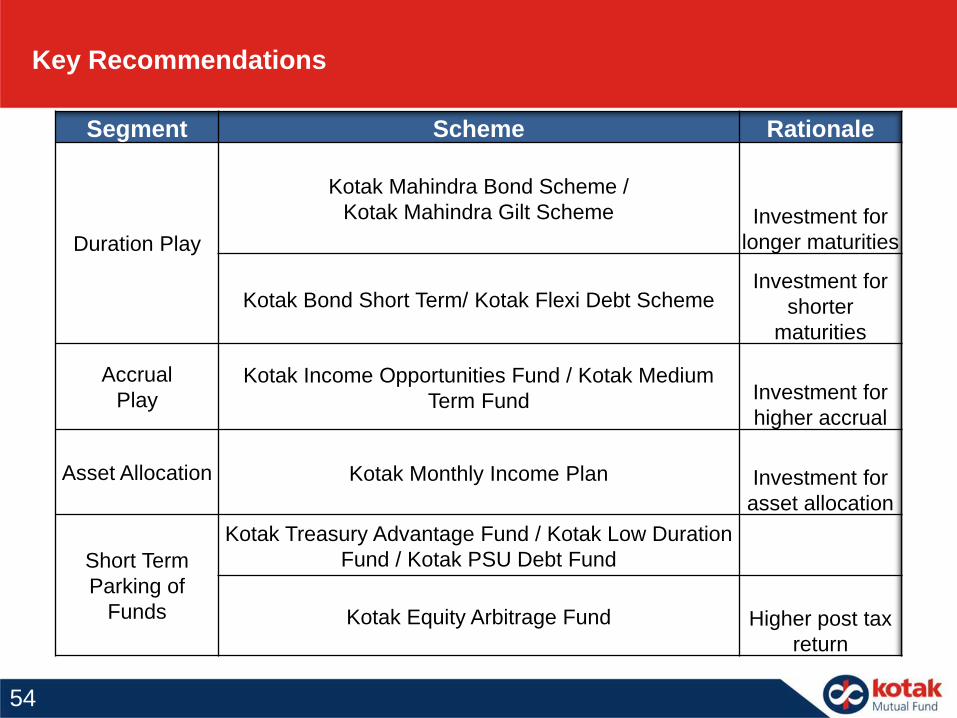
Key Recommendations
Segment Scheme Rationale
Duration Play
Kotak Mahindra Bond Scheme /
Kotak Mahindra Gilt Scheme Investment for
longer maturities
Kotak Bond Short Term/ Kotak Flexi Debt SchemeInvestment for
shorter
maturities
Accrual
PlayKotak Income Opportunities Fund / Kotak Medium
Term Fund Investment for
higher accrual
Asset Allocation Kotak Monthly Income Plan Investment for
asset allocation
Short Term
Parking of
Funds
Kotak Treasury Advantage Fund / Kotak Low Duration
Fund / Kotak PSU Debt Fund
Kotak Equity Arbitrage Fund Higher post tax
return
54
Why Accrual Funds ?
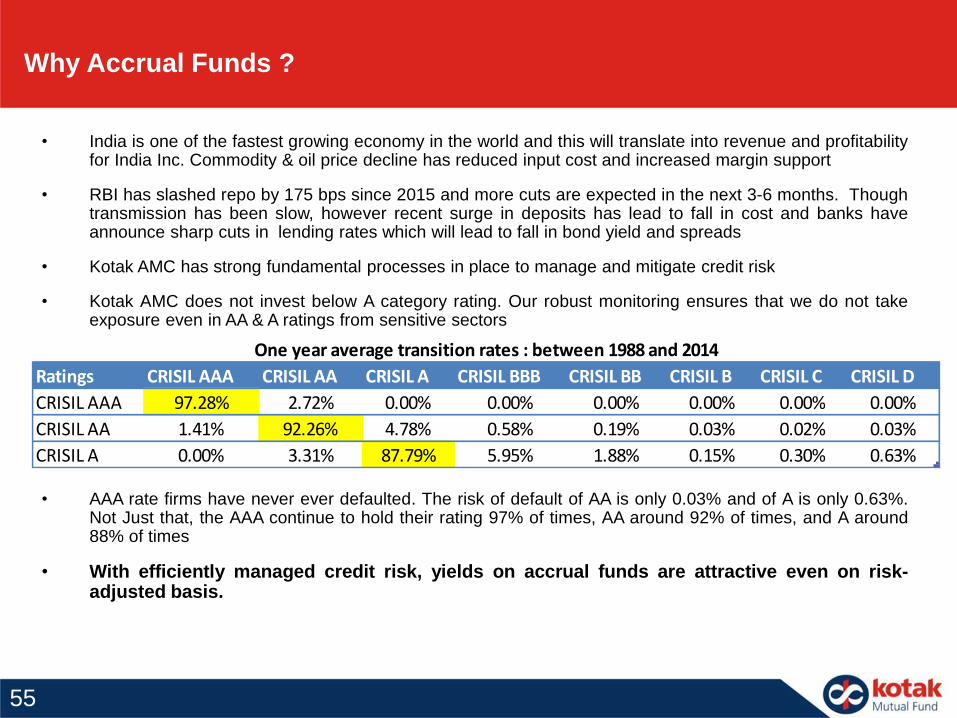
• India is one of the fastest growing economy in the world and this will translate into revenue and profitabilityfor India Inc. Commodity & oil price decline has reduced input cost and increased margin support
• RBI has slashed repo by 175 bps since 2015 and more cuts are expected in the next 3-6 months. Thoughtransmission has been slow, however recent surge in deposits has lead to fall in cost and banks haveannounce sharp cuts in lending rates which will lead to fall in bond yield and spreads
• Kotak AMC has strong fundamental processes in place to manage and mitigate credit risk
• Kotak AMC does not invest below A category rating. Our robust monitoring ensures that we do not takeexposure even in AA & A ratings from sensitive sectors
• AAA rate firms have never ever defaulted. The risk of default of AA is only 0.03% and of A is only 0.63%.Not Just that, the AAA continue to hold their rating 97% of times, AA around 92% of times, and A around88% of times
• With efficiently managed credit risk, yields on accrual funds are attractive even on risk-adjusted basis.
Ratings CRISIL AAA CRISIL AA CRISIL A CRISIL BBB CRISIL BB CRISIL B CRISIL C CRISIL D
CRISIL AAA 97.28% 2.72% 0.00% 0.00% 0.00% 0.00% 0.00% 0.00%
CRISIL AA 1.41% 92.26% 4.78% 0.58% 0.19% 0.03% 0.02% 0.03%
CRISIL A 0.00% 3.31% 87.79% 5.95% 1.88% 0.15% 0.30% 0.63%
One year average transition rates : between 1988 and 2014
55
Story in Accruals
• Accruals generate performance by purchasing high yielding assets
• The market is currently tilted towards the buyers
• Corporates have alternative in NBFCs for funding. But such corporates would need to provide high
collateral in keeping with the RBI guidelines regarding loan against shares.
• Thus, creditable and quality corporates has to shell out high rates to attract capital
• Retail Investors can consider accrual funds like Kotak Income Opportunities / Kotak Medium term to
gain from the potential high yields in the market.
56

Need to Watch Out for Opportunities
in Hybrid Space
57
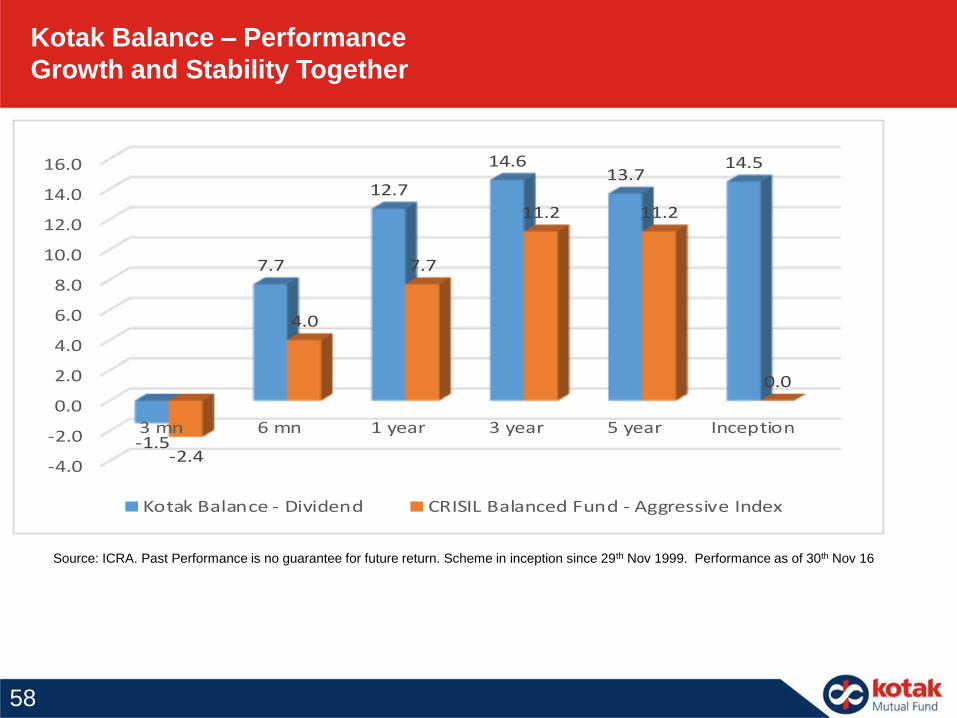
Kotak Balance – Performance
Growth and Stability Together
58
-4.0
-2.0
0.0
2.0
4.0
6.0
8.0
10.0
12.0
14.0
16.0
3 mn 6 mn 1 year 3 year 5 year Inception-1.5
7.7
12.7
14.613.7
14.5
-2.4
4.0
7.7
11.2 11.2
0.0
Kotak Balance - Dividend CRISIL Balanced Fund - Aggressive Index
Source: ICRA. Past Performance is no guarantee for future return. Scheme in inception since 29th Nov 1999. Performance as of 30th Nov 16
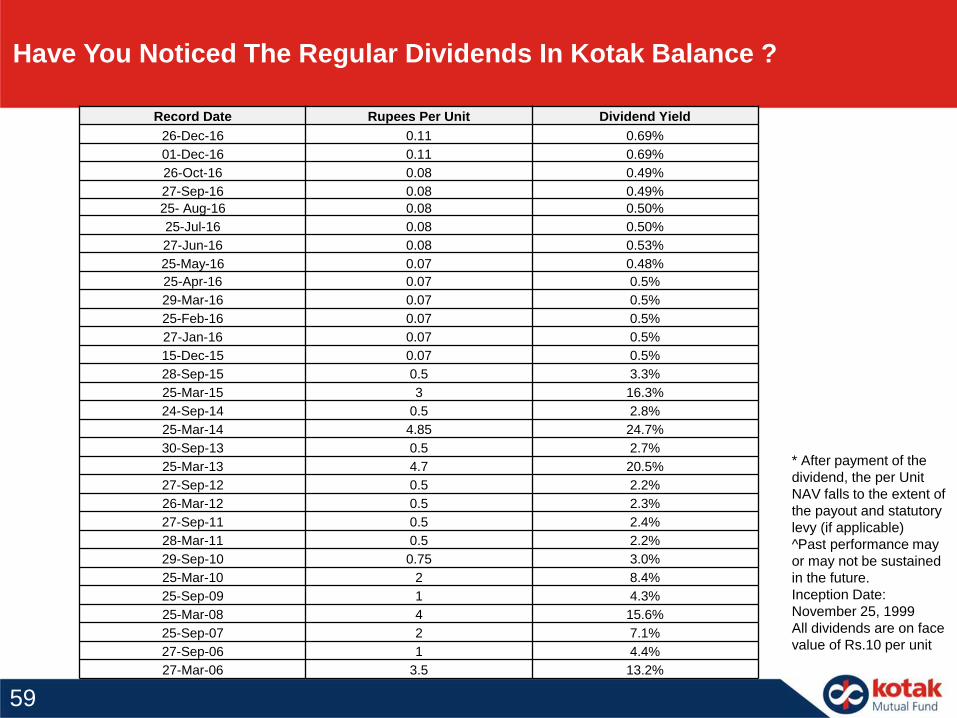
Record Date Rupees Per Unit Dividend Yield
26-Dec-16 0.11 0.69%
01-Dec-16 0.11 0.69%
26-Oct-16 0.08 0.49%
27-Sep-16 0.08 0.49%
25- Aug-16 0.08 0.50%
25-Jul-16 0.08 0.50%
27-Jun-16 0.08 0.53%
25-May-16 0.07 0.48%
25-Apr-16 0.07 0.5%
29-Mar-16 0.07 0.5%
25-Feb-16 0.07 0.5%
27-Jan-16 0.07 0.5%
15-Dec-15 0.07 0.5%
28-Sep-15 0.5 3.3%
25-Mar-15 3 16.3%
24-Sep-14 0.5 2.8%
25-Mar-14 4.85 24.7%
30-Sep-13 0.5 2.7%
25-Mar-13 4.7 20.5%
27-Sep-12 0.5 2.2%
26-Mar-12 0.5 2.3%
27-Sep-11 0.5 2.4%
28-Mar-11 0.5 2.2%
29-Sep-10 0.75 3.0%
25-Mar-10 2 8.4%
25-Sep-09 1 4.3%
25-Mar-08 4 15.6%
25-Sep-07 2 7.1%
27-Sep-06 1 4.4%
27-Mar-06 3.5 13.2%
Have You Noticed The Regular Dividends In Kotak Balance ?
* After payment of the
dividend, the per Unit
NAV falls to the extent of
the payout and statutory
levy (if applicable)
^Past performance may
or may not be sustained
in the future.
Inception Date:
November 25, 1999
All dividends are on face
value of Rs.10 per unit
59
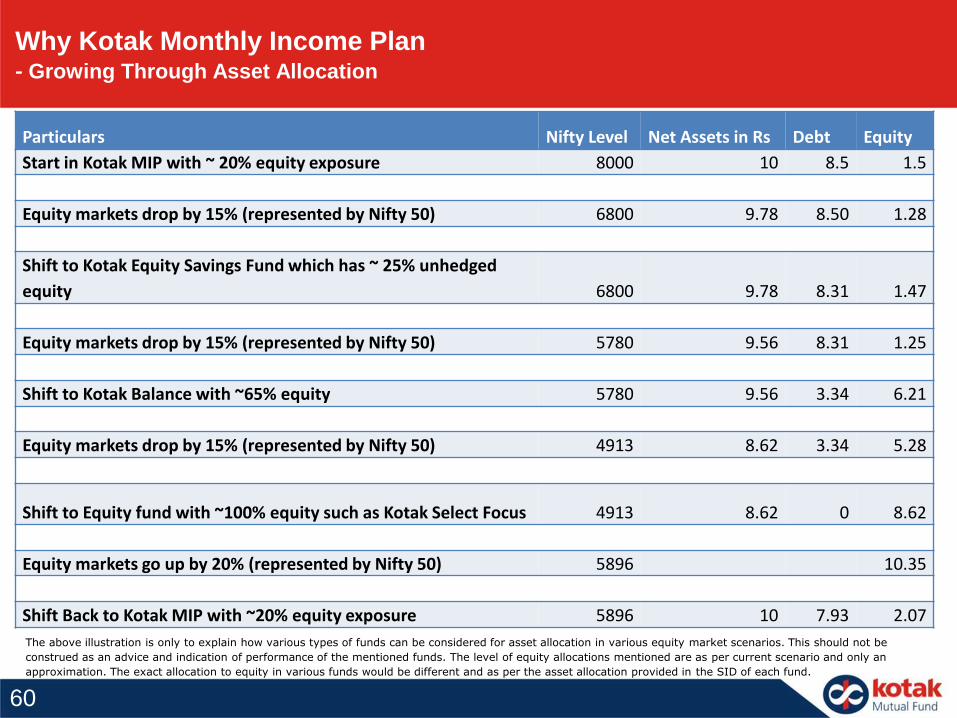
Particulars Nifty Level Net Assets in Rs Debt Equity
Start in Kotak MIP with ~ 20% equity exposure 8000 10 8.5 1.5
Equity markets drop by 15% (represented by Nifty 50) 6800 9.78 8.50 1.28
Shift to Kotak Equity Savings Fund which has ~ 25% unhedged
equity 6800 9.78 8.31 1.47
Equity markets drop by 15% (represented by Nifty 50) 5780 9.56 8.31 1.25
Shift to Kotak Balance with ~65% equity 5780 9.56 3.34 6.21
Equity markets drop by 15% (represented by Nifty 50) 4913 8.62 3.34 5.28
Shift to Equity fund with ~100% equity such as Kotak Select Focus 4913 8.62 0 8.62
Equity markets go up by 20% (represented by Nifty 50) 5896 10.35
Shift Back to Kotak MIP with ~20% equity exposure 5896 10 7.93 2.07
Why Kotak Monthly Income Plan- Growing Through Asset Allocation
The above illustration is only to explain how various types of funds can be considered for asset allocation in various equity market scenarios. This should not be
construed as an advice and indication of performance of the mentioned funds. The level of equity allocations mentioned are as per current scenario and only an
approximation. The exact allocation to equity in various funds would be different and as per the asset allocation provided in the SID of each fund.
60
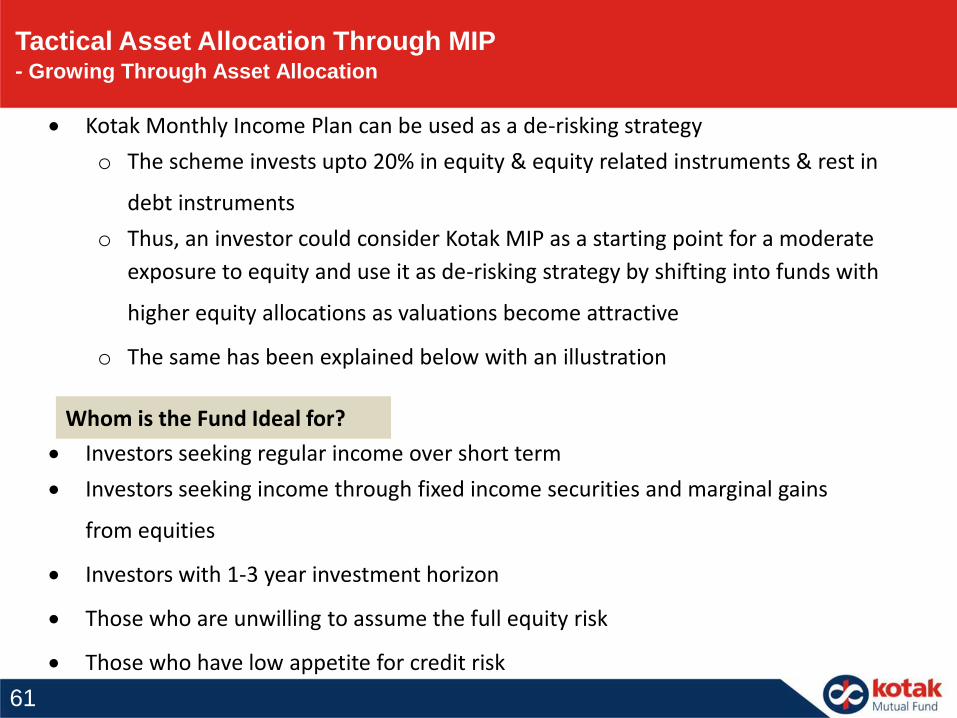
Tactical Asset Allocation Through MIP- Growing Through Asset Allocation
Kotak Monthly Income Plan can be used as a de-risking strategy
o The scheme invests upto 20% in equity & equity related instruments & rest in
debt instruments
o Thus, an investor could consider Kotak MIP as a starting point for a moderate
exposure to equity and use it as de-risking strategy by shifting into funds with
higher equity allocations as valuations become attractive
o The same has been explained below with an illustration
Whom is the Fund Ideal for?
Investors seeking regular income over short term
Investors seeking income through fixed income securities and marginal gains
from equities
Investors with 1-3 year investment horizon
Those who are unwilling to assume the full equity risk
Those who have low appetite for credit risk
61
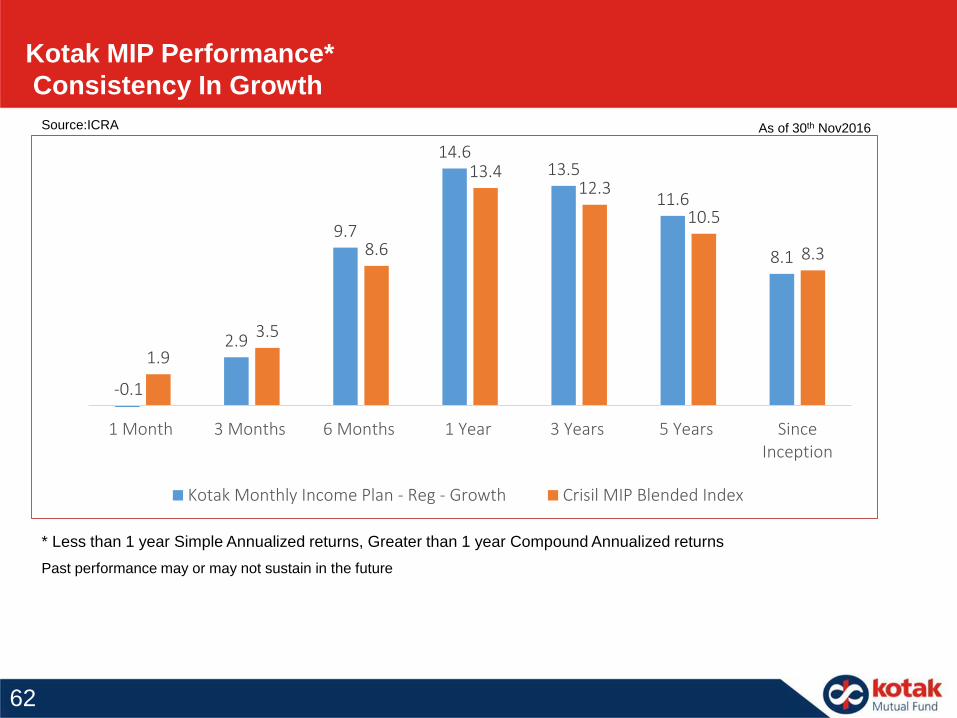
-0.1
2.9
9.7
14.613.5
11.6
8.1
1.9
3.5
8.6
13.412.3
10.5
8.3
1 Month 3 Months 6 Months 1 Year 3 Years 5 Years SinceInception
Kotak Monthly Income Plan - Reg - Growth Crisil MIP Blended Index
Kotak MIP Performance*
Consistency In Growth
As of 30th Nov2016Source:ICRA
* Less than 1 year Simple Annualized returns, Greater than 1 year Compound Annualized returns
Past performance may or may not sustain in the future
62
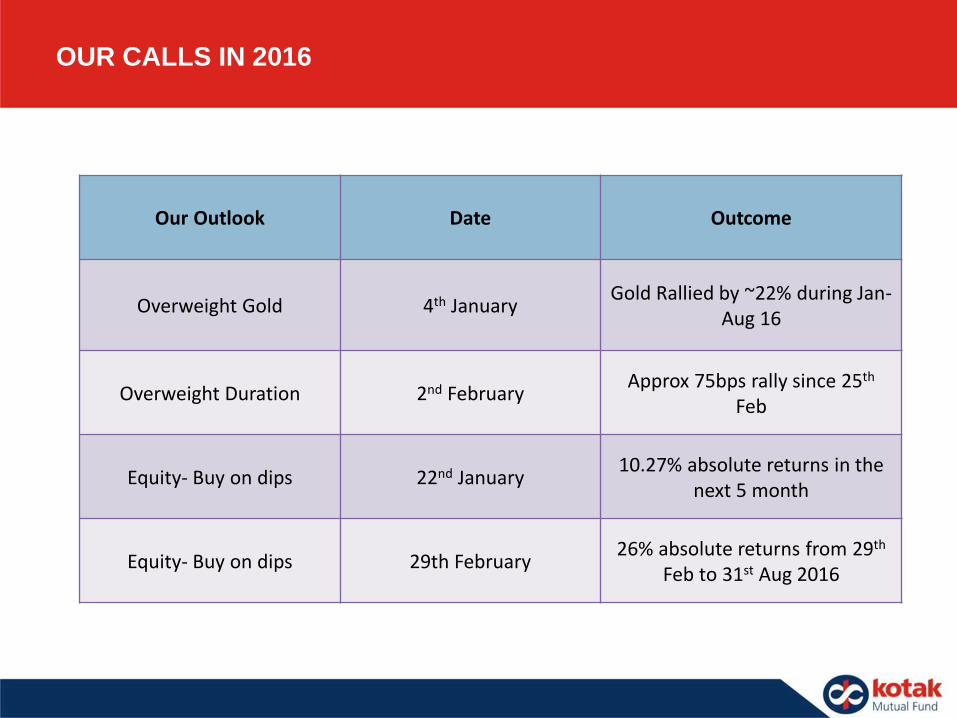
OUR CALLS IN 2016
Our Outlook Date Outcome
Overweight Gold 4th JanuaryGold Rallied by ~22% during Jan-
Aug 16
Overweight Duration 2nd FebruaryApprox 75bps rally since 25th
Feb
Equity- Buy on dips 22nd January10.27% absolute returns in the
next 5 month
Equity- Buy on dips 29th February26% absolute returns from 29th
Feb to 31st Aug 2016

WHY KOTAK MUTUAL FUND IS DIFFERENT FROM OTHERS
64
We are Managing Your Trust First and Money second
We are your Partner
Disciplined Process
Risk adjusted Return
Believer in Warren Buffets Philosophy
Funds are like Kids. Don’t have more than what we
can manage
Readily accessible for Knowledge and Service
Our Employees invest only in our funds.
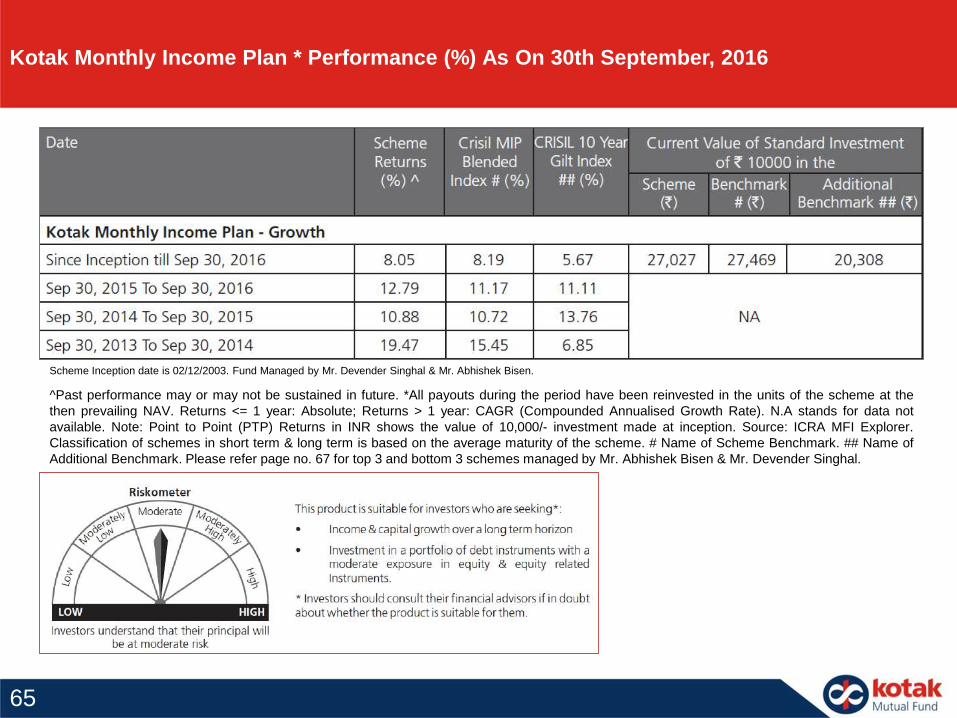
Scheme Inception date is 02/12/2003. Fund Managed by Mr. Devender Singhal & Mr. Abhishek Bisen.
^Past performance may or may not be sustained in future. *All payouts during the period have been reinvested in the units of the scheme at the
then prevailing NAV. Returns <= 1 year: Absolute; Returns > 1 year: CAGR (Compounded Annualised Growth Rate). N.A stands for data not
available. Note: Point to Point (PTP) Returns in INR shows the value of 10,000/- investment made at inception. Source: ICRA MFI Explorer.
Classification of schemes in short term & long term is based on the average maturity of the scheme. # Name of Scheme Benchmark. ## Name of
Additional Benchmark. Please refer page no. 67 for top 3 and bottom 3 schemes managed by Mr. Abhishek Bisen & Mr. Devender Singhal.
Kotak Monthly Income Plan * Performance (%) As On 30th September, 2016
65
66
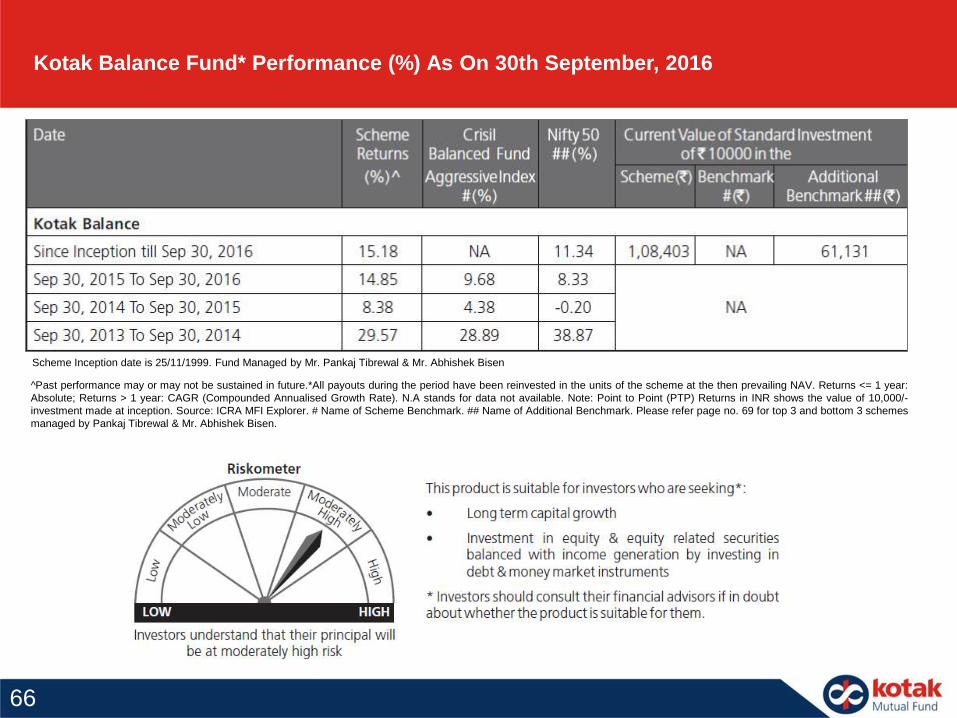
Kotak Balance Fund* Performance (%) As On 30th September, 2016
Scheme Inception date is 25/11/1999. Fund Managed by Mr. Pankaj Tibrewal & Mr. Abhishek Bisen
^Past performance may or may not be sustained in future.*All payouts during the period have been reinvested in the units of the scheme at the then prevailing NAV. Returns <= 1 year:
Absolute; Returns > 1 year: CAGR (Compounded Annualised Growth Rate). N.A stands for data not available. Note: Point to Point (PTP) Returns in INR shows the value of 10,000/-
investment made at inception. Source: ICRA MFI Explorer. # Name of Scheme Benchmark. ## Name of Additional Benchmark. Please refer page no. 69 for top 3 and bottom 3 schemes
managed by Pankaj Tibrewal & Mr. Abhishek Bisen.
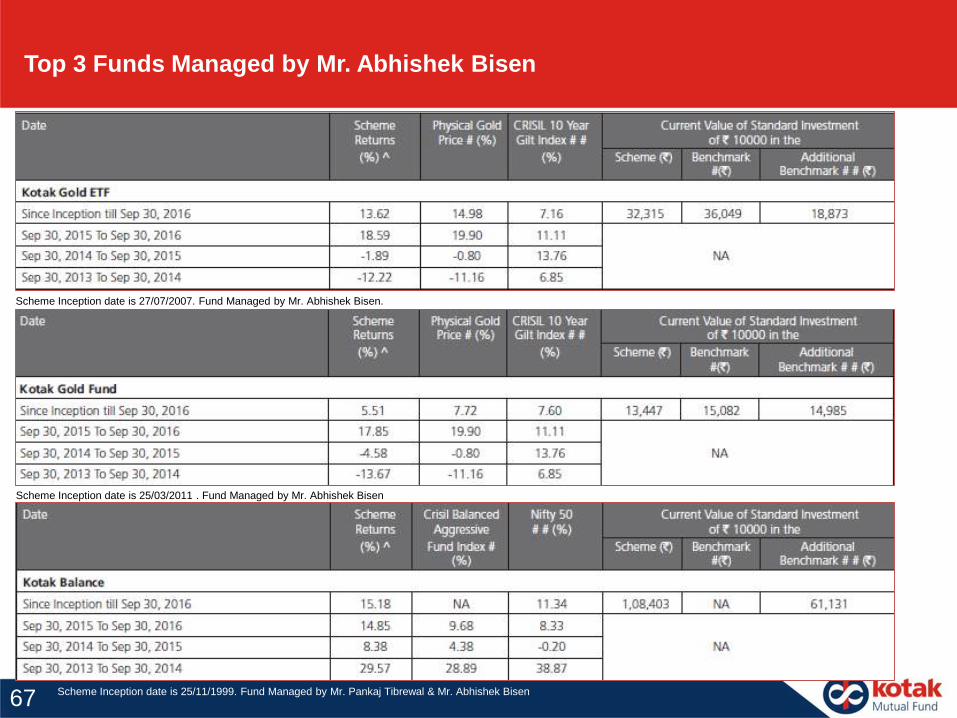
Top 3 Funds Managed by Mr. Abhishek Bisen
Scheme Inception date is 27/07/2007. Fund Managed by Mr. Abhishek Bisen.
Scheme Inception date is 25/03/2011 . Fund Managed by Mr. Abhishek Bisen
Scheme Inception date is 25/11/1999. Fund Managed by Mr. Pankaj Tibrewal & Mr. Abhishek Bisen67
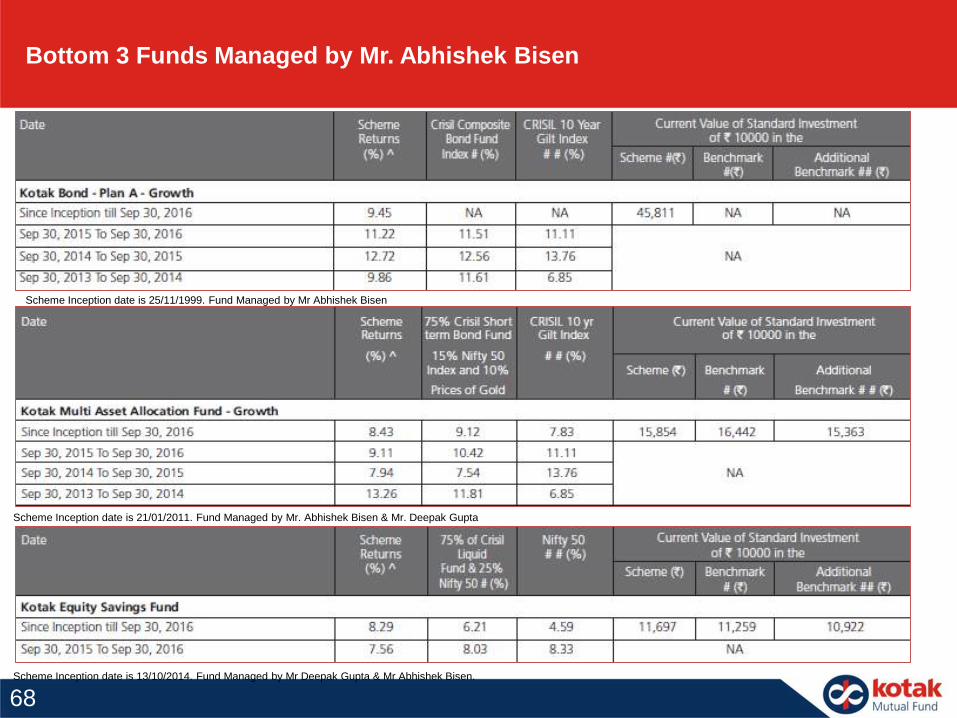
Bottom 3 Funds Managed by Mr. Abhishek Bisen
Scheme Inception date is 25/11/1999. Fund Managed by Mr Abhishek Bisen
Scheme Inception date is 21/01/2011. Fund Managed by Mr. Abhishek Bisen & Mr. Deepak Gupta
Scheme Inception date is 13/10/2014. Fund Managed by Mr Deepak Gupta & Mr Abhishek Bisen.
68
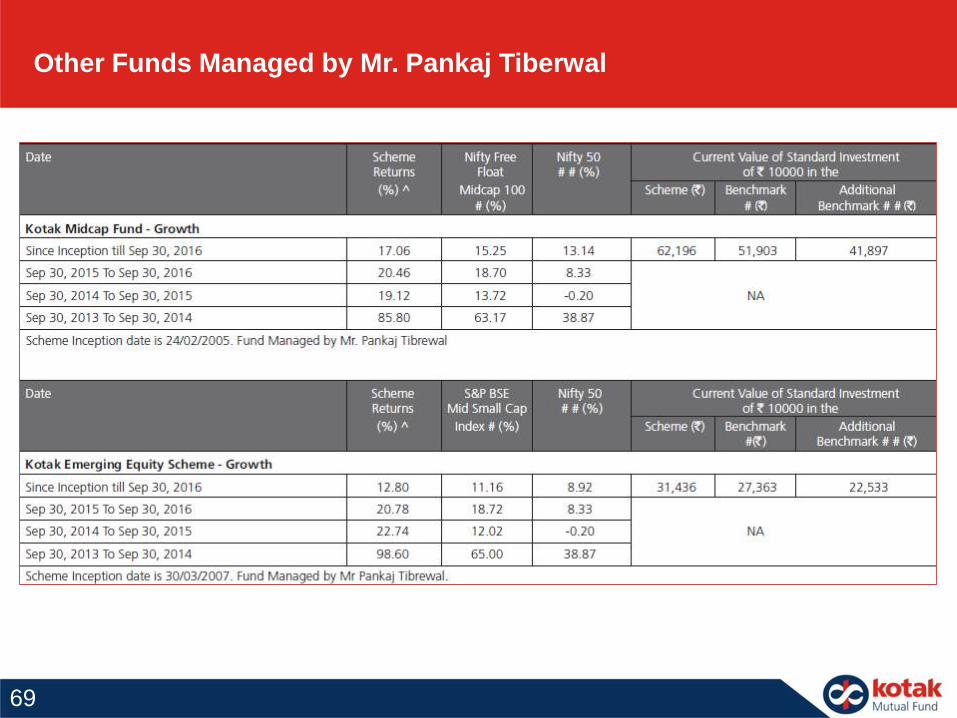
Other Funds Managed by Mr. Pankaj Tiberwal
69
The information contained in this (document) is extracted from different public sources. Allreasonable care has been taken to ensure that the information contained herein is notmisleading or untrue at the time of publication. This is for the information of the person towhom it is provided without any liability whatsoever on the part of Kotak Mahindra AssetManagement Co Ltd or any associated companies or any employee thereof.We are notsoliciting any action based on this material and is for general information only. Mutual Fundinvestments are subject to market risks, read all scheme related documents carefully.
DISCLAIMERS & RISK FACTORS
About the scheme:
70
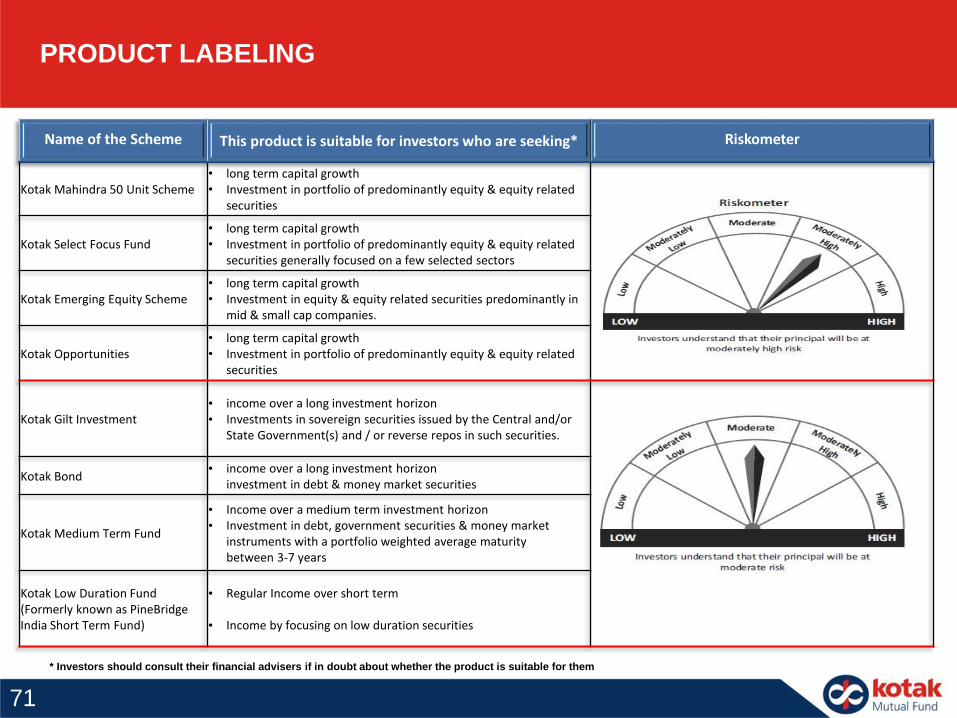
Name of the Scheme This product is suitable for investors who are seeking* Riskometer
Kotak Mahindra 50 Unit Scheme• long term capital growth• Investment in portfolio of predominantly equity & equity related
securities
Kotak Select Focus Fund • long term capital growth• Investment in portfolio of predominantly equity & equity related
securities generally focused on a few selected sectors
Kotak Emerging Equity Scheme• long term capital growth• Investment in equity & equity related securities predominantly in
mid & small cap companies.
Kotak Opportunities• long term capital growth• Investment in portfolio of predominantly equity & equity related
securities
Kotak Gilt Investment• income over a long investment horizon• Investments in sovereign securities issued by the Central and/or
State Government(s) and / or reverse repos in such securities.
Kotak Bond• income over a long investment horizon
investment in debt & money market securities
Kotak Medium Term Fund
• Income over a medium term investment horizon• Investment in debt, government securities & money market
instruments with a portfolio weighted average maturitybetween 3-7 years
Kotak Low Duration Fund (Formerly known as PineBridgeIndia Short Term Fund)
• Regular Income over short term
• Income by focusing on low duration securities
* Investors should consult their financial advisers if in doubt about whether the product is suitable for them
PRODUCT LABELING
71
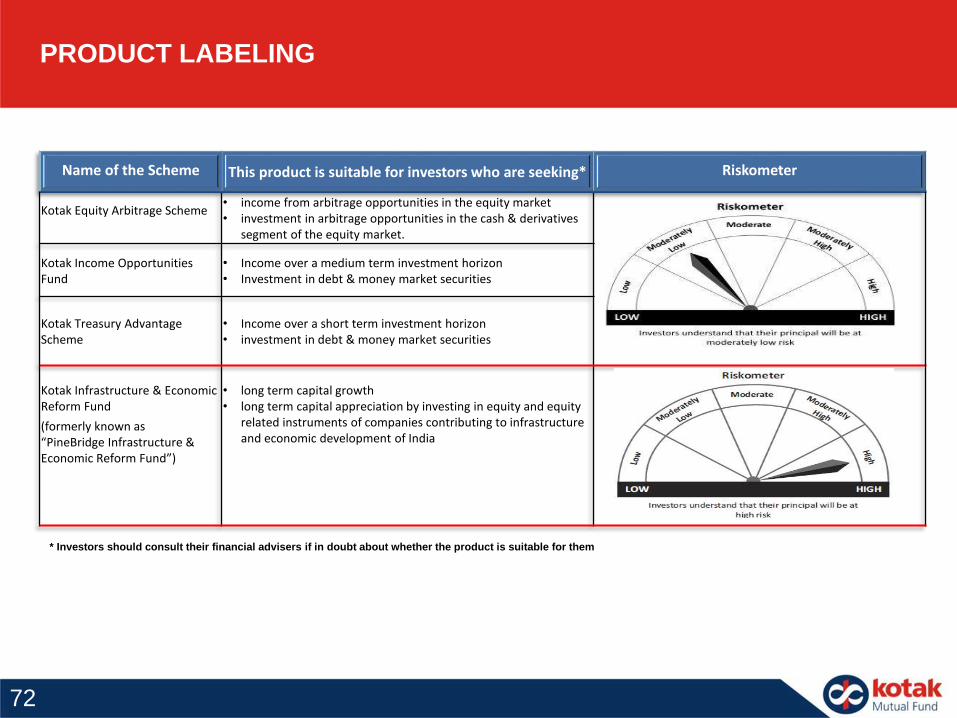
Name of the Scheme This product is suitable for investors who are seeking* Riskometer
Kotak Equity Arbitrage Scheme• income from arbitrage opportunities in the equity market• investment in arbitrage opportunities in the cash & derivatives
segment of the equity market.
Kotak Income Opportunities Fund
• Income over a medium term investment horizon• Investment in debt & money market securities
Kotak Treasury Advantage Scheme
• Income over a short term investment horizon• investment in debt & money market securities
Kotak Infrastructure & Economic Reform Fund
(formerly known as “PineBridge Infrastructure & Economic Reform Fund”)
• long term capital growth• long term capital appreciation by investing in equity and equity
related instruments of companies contributing to infrastructure and economic development of India
* Investors should consult their financial advisers if in doubt about whether the product is suitable for them
PRODUCT LABELING
72