Embed Size (px)
Citation preview
Market Outlook
April 2019

Equity Markets - Review

Equity Roundup - Movement in March
sClosing Value
1-Month Return (%)
1 Year Return (%)
U.S
S&P 500 2834 1.8 5.4
Nasdaq 7729 2.6 6.6
Dow Jones 25929 0.0 7.5
Europe
DAX 11526 0.1 -4.8
FTSE 100 7279 2.9 0.3
Asia/Pacific
Nikkei 11624 7.7 6.7
KOSPI 2141 -2.5 -10.2
Hang Seng 29051 1.5 -4.9
Domestic
Sensex 38673 7.8 8.8
Nifty 11624 7.7 6.7
BSE Mid cap TRI 18353 8.2 -9.5
BSE Small cap TRI 17667 9.8 -18.8
BSE 100 TRI 14018 7.6 5.9
BSE 200 TRI 5821 7.7 4.1
BSE 500 TRI 18123 7.9 1.6
Data as on 31 Mar 2019TRI – Total Return Index
Sectoral Performance – Domestic
• Indian equity markets ended last month of the financial year on astrong note. Benchmarks - BSE Sensex and Nifty rallied around 8%each in the month; owing to encouraging domestic and globaldevelopments.
• On the BSE sectoral front, all the indices closed on a positive note.Realty was the major gainer, up 15.7% followed by Bankex thatgrew 13.7% and PSU index which rose 13.4%.
• Surge in one of the major PSU banks following reports that thegovernment has decided to infuse funds worth Rs. 5,042 crore ascapital ahead of its merger with two other public sector lenders; ledto gains in the financial sector.
*S&P BSE Sectoral Indices movement between 28 Feb’19 to 31 Mar’19 in % terms
0.1
0.2
3.4
4.7
5.5
7.8
8.1
8.2
9.8
10.6
10.9
11.3
11.4
13.4
13.7
15.7
0.0 2.0 4.0 6.0 8.0 10.0 12.0 14.0 16.0 18.0
Auto
IT
FMCG
Heath Care
Metals
Sensex
Capital Goods
Mid Cap TRI
Small Cap TRI
Oil & Gas
Energy
Power
Consumer Durables
PSU
Bankex
Realty
Equity Market Roundup - Key Takeaways
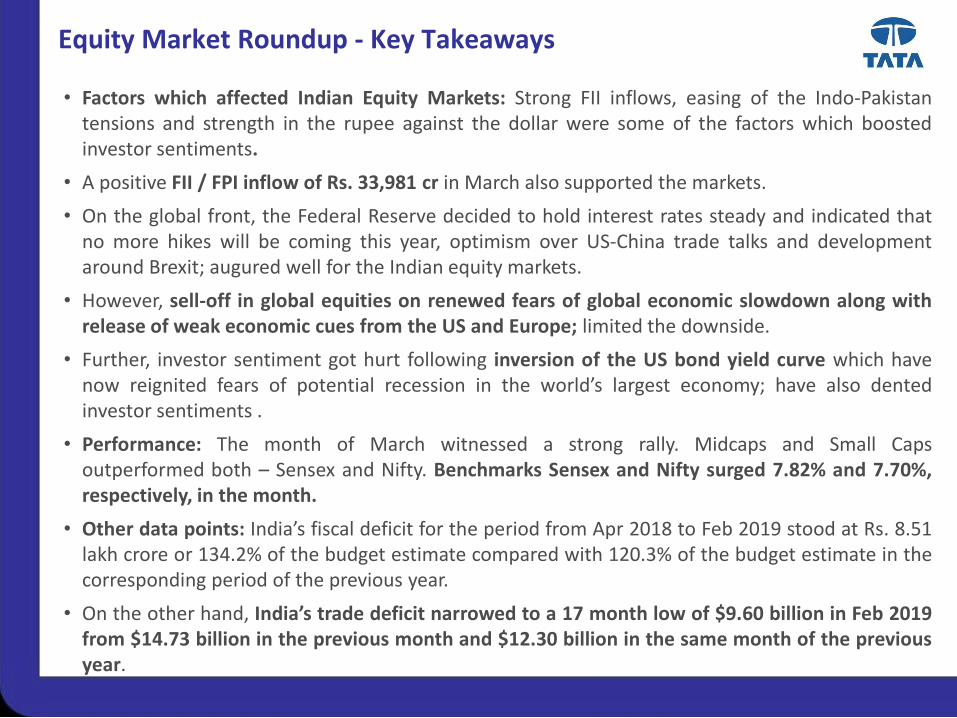
• Factors which affected Indian Equity Markets: Strong FII inflows, easing of the Indo-Pakistantensions and strength in the rupee against the dollar were some of the factors which boostedinvestor sentiments.
• A positive FII / FPI inflow of Rs. 33,981 cr in March also supported the markets.
• On the global front, the Federal Reserve decided to hold interest rates steady and indicated thatno more hikes will be coming this year, optimism over US-China trade talks and developmentaround Brexit; augured well for the Indian equity markets.
• However, sell-off in global equities on renewed fears of global economic slowdown along withrelease of weak economic cues from the US and Europe; limited the downside.
• Further, investor sentiment got hurt following inversion of the US bond yield curve which havenow reignited fears of potential recession in the world’s largest economy; have also dentedinvestor sentiments .
• Performance: The month of March witnessed a strong rally. Midcaps and Small Capsoutperformed both – Sensex and Nifty. Benchmarks Sensex and Nifty surged 7.82% and 7.70%,respectively, in the month.
• Other data points: India’s fiscal deficit for the period from Apr 2018 to Feb 2019 stood at Rs. 8.51lakh crore or 134.2% of the budget estimate compared with 120.3% of the budget estimate in thecorresponding period of the previous year.
• On the other hand, India’s trade deficit narrowed to a 17 month low of $9.60 billion in Feb 2019from $14.73 billion in the previous month and $12.30 billion in the same month of the previousyear.
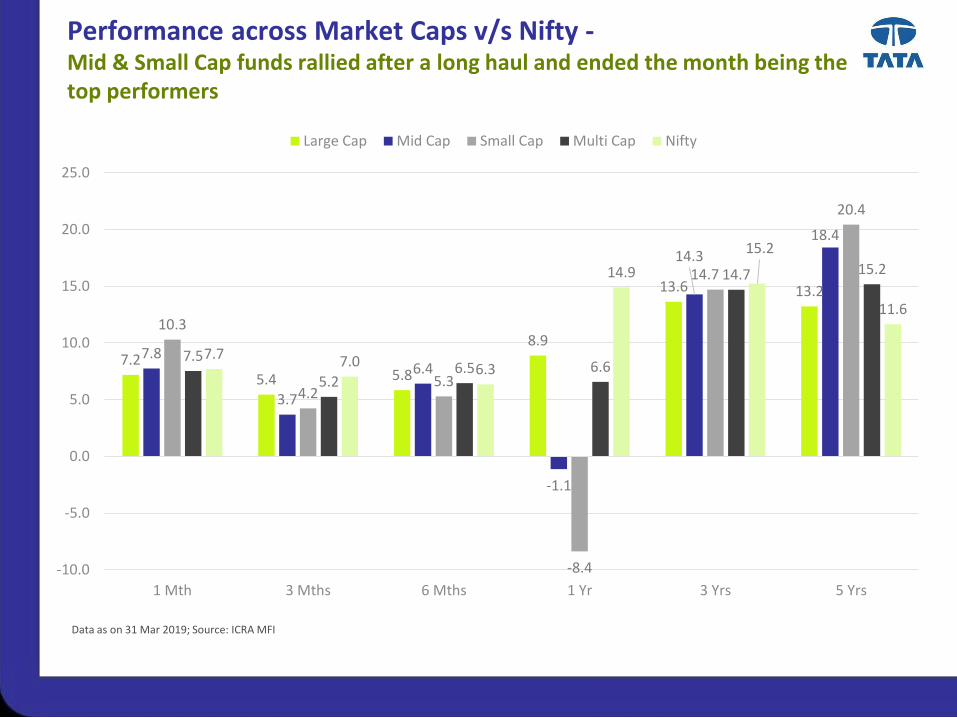
Performance across Market Caps v/s Nifty -Mid & Small Cap funds rallied after a long haul and ended the month being the top performers
Data as on 31 Mar 2019; Source: ICRA MFI
7.25.4 5.8
8.9
13.6 13.2
7.8
3.7
6.4
-1.1
14.3
18.4
10.3
4.25.3
-8.4
14.7
20.4
7.5
5.26.5 6.6
14.7 15.2
7.7 7.0 6.3
14.9
15.2
11.6
-10.0
-5.0
0.0
5.0
10.0
15.0
20.0
25.0
1 Mth 3 Mths 6 Mths 1 Yr 3 Yrs 5 Yrs
Large Cap Mid Cap Small Cap Multi Cap Nifty

Geo Political tensions do not deter the market sentiments!
IndexStrike Date(29-Sep-16)
1 Month Post(30-Oct-16)
3 Months Post(29-Dec-16)
1 Year Post(29-Sep-17)
Return 1 year (%)
Sensex 27828 27930 26366 31284 12.4%
Nifty 8591 8626 8104 9789 13.9%
Market Performance post URI Surgical Strike
Indicators 26-May-99 26-Jul-99 Return (%)
Sensex 3973 4625 16.4%
Nifty 1136 1326 16.7%
During Kargil War
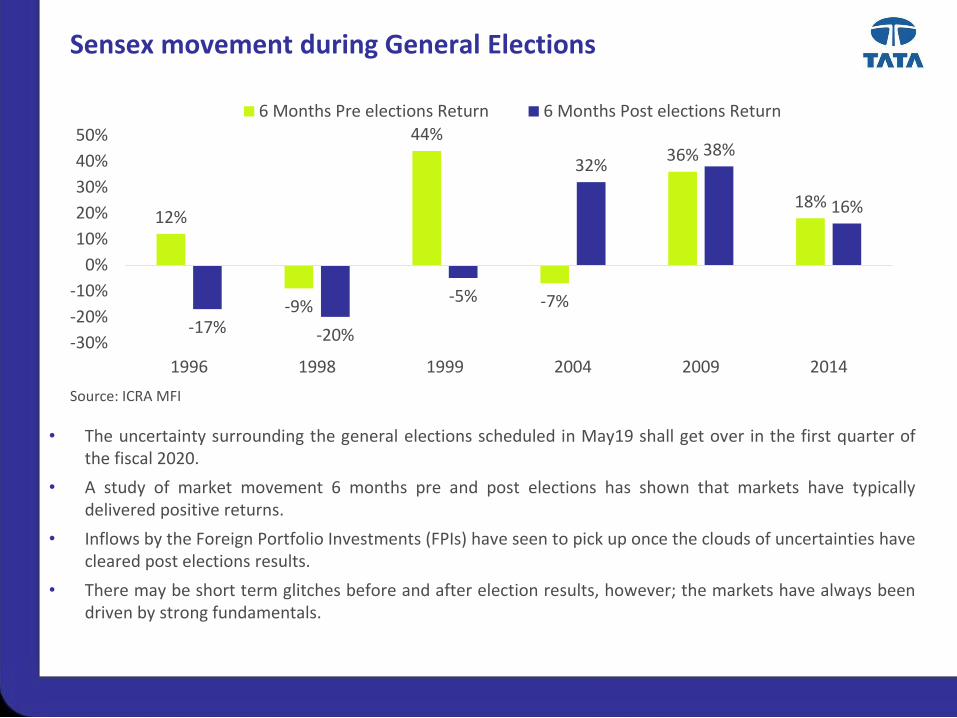
Sensex movement during General Elections
For internal circulation only
• The uncertainty surrounding the general elections scheduled in May19 shall get over in the first quarter ofthe fiscal 2020.
• A study of market movement 6 months pre and post elections has shown that markets have typicallydelivered positive returns.
• Inflows by the Foreign Portfolio Investments (FPIs) have seen to pick up once the clouds of uncertainties havecleared post elections results.
• There may be short term glitches before and after election results, however; the markets have always beendriven by strong fundamentals.
12%
-9%
44%
-7%
36%
18%
-17% -20%
-5%
32%38%
16%
-30%
-20%
-10%
0%
10%
20%
30%
40%
50%
1996 1998 1999 2004 2009 2014
6 Months Pre elections Return 6 Months Post elections Return
Source: ICRA MFI
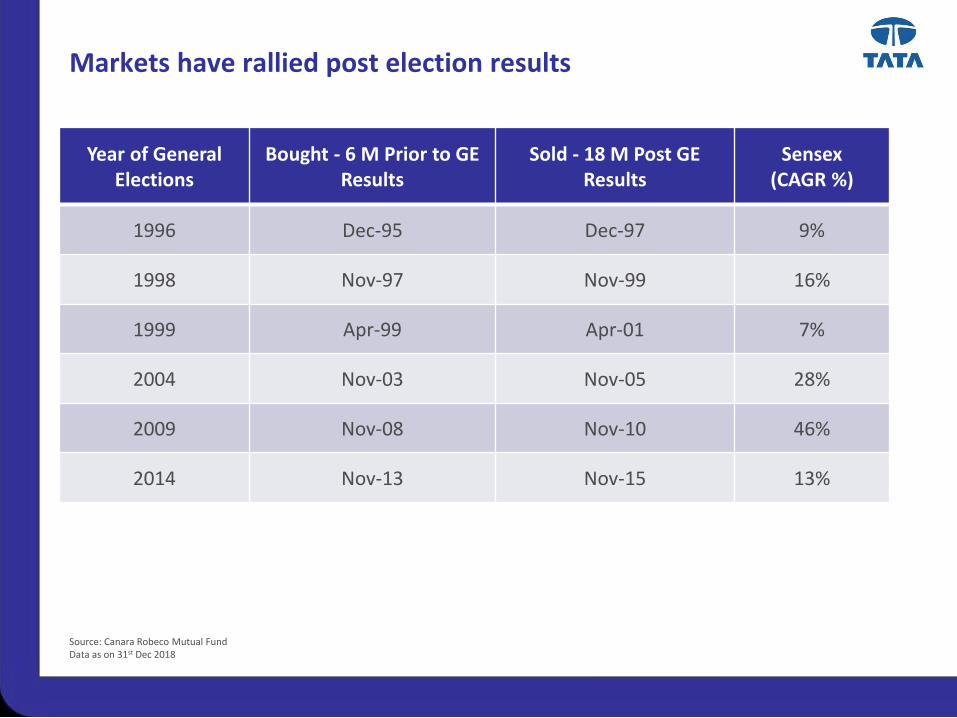
Markets have rallied post election results
Source: Canara Robeco Mutual FundData as on 31st Dec 2018
Year of GeneralElections
Bought - 6 M Prior to GE Results
Sold - 18 M Post GE Results
Sensex (CAGR %)
1996 Dec-95 Dec-97 9%
1998 Nov-97 Nov-99 16%
1999 Apr-99 Apr-01 7%
2004 Nov-03 Nov-05 28%
2009 Nov-08 Nov-10 46%
2014 Nov-13 Nov-15 13%
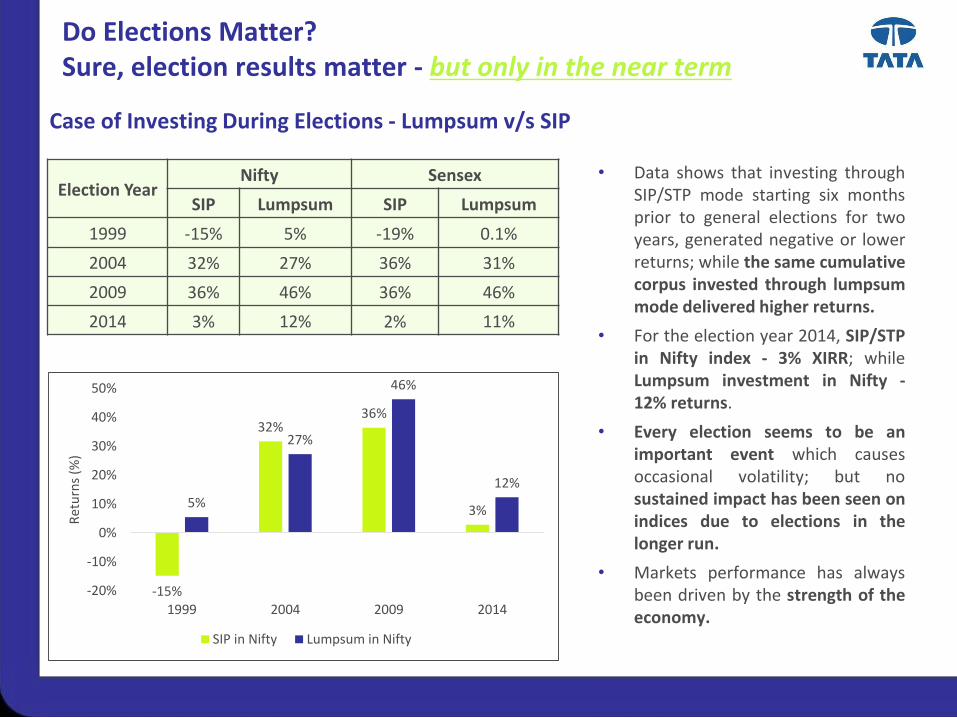
Case of Investing During Elections - Lumpsum v/s SIP
Election YearNifty Sensex
SIP Lumpsum SIP Lumpsum
1999 -15% 5% -19% 0.1%
2004 32% 27% 36% 31%
2009 36% 46% 36% 46%
2014 3% 12% 2% 11%
-15%
32%36%
3%5%
27%
46%
12%
-20%
-10%
0%
10%
20%
30%
40%
50%
1999 2004 2009 2014
Ret
urn
s (%
)
SIP in Nifty Lumpsum in Nifty
Do Elections Matter?Sure, election results matter - but only in the near term
• Data shows that investing throughSIP/STP mode starting six monthsprior to general elections for twoyears, generated negative or lowerreturns; while the same cumulativecorpus invested through lumpsummode delivered higher returns.
• For the election year 2014, SIP/STPin Nifty index - 3% XIRR; whileLumpsum investment in Nifty -12% returns.
• Every election seems to be animportant event which causesoccasional volatility; but nosustained impact has been seen onindices due to elections in thelonger run.
• Markets performance has alwaysbeen driven by the strength of theeconomy.
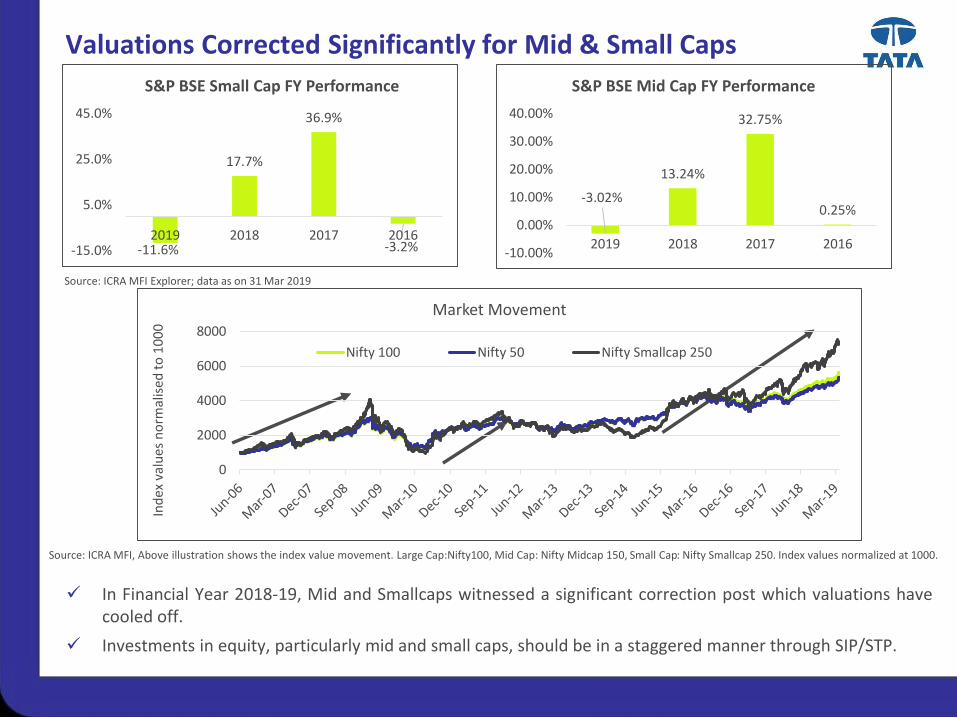
Valuations Corrected Significantly for Mid & Small Caps
Source: ICRA MFI Explorer; data as on 31 Mar 2019
In Financial Year 2018-19, Mid and Smallcaps witnessed a significant correction post which valuations havecooled off.
Investments in equity, particularly mid and small caps, should be in a staggered manner through SIP/STP.
Source: ICRA MFI, Above illustration shows the index value movement. Large Cap:Nifty100, Mid Cap: Nifty Midcap 150, Small Cap: Nifty Smallcap 250. Index values normalized at 1000.
-11.6%
17.7%
36.9%
-3.2%-15.0%
5.0%
25.0%
45.0%
2019 2018 2017 2016
S&P BSE Small Cap FY Performance
0
2000
4000
6000
8000
Ind
ex v
alu
es n
orm
alis
ed t
o 1
00
0
Market Movement
Nifty 100 Nifty 50 Nifty Smallcap 250
-3.02%
13.24%
32.75%
0.25%
-10.00%
0.00%
10.00%
20.00%
30.00%
40.00%
2019 2018 2017 2016
S&P BSE Mid Cap FY Performance
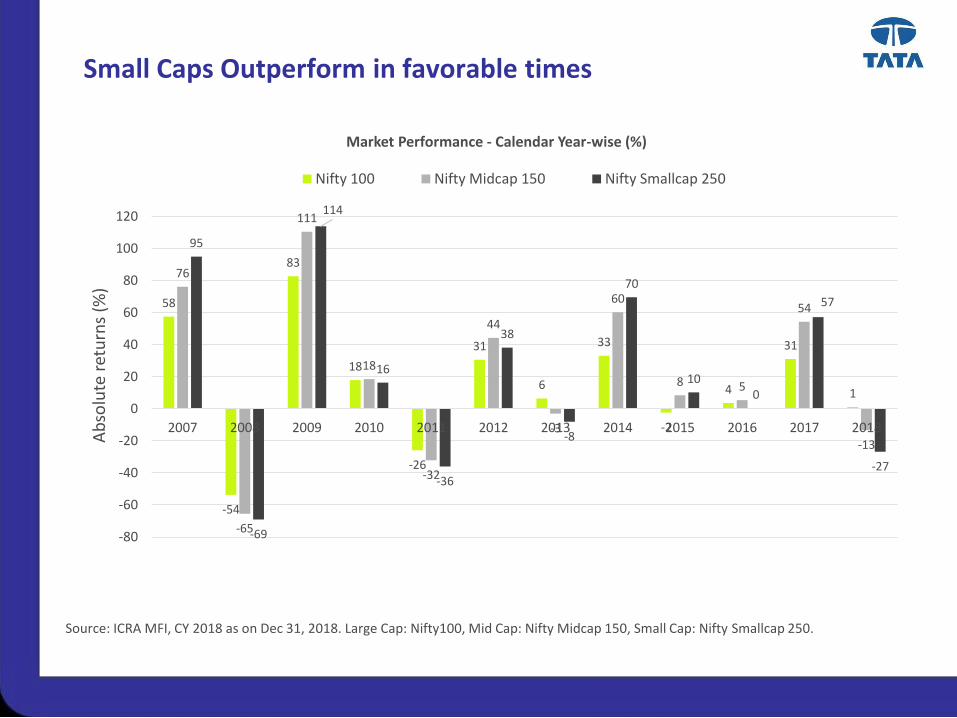
Small Caps Outperform in favorable times
58
-54
83
18
-26
31
6
33
-2
4
31
1
76
-65
111
18
-32
44
-3
60
8 5
54
-13
95
-69
114
16
-36
38
-8
70
100
57
-27
-80
-60
-40
-20
0
20
40
60
80
100
120
2007 2008 2009 2010 2011 2012 2013 2014 2015 2016 2017 2018
Ab
solu
te r
etu
rns
(%)
Market Performance - Calendar Year-wise (%)
Nifty 100 Nifty Midcap 150 Nifty Smallcap 250
Source: ICRA MFI, CY 2018 as on Dec 31, 2018. Large Cap: Nifty100, Mid Cap: Nifty Midcap 150, Small Cap: Nifty Smallcap 250.
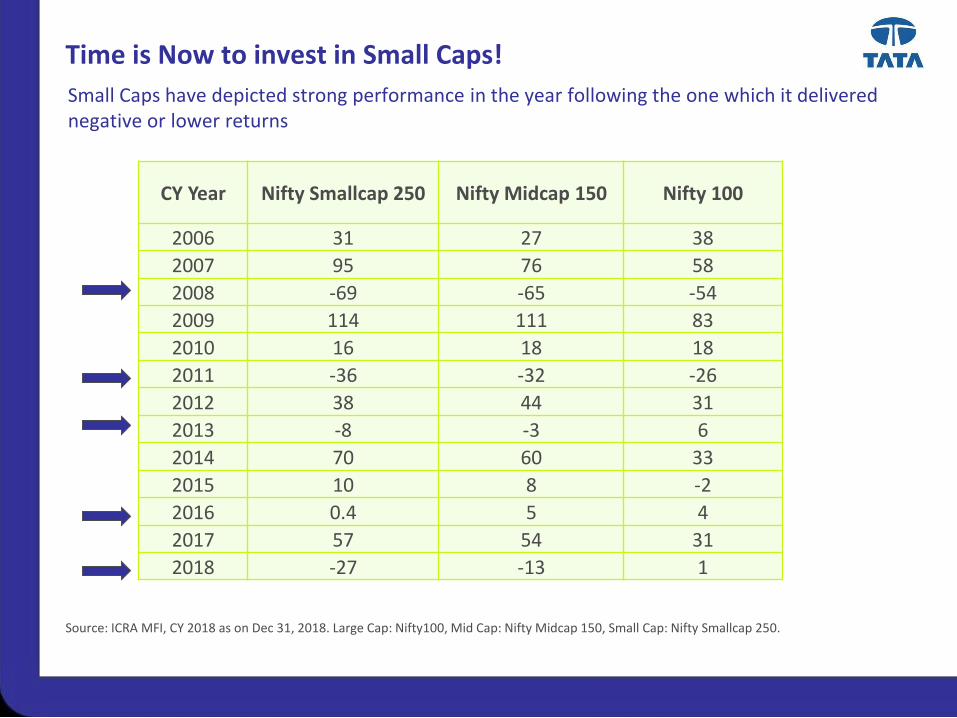
Time is Now to invest in Small Caps!
Source: ICRA MFI, CY 2018 as on Dec 31, 2018. Large Cap: Nifty100, Mid Cap: Nifty Midcap 150, Small Cap: Nifty Smallcap 250.
CY Year Nifty Smallcap 250 Nifty Midcap 150 Nifty 100
2006 31 27 38
2007 95 76 58
2008 -69 -65 -54
2009 114 111 83
2010 16 18 18
2011 -36 -32 -26
2012 38 44 31
2013 -8 -3 6
2014 70 60 33
2015 10 8 -2
2016 0.4 5 4
2017 57 54 31
2018 -27 -13 1
Small Caps have depicted strong performance in the year following the one which it delivered negative or lower returns
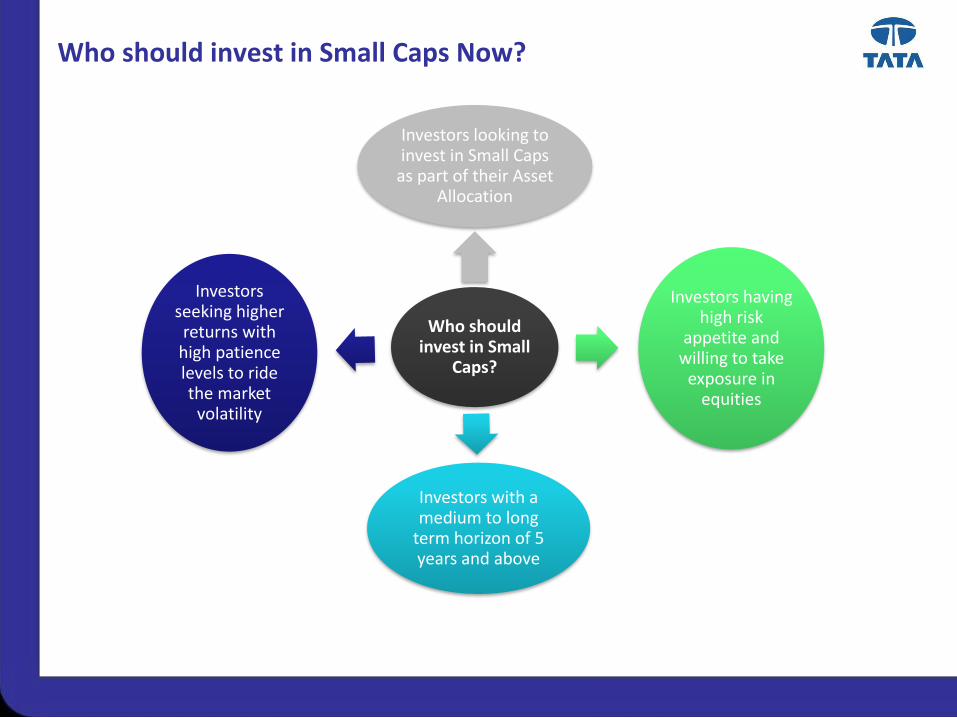
Who should invest in Small Caps Now?
Who should invest in Small
Caps?
Investors looking to invest in Small Caps
as part of their Asset Allocation
Investors having high risk
appetite and willing to take
exposure in equities
Investors with a medium to long
term horizon of 5 years and above
Investors seeking higher returns with
high patience levels to ride the market
volatility
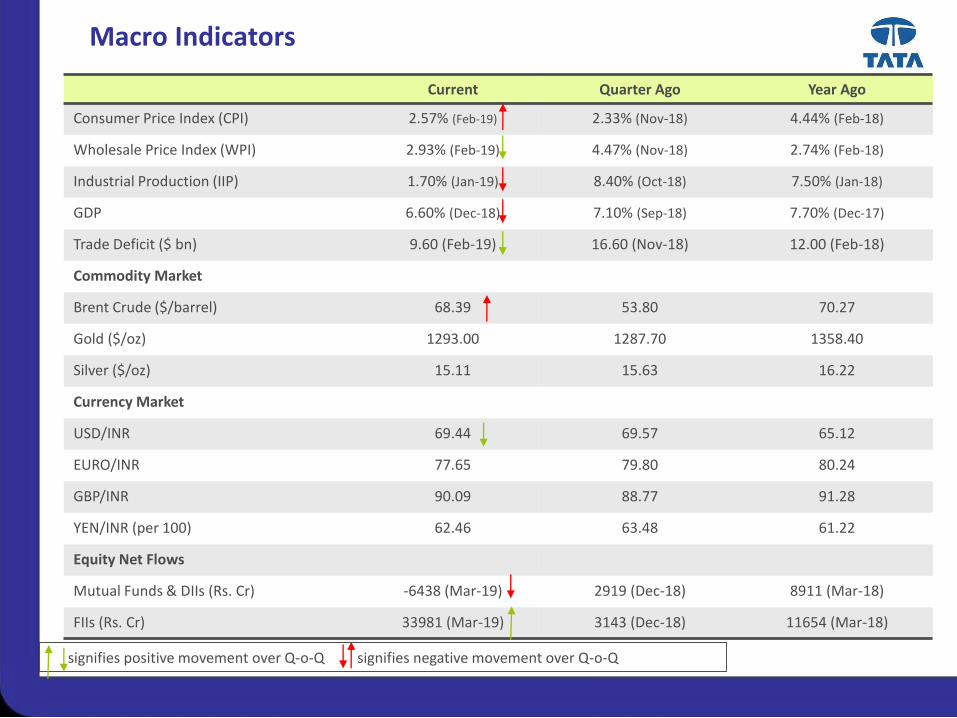
Macro Indicators
Current Quarter Ago Year Ago
Consumer Price Index (CPI) 2.57% (Feb-19) 2.33% (Nov-18) 4.44% (Feb-18)
Wholesale Price Index (WPI) 2.93% (Feb-19) 4.47% (Nov-18) 2.74% (Feb-18)
Industrial Production (IIP) 1.70% (Jan-19) 8.40% (Oct-18) 7.50% (Jan-18)
GDP 6.60% (Dec-18) 7.10% (Sep-18) 7.70% (Dec-17)
Trade Deficit ($ bn) 9.60 (Feb-19) 16.60 (Nov-18) 12.00 (Feb-18)
Commodity Market
Brent Crude ($/barrel) 68.39 53.80 70.27
Gold ($/oz) 1293.00 1287.70 1358.40
Silver ($/oz) 15.11 15.63 16.22
Currency Market
USD/INR 69.44 69.57 65.12
EURO/INR 77.65 79.80 80.24
GBP/INR 90.09 88.77 91.28
YEN/INR (per 100) 62.46 63.48 61.22
Equity Net Flows
Mutual Funds & DIIs (Rs. Cr) -6438 (Mar-19) 2919 (Dec-18) 8911 (Mar-18)
FIIs (Rs. Cr) 33981 (Mar-19) 3143 (Dec-18) 11654 (Mar-18)
signifies positive movement over Q-o-Q signifies negative movement over Q-o-Q

Debt Markets - Review
Debt Market Roundup - Key Takeaways
• Factors which affected Bond Markets: Expectations of an interest rate reduction, decline inUS Treasury yields and the central bank conducted open market bond purchase auctionsduring the month; helped bond yields.
• Moreover, Government Bond yields fell further after the U.S. Federal Reserve in themonetary policy review kept interest rates on hold and indicated that interest rates arelikely to remain unchanged for the remainder of the year. This boosted market sentimentand eased concerns over foreign fund outflow from the Indian economy.
• Additionally, RBI introduced a liquidity infusion measure announcing its intent to conduct a$5bn as part of the long term Dollar/Rupee swap auction with a three year tenor. Throughthis, Rs. 34,561 crore was infused into the Indian banking system.
• Monetary Policy: The RBI decided to cut rates further by 25 bps, but has continued tomaintain its stance at neutral. The central bank also revised the inflation and the GDPforecast downwards.
• Performance of 10-year G-Sec Yield: Yield on the new 10-year benchmark paper (7.26% GS2029) fell 10 bps to close at 7.29% from the previous month’s close of 7.39%.
• Outlook: In the near term, markets are likely to remain watchful of global events anddomestic fiscal stress. The overall growth in the economy and systematic liquidity will be insharp focus as these factors may influence the stance that MPC adopts in its monetarypolicy going ahead. On the macro front, oil and rupee movement will be closely tracked.

Debt Roundup 31 Mar’19 28 Feb’19 31 Mar’18 M-o-M Change
Interest Rates Repo rate 6.25% 6.25% 6.00% 0 bpsSLR 19.25% 19.25% 19.50% 0 bpsCD Rates
3 month 6.90% 7.22% 6.75% -32 bps6 month 7.00% 7.52% 7.00% -52 bps1 Year 7.30% 7.70% 7.10% -40 bps
CP Rates
3 month 7.40% 7.70% 7.10% -30 bps6 month 7.70% 8.30% 7.40% -60 bps1 Year 7.85% 8.45% 7.50% -60 bpsT-Bill/G-sec 91 Days 6.14% 6.40% 6.14% -26 bps364 Days 6.31% 6.51% 6.39% -20 bps7.26% GOI 2029 (10 Yr GOI) -New 7.29% 7.39% - -10 bps7.17% GOI 2028 (10 Yr GOI) - Old 7.43% 7.57% 7.33% -14 bpsCorporate Bonds (PSU)
3 Year 7.40% 8.02% 7.53% -62 bps5 Year 7.55% 8.18% 7.73% -63 bps10 Year 8.15% 8.51% 7.87% -36 bpsInternational Markets 10 Year US Treasury Yield 2.44% 2.72% 2.76% -28 bps3 Months LIBOR 2.60% 2.63% 2.31% -3 bps12 Months LIBOR 2.71% 2.87% 2.66% -16 bps
Key Highlights of First Bi-monthly Monetary Policy Statement, 2019-20
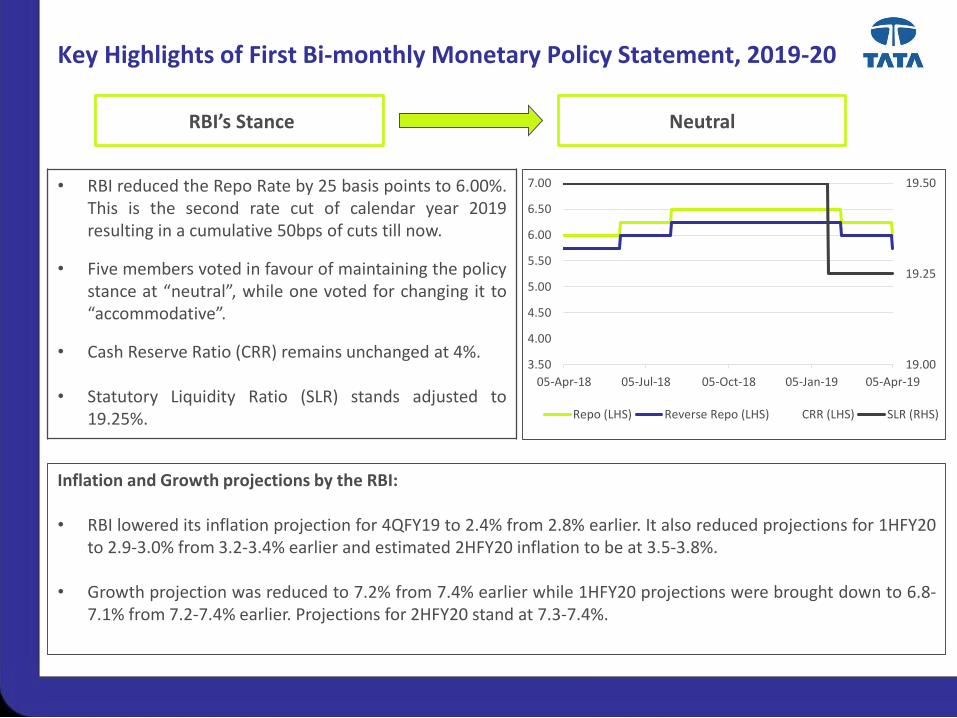
• RBI reduced the Repo Rate by 25 basis points to 6.00%.This is the second rate cut of calendar year 2019resulting in a cumulative 50bps of cuts till now.
• Five members voted in favour of maintaining the policystance at “neutral”, while one voted for changing it to“accommodative”.
• Cash Reserve Ratio (CRR) remains unchanged at 4%.
• Statutory Liquidity Ratio (SLR) stands adjusted to19.25%.
RBI’s Stance Neutral
19.00
19.25
19.50
3.50
4.00
4.50
5.00
5.50
6.00
6.50
7.00
05-Apr-18 05-Jul-18 05-Oct-18 05-Jan-19 05-Apr-19
Repo (LHS) Reverse Repo (LHS) CRR (LHS) SLR (RHS)
Inflation and Growth projections by the RBI:
• RBI lowered its inflation projection for 4QFY19 to 2.4% from 2.8% earlier. It also reduced projections for 1HFY20to 2.9-3.0% from 3.2-3.4% earlier and estimated 2HFY20 inflation to be at 3.5-3.8%.
• Growth projection was reduced to 7.2% from 7.4% earlier while 1HFY20 projections were brought down to 6.8-7.1% from 7.2-7.4% earlier. Projections for 2HFY20 stand at 7.3-7.4%.
Yields Movement Across - India and US
For internal circulation only
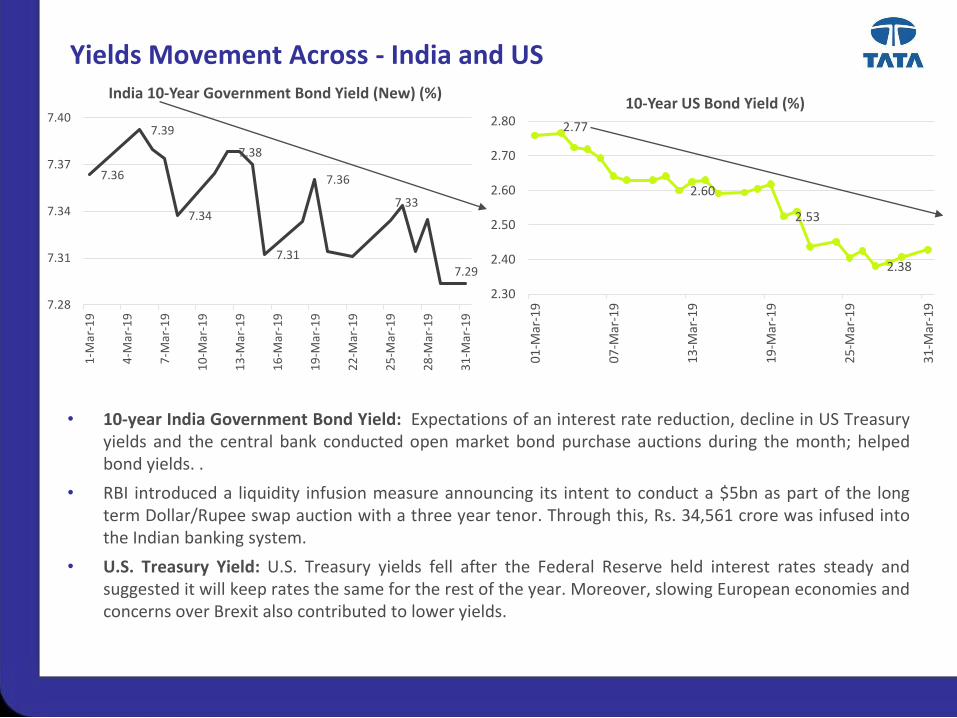
• 10-year India Government Bond Yield: Expectations of an interest rate reduction, decline in US Treasuryyields and the central bank conducted open market bond purchase auctions during the month; helpedbond yields. .
• RBI introduced a liquidity infusion measure announcing its intent to conduct a $5bn as part of the longterm Dollar/Rupee swap auction with a three year tenor. Through this, Rs. 34,561 crore was infused intothe Indian banking system.
• U.S. Treasury Yield: U.S. Treasury yields fell after the Federal Reserve held interest rates steady andsuggested it will keep rates the same for the rest of the year. Moreover, slowing European economies andconcerns over Brexit also contributed to lower yields.
2.77
2.60
2.53
2.38
2.30
2.40
2.50
2.60
2.70
2.80
01-M
ar-1
9
07-M
ar-1
9
13-M
ar-1
9
19-M
ar-1
9
25-M
ar-1
9
31-M
ar-1
9
10-Year US Bond Yield (%)
7.36
7.39
7.34
7.38
7.31
7.36
7.33
7.29
7.28
7.31
7.34
7.37
7.40
1-M
ar-1
9
4-M
ar-1
9
7-M
ar-1
9
10
-Mar
-19
13
-Mar
-19
16
-Mar
-19
19
-Mar
-19
22
-Mar
-19
25
-Mar
-19
28
-Mar
-19
31
-Mar
-19
India 10-Year Government Bond Yield (New) (%)
INR Performance
For internal circulation only
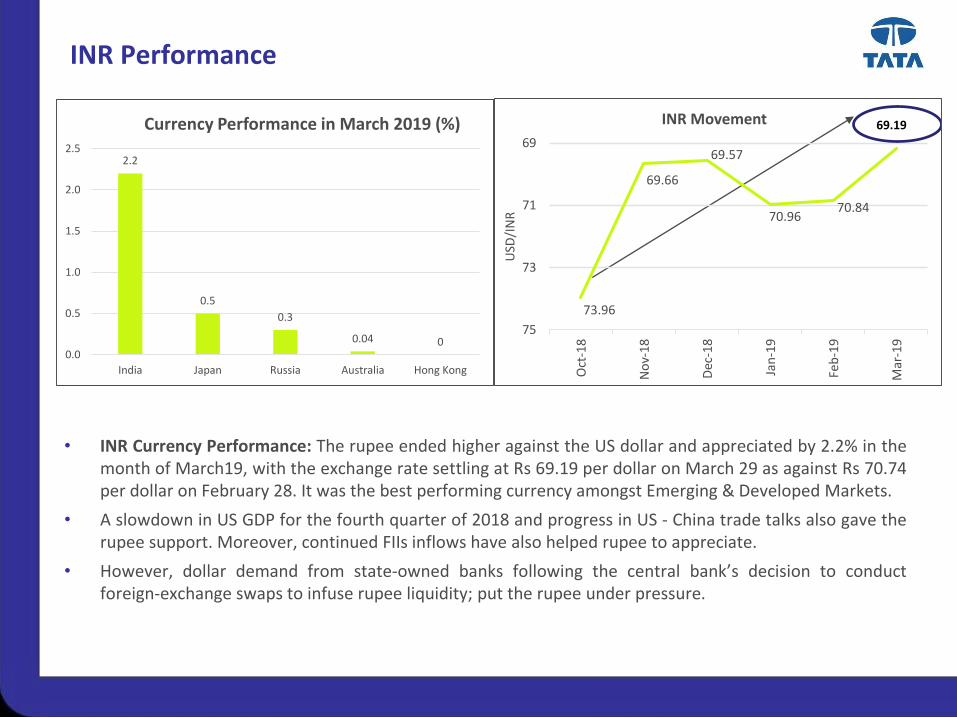
• INR Currency Performance: The rupee ended higher against the US dollar and appreciated by 2.2% in themonth of March19, with the exchange rate settling at Rs 69.19 per dollar on March 29 as against Rs 70.74per dollar on February 28. It was the best performing currency amongst Emerging & Developed Markets.
• A slowdown in US GDP for the fourth quarter of 2018 and progress in US - China trade talks also gave therupee support. Moreover, continued FIIs inflows have also helped rupee to appreciate.
• However, dollar demand from state-owned banks following the central bank’s decision to conductforeign-exchange swaps to infuse rupee liquidity; put the rupee under pressure.
73.96
69.66
69.57
70.9670.84
69
71
73
75
Oct
-18
No
v-1
8
Dec
-18
Jan
-19
Feb
-19
Mar
-19
USD
/IN
R
INR Movement 69.19
2.2
0.5
0.3
0.04 00.0
0.5
1.0
1.5
2.0
2.5
India Japan Russia Australia Hong Kong
Currency Performance in March 2019 (%)

DISCLAIMER
This report is for the personal information of the authorized recipient and does not construe to be any investment, legal or taxation advice to you. TATA Capital Financial Services
Limited (‘TCFSL’) is not soliciting any action based upon it. Nothing in this research report shall be construed as a solicitation to buy or sell any security or product, or to engage in or
refrain from engaging in any such transaction. It does not constitute a personal recommendation or take into account the particular investment objectives, financial situations, or needs
of the reader.
This research report has been prepared for the general use of the clients of the TCFSL and must not be copied, either in whole or in part, or distributed or redistributed to any other
person in any form. If you are not the intended recipient you must not use or disclose the information in this research report in any way. Though disseminated to all the customers
simultaneously, not all customers may receive this report at the same time. TCFSL will not treat recipients as customers by virtue of their receiving this report. Neither this document
nor any copy of it may be taken or transmitted into the United States (to US Persons), Canada or Japan or distributed, directly or indirectly, in the United States or Canada or
distributed, or redistributed in Japan to any residents thereof. The distribution of this document in other jurisdictions may be restricted by the law applicable in the relevant jurisdictions
and persons into whose possession this document comes should inform themselves about, and observe any such restrictions.
It is confirmed that, the author of this report has not received any compensation from the companies mentioned in the report in the preceding 12 months. No part of the compensation
of the analyst(s) was, is, or will be directly or indirectly related to the inclusion of specific recommendations or views in this research. The analyst(s), principally responsible for the
preparation of this research report, receives compensation based on overall revenues of TCFSL and TCFSL has taken reasonable care to achieve and maintain independence and
objectivity in making any recommendations.
Neither TCFSL nor its directors, employees, agents, representatives shall be liable for any damages whether direct or indirect, incidental, special or consequential including lost
revenue or lost profits that may arise from or in connection with the use of the information contained in this report.
The report is based upon information obtained from sources believed to be reliable, but TCFSL does not make any representation or warranty that it is accurate, complete or up to
date and it should not be relied upon as such. It does not have any obligation to correct or update the information or opinions in it. TCFSL or any of its affiliates or employees shall not
be in any way responsible for any loss or damage that may arise to any person from any inadvertent error in the information contained in this report. TCFSL or any of its affiliates or
employees do not provide, at any time, any express or implied warranty of any kind, regarding any matter pertaining to this report, including without limitation the implied warranties of
merchantability, fitness for a particular purpose, and non-infringement. The recipients of this report should rely on their own investigations. This information is subject to change without
any prior notice. TCFSL reserves at its absolute discretion the right to make or refrain from making modifications and alterations to this statement from time to time. Nevertheless,
TCFSL is committed to providing independent and transparent recommendations to its clients, and would be happy to provide information in response to specific client queries.
Certain transactions -including those involving futures, options and other derivatives as well as non-investment grade securities - involve substantial risk and are not suitable for all
investors. Reports based on technical analysis centers on studying charts of a stock’s price movement and trading volume, as opposed to focusing on a company’s fundamentals and
as such, may not match with a report on a company’s fundamentals.
Before making an investment decision on the basis of this research, the reader needs to consider, with or without the assistance of an adviser, whether the advice is appropriate in
light of their particular investment needs, objectives and financial circumstances. There are risks involved in securities trading. The price of securities can and does fluctuate, and an
individual security may even become valueless. International investors are reminded of the additional risks inherent in international investments, such as currency fluctuations and
international stock market or economic conditions, which may adversely affect the value of the investment. Neither TCFSL nor the director or the employee of TCFSL accepts any
liability whatsoever for any direct, indirect, consequential or other loss arising from any use of this research report and/or further communication in relation to this research report.
We and our affiliates, officers, directors, and employees worldwide may: (a) from time to time, have long or short positions in, and buy or sell the securities thereof, of company (ies)
mentioned herein or (b) be engaged in any other transaction involving such securities and earn brokerage or other compensation or act as a market maker in the financial instruments
of the company (ies) discussed herein or act as advisor or lender / borrower to such company (ies) or have other potential conflict of interest with respect to any recommendation and
related information and opinions.
Investments in securities are subject to market risk; please read the SEBI prescribed Combined Risk Disclosure Document prior to investing. Derivatives are a sophisticated
investment device. The investor is requested to take into consideration all the risk factors before actually trading in derivative contracts. Our research should not be considered as an
advertisement or advice, professional or otherwise

General Disclosure
Tata Capital Financial Services Limited (“TCFSL”) is registered with the Reserve Bank of India as a Non Deposit Accepting Systemically Important Non-Banking Finance Company
(“NBFC-ND-SI”).
TCFSL is also registered with The Securities and Exchange Board of India (“SEBI”) as an Investment Adviser bearing Registration no. INA000002215. As part of this offering, TCFSL
advises on various products and services to its clients based on independent objective criteria and sound principles of financial planning based on customer’s financial goals. TCFSL
may advise clients on debt securities but does not enter into principal to principal transactions with its advisory clients for such debt securities. No material disciplinary action has been
taken on TCFSL by any Regulatory Authority pertaining to Investment Advisory activities.
TCFSL is also registered with The Insurance Regulatory and Development Authority (“IRDA”) as a Corporate Agent (Composite) with Registration No: CA0076.
TCFSL is also engaged in Mutual Fund Distribution business and is registered with The Association of Mutual Funds in India (“AMFI”) bearing ARN No. 84894. Please note that all
Mutual Fund Investments are subject to market risks, read all scheme related documents carefully before investing for full understanding and details.
TCFSL distributes:
(a) Mutual Fund Schemes of TATA Mutual Fund
(b) Life Insurance Policies of Tata AIA Life Insurance Company Limited
(c) General Insurance Policies of TATA AIG General Insurance Company Limited
TCFSL receives commission ranging from 0.00% to 2.00% p.a. from the Asset Management Companies (“AMC”) towards investments in mutual funds made through TCFSL. TCFSL
receives commission ranging from 0.00% to 40.00% as First year commission and renewal commission ranging from 0.00% to 5.00% on Life Insurance Policies bought through
TCFSL. TCFSL receives commission ranging from 0.00% to 25.00% on General Insurance Policies bought through TCFSL. TCFSL receives commission ranging from 0.00% to 2.00%
on Corporate Fixed deposit made through TCFSL.
Please note that the above commission may change from time to time and are exclusive of statutory levies like GST, Security Transaction tax, Stamp Duty, Exchange transaction
charges, SEBI turnover fee etc. TCFSL does not recommend any transaction which is required to be dealt with on a Principal to Principal basis.
Please note that any communication given by TCFSL is purely in an advisory capacity and such an advice does not place any obligation/ compulsion on you to purchase or invest in
the products/ schemes mentioned in any financial plan, offer document/scheme information documents etc. circulated through TCFSL or its representatives/ personnel. You agree and
confirm that any investment made by you will be at your sole discretion and that you have undertaken the required due diligence/ research before investing in any of the products/
schemes and that TCFSL and/or its affiliates/ parent company shall not be liable or responsible for the same. TCFSL is an authorized composite corporate agent and does not
underwrite the risk or act as an insurer. The contents herein above shall not be considered as an invitation or persuasion to invest. Insurance is the subject matter of the solicitation.
Wealth Management is a service offering of TCFSL and is offered at its sole discretion.
Registered office:
11th Floor, Tower A, Peninsula Business Park, Ganpatrao Kadam Marg, Lower Parel, Mumbai 400 013.