Embed Size (px)
Citation preview
Market Liquidity, Private Information, and the Cost of Capital:
Microstructure Studies on Family Firms in Japan*
Takashi Ebihara
Faculty of Economics, Musashi University
Keiichi Kubota
Graduate School of Strategic Management, Chuo University
Hitoshi Takehara
Graduate School of Finance, Accounting, and Law, Waseda University
Eri Yokota
Faculty of Business and Commerce, Keio University
October 21, 2012
JEL Classifications: G14, G32, G12, M21 Keywords: information asymmetry, market liquidity, family management, cost of equity, cost of debt *) This paper was presented at the 2012 World Finance Conference held in Rio de Janeiro, the 2012 Nippon Finance Association Annual Meeting in Tokyo, the 1st Workshop on Finance and Accounting Research in the Asia Pacific Region in Nagoya, and the International Conference on Business Groups and Family Business: India, Japan, and Thailand in Delhi. The authors thank Takato Hiraki, Rosy Locorotondo, Vikas Mehrotra, Wataru Ota, Krishnamurthy Subramanian, and Yupana Wiwattanakantang for useful comments and suggestions. The authors also thank Yasuhiro Arikawa, Shigeu Asaba, Tai-Yuan Chen, Joseph Fan, Zhaoyang Gu, Roger King, Matao Miyamoto, David Reeb, Carlo Salvato, Jay Shanken, and Jun Uno for helpful discussion. The authors acknowledge financial support from the Grant-in-Aid for Scientific Research ((A) 21243029) from the Ministry of Education, Culture, Sports, Science and Technology of Japan. All remaining errors are our own.
1
Market Liquidity, Private Information, and the Cost of Capital:
Microstructure Studies on Family Firms in Japan
Abstract
We investigate market liquidity, distribution of private information-based trades, and the
cost of capital of publicly traded family firms in Japan. First, we find that Japanese family
firms have a lower cost of debt, lower market liquidity, and higher information asymmetry.
We did not find any difference in the cost of equity, however, although it is slightly higher
for family firms. Accordingly, the WACC of family firms is higher than that for
non-family firms although it is significant only for the conventional t-test. As for
estimation of information asymmetry and illiquidity, we use the private information flow
(Adjusted PIN) and the symmetric order inflow shock (PSOS). In addition, we estimate
several conventional measures of market liquidity and illiquidity as used in microstructure
studies. We find that the PSOS is a good measure of market illiquidity for our sample of
family firms and control non-family firms. In conclusion, we claim that more voluntary
disclosure is called for among Japanese family firms; first, to decrease the cost of equity,
and second, to increase market liquidity of traded stocks as well as reduce the probability
of private information-based trades. This is the first study to use asymmetric information
related variables in family business research, which is a new contribution to the literature.
2
1. Introduction
In the past, family business research focused on ownership structure and productive
efficiency of founding families, as well as the efficacy of second and later generation CEOs.
Empirical evidence on family businesses is abundant for U.S. firms as well as European
and East Asian countries. Claessens et al. (2000) investigated the ownership and control
structure of East Asian countries, and La Porta, et al. (1999) conducted similar tests for 27
developed nations. The evidence for efficiency of family-controlled businesses in the U.S.
is found by Anderson and Reeb (2003) and Villalonga and Amit (2006), and for Japanese
firms by Saito (2008) and Allouche et al. (2008). Mazzi (2011) also extensively surveys
family business literature from the viewpoint of financial performance of family firms.
Masulis et al. (2011) investigates the cost and benefits of the pyramid structure of 45
countries including Japan, and finds that group firms underperform counterpart non-group
firms, although the pyramid structure helps internal financing of affiliate firms inside the
group. From another perspective, Gomez-Mejia and Nunez-Nickel (2001) investigate the
efficacy of the CEO and the editor, for a sample of both family and non-family firms, of
Spanish newspaper companies. They find that the tenure of descendent CEOs is tied to firm
performance and risk-taking within the framework of agency theory, and demonstrate that
family descendent CEOs are not necessarily less efficient.
For investigation into information quality of accounting numbers, Ali et al. (2007) finds
that a sample of U.S. family firms show better quality financial disclosure, are followed by
more analysts, and trade their stocks with smaller bid-ask spreads. Wang (2006) also finds
that earnings quality is better for family than non-family firms. For Japanese data, Ebihara
3
et al. (2012) finds that the quality of earnings is higher for family firms in terms of
abnormal accruals and earnings persistence.
In this paper we investigate liquidity and the degree of information asymmetry of stocks
in family versus non-family firms listed on the Tokyo Stock Exchange, as well as measure
the cost of capital in the two types of firms to resolve the difference. Note that O’Hara
(2003) argues that the cost of capital will be higher when there is more information
asymmetry in capital markets and less liquidity among traded stocks and this is also why
we investigate the differences in the cost of capital. On the other hand, McConaughy
(1999, pp. 356-357) argues that cost of equity can be lower for family firms due to the
“family effect,” which means that their investment is generally more patient and better-run
with less risk. Accordingly, one of the main objectives of this study is to investigate
whether there is more information asymmetry and lower liquidity among traded stocks of
family firms in Japan at the same time as exploring source of differences in cost of equity,
cost of debt, and WACC.
The foregoing observations lead us to raise our core research questions on the degree of
information asymmetry and liquidity of family firms in Japan, and we investigate these
with the help of a Poisson arrival microstructure model of information as well as the use of
several alternative liquidity measures. Simultaneously, we investigate cost of equity, debt,
and WACC, and associate our findings from microstructure studies with conventional cost
of capital measures.
Section 2 motivates our study and explains the research method we employ. Section 3
establishes the maintained hypotheses. Section 4 explains the estimation method and
4
Section 5 explains our data. Section 6 reports basic characteristics of family businesses in
Japan, market liquidity, information asymmetry of stocks and the estimated cost of capital.
Section 7 reports regression results and identifies the source of differences in the cost of
capital and information asymmetry between family and non-family firms. Section 8
concludes.
2. Motivation and Research Methods
2.1 Family Firms Research and Information Asymmetry
Although there are abundant previous studies investigating cost of equity and debt for
family firms (McConaughty, 1999 and Anderson et al. 2003, among others), the results vary
and are not conclusive. In this paper, we look at the source of the difference in the cost of
capital from the viewpoint of information asymmetry. For that purpose, we employ the
measures developed by Duarte and Young (2009). As far as the authors are aware, only in
Anderson et al. (2009) has an investigation been conducted by utilizing microstructure
studies in financial economics to investigate information asymmetry for family firms with
Japanese data. They also investigated family firm opacity and found that stocks of
heir-controlled firms have higher bid-ask spreads than founder-controlled family firms or
non-family diffuse shareholder firms. However, they did not use the tick-based PIN
measure which we use in this study. Furthermore, Anderson et al. (2012) report that
stocks of family-controlled firms experience higher abnormal short sales, suggesting the
existence of more informed trades. For U.S. firms, this implies there may be more private
information-based trades among family firms.
5
A priori, we expect that there will be higher concentrations of stock held by family
firms which would result in a lower proportion of floating stocks traded. However, how this
affects liquidity and/or information asymmetry of family firm stocks is an empirical
question to be quantitatively measured. For that, we utilize theoretical constructs developed
in the microstructure field of financial economics, in particular, the Adjusted PIN and the
PSOS by Duarte and Young (2009).
Moreover, if we find that family firms stocks are traded with higher information
asymmetry and less liquidity, it will imply a higher cost of equity as Easley and O’Hara
(2004) demonstrated for U.S. data. On the other hand, if we observe that stocks of family
firms are more liquid than non-family firms, and there is less information asymmetry, it will
imply a lower cost of equity. If this is the case, it might be because of a higher level of
voluntary disclosure released by founding family management, whose personal reputation
may be more strongly tied to their company reputation (Bolton and Dewatripont, 2005,
Chapter. 5).
As for cost of debt, note that the larger fraction of debt for Japanese family firms is
bank loans instead of corporate bonds, and it is not a priori clear whether cost of debt is
higher or lower for family firms. It may be lower because the lending banks might have
more confidence in stable management and ownership of family firms, or higher because
lenders might be more concerned with the entrenchment effect caused by founding families
and family or non-family CEOs (Gomez-Mejia and Nunez-Nickel, 2001). The argument
and evidence from U.S. firms is presented by Anderson et al. (2003, p. 267) from the
6
viewpoint of agency cost, claiming that family firms are more concerned with survival and
reputations, and that lenders have more confidence in lending to family firms.
2.2 Family Firms in Japan
Claessens et al. (2000) is the most widely cited article in Asian family business research
which investigated ownership structure among East Asian countries including Japan. They
cover 1240 listed firms in Japan (ibid. p.104) and point out that 13.1% of firms are
controlled by families with a 10% shareholding cutoff level of founding families, and that
only 9.7% of firms are controlled by families with a 20% cutoff level. Their study is also
important in the sense that it illuminates the differences of Japan and Korea relative to other
East Asian countries. In Korea there exists the Chaebol relationship and formerly in Japan
there was the Zaibatsu relationship, both of which form a “Konzern” of firms based on
family relationships. In Japan, however, Zaibatsu was forcefully resolved after World War
II and founding families had to liquidate large portions of their family stocks. Then
Zaibatsu groups formed cross-shareholdings among firms such as Mitsubishi, Mitsui and
Sumitomo. In Korea massive mergers are now occurring among Chaebol firms, and
separate studies of these consolidation effects are needed.1
The database by Claessens et al. (2000) for Japan is based on data from 1996, and it
needs to be updated for the following reasons. First, big changes in ownership structure for
Japanese stocks occurred in the past 15 years and a larger fraction of stocks listed on the
1 L&G is one example of such a consolidation between two different Chaebol groups. See Almeida et al. (2010) for the most recent analyses on Chaebol groups in Korea. They also emphasize the role of cross-shareholdings like in Japan. See Yafeh (2000) for recent changes in corporate governance in Japan after the degree of cross-shareholdings decreased.
7
exchange are currently owned by fund trusts, pension funds, mutual funds and foreign
individual and institutional investors. Second, cross-shareholdings among Japanese firms
have decreased substantially in recent years (Eoyang, 1998). Thus we infer that both the
weight of shareholdings by founding families and the fraction of floating stocks are smaller,
which we attempt to quantify in the current study.
A priori we classify Japanese family firms into three types. The first is small business
that has survived for over 200 years. The majority of these firms is private and is not
publicly traded, such as Toraya, a 16th century pastry producer from Kyoto, as well as many
independent hotels, restaurants, and craft makers. These are not included in our sample.
The second are those in heavy industries, transportation, transportation equipment, or
electric appliances. Most of these firms were started before World War II and Tobu
Railroad, Toyota, and Nakayama Steel are examples. The third are firms in newer high tech
industries, where founding families are still running them (entrepreneurship stage), or are
retired and the second generation is in charge, either a family member or an outsider
(descendent stage). Square-Enix, Omron, and Kyocera are examples. Among these
three types, the latter two are larger firms and most are listed, which is the sample we use
for the current study.
In previous research on Japanese family businesses, Asaba (2012) investigated
investment behavior of the electric machinery industry from 1995-2006 and found that his
sample of 184 family firms demonstrated a more aggressive and enduring investment than
non-family firms. Saito (2008) found that family firms slightly out-performed non-family
firms between 1990 and 1998, and superiority was limited to the founders’ reign. Allouche
8
et al. (2008) found that financial performance of family firms in Japan from 1998-2003, as
measured by accounting ratios, was better than non-family firms. Finally, Mehrotra et al.
(2011) investigated the succession problem of Japanese family businesses and
demonstrated that adopted heirs could avoid the succession problem. They studied firms
between 1949 and 1970 and followed the observation up to 2000.
The current paper adopts a different angle in order to investigate family businesses in
Japan and focuses on liquidity and information asymmetry with the use of measurement
from microstructure studies as well as cost of debt and equity. If we can find any
difference in these variables between family and non-family firms, in particular,
microstructure variables, this evidence would be the first in family business research.
2.3 The Cost of Capital
To estimate cost of equity in this study we use the Fama and French three factor model
(2003). This model is composed of the following factors; value-weight excess market
returns, the size factor spread portfolio (SML), and the book-to-price ratio factor spread
portfolio (HML). The model is denoted as follows: )( mRE is the expected return of
market, )( SMBRE is the expected return of the “small minus big” factor portfolio,
)( HMLRE is the “high book-to-price ratio minus the low book-to-price ratio” factor
portfolio, and fR is the risk-free interest rate. Each beta coefficient in (1) is the
corresponding factor loading for each stock or portfolio.
)()())(()( 321 HMLiSMBifmifi RERERRERRE (1)
9
The reason we use this model to measure cost of equity is because the Fama and French
model better fits Japanese data than the one-factor CAPM (Jagannathan et al., 1998).
For the cost of debt, we use the average past five years of interest paid to total interest
bearing debt. Although Anderson et al. (2003) use the yield-to-bond for U.S. data, the
corporate bond market in Japan is basically an over-the-counter market and a price quote
will be different between investment banks which give offers even if quotes are available.
Also, Kubota and Takehara (2007) use this measure of cost of debt to estimate WACC for
Japanese data.
The estimates for WACC of firms are computed in a standard fashion as the weighted
sum of cost of equity and after-tax cost of debt. We use actual tax rates during the fiscal
year, computed as the ratio of net income after-tax to net income before-tax. The
weightings for cost of equity and cost of debt multiplied by 1 minus effective tax rate are
conducted by the market value of equity and the book value of all interest-bearing debt.
2.4 Measures of Information Asymmetry and Symmetric Order Flow
In her review article, O’Hara (2003) emphasized the importance of exploring the price
discovery process before investigating the equilibrium price of assets in asset pricing theory.
Studies by Easley et al. (1996, 2002) are examples which explored this price discovery
process using tick-by-tick U.S. data. They estimated the so-called “PIN” variable, which is
a variable related to the probability of information-based trades among all trades, based on
the Poisson process of private information arrival. For example, Duarte et al. (2008), utilize
this PIN variable to assess the impact of Regulation Fair Disclosure for U.S. firms. They
10
use the PIN variable as a proxy to measure the degree of information asymmetry and find
that Regulation Fair Disclosure affects the cost of capital using the PIN along with other
control variables. In Duarte et al. (2008) the estimated PIN and other variables are used as
independent variables to predict changes in the cost of capital of firms after Regulation FD
was introduced in 2000. Their main finding was that NASDAQ firms were more strongly
affected and costs of capital for these firms increased, suggesting that smaller firms bear
more increased costs due to the new disclosure rule. Kubota and Takehara (2009) estimated
PIN values for Tokyo Stock Exchange firms and reported that parameter values for Japan
were comparable to U.S. ones originally estimated by Easley et al. (2002).
In Easley’s original model there are three types of market participants: market makers,
informed traders, and uninformed traders. Other markets in the rest of the world, however,
are usually not equipped with market makers, and an electronically-driven order market
system is the dominant form of trading. Based on comparable parameter estimates derived
from Tokyo Stock Exchange firms by Kubota and Takehara (2009) and Paris Bourse firms
by Aktas et al. (2003), we directly apply the PIN and Adjusted PIN estimation methods to
the electronically-driven order market of the TSE and investigate the relative weight of
private and public information trades.2
Based on the original model by Easley et al. (2002), Duarte and Young (2009) further
extend the original PIN model to disentangle measures of private information-based trades,
2 We thank Maureen O’Hara for discussing this point. Kubota and Takehara (2009, p. 321) discuss why limit orders can play the role of market makers for Tokyo Stock Exchange data. When Foucault (1999) analyzes the nature of dynamic limit order markets, he refers to the Tokyo Stock Exchange as a representative market of this kind. Moreover, Back and Baruch (2004) prove the equivalence of the floor market and the market with market makers under suitable regularity conditions.
11
which they call Adjusted PIN, and the unconditional probability of trade occurrences
arising from symmetric order flow shocks, which hit both buy and sell orders at the same
time. These are two measures we use for our study. They call this latter variable PSOS, the
probability of symmetric order flow shocks. According to Duarte and Young (2009, p. 126)
this measure comes about from “occurrence of a public news event about whose
implications traders disagree,” and/or “that traders simply coordinate on certain days to
reduce trading costs.” In our investigation of family firms in Japan, we use Duarte and
Young’s version of the PIN, the so-called Adjusted PIN and the PSOS, and test our
hypotheses. We employ this version of the information asymmetry variable because Kubota
et al. (2012) found that the Duarte and Young version of the PIN model can well describe
the behavior of recent Japanese stock return data.
In the original model by Easley et al. (2002) there are two types of risk-neutral traders in
the market: informed and uninformed traders. First, nature chooses once each day whether
there is a new private information event with probability a , or not, with probability )1( a .
The orders arrive according to the Poisson process and uninformed traders send orders with
a buying order rate of b and a selling order rate of s . The probability of being a good
signal is denoted as d and the probability of being a negative signal is 1-d. While the
extra order arrival rate by the informed trader is the same for both good and bad signals,
Duarte and Young (2009) extend this stochastic process, where the buy rate is denoted as
bu and the sell rate su . They further introduce the parameter θ which is a probability of a
symmetric order flow shock event occurring. The extra order rate based on the occurrences
12
of this symmetric order flow shock is b or s dependent on whether it is a good or bad
signal.
Assuming each day’s independent drawing is from the Poisson process and thus the
likelihood function is represented by the product of each day’s likelihood function, we can
numerically maximize this function using daily observations of the number of buyer and
seller-initiated transactions. Based on these parameter estimates, the Adjusted PIN and
PSOS variables are derived from Bayes’s rule, as follows:
sbsbsb
sb
dd
ddPINAdjusted
)())1((
))1((( (2)
sbsbsb
sb
ddPSOS
)())1((
)( (3)
Both variables represent the ex post probability that trades are triggered by private
information among all tick-by-tick trades for (2) and that trades are triggered by symmetric
order flow shocks for (3). In (2), the numerator denotes the joint probability of orders
composed of information-based order arrival rate times the occurrence of the information
event and the denominator is the total joint probability of trades. Similarly in (3), the
numerator denotes the joint probability of orders composed of those orders triggered by
symmetric order flow shocks and the denominator is the total joint probability of trades.
3. Hypotheses

13
Family firms are generally expected to have a management team congruent with the
family norm, whether the CEO is from the family or not. Thus, we expect that inside the
firm the management team possesses stronger real authority by the definition of Aghion and
Tirole (1997). Family firms may also suffer less from agency cost problems that arise
between managers and share owners (Jensen and Meckling, 1976) either because a large
fraction of shares are owned by founding families, or the CEO has real authority emanating
from the family owner. Thus these elements will lead to higher firm efficiency with less
agency cost.
As for the quality of disclosure, when the reputation of a company is strongly tied to the
reputation of the family, management may be strongly motivated to disclose that their
company is indeed a good one. On the other hand, when blocks of stock are owned by
family members but ownership is not large enough to have family reputation strongly tied
to a higher stock price, they may be less motivated to voluntary disclose the state of the
firm to minority shareholders, and will only stick to the minimum level of disclosure.
Then there will be more information asymmetry in stock trading.
Our primary research interests are the effect of family ownership structure and the role
played by family members in financial management decisions; that is, the operating and
financial risk of the firm as revealed in cost of capital estimates and the degree of private
information trade and liquidity in their stock trading.
For information asymmetry, traders on every trading day cannot be denied, even if we
accept the notion that the efficient market hypothesis eventually holds its existence. 3 For
3 We thank George Constantinides for discussing this point.
14
U.S. data, Easley et al. (1996, 2002) estimate parameter values of the probability of private
information-based trades for each trading day by using tick-by-tick quote and transaction
data, and report that about 20 percent of daily trading is based on private information.
Similarly, Kubota and Takehara (2009) report comparable estimates for Japanese data using
tick-by-tick data. These estimated values support our initial belief that there exists
information asymmetry in everyday trading of U.S. and Japanese stock markets.4
In this paper we use the adjusted PIN variable by Duarte and Young (2009) to
disentangle
the information asymmetry measure, the Adjusted PIN, and the illiquidity measure of firm
stocks’ PSOS to investigate family firm data. We can control for general information flow
shocks coming into the stock price and can pinpoint the degree of information asymmetry
between informed and uninformed trades.5 Moreover, the variable PSOS can identify
illiquidity of the stock. In addition, we estimate several alternative measures of liquidity
used in conventional financial research, which we will formally introduce in Section 4.2
because the PSOS is a rather new concept and the behavior of this variable is less known.
Next, when the degree of information asymmetry is higher, cost of equity will be higher
(O’Hara 1996).6 The motivation to voluntarily disclose may come from management’s
desire to signal to capital market participants that their firm should be classified as a good 4 In Holden and Subrahmanyam (1992) private information is revealed immediately when the trading interval approaches zero in their microstructure model, but empirical results for U.S. and Japanese stock markets indicate that is not the case for every trading day. 5 Anderson et al. (2009) distinguish between internal component (founder, heir or firm) in their family business research, and an external component (market) to assess the degree of opacity of firms. The former is more related to information asymmetry and the latter to market liquidity according to our interpretation. 6 Whether there is significant difference, however, depends on the degree of competitiveness of the stock market according to the recent theoretical model of Lambert et al. (2012).
15
one within the framework of signaling theory. Bolton and Dewatripont (2006, p. 24), for
example, state that “One of the main ideas emerging from the analysis of contracting
problems with private but verifiable information is that incentives for voluntary disclosure
can be very powerful.” If that were the case, there would be a group of firms which disclose
voluntarily, and another group which do not, and consequently a separating equilibrium will
hold.
Hence, our main research agenda is the quality of information dissemination and
consequent differences in the cost of capital between family and non-family firms, and we
construct the following six hypotheses, H1 to H6, and an accompanying corollary.
First, if private information shared by family members is revealed to a lesser extent to
capital market participants, we expect that private information-based trades have heavier
weight, and accordingly, cost of equity for family firms will be higher than non-family
firms (Easley and O’Hara, 2004). For non-family public firms we expect that the
diversified management team may talk more openly about their management strategies to
analysts and the media, while managers of family firms may show less opaqueness of
strategies shared solely among family members. The evidence by Anderson et al. (2009)
confirms this point for a recent large sample of U. S. data and finds that family firms are
more opaque than non-family firms.
Second, outside lenders who have more personal ties with founding families may have
more confidence in the reliability of family management. If the proportion of shares held
among family members is high, lenders will consider that management is more concerned
with firm value maximization, and hence have less chance of defaulting. Moreover, even if
16
the proportion of family-held shares is low, the descendent management team may have
inherited the management style from the founder, and may still share close personal
relationships.7 Thus, we expect the cost of debt, mainly bank loans for Japanese firms, will
be lower for family than non-family firms.
It is not clear how this will affect the overall weighted average cost of capital (WACC)
of family firms. It is widely known that the Japanese corporate tax is one of the highest in
the world next to the U.S., with an effective statutory tax rate of 40.87%. The use of tax
shields helps reduce WACC values. However, we infer that family firms will be less open
to outside borrowing because a family does not lose control of the firm to banks. For
example, the high WACC for family firms in Japan due to the non-use of debt can be seen
in the Toyota Motor Co., where the WACC value is as high as 8%.8
How family-controlled firms perform financing decisions following the pecking order
theory by Myers (1977) is another question, although it is outside the scope of this research.
If family businesses tend not to borrow, the WACC will be higher, but if they borrow more
because of their financial constraints, it will be lower, ceteris paribus the level of cost of
equity of our compared firms.
With these considerations we state our first three hypotheses regarding the cost of
capital.
7 These arguments probably apply more to regional banks than to megabanks in Japan. When we had a chance to interview Wacoal Holdings Corp., we asked about their relationship with the Bank of Kyoto and confirmed this point. Note that Wacoal Holding Corp. has little debt, while the firm highly values of their relationship with the Bank of Kyoto, and vice versa. 8 Toyota Motor Co. is now classified as a family business, according to our definition, after a family member took over as CEO in June 2010.
17
H1: Family-controlled firms have a higher cost of equity than non-family firms.
H2: Family-controlled firms have a lower cost of debt than non-family firms.
H3: In view of H1 and H2, there is no difference in weighted average cost of capital
between family-controlled and non-family firms.
Next, in order to explain the above three hypotheses, we formulate three additional
hypotheses and collect microstructure evidence to test them. In particular, we explore how
disclosure decisions adopted by family firms and the attention paid by outside analysts and
investors affect the degrees of information asymmetry, and thus, to what extent private
information is impounded into stock prices. Accordingly, our question is whether there is
any difference or similarity with that regard between family and non-family firms. To
answer these queries, we first state two hypotheses:
H4: Stocks of family-controlled firms are traded with a higher probability of symmetric
order flow shocks than non-family firms.
H5: Stocks of family-controlled firms are traded with a higher degree of information
asymmetry than non-family firms
Furthermore, we claim that degrees of information asymmetry and stock liquidity are
entangled in the above framework because the existence of information asymmetry implies
that there is wider disagreement among traders about the true quality of the firm, which
18
may then produce wider bid-ask spreads of limit price orders. Our PSOS variable can
purportedly extract the symmetric order flow shocks apart from information asymmetry, the
Adjusted PIN, and we expect that this PSOS variable contains separate illiquidity-related
information of stock trading. Note that Duarte and Young (2009) claim that the probability
of symmetric order flows can measure the illiquidity of stock. Thus, in H6 we investigate
the liquidity of stock trading, simultaneously utilizing other alternative measures of
liquidity as formally defined in Section 4.2 below. Note that H4 forms a subset of the
hypothesis H6.
H6: Stocks of family-controlled firms are traded with less liquidity than stocks of
non-family firms.
Finally, we set forth the final reasoning on the condition that H5 and H6, as well as H4,
are supported with data from our microstructure evidence. If these observations are indeed
true, we will have succeeded in explaining one of the reasons why H1 holds. Moreover,
H2 holds when lenders are in the position of insiders relative to outside stock investors and
give more generous lending terms to family firms. Thus, we state this as an empirical
proposition.
Proposition: If both hypotheses H5 and H6 hold, we infer that the illiquidity of stock and
information asymmetry cause hypotheses H1 and H2 to hold.
19
In order to compare this PSOS variable with other liquidity-related variables to test H5,
we compute Amihud’s (2002) illiquidity measure, Liu’s (2004) zero-trading volume day
measure, the marginal transaction costs estimated by the LDV model of Lesmond et al.
(1999 ), the standard turnover ratio, and bid-ask spreads as defined in Section 4.2.
4. Estimation Methods Used
4.1 Adjusted PIN and PSOS
We use tick-by-tick quotes and transaction records for all traded stocks, and classify each
transaction as either a buyer or seller-initiated transaction without ambiguity using the
following method.9 That is, all previous and current maximum bid-price and minimum
ask-price are recorded in our dataset, and based on these quotes we classify all transactions
as either buyer or seller-initiated depending on whether each transaction price is determined
above or below the mid-point of the most recent bid-ask price. We impose further
conditions that at least 180 days of trading data are available to compute the Adjusted PIN
annually for each firm using tick data from July 2007 to June 2010. To make sure the
publicly available data is available for trading investors, we estimate these variables with
transaction data from July 1st after financial data becomes publicly available by the end of
June for our March fiscal year-end firm sample.
To estimate the parameter vector with tick-by-tick data we numerically maximize the
product of likelihood functions with exterior penalty functions for inequality constraints
9 We do not have to use the conventional “tick test” which is the case for markets with specialists.
20
using a standard computing procedure and choose estimated parameter values from the
largest maximum likelihood function out of 10 optimizations for each firm and each year.10
4.2 Alternative Liquidity Measures
To construct alternative liquidity measures, we use three measures as well as turnover
ratio, average bid-ask spreads and average effective spreads. One measure is illiquidity,
ILLIQ, devised by Amihud (2002) as shown in (4), one is the zero-trading volume day
measure by Liu (2004), and the last is marginal cost for trades, estimated using the limited
dependent variable (LDV) model by Lesmond et al. (1999).
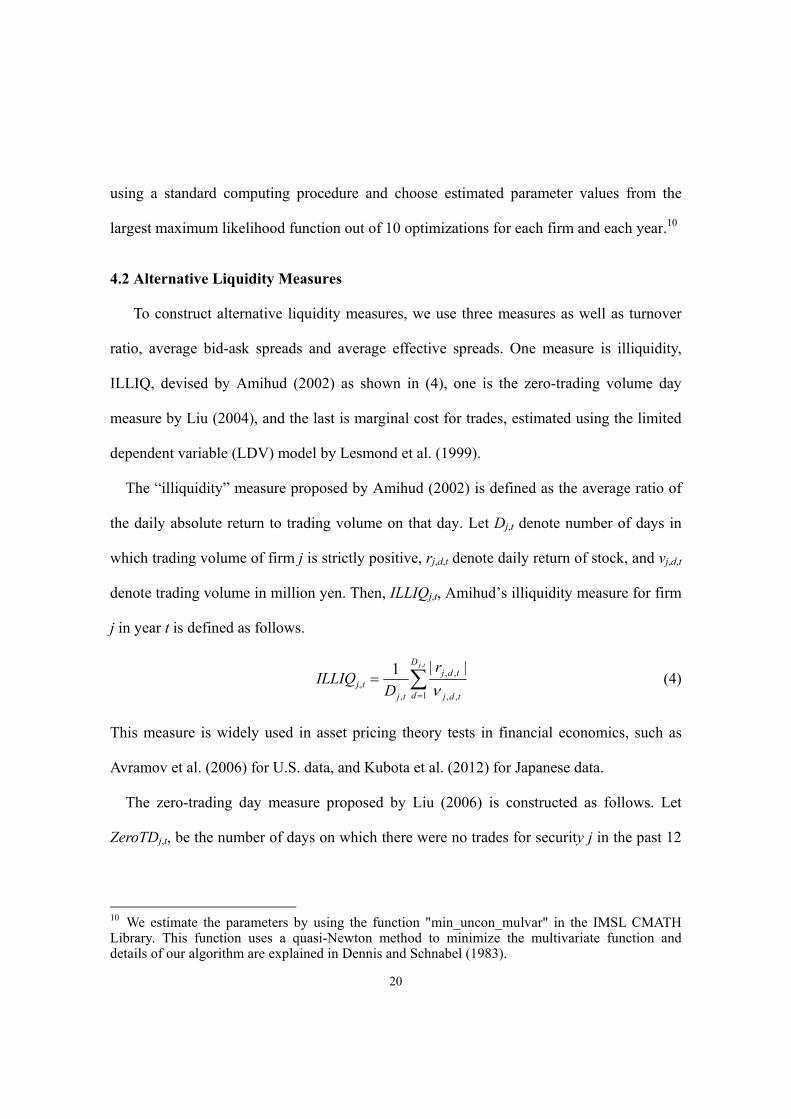
The “illiquidity” measure proposed by Amihud (2002) is defined as the average ratio of
the daily absolute return to trading volume on that day. Let Dj,t denote number of days in
which trading volume of firm j is strictly positive, rj,d,t denote daily return of stock, and vj,d,t
denote trading volume in million yen. Then, ILLIQj,t, Amihud’s illiquidity measure for firm
j in year t is defined as follows.
tjD
d tdj
tdj
tjtj
r
DILLIQ
,
1 ,,
,,
,,
||1
(4)
This measure is widely used in asset pricing theory tests in financial economics, such as
Avramov et al. (2006) for U.S. data, and Kubota et al. (2012) for Japanese data.
The zero-trading day measure proposed by Liu (2006) is constructed as follows. Let
ZeroTDj,t, be the number of days on which there were no trades for security j in the past 12
10 We estimate the parameters by using the function "min_uncon_mulvar" in the IMSL CMATH Library. This function uses a quasi-Newton method to minimize the multivariate function and details of our algorithm are explained in Dennis and Schnabel (1983).
21
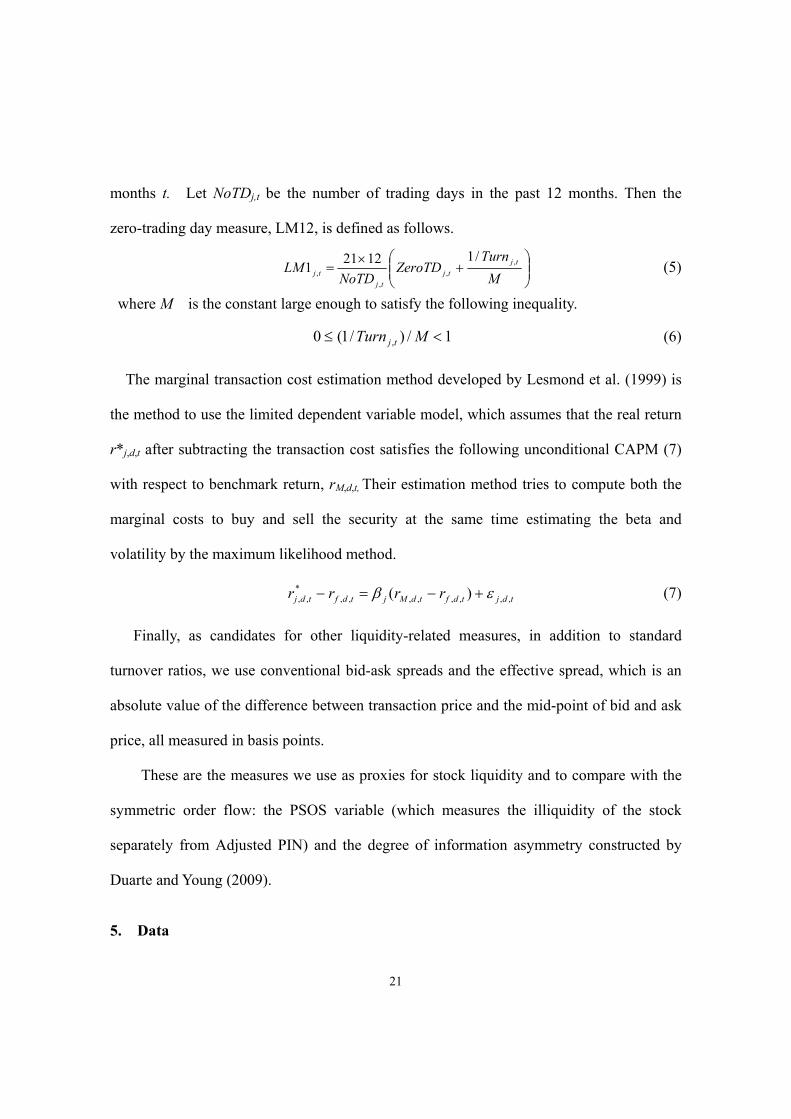
months t. Let NoTDj,t be the number of trading days in the past 12 months. Then the
zero-trading day measure, LM12, is defined as follows.
M
TurnZeroTD
NoTDLM tj
tj
tj
tj
,
,
,
,
/112211 (5)
where M is the constant large enough to satisfy the following inequality.
1/)/1(0 , MTurn tj (6)
The marginal transaction cost estimation method developed by Lesmond et al. (1999) is
the method to use the limited dependent variable model, which assumes that the real return
r*j,d,t after subtracting the transaction cost satisfies the following unconditional CAPM (7)
with respect to benchmark return, rM,d,t, Their estimation method tries to compute both the
marginal costs to buy and sell the security at the same time estimating the beta and
volatility by the maximum likelihood method.
tdjtdftdMjtdftdj rrrr ,,,,,,,,*
,, )( (7)
Finally, as candidates for other liquidity-related measures, in addition to standard
turnover ratios, we use conventional bid-ask spreads and the effective spread, which is an
absolute value of the difference between transaction price and the mid-point of bid and ask
price, all measured in basis points.
These are the measures we use as proxies for stock liquidity and to compare with the
symmetric order flow: the PSOS variable (which measures the illiquidity of the stock
separately from Adjusted PIN) and the degree of information asymmetry constructed by
Duarte and Young (2009).
5. Data
22
Ownership and CEO data to identify family firms was extracted predominantly from the
Major Shareholders Database and Directors’ Database (from Toyo Keizai, Inc.) while
financial statement and stock price data was extracted from the Nikkei NEEDS Financial
Quest Database published by Nikkei Digital Media, Inc.
We construct our database for the current study as follows. Based on surveys by Toyo
Keizai Shinpousha we have data for the largest 30 stockholders and detailed descriptions of
board members, including the CEO and chairperson with endowed executive authority.
Simultaneously, we use data from our questionnaire responses explained below as well as
old company handbooks by Toyo Keizai to identify founding family members. To
confirm family names and kinship, in 2009 we sent a questionnaire to all 3527 listed firms
to collect family ownership and management information. In total, 406 listed firms
responded.1112 For firms who did not respond, corporate histories and Toyo Keizai’s Top 30
Major Shareholders List were examined to identify ownership and management
information.
Based on data from March 2007, 2008, and 2009 we constructed a database for family
businesses based on two criteria: the founding family owns more than 10% of equity
shares; and the CEO, president, or chairperson is from the founding family, which we call
“CEO criterion,” for brevity. The former 10% criteria is used in Asaba (2012) and Mehrotra
et al. (2010) for reasons that, in Japan, the inheritance tax is quite hefty at over 50%,
leading to the dilution of family-owned shares, and main banks tend to hold stable shares of
11 The response rate of the questionnaire was 11.5%, which is close to the average rate of or higher than normal response rates for questionnaires to Japanese companies. 12 Financial firms were excluded due to the fundamental differences in their financial reporting structure.
23
lending partners as well as investment trusts related to those bank groups.13 In this paper
we want a continuous explanatory variable for cross-sectional regressions, and thus we use
a continuum of shareholding ratios at the estimation stage. The second criterion, “CEO
criterion,” implies the management authority is still in the hands of the founding family
either as a CEO or board chair. In this study we dichotomously classify family-controlled
and non-family-controlled firms with the 10 % holding and CEO criterion.14
The particular sample for this microstructure study is firms listed on the first and second
sections of the Tokyo Stock Exchange as of March 2007, 2008 and 2009, and we use
individual financial statements to find original shareholders’ holdings.15 To estimate the
PIN variable we use tick-by-tick quote and transaction data provided by Nikkei Media
Marketing Co., Ltd. For financial data, the source is again Nikkei Media Marketing.
Two control variables we use are lnMV, which is a natural logarithm of market value of
equity (in million yen), and B/M, which is the book-to-market ratio of the firm in percent.
These financial attributes of the firm, lnMV and B/M, are computed from the Nikkei
Portfolio-Master Database. Cost of equity is estimated from the aforementioned
unconditional Fama and French three factor model of equation (1).
We do not include in our sample firms which PIN and Adjusted PIN could not be
computed numerically, which accounts for less than 12 percent of the total sample. Thus
our total observations are 4303 firm-years. Also note that we have not included financial
13 Another country with a hefty inheritance tax rate was Taiwan, but is no longer the case. 14 Thus, our classification scheme is somewhat different from the one used by Allouche et al. (2008) for Japanese firms and similar to the one used by Saito (2008). We plan to test robustness between these two criteria in an extension of the current research. 15 Although in Japan, family firms in general have many subsidiaries and related companies, the pyramid structure is not so common, and, accordingly, we focus only on parent companies.
24
firms because we use cost-of-capital estimates, which cannot be unambiguously defined for
these firms.
6. Basic Observations
6.1 Basic Statistics
We explore the information dissemination process of our sample of family firms
through daily stock trading data. These firms disclose compulsory financial statements as
publicly-listed firms, conduct voluntary PR activities, and most often solicit their own CSR
activities on their web pages. 16 We claim that the Adjusted PIN and PSOS can
quantitatively identify degrees of information asymmetry as well as stock liquidity. We
suspect substantial shareholdings by families with less floating stocks will affect both
information asymmetry and stock liquidity, which will in turn affect the level of the cost of
capital.
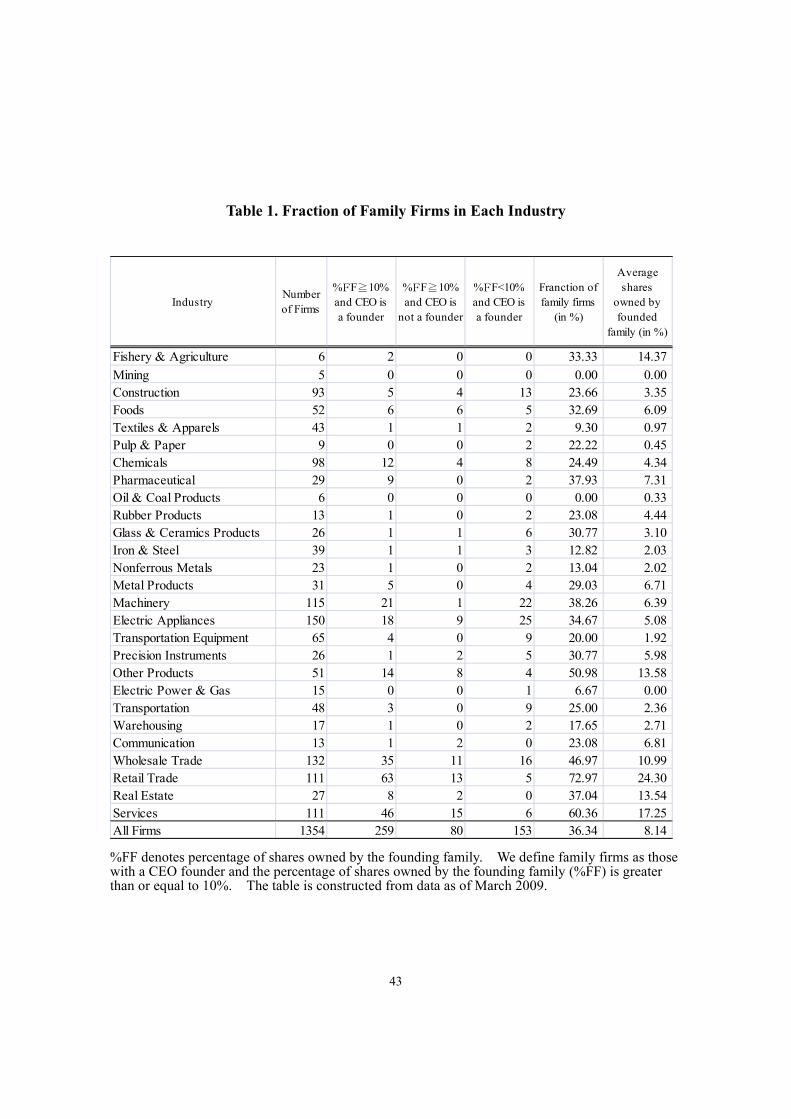
We present the basic statistics in Tables 1 and 2. Table 1 identifies the weight of family
businesses in Japan among Tokyo Stock Exchange listed firms.
TABLE 1 ABOUT HERE
The first column is the number of total sample firms, for which the Adjusted PIN and PSOS
could be computed with suitable convergence criteria. The number of firm samples as of
March 2009 is 1354. In the first column the number of firms for each industry is listed. In
the second column we report the number of firms where the ratio of shareholding by the 16 The level of CSR activities conducted by family firms in Japan is investigated in Aoi, et al. (2012).
25
founding family exceeds 10% and either the CEO, president, or chairperson is from the
founding family; the second row is the number of firms, for which only the first criterion of
10% shareholdings is satisfied; and the third column is where only the second CEO
criterion is satisfied.17 The fourth column computes the percentage of family firms when at
least one of the three criteria is met, and the fifth column reports average shares owned by
families whose companies are classified as family firms in the fourth column.
From the table we find that 36.34% of our sample firms are classified as family firms
and average shareholdings are 8.14%. The percent of firms is higher for Retail Trade with
72.97%, Services with 60.36%, and Other Products with 50.98%. The lowest are Mining
and Oil and Coal Products with 0%, meaning there are no family firms in these industries.
The rankings of average shareholdings are also the same with the percentage of the number
of family firms for each industry.
The average percent of 36.34% is comparable to that reported by Anderson and Reeb
(2003) for U.S. firms. Note that these two economies distinguish themselves as a
developed economy where there is more separation of management and ownership, and yet
we find one-third of the listed firms in both countries are family businesses.18
Table 2 reports ownership distributions and basic firm characteristics of our sample
firms. We show the result both for family firms (second column) and for non-family firms
17 We use the 10% criteria based on findings by Asaba (2012) where there were not significant differences using either the 10% or 20% criteria for Japanese family firms in the electronics industry. 18 It has been said that the majority of firms in other Eastern Asian countries are family firms (Morck et al., 2005). Also, the percentage of shares held by families is larger in European countries, and the 30% or 50% shareholdings criteria is oftentimes used to distinguish family firms in these countries in family business research.
26
(third column). The fourth and fifth columns report p-values of the significance of
differences by the Welch test and the Wilcoxon rank test, and the sixth column reports the
Spearman rank correlation between the ranking of each variable and the percentage of
shares owned by founding families. The total sample is 4261 where three years of pooled
observations from 2007 through 2009 are used.
TABLE 2 ABOUT HERE
In the third row from the top we report the percentage of overall floating stocks and find
that it is significantly lower for family firms with a ratio of 52% vs. 54% for both
significance tests. By “floating stocks” we mean the fraction not owned by the largest top
10 shareholders.19 The differences in shares owned by investment trusts are not significant,
but other fractions of owned shares are, at the 1% level. In particular, for shares held by
directors, individuals, and others, family firms show significantly higher figures than
non-family firms, which is quite an intuitive result. Even though a fraction of stocks owned
by institutional investors dramatically increased over the past 15 years, we find that a
substantial portion of family firm stock is still owned by individuals and/or family members.
Thus, we expect that the alignment between shareholders and management will be closer,
more so by judging from the portion owned by directors, whose major shares must belong
to founding families because the number of shares held by executives is much lower in
Japan than the U.S. The result of foreign corporation ownership is interesting but not 19 Our data is based on the top 30 shareholders and examination of shareholders 21 to 30 reveal that the top 10 are quite fixed overall and so our proxy measure is a good variable to assess actively traded stocks.
27
significant with the Wilcoxon rank test, which we rely on due to the possible non-normality
of empirical distributions.20 For listed firms in Korea, Oh and Chang (2011) find that
foreign ownership has significant and positive influences on firms’ CSR activities, in
particular, among Chaebol firms. Based on our results for Japan, however, we are able to
safely ignore the influence of foreign corporate ownership on listed family versus
non-family firms because the difference is not significant.
Note that in Table 1 the size of family firms (10.427 in log of million yen) was
significantly smaller than that of non-family firms (10.909 in log of million yen). Family
firms make up more of the value firms according to the book-to-market ratio where those
ratios are higher. In our sample the net sales per employee and labor equipment ratio as
measured by the ratio of tangible assets to number of workers are all significantly smaller
for family firms.
From the seventh row from the bottom we report financial characteristics of firms. From
the top, we find that the ROE, which is computed as a five-year average for each firm, is
significantly higher for family than non-family firms with 5.142% and 3.362%,
respectively.21 In terms of the ROE, which measures the ultimate return to shareholders for
founding families, it seems that family businesses are serving their ultimate purpose. Also,
Japanese family firms retain a larger fraction of earnings, which may show stronger
pecking order behavior. The reason may be that families do not want to lose control of their
firms to lenders and outside shareholders.
20 We thank Jay Shanken for discussion on this point. 21 Recently, Reinking et al. (2011) reported that family firms show a lower ROE than non-family firms with U.S. data.
28
When we look at borrowing-related variables, we find that family firms are more
dependent on banks among debt, while the debt ratio, debt-to-total assets, is much lower
than non-family firms with 42.866% to 51.706%, respectively. These differences are all
significant.
In terms of investment in fixed assets, however, family firms are more lightly equipped
judging from the figures of fixed assets to equity and long-term capital. It may be due to
particular industry distributions between the two types of firms. Note we report that there
are more family firms in services, retail, and other products industries. As for R&D
expenditures, we find that family firms invest less than non-family ones (1.543% vs.
1.902%), but, again, it may be due to distributions of family business industries. Note that
Asaba (2012), in his electronic industry sample, finds that family firms have a tendency not
to decrease investment during recessions and keep a patient investment level.
6.2 Cost of Capital Estimates
Table 3 reports the main results on cost of capital estimation and selected liquidity
measures. The first column is for family firms, the second for non-family firms and the
third and fourth columns report p-values for significance of differences. The fifth column
shows the Spearman rank correlation between reported variables and the fraction of shares
owned by family firms. The sixth column reports its significance.
TABLE 3 ABOUT HERE
29
We find that the cost of equity is higher for family businesses (7.776% vs. 7.680%), but
not significant. The correlation with fraction of shares owned by founding families is
positive, but not significant. Accordingly, we cannot conclude whether the cost of capital is
higher for family than non-family firms. So, hypothesis H1 was not confirmed at this stage.
Because our sample is all listed firms, we can safely assume that the asset pricing model
can be applied to these firms, and thus, the result indicates that cash flow of family firms is
not significantly lower than non-family firms. This is contrary to the view raised in
previous literature like McConaughy (1999, p.356), who claim that the benefits of “family
effects,” arising from dedication of families may lower the cost of equity.
As for cost of debt, which is computed from data of all interest bearing debt in the
previous fiscal year, it is lower for family versus non-family businesses (2.381% vs.
2.489%), and the differences are significant for the Wilcoxon test, which we rely on more
because of the possible non-normality of empirical distributions. Moreover, the correlation
between cost of debt and fraction of shares owned by founding families is negative at
-0.081 and significant. In Table 2 we reported that family firms borrow mainly from banks
and the result complements the initial story that lenders have more confidence in some
family firms and require lower interest rates. Consequently, we support hypothesis H2 and
in the next section will try to obtain further confirmation from the cross-sectional
regression. Note our finding for Japan is on par with findings for the U.S. by Anderson et al.
(2003), except they use yield spread and we use the interest paid variable.
Given cost of equity and cost of debt we find that the WACC is slightly higher for
family versus non-family firms (6.067% vs. 5.852%). However, the result is only
30
significant with the conventional t-test with a 10% significance level, and it is not
significant with the Wilcoxon test. In Table 2 we reported that the debt ratio is significantly
lower for family firms. With a high 40.87% statutory corporate tax rate for Japan applicable
to large and profitable listed firms of our sample,22 less use of debt by family firms will
force them to sacrifice the interest tax shield, which may be one reason why WACC is not
significantly different between family and non-family firms, although cost of debt is lower
for family firms and cost of equity is not significantly different. Considering that good
firms in the U.S. are in general less leveraged (Graham, 2000), and also in Japan (Kubota
and Takehara, 2007), family firms may be adopting a strategy of utilizing less debt for
signaling purposes. Thus, we do not reject hypothesis H3.
6.3 Estimates of Information Asymmetry and Liquidity Measures
In the next six rows of Table 3 we report estimation results of several liquidity
measures as explained in Section 3.2. We find the Amihud (2002) illiquidity measure is
significantly higher for family firms with 27.319 vs. 22.136, and the correlation with the
fraction of shares held is positive and significant. Also, in the case of Liu’s (2006) liquidity
measure LM12, liquidity is higher for non-family than family firms and significant.
Moreover, the correlation is significantly positive and does not coincide with the result for
the Amihud measure. Monthly turnover is significantly higher for non-family firm stocks
and the correlation is also significantly positive, which coincides with the result for the
Amihud measure.
22 Kubota and Takehara (2007) report profitable firms are paying corporate tax at the rate close to the statutory tax rate.
31
The other three measures are all insignificant with the Wilcoxon test. As far as
inequality is concerned, in the case of the marginal transaction cost measure by Lesmond et
al. (1999), estimated costs are higher for non-family firms, while the correlation is positive
though not significant. As for the bid-ask and effective spreads, they are lower for family
than non-family firms. However, we find the correlation between the bid-ask spread and the
fractions of shares owned by families is positive and significant.
Overall, in spite of some conflicting results among alternative liquidity measures, we
conclude that family firm stocks are less liquid than non-family stocks. We decided to put
more weight on the result from Amihud’s illiquidity measure because it is one of the most
extensively used measures as a proxy for liquidity in the financial economics literature. We
conclude that hypothesis H6 holds.
Finally, we report the results for the Adjusted PIN and the PSOS. As for the Adjusted
PIN, we find that the probability of private information is significantly higher for family
firms with 13.765% vs. 13.076 % for non-family firms, and moreover, the correlation is
significantly positive. The same is true for the PSOS where family firms report a
significantly higher percentage of symmetric order inflow than non-family firms at a 5%
significance level for the Wilcoxon test. The correlation number also supports this result.
Thus, the evidence supports hypotheses H4, H5, and H6. However, as we mentioned
earlier, H1 was not conclusive, and so we could not find the direct channel from H5 and H6
to H1 and cannot confirm the plausibility of the corollary. Overall, we conclude that stocks
of family firms are less liquid with a higher probability of private information-based trades
with our initial univariate difference tests.
32
6.4 Correlations of Family-Related Characteristic Variables
Panel A of Table 4 reports the correlations of selected variables, the percent of shares
held by families, cost of equity, cost of debt, Adjusted PIN, PSOS, size, and book-to-market
ratios. The matrix contains Spearman rank correlation numbers in the upper right diagonal
and corresponding p-values in the lower left.
TABLE 4 ABOUT HERE
As for correlations between percent of shares held by families and other variables, the cost
of equity is insignificant, but cost of debt is significant with -0.081, which was reported in
Table 2. The results with the Adjusted PIN and PSOS are positive and significant, as shown
in Table 3. Moreover, cost of equity and the Adjusted PIN and PSOS are all positive and
significant.
In conjunction with the prediction by O’Hara (2000) and Easley and O’Hara (2004)
higher asymmetric information will cause the cost of capital to be higher. The correlation of
cost of equity and debt with size is negative and significant and shows that larger firms
have smaller risk premium ceteris paribus. Also, we find the existence of so-called value
effects found among depressed firms, that value firms have a higher cost of equity and cost
of debt.
In Panel B of the table we report the additional result for Welch’s t test by dichotomizing
the same data depending on whether or not the CEO is from a founding family. The upper
row is a family CEO, and the lower row a non-family CEO. Once again, we do not find a
33
significant result for cost of equity, but find that cost of debt is significantly higher when
the CEO is from a family firm than not (2.281% vs. 2.523%). We also find that the
Adjusted PIN and PSOS are significantly higher when the CEO is from the founding family,
and it may indicate that a family CEO possesses more private information than a CEO
from outside the family. We consider this an illuminating result, which we could not have
obtained without utilizing the theoretical constructs of the microstructure study. As to size,
family firms with family CEOs are smaller than family firms with non-family CEOs, which
are more value firms.
7. Cross-Section Regression Results on Information Asymmetry and Liquidity
Table 5 reports the results for cost of equity regressed on family firm-related variables,
that is, the fraction of shares owned by founding families and the CEO dummy as well as
control variables of size and book-to-market ratios.23 In Panel A, the dependent variable
is the raw variable, and Panel B the dependent variable is the ranked variable; i.e., let x
denote the n-dimensional real vector and rank(x) denote a function which returns the rank
of the elements in x, and the ranked version of x is defined as (rank(x)-1)/(n-1).
TABLE 5 ABOUT HERE
We find that coefficients of the fraction of shares owned by founding families are negative
in all four cases. The coefficients are significant for cases with control variables with
23 We also included an interactive term in the regression between fraction of shares held by founding families and the CEO dummy. The coefficients were all insignificant and we report the cases without interactive terms.
34
p-values 0.001 and 0.000. It means that shares are held more by families less cost of equity.
On the other hand, the CEO dummy is positive, but not significant. Note that hypothesis H1
in Section 5.2 is not conclusive. With our four-panel regression results, we do not reject the
hypothesis that family firms have a higher cost of equity, and, since the magnitude of the
sensitivity is small (-0.020 for raw variables and -0.001 for ranked variables), we conclude
that shares held by families will very weakly lower the cost of equity, or are indifferent.
Table 6 reports the regression results for cost of debt, and independent and dependent
variables are the same as in Table 5.
TABLE 6 ABOUT HERE
For cost of debt, as hypothesis H2 purports, all coefficients for the fraction of shares owned
by founding families are negative, which is significant for ranked dependent variables.
Moreover, all the coefficients for the CEO dummy are negative although they are not
significant except for the ranked dependent variable with control variables with p-value
0.038. The result is overall on par with hypothesis H2 and we conclude that cost of debt is
lower for family firms and more so where the CEO is from the family. It supports our
initial view that the lender has more confidence in the family CEO when reaching the
lending decision. Note in the last regression the sensitivity of the CEO dummy, -0.026, is
ten times larger than the fraction of shares owned by founding families, -0.002. So the fact
that the incumbent CEO is from the family really helps explain the lower cost of debt,
which we have addressed in building hypothesis H2; i.e., lenders put a higher trust in
founding family management.
35
Table 7 reports the results of cross section regressions in which the dependent variable
is the Adjusted PIN. Once again, the set of independent variables is the same in Tables 5
and 6, and the lower Panel B shows results where dependent variables are ranked variables.
TABLE 7 ABOUT HERE
We find that all coefficients are positive (zero for the last case) for the fraction of shares
owned by founding families, suggesting that the higher the fraction of family-held shares,
the higher the probability of private information trades and information asymmetry.
However, the results are weaker because coefficients are significant only for the case when
control variables are not included. Moreover, for the CEO dummy variable, coefficients are
negative and not significant. Hence, we conclude that the fraction of shares owned by
founding families can explain the degree of information asymmetry, but it may be that it
behaves as if it were just a proxy for firm size. Accordingly, the evidence weakly supports
hypothesis H5.
Table 8 reports the result from cross-sectional regressions in which the dependent
variable is the PSOS, the proxy measure of market liquidity.
TABLE 8 ABOUT HERE
We find that most of the coefficients for the fraction of founding family owned shares
are positive, as are all CEO dummy variables. However, coefficients for the fraction of
family shares are significant only for cases where control variables are not used. All the
36
coefficients for CEO dummy variables are not significant. Accordingly, we again weakly
support hypothesis H4 as well as H6, particularly when we use the PSOS as a proxy
variable for the measure of liquidity, as we observed in Table 3.
In sum, from both our univariate difference tests and cross-section regression tests, we
support hypotheses H2, H3, and H6, and weakly support H4 and H5, but are not conclusive
on H1, and thus the Corollary is not supported either. That is, we found evidence that
family firms in Japan have a lower cost of debt, lower market liquidity, and higher
information asymmetry, but the difference on cost of equity cannot be found.24 Although
family firms have less debt, we could not find conspicuous significant differences in the
WACC between family and non-family firms, although it was slightly higher for family
firms and the conventional t-test had a 10% significance level.
Policy implications for financial managers of family businesses are as follows. First, they
can resort to more debt to utilize the tax shield if they want to borrow from outside sources.
However, it may be difficult for firms which want to stick with inside financing in fear of
losing family control. Second, if they want to decrease the cost of equity, and accordingly,
WACC, one open channel is an effort to increase stock liquidity and decrease information
asymmetry at the same time. Family firms can attain this by enhancing their voluntary
disclosing effort and/or increasing floating stocks, which will lead to a lower cost of equity
and WACC. As a result, this will help family firms to implement more projects with
24 Recently Lambert et al. (2012) derived a model where they showed under perfect competition that the degree of information asymmetry does not affect cost of equity, and otherwise, if the market is under imperfect competition. Note that their theoretical model is based on the assumption of exponential utility and normal distributions. Whether the traded stocks of our family firm sample correspond to which case is an empirical question for future scrutiny.
37
positive NPVs.
8. Conclusion and Implications
In this paper we investigated market liquidity, distributions of private information-based
trades, and the cost of capital of publicly traded family firms in Japan. The database is
recent as of March 2009, and it covers three years of observations for all listed firms in
Japan.
This is the first study in the literature to use the Adjusted PIN and PSOS for family firm
data. These findings, which are new for Japanese family firms from 2007 through 2009,
have important implications for future family firm financial strategies and disclosure
policies.
Our overall findings are that family firms in Japan have a lower cost of debt, lower
market liquidity, and higher information asymmetry. However, the inference on the
difference in cost of equity is inconclusive. We also did not find whether the WACC for
family firms was significantly different from that for non-family firms with the Wilcoxon
test, although it was significant with the conventional t-test at a 10% level.
Given the evidence, we propose that more transparent voluntary disclosure among
Japanese family firms is called for, primarily for equity investors rather than lenders, in
order to increase market liquidity and reduce information asymmetry of their traded stocks,
and, accordingly, to reduce cost of equity and WACC. Another quick treatment is to
increase their leverage level to utilize the interest tax shield, but considering there is more
information asymmetry among family firms, lower debt may be a signal to inform outside
38
investors that their companies are good. (Graham, 2000). 25 So the latter may not be an
outright solution for firms which want to be classified as good ones in a signaling
equilibrium.
25 The extensive interview conducted in 2011 with Yamazaki Mazak Co. in Nagoya, which is one of the largest and best precision machine tool manufacturing companies in the world, revealed that the company does not utilize debt at all. However, this company is private. Hence, a signaling purpose may not be the direct reason in this case. We conjecture the reason might be congruent control of the company by the founding family in order to sustain long term goals.
39
References:
Aghion, P., Tirole, J., 1997. Formal and real authority in organizations. Journal of Political
Economy 105, 1-29.
Aktas, N., de Bodt, E., Declerck, F., Oppens, H. V., 2007. PIN anomaly around M&A
announcements. Journal of Financial Markets10, 169-191.
Ali, A., Chen, T-Y, Radhakrishnan, S., 2007. Corporate disclosure by family firms. Journal
of Accounting and Economics 44, 238-286.
Allouche, J., Amann, B., Jaussaud, J., Kurashina, T., 2008. The impact of family control on
the performance and financial characteristics of family versus nonfamily businesses in
Japan: A matched-pair investigation. Family Business Review 21, 315-329.
Almeida, H., Park, S. Y., Subrahmanyam, A. S. G., & Wolfenzon, D., 2010. The structure
and formation of business groups: Evidence from Korean Chaebols. Working Paper, Stern
School of Business, New York University.
Amihud, Y., 2002. Illiquidity and stock returns: Cross-section and time-series effects.
Journal of Financial Markets 5, 31-56.
Anderson, R. C., Reeb, D. M., 2003. Founding-family ownership and firm performance:
Evidence from the S&P 500. Journal of Finance 58, 1301-1328.
Anderson, R. C., Mansi, S.A., Reeb, D. M., 2003. Founding family ownership and the
agency cost of debt. Journal of Financial Economics 68, 263-285.
Anderson, R. C., Duru, A., Reeb, D. M., 2009. Founders, heirs, and corporate opacity in the
United States. Journal of Financial Economics 92, 205-222.
Anderson, R. C., Reeb, D. M., Zhao, W., 2012. Family-controlled firms and informed
trading: Evidence from short sales. Journal of Finance, forthcoming.
Aoi, M., Asaba, S, Kubota, K., Takehara, H., 2012. Corporate social performance and
family firms: A case of Japanese firms. Paper presented at International Family Enterprise
Academy Annual Congress, Bordeaux.
Asaba, S. 2012. Patient investment: A study on the behavior of the listed family business in
the Japanese electric machinery industry. Asia Pacific Journal of Management, on line first,
August 26.
Back, K., Baruch, S., 2004. Limit-order market and floor exchanges: An irrelevance
proposition. Manuscript. Texas A&M, and University of Utah.
Bolton, P., Dewatripont, M., 2005. Contract Theory. The MIT Press, Cambridge, MA.
Claessens, S., Djankov, S., Lang, L. H. P., 2000. The separation of ownership and control in
40
East Asian corporations. Journal of Financial Economics 58, 81-112.
Dennis, J. E. Jr., Schnabel, R. B., 1983. Numerical Methods for Unconstrained
Optimization and Nonlinear Equations. Prentice-Hall, Princeton, NJ.
Duarte, J., Han, X. Harford, J., & Young, L., 2008. Information asymmetry, information
dissemination and the effect of regulation FD on the cost of capital. Journal of Financial
Economics, 87, 24-44.
Duarte, J., Young, L., 2009. Why is PIN priced? Journal of Financial Economics 91,
119-138.
Easley, D., Hvidkjaer, S., O’Hara, M., 2002. Is information risk a determinant of asset
returns? Journal of Finance 57, 2185-2222.
Easley, D., Kiefer, N. M., O’Hara, M., Paperman, J. B., 1996. Liquidity, information, and
infrequently traded stocks. Journal of Finance 51, 1405-1436.
Easley, D., O’Hara, M., 2004. Information and the cost of capital. Journal of Finance 59,
1553-1583.
Ebihara, T., Kubota, K., Takehara, H., Yokota, E., 2012. Quality of accounting disclosure
by family firms in Japan. Paper available at ssrn.com;
http://dx.doi.org/10.2139/ssrn.1996505
Eoyang, C., 1998. The liquefaction of Japanese crossholding: Analyzing the unwinding
process. Goldman Sachs Equity Derivative Research, Goldman Sachs and Co, New York.
Fama, E. F., French, K. R., 1993. Common risk factors in the returns on stock and bonds.
Journal of Finance 48, 427-465.
Gomez-Mejia, L. R., Nunez-Nicker, M., 2001. The role of family ties in agency contracts.
Academy of Management Journal 44, 81-95.
Graham, J. R., 2000. How big are the tax benefits of debt? Journal of Finance 55,
1901-1942
Holden, C. W., Subrahmanyam, A., 1992. Long-lived information and imperfect
competition. Journal of Finance 47, 247-270.
Jagannathan, R., Kubota, K., Takehara, H.,1998, Relationship between labor-income risk
and average return: Evidence from the Japanese Stock Market. Journal of Business 71,
319-347.
Jensen, M. C., Meckling, W. H., 1976. Theory of the firms: Managerial behavior, agency
cots, and ownership structure. Journal of Financial Economics 3, 305-360.
Kaul, G., Lei, Q., Stoffman, N., 2008. AIMing at PIN: Order flow, information, and
41
liquidity. Working Paper, Southern Methodist University.
Kubota, K., Takehara, H., 2007. Effects of tax rate changes on the cost of capital: The case
of Japanese firms. Finanz/Archiv Public Finance Analysis 63, 163-185.
Kubota, K., Takehara, H., 2009. Information-based trade, the PIN variable, and portfolio
style differences: Evidence from Tokyo Stock Exchange firms. Pacific-Basin Finance
Journal 17, 295-318.
Kubota, K., Suda, K., Takehara, H., 2012. Impact of quarterly disclosure on information
asymmetry: Evidence from Tokyo Stock Exchange firms. Paper presented at the 2012
Econometric Society European Meeting, Malaga.
Lambert, R.A., Leuz, C., Verrecchia, R. E., 2012. Information asymmetry, information
precision, and the cost of capital. Review of Finance 16, 1-29.
La Porta, R., Lopez-de-Silanes, F., Shleifer, A., 1999. Corporate ownership around the
world. Journal of Finance 54, 471-517.
Lesmond, D. A., Ogden, J. P., Trzcinka, C. A., 1999. A new estimate of transaction costs.
Review of Financial Studies 12, 1113-1141.
Liu W., 2006. A liquidity augmented capital asset pricing model. Journal of Financial
Economics 82, 631-671.
Masulis, R.W., Pham, P. K., Zein, J., 2011. Family business groups around the world: Costs
and benefits of pyramids. Review of Financial Studies 24, 3556-3600.
Mazzi, C., 2011. Family business and financial performance: Current state of knowledge
and future research challenges. Journal of Family Business Strategy 2, 166-181.
McConaughty, D. L. (1999). Is the cost of capital different for family firms? Family
Business Review, 12, 353-360.
Mehrotra, V., Morck, R., Shim, J., Wiwattananakantang, Y., 2011. Adoptive expectations:
Rising sun tournaments in Japanese firms. NBER Working Paper No. 16874.
Morck, R., Wolfenzon, D., Yeung, B., 2005. Corporate governance, economic entrenchment,
and growth. Journal of Economic Literature 43, 655-720.
Myers, S. C., 1977. Determinants of corporate borrowing. Journal of Financial Economics
5,146-175.
Odders-White, E.R., Ready, M. J, 2003. Credit ratings and stock liquidity. Working Paper,
University of Wisconsin-Madison.
Oh, W. Y., Chang, Y. K., 2011. The effect of ownership structure on corporate social
responsibility: Empirical evidence from Korea. Journal of Business Ethics 104, 283-297.
42
O’Hara, M., 2003. Liquidity and price discovery. Journal of Finance 58, 1335-1354.
Pastor L., & Stambaugh, R. (2003). Liquidity risk and expected stock returns. Journal of
Political Economy, 111, 642-685.
Reinking, J. F., Robb, S. W. G., Roberts, R. W., 2011. Family firm’s corporate social
responsibility and financial performance. Paper presented at the 2011 American Accounting
Association Annual Meeting, Denver.
Saito, T., 2008. Family firms and firm performance: Evidence from Japan. Journal of the
Japanese and International Economic, 22, 620-646.
Venter, J. H., de Jongh, D. C. J., 2005. Extending the EKOP model to estimate the
probability of informed trading.
http://papers.ssrn.com/sol3/papers.cfm?abstract_id=648403, (October 20, 2011).
Villalolonga, B., Amit, R., 2006. How do family ownership, control and management affect
firm value? Journal of Financial Economics 80, 385- 417
Wang, D., 2006. Founding family ownership and earnings quality. Journal of Accounting
Research 44, 619-655.
Yafeh, Y., 2000. Corporate governance in Japan: Past performance and future prospects.
Oxford Review of Economic Policy 26, 74-84.
43
Table 1. Fraction of Family Firms in Each Industry
IndustryNumberof Firms
%FF≧10%and CEO isa founder
%FF≧10%and CEO is
not a founder
%FF<10%and CEO isa founder
Franction offamily firms
(in %)
Averageshares
owned byfounded
family (in %)
Fishery & Agriculture 6 2 0 0 33.33 14.37
Mining 5 0 0 0 0.00 0.00Construction 93 5 4 13 23.66 3.35Foods 52 6 6 5 32.69 6.09Textiles & Apparels 43 1 1 2 9.30 0.97Pulp & Paper 9 0 0 2 22.22 0.45Chemicals 98 12 4 8 24.49 4.34Pharmaceutical 29 9 0 2 37.93 7.31Oil & Coal Products 6 0 0 0 0.00 0.33Rubber Products 13 1 0 2 23.08 4.44Glass & Ceramics Products 26 1 1 6 30.77 3.10Iron & Steel 39 1 1 3 12.82 2.03Nonferrous Metals 23 1 0 2 13.04 2.02Metal Products 31 5 0 4 29.03 6.71Machinery 115 21 1 22 38.26 6.39Electric Appliances 150 18 9 25 34.67 5.08Transportation Equipment 65 4 0 9 20.00 1.92Precision Instruments 26 1 2 5 30.77 5.98Other Products 51 14 8 4 50.98 13.58Electric Power & Gas 15 0 0 1 6.67 0.00Transportation 48 3 0 9 25.00 2.36Warehousing 17 1 0 2 17.65 2.71Communication 13 1 2 0 23.08 6.81Wholesale Trade 132 35 11 16 46.97 10.99Retail Trade 111 63 13 5 72.97 24.30Real Estate 27 8 2 0 37.04 13.54Services 111 46 15 6 60.36 17.25All Firms 1354 259 80 153 36.34 8.14
%FF denotes percentage of shares owned by the founding family. We define family firms as those with a CEO founder and the percentage of shares owned by the founding family (%FF) is greater than or equal to 10%. The table is constructed from data as of March 2009.
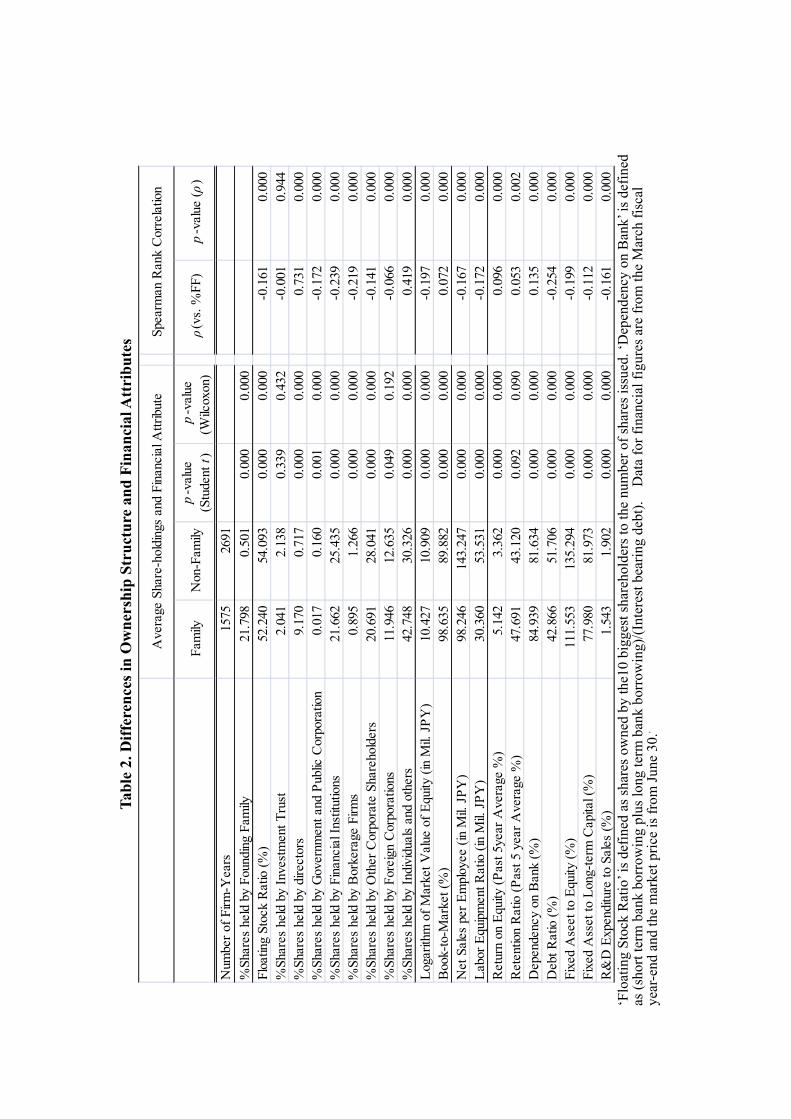
Tab
le 2
. Dif
fere
nce
s in
Ow
ner
ship
Str
uct
ure
an
d F
inan
cial
Att
rib
ute
s
Fam
ily
Non
-Fam
ily
p-v
alue
(Stu
dent
t)
p-v
alue
(Wilc
oxon
) ρ
(vs.
%FF
) p
-val
ue (ρ
)
Num
ber
of F
irm-Y
ears
15
7526
91
%Sh
ares
hel
d by
Fou
ndin
g Fa
mily
21
.798
0.50
10.
000
0.00
0
Fl
oatin
g St
ock
Rat
io (
%)
52.2
4054
.093
0.00
00.
000
-0.1
610.
000
%Sh
ares
hel
d by
Inv
estm
ent T
rust
2.
041
2.13
80.
339
0.43
2-0
.001
0.94
4%
Shar
es h
eld
by d
irect
ors
9.17
00.
717
0.00
00.
000
0.73
10.
000
%Sh
ares
hel
d by
Gov
ernm
ent a
nd P
ublic
Cor
pora
tion
0.01
70.
160
0.00
10.
000
-0.1
720.
000
%Sh
ares
hel
d by
Fin
anci
al I
nstit
utio
ns
21.6
6225
.435
0.00
00.
000
-0.2
390.
000
%Sh
ares
hel
d by
Bor
kera
ge F
irms
0.89
51.
266
0.00
00.
000
-0.2
190.
000
%Sh
ares
hel
d by
Oth
er C
orpo
rate
Sha
reho
lder
s 20
.691
28.0
410.
000
0.00
0-0
.141
0.00
0%
Shar
es h
eld
by F
orei
gn C
orpo
ratio
ns
11.9
4612
.635
0.04
90.
192
-0.0
660.
000
%Sh
ares
hel
d by
Ind
ivid
uals
and
oth
ers
42.7
4830
.326
0.00
00.
000
0.41
90.
000
Log
arith
m o
f M
arke
t Val
ue o
f E
quity
(in
Mil.
JP
Y)
10.4
2710
.909
0.00
00.
000
-0.1
970.
000
Boo
k-to
-Mar
ket (
%)
98.6
3589
.882
0.00
00.
000
0.07
20.
000
Net
Sal
es p
er E
mpl
oyee
(in
Mil.
JP
Y)
98.2
4614
3.24
70.
000
0.00
0-0
.167
0.00
0L
abor
Equ
ipm
ent R
atio
(in
Mil.
JP
Y)
30.3
6053
.531
0.00
00.
000
-0.1
720.
000
Ret
urn
on E
quity
(P
ast 5
year
Ave
rage
%)
5.14
23.
362
0.00
00.
000
0.09
60.
000
Ret
entio
n R
atio
(P
ast 5
yea
r A
vera
ge %
) 47
.691
43.1
200.
092
0.09
00.
053
0.00
2D
epen
denc
y on
Ban
k (%
) 84
.939
81.6
340.
000
0.00
00.
135
0.00
0D
ebt R
atio
(%
) 42
.866
51.7
060.
000
0.00
0-0
.254
0.00
0Fi
xed
Ase
et to
Equ
ity (
%)
111.
553
135.
294
0.00
00.
000
-0.1
990.
000
Fixe
d A
sset
to L
ong-
term
Cap
ital (
%)
77.9
8081
.973
0.00
00.
000
-0.1
120.
000
R&
D E
xpen
ditu
re to
Sal
es (
%)
1.54
31.
902
0.00
00.
000
-0.1
610.
000
Ave
rage
Sha
re-h
oldi
ngs
and
Fina
ncia
l Attr
ibut
eSp
earm
an R
ank
Cor
rela
tion
‘F
loat
ing
Sto
ck R
atio
’ is
defi
ned
as s
hare
s ow
ned
by th
e10
bigg
est s
hare
hold
ers
to th
e nu
mbe
r of
sha
res
issu
ed. ‘
Dep
ende
ncy
on B
ank’
is d
efin
ed
as (
shor
t ter
m b
ank
borr
owin
g pl
us lo
ng te
rm b
ank
borr
owin
g)/(
Inte
rest
bea
ring
deb
t).
Dat
a fo
r fi
nanc
ial f
igur
es a
re f
rom
the
Mar
ch f
isca
l ye
ar-e
nd a
nd th
e m
arke
t pri
ce is
fro
m J
une
30..
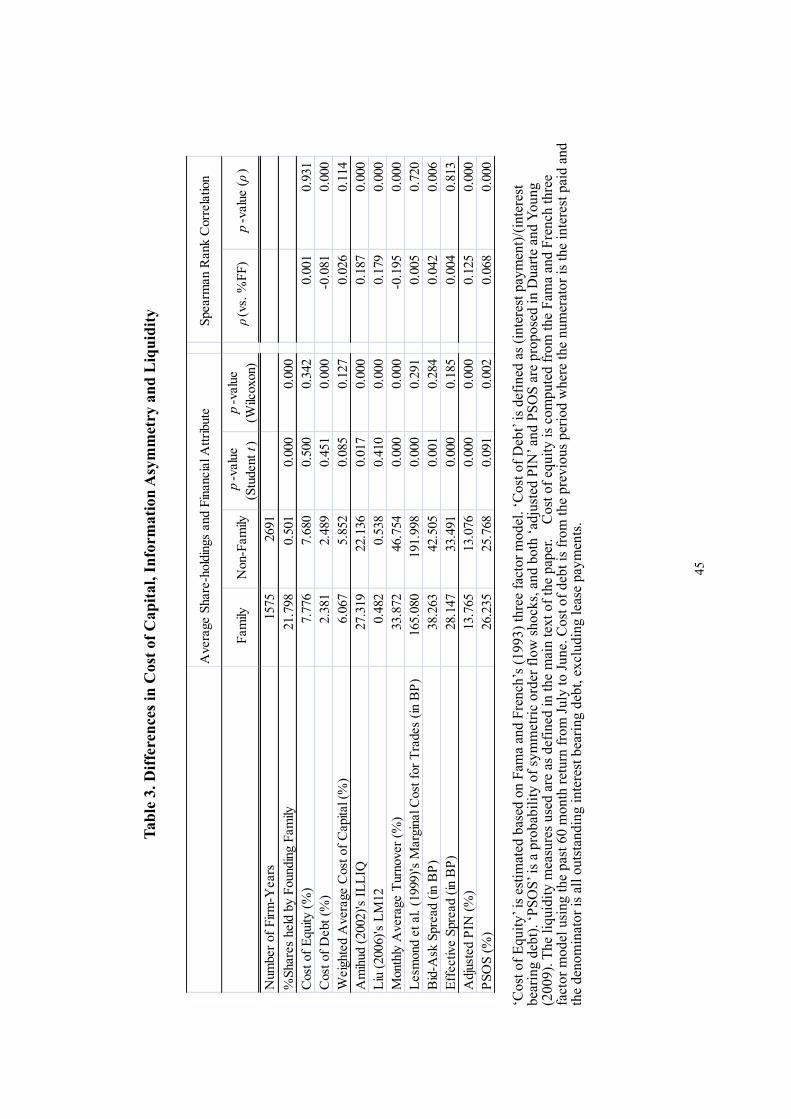
45
Tab
le 3
. Dif
fere
nce
s in
Cos
t of
Cap
ital
, Inf
orm
atio
n A
sym
met
ry a
nd
Liq
uid
ity
Ave
rage
Sha
re-h
oldi
ngs
and
Fina
ncia
l Attr
ibut
e
Fam
ily N
on-F
amily
p-v
alue
(Stu
dent
t)
p-v
alue
(Wilc
oxon
) ρ
(vs.
%FF
) p
-val
ue (ρ
)
Num
ber
of F
irm-Y
ears
15
7526
91
%Sh
ares
hel
d by
Fou
ndin
g Fa
mily
21
.798
0.50
10.
000
0.00
0
C
ost o
f E
quity
(%
) 7.
776
7.68
00.
500
0.34
20.
001
0.93
1C
ost o
f D
ebt (
%)
2.38
12.
489
0.45
10.
000
-0.0
810.
000
Wei
ghte
d A
vera
ge C
ost o
f C
apita
l (%
) 6.
067
5.85
20.
085
0.12
70.
026
0.11
4A
mih
ud (
2002
)'s I
LL
IQ
27.3
1922
.136
0.01
70.
000
0.18
70.
000
Liu
(20
06)'s
LM
12
0.48
20.
538
0.41
00.
000
0.17
90.
000
Mon
thly
Ave
rage
Tur
nove
r (%
) 33
.872
46.7
540.
000
0.00
0-0
.195
0.00
0L
esm
ond
et a
l. (1
999)
's M
argi
nal C
ost f
or T
rade
s (in
BP
)16
5.08
019
1.99
80.
000
0.29
10.
005
0.72
0B
id-A
sk S
prea
d (in
BP
) 38
.263
42.5
050.
001
0.28
40.
042
0.00
6E
ffec
tive
Spre
ad (
in B
P)
28.1
4733
.491
0.00
00.
185
0.00
40.
813
Adj
uste
d P
IN (
%)
13.7
6513
.076
0.00
00.
000
0.12
50.
000
PSO
S (%
) 26
.235
25.7
680.
091
0.00
20.
068
0.00
0
Spea
rman
Ran
k C
orre
latio
n
‘C
ost o
f E
quit
y’ is
est
imat
ed b
ased
on
Fam
a an
d F
renc
h’s
(199
3) th
ree
fact
or m
odel
. ‘C
ost o
f D
ebt’
is d
efin
ed a
s (i
nter
est p
aym
ent)
/(in
tere
st
bear
ing
debt
). ‘
PS
OS
’ is
a pr
obab
ility
of
sym
met
ric
orde
r fl
ow s
hock
s, a
nd b
oth
‘adj
uste
d P
IN’ a
nd P
SO
S a
re p
ropo
sed
in D
uart
e an
d Y
oung
(2
009)
. The
liqu
idity
mea
sure
s us
ed a
re a
s de
fine
d in
the
mai
n te
xt o
f th
e pa
per.
Cos
t of
equi
ty is
com
pute
d fr
om th
e F
ama
and
Fre
nch
thre
e fa
ctor
mod
el u
sing
the
past
60
mon
th r
etur
n fr
om J
uly
to J
une.
Cos
t of
debt
is f
rom
the
prev
ious
per
iod
whe
re th
e nu
mer
ator
is th
e in
tere
st p
aid
and
the
deno
min
ator
is a
ll o
utst
andi
ng in
tere
st b
eari
ng d
ebt,
excl
udin
g le
ase
paym
ents
.
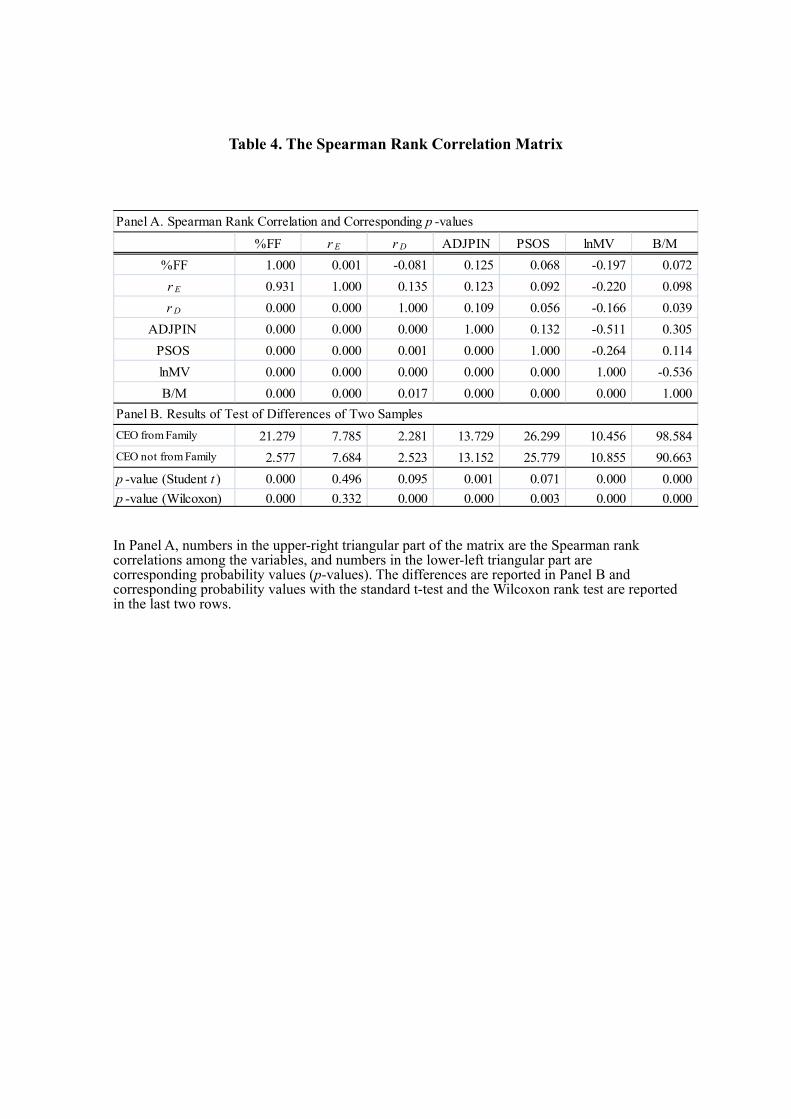
Table 4. The Spearman Rank Correlation Matrix
%FF r E r D ADJPIN PSOS lnMV B/M
%FF 1.000 0.001 -0.081 0.125 0.068 -0.197 0.072
r E 0.931 1.000 0.135 0.123 0.092 -0.220 0.098
r D 0.000 0.000 1.000 0.109 0.056 -0.166 0.039
ADJPIN 0.000 0.000 0.000 1.000 0.132 -0.511 0.305
PSOS 0.000 0.000 0.001 0.000 1.000 -0.264 0.114
lnMV 0.000 0.000 0.000 0.000 0.000 1.000 -0.536
B/M 0.000 0.000 0.017 0.000 0.000 0.000 1.000
CEO from Family 21.279 7.785 2.281 13.729 26.299 10.456 98.584
CEO not from Family 2.577 7.684 2.523 13.152 25.779 10.855 90.663
p -value (Student t ) 0.000 0.496 0.095 0.001 0.071 0.000 0.000
p -value (Wilcoxon) 0.000 0.332 0.000 0.000 0.003 0.000 0.000
Panel A. Spearman Rank Correlation and Corresponding p -values
Panel B. Results of Test of Differences of Two Samples
In Panel A, numbers in the upper-right triangular part of the matrix are the Spearman rank correlations among the variables, and numbers in the lower-left triangular part are corresponding probability values (p-values). The differences are reported in Panel B and corresponding probability values with the standard t-test and the Wilcoxon rank test are reported in the last two rows.
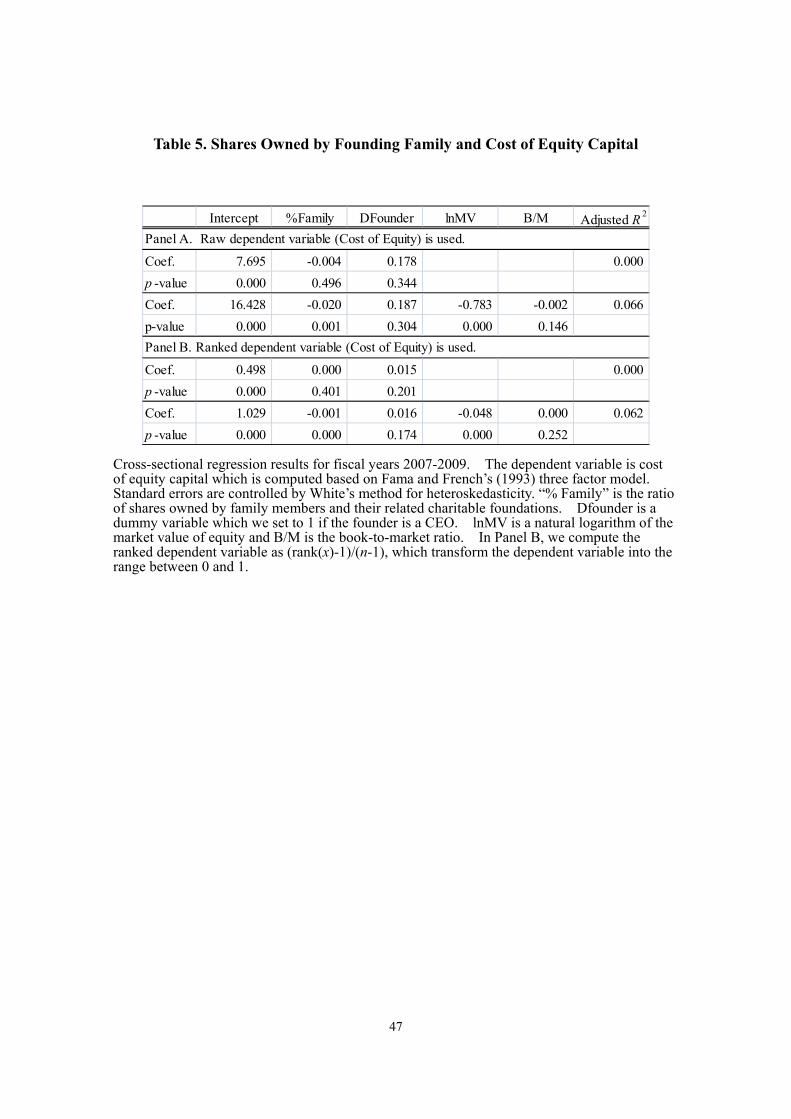
47
Table 5. Shares Owned by Founding Family and Cost of Equity Capital
Intercept %Family DFounder lnMV B/M Adjusted R2
Coef. 7.695 -0.004 0.178 0.000
p -value 0.000 0.496 0.344
Coef. 16.428 -0.020 0.187 -0.783 -0.002 0.066
p-value 0.000 0.001 0.304 0.000 0.146
Coef. 0.498 0.000 0.015 0.000
p -value 0.000 0.401 0.201
Coef. 1.029 -0.001 0.016 -0.048 0.000 0.062
p -value 0.000 0.000 0.174 0.000 0.252
Panel A. Raw dependent variable (Cost of Equity) is used.
Panel B. Ranked dependent variable (Cost of Equity) is used.
Cross-sectional regression results for fiscal years 2007-2009. The dependent variable is cost of equity capital which is computed based on Fama and French’s (1993) three factor model. Standard errors are controlled by White’s method for heteroskedasticity. “% Family” is the ratio of shares owned by family members and their related charitable foundations. Dfounder is a dummy variable which we set to 1 if the founder is a CEO. lnMV is a natural logarithm of the market value of equity and B/M is the book-to-market ratio. In Panel B, we compute the ranked dependent variable as (rank(x)-1)/(n-1), which transform the dependent variable into the range between 0 and 1.
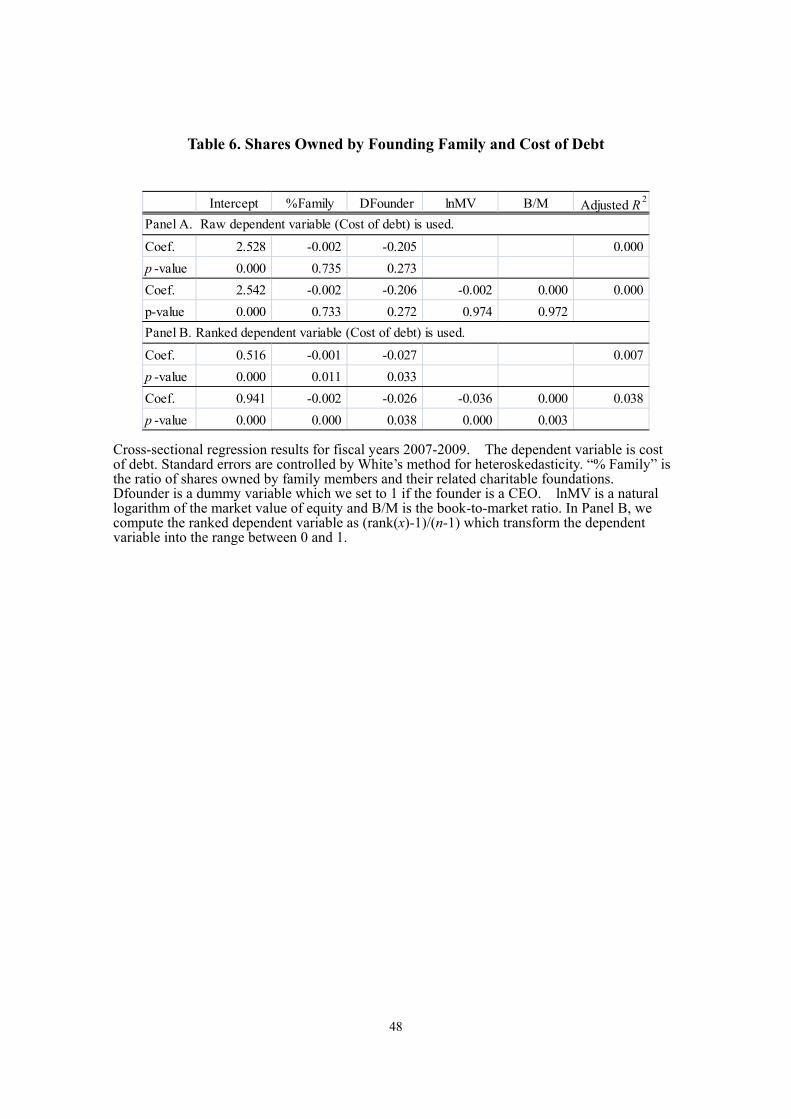
48
Table 6. Shares Owned by Founding Family and Cost of Debt
Intercept %Family DFounder lnMV B/M Adjusted R2
Coef. 2.528 -0.002 -0.205 0.000
p -value 0.000 0.735 0.273
Coef. 2.542 -0.002 -0.206 -0.002 0.000 0.000
p-value 0.000 0.733 0.272 0.974 0.972
Coef. 0.516 -0.001 -0.027 0.007
p -value 0.000 0.011 0.033
Coef. 0.941 -0.002 -0.026 -0.036 0.000 0.038
p -value 0.000 0.000 0.038 0.000 0.003
Panel A. Raw dependent variable (Cost of debt) is used.
Panel B. Ranked dependent variable (Cost of debt) is used.
Cross-sectional regression results for fiscal years 2007-2009. The dependent variable is cost of debt. Standard errors are controlled by White’s method for heteroskedasticity. “% Family” is the ratio of shares owned by family members and their related charitable foundations. Dfounder is a dummy variable which we set to 1 if the founder is a CEO. lnMV is a natural logarithm of the market value of equity and B/M is the book-to-market ratio. In Panel B, we compute the ranked dependent variable as (rank(x)-1)/(n-1) which transform the dependent variable into the range between 0 and 1.
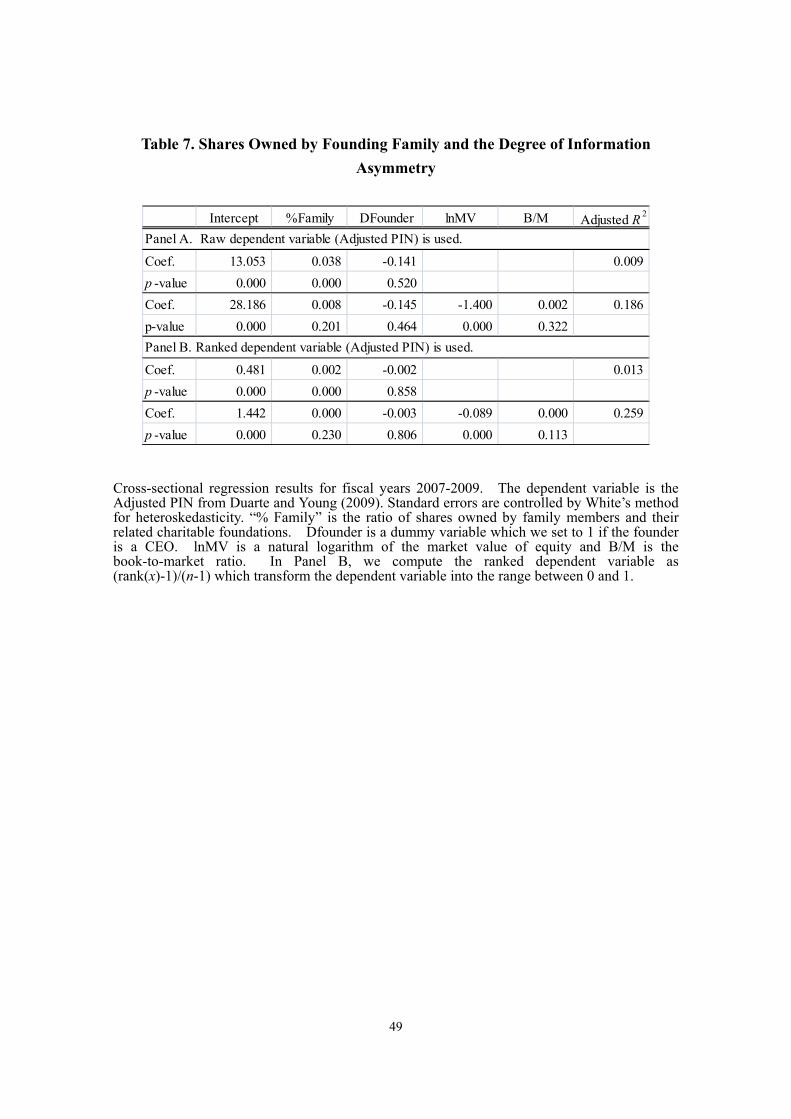
49
Table 7. Shares Owned by Founding Family and the Degree of Information
Asymmetry
Intercept %Family DFounder lnMV B/M Adjusted R2
Coef. 13.053 0.038 -0.141 0.009
p -value 0.000 0.000 0.520
Coef. 28.186 0.008 -0.145 -1.400 0.002 0.186
p-value 0.000 0.201 0.464 0.000 0.322
Coef. 0.481 0.002 -0.002 0.013
p -value 0.000 0.000 0.858
Coef. 1.442 0.000 -0.003 -0.089 0.000 0.259
p -value 0.000 0.230 0.806 0.000 0.113
Panel A. Raw dependent variable (Adjusted PIN) is used.
Panel B. Ranked dependent variable (Adjusted PIN) is used.
Cross-sectional regression results for fiscal years 2007-2009. The dependent variable is the Adjusted PIN from Duarte and Young (2009). Standard errors are controlled by White’s method for heteroskedasticity. “% Family” is the ratio of shares owned by family members and their related charitable foundations. Dfounder is a dummy variable which we set to 1 if the founder is a CEO. lnMV is a natural logarithm of the market value of equity and B/M is the book-to-market ratio. In Panel B, we compute the ranked dependent variable as (rank(x)-1)/(n-1) which transform the dependent variable into the range between 0 and 1.
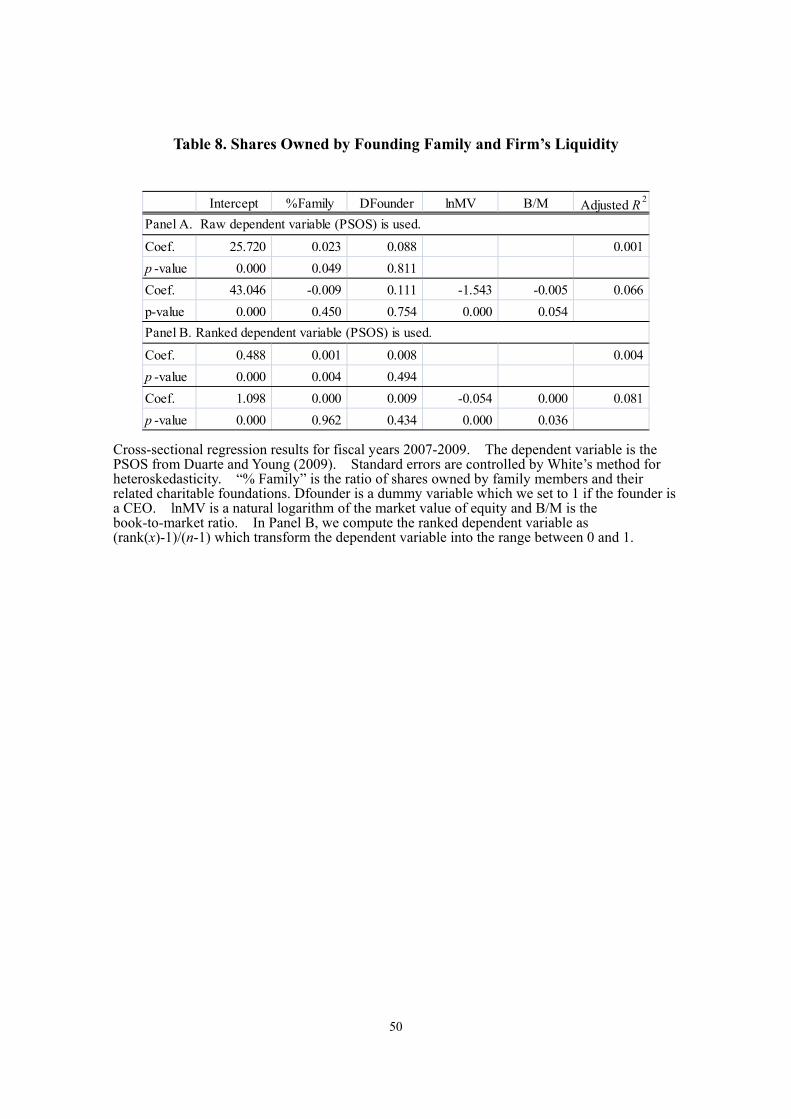
50
Table 8. Shares Owned by Founding Family and Firm’s Liquidity
Intercept %Family DFounder lnMV B/M Adjusted R2
Coef. 25.720 0.023 0.088 0.001
p -value 0.000 0.049 0.811
Coef. 43.046 -0.009 0.111 -1.543 -0.005 0.066
p-value 0.000 0.450 0.754 0.000 0.054
Coef. 0.488 0.001 0.008 0.004
p -value 0.000 0.004 0.494
Coef. 1.098 0.000 0.009 -0.054 0.000 0.081
p -value 0.000 0.962 0.434 0.000 0.036
Panel A. Raw dependent variable (PSOS) is used.
Panel B. Ranked dependent variable (PSOS) is used.
Cross-sectional regression results for fiscal years 2007-2009. The dependent variable is the PSOS from Duarte and Young (2009). Standard errors are controlled by White’s method for heteroskedasticity. “% Family” is the ratio of shares owned by family members and their related charitable foundations. Dfounder is a dummy variable which we set to 1 if the founder is a CEO. lnMV is a natural logarithm of the market value of equity and B/M is the book-to-market ratio. In Panel B, we compute the ranked dependent variable as (rank(x)-1)/(n-1) which transform the dependent variable into the range between 0 and 1.