Embed Size (px)
Citation preview
Market Intellect
Sector Disruptors: 2017 Winners and Losers Post-Election
Kenneth M. Leon Global Director CFRA (1) 212-438-4638 [email protected]
Scott H. Kessler Deputy Global Director CFRA (1) 212-438-9528 [email protected]
Over two years, the Sector Disruptors series has become a differentiated source of sector and
stock research. Multiple times a year, S&P Capital IQ Equity Research examines a major theme
across each of the 11 economic sectors, and offers opinions on related issues and potentially
impacted companies.
Although many author thematic research, we think few address it as comprehensively and
regularly as our Sector Disruptors series, with its thoughtful emphasis on an experienced
analysis of sectors.
Since December 2014, S&P Capital IQ Equity Research has written about a number of themes,
including infrastructure (May 2015), investor activism (July 2015), buybacks and dividends
(October 2015), and the U.S. presidential election (June 2016).
Now it’s time to recap our 2016 predictions (see “Sector Disruptors: 2016 Winners and Losers,”
published January 27, 2016) and offer some thoughts about 2017. Given the potential impact of
the results of the U.S. elections, most notably Donald Trump’s surprise win in the presidential
race, much of our analysis focuses on possible related implications.
For 2016, we anticipated various disruptors that played out during the year, including:
• Dividend cuts by large-cap energy companies
• High drug prices as a key topic of debate and influence during a presidential election year
• Technology companies becoming more aggressive with ample capital
• Increasing adoption of leasing programs by U.S. wireless carriers
For 2017, we asked our analysts to provide important new sector themes, which include:
• Efforts to “repeal and replace” the Affordable Care Act affecting the health care sector
• Infrastructure spending aiding demand across the materials sector
• Easing regulations for financials firms and potential asset sales by big banks
• More defense spending by the federal government
• Potential repatriation of foreign earnings by big technology companies
• Trade protectionism impacting auto manufacturers and related companies
Thank you for reading and here's to a healthy, happy, and prosperous 2017.
December 5, 2016
2
Consumer Discretionary Tuna N. Amobi, CFA, CPA and Efraim Levy, CFA
2016 Review
For 2016, we predicted that the millennial generation would become an increasingly disruptive demographic and economic
force. With rising influence and uncanny technological ability, this cohort was expected to increasingly assert its influence in
both politics and the economy, with 2016 posited as a critical inflection point.
Ultimately, 2016 has indeed proven to be a seminal year for millennials, whose burgeoning spending power helped drive the
U.S. economic expansion. Consumer discretionary companies further sharpened their targeted marketing campaigns for
millennials in 2016. By all indications, the millennial generation also asserted its growing political awareness through its
relatively active participation in several key primary and general campaigns during the 2016 U.S. election cycle.
2017 Disruptor: Trade Protectionism
Given President-elect Donald Trump’s surprising victory and the Republican majority in both houses of Congress, we see the
threat of U.S. protectionist trade policies against some of its largest trading partners as having broad economic and
investment implications. More specifically, potential trade and/or tariffs legislation could be highly disruptive for some
notable constituents of the consumer discretionary sector.
In recent years, trade protectionism has become an increasingly contentious issue in bilateral and multilateral relations. The
35% tariff on the import of Chinese tires imposed by President Obama prompted retaliation by China against U.S. auto
products (and poultry)--triggering a trade dispute that was subsequently adjudicated by the World Trade Organization
(WTO).
Why 2017?
During his presidential campaign, Mr. Trump threatened tariffs of up to 45% on all Chinese imports, and up to 35% on vehicle
imports from Mexico. Along those lines, Mr. Trump has also railed against the North American Free Trade Agreement
(NAFTA), prompted by the relocation of certain U.S. automotive manufacturing operations to Mexico, and he has also heavily
criticized the proposed Trans-Pacific Partnership (TPP), another lightning rod for lawmakers on both sides of the aisle.
With his inauguration scheduled for January 20, 2017, Mr. Trump’s proposed agenda for his first 100 days in office includes,
among other issues, trade measures such as renegotiating (or withdrawing from) NAFTA, withdrawing from the TPP, and
officially labeling China as a currency manipulator.
Impact
While the actual extent and/or consequences of these protectionist actions are still unclear, their potential ramifications
cannot be overstated. For certain consumer discretionary companies, these include higher manufacturing input costs, margin
compression, and reduced export competitiveness against foreign rivals.
Importantly, China is the largest trading partner for the U.S., which imported about $483 billion of Chinese goods in 2015,
more than quadruple its exports to China of $116 billion, according to the U.S. Commerce Department. Of note, the top U.S.
import categories include home furnishings, toys and footwear, and automobiles.
Mexico has risen to become the third largest U.S. trading partner, exporting about $296 billion of goods to the U.S. in 2015,
versus $236 billion of imports from the U.S. Crucially, automobiles are the top U.S. import from Mexico, and the third largest
export category.
3
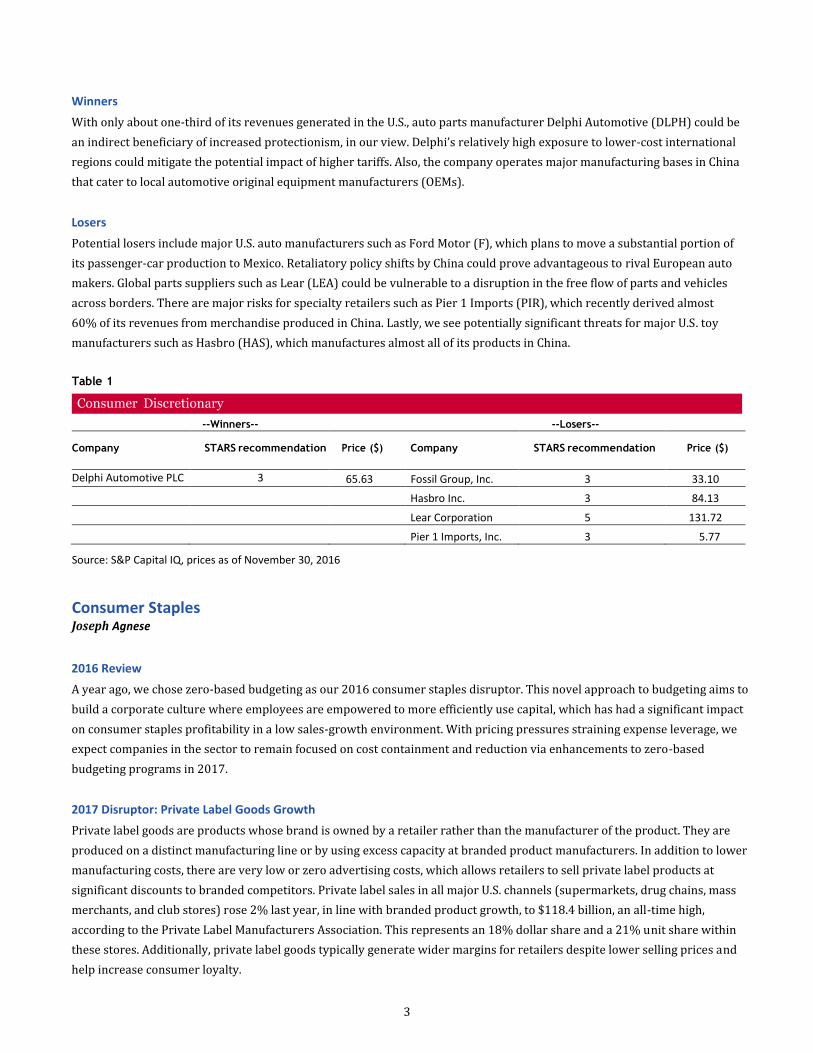
Winners
With only about one-third of its revenues generated in the U.S., auto parts manufacturer Delphi Automotive (DLPH) could be
an indirect beneficiary of increased protectionism, in our view. Delphi’s relatively high exposure to lower-cost international
regions could mitigate the potential impact of higher tariffs. Also, the company operates major manufacturing bases in China
that cater to local automotive original equipment manufacturers (OEMs).
Losers
Potential losers include major U.S. auto manufacturers such as Ford Motor (F), which plans to move a substantial portion of
its passenger-car production to Mexico. Retaliatory policy shifts by China could prove advantageous to rival European auto
makers. Global parts suppliers such as Lear (LEA) could be vulnerable to a disruption in the free flow of parts and vehicles
across borders. There are major risks for specialty retailers such as Pier 1 Imports (PIR), which recently derived almost
60% of its revenues from merchandise produced in China. Lastly, we see potentially significant threats for major U.S. toy
manufacturers such as Hasbro (HAS), which manufactures almost all of its products in China.
Table 1
Consumer Discretionary
--Winners-- --Losers-- Company
STARS recommendation
Price ($)
Company
STARS recommendation
Price ($)
Delphi Automotive PLC
3
65.63 Fossil Group, Inc. 3 33.10
Hasbro Inc. 3 84.13
Lear Corporation 5 131.72
Pier 1 Imports, Inc. 3 5.77
Source: S&P Capital IQ, prices as of November 30, 2016
Consumer Staples Joseph Agnese
2016 Review
A year ago, we chose zero-based budgeting as our 2016 consumer staples disruptor. This novel approach to budgeting aims to
build a corporate culture where employees are empowered to more efficiently use capital, which has had a significant impact
on consumer staples profitability in a low sales-growth environment. With pricing pressures straining expense leverage, we
expect companies in the sector to remain focused on cost containment and reduction via enhancements to zero-based
budgeting programs in 2017.
2017 Disruptor: Private Label Goods Growth
Private label goods are products whose brand is owned by a retailer rather than the manufacturer of the product. They are
produced on a distinct manufacturing line or by using excess capacity at branded product manufacturers. In addition to lower
manufacturing costs, there are very low or zero advertising costs, which allows retailers to sell private label products at
significant discounts to branded competitors. Private label sales in all major U.S. channels (supermarkets, drug chains, mass
merchants, and club stores) rose 2% last year, in line with branded product growth, to $118.4 billion, an all-time high,
according to the Private Label Manufacturers Association. This represents an 18% dollar share and a 21% unit share within
these stores. Additionally, private label goods typically generate wider margins for retailers despite lower selling prices and
help increase consumer loyalty.
4
Over the past decade, private label products have seen significant increases in quality and greatly improved packaging. The
best performing retailers provide tiered offerings, with good, better, and best quality and pricing levels to serve varying
consumer preferences.
Why 2017?
While private label has historically seen its best growth in weak economic environments as consumers seek to save money by
trading down to lower-priced goods, we think the operating environment in 2017 is ripe for an acceleration in private label
growth. Given significant food retail pricing pressures, reflecting Wal-Mart Stores’ (WMT, the largest grocer in the U.S.) plan
to accelerate price cuts, a prolonged deflationary environment in food retailing, and the planned expansion of formats that
either wholly or predominately carry private label goods, we think food retailers will devote more shelf space to private label
products in 2017.
Impact
We foresee broad-based impacts from stronger private label growth across sub-industries, with most manufacturers of
household products and packaged foods facing adverse pricing and margin pressure, and benefits for food retailers and food
distributors who plan to expand both shelf space and own-manufacturing. Beverage producers are expected to be negatively
impacted as well, due to an ongoing shift in product portfolios to non-carbonated categories such as bottled water that have
limited consumer brand loyalty and strong private label competition.
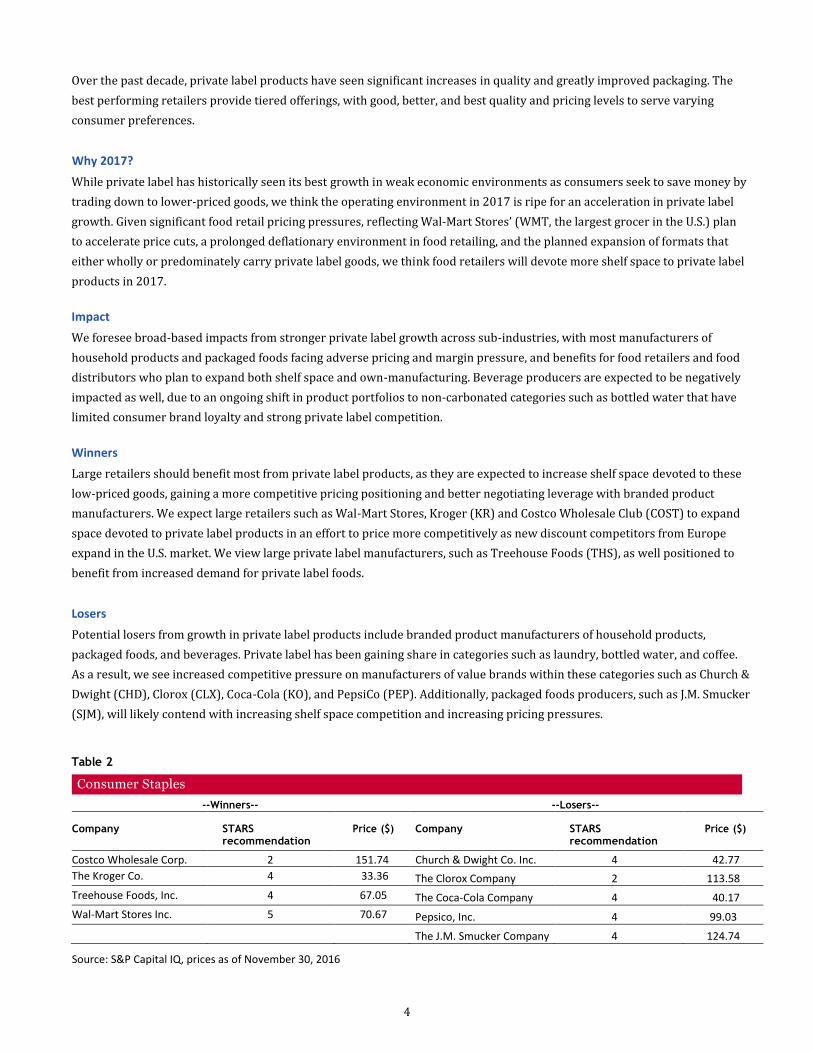
Winners
Large retailers should benefit most from private label products, as they are expected to increase shelf space devoted to these
low-priced goods, gaining a more competitive pricing positioning and better negotiating leverage with branded product
manufacturers. We expect large retailers such as Wal-Mart Stores, Kroger (KR) and Costco Wholesale Club (COST) to expand
space devoted to private label products in an effort to price more competitively as new discount competitors from Europe
expand in the U.S. market. We view large private label manufacturers, such as Treehouse Foods (THS), as well positioned to
benefit from increased demand for private label foods.
Losers
Potential losers from growth in private label products include branded product manufacturers of household products,
packaged foods, and beverages. Private label has been gaining share in categories such as laundry, bottled water, and coffee.
As a result, we see increased competitive pressure on manufacturers of value brands within these categories such as Church &
Dwight (CHD), Clorox (CLX), Coca-Cola (KO), and PepsiCo (PEP). Additionally, packaged foods producers, such as J.M. Smucker
(SJM), will likely contend with increasing shelf space competition and increasing pricing pressures.
Table 2
Consumer Staples
--Winners-- --Losers-- Company
STARS recommendation
Price ($)
Company
STARS recommendation
Price ($)
Costco Wholesale Corp.
2 151.74 Church & Dwight Co. Inc. 4 42.77
The Kroger Co. 4 33.36 The Clorox Company 2 113.58
Treehouse Foods, Inc. 4 67.05 The Coca-Cola Company 4 40.17
Wal-Mart Stores Inc. 5 70.67 Pepsico, Inc. 4 99.03
The J.M. Smucker Company 4 124.74
Source: S&P Capital IQ, prices as of November 30, 2016
5
Energy Stewart Glickman, CFA
2016 Review In our 2016 forecast, we identified dividend cuts as a likely disruptor in the energy sector. Actual results over the last year
were mixed. The two losers we identified, Anadarko Petroleum (APC) and Murphy Oil (MUR), both trimmed their quarterly
dividends in 2016, albeit by different degrees. In the first quarter of 2016, Anadarko slashed its dividend by 81% to a mere
$0.05 per quarter, from $0.27 per quarter prior. We think this places the company on more manageable financial footing and
we subsequently upgraded our opinion on the shares. Murphy, on the other hand, opted for a smaller dividend cut, just 29%,
to $0.25 per share from $0.35, in the third quarter of 2016. The revised annualized dividend of $1.00 per share is still onerous
in our view, since it dwarfs projected earnings in each of 2016, 2017 and 2018, based on current consensus estimates from
Capital IQ, and we now have a negative opinion on the shares.
Meanwhile, among the prospective winners, we went two-for-three. Of our three chosen winners, ExxonMobil (XOM) raised
its quarterly dividend by $0.02 to $0.75 per share, while another, Valero Energy (VLO), boosted its quarterly dividend by
$0.10 to $0.60 per share. However, our other prospective winner, ConocoPhillips (COP), actually slashed its quarterly
dividend by 66% in the first quarter of 2016, to $0.25 per share from $0.74 prior. We were surprised by COP’s move given
management’s stated conviction about the importance of the dividend but, in retrospect, high dividend payout ratios became
unsustainable for the company.
2017 Disruptor: Renewable Fuel Regulations
The downstream end of the energy value chain – oil and gas refining – is a minor contributor to the sector in terms of market
capitalization, but it will likely feel the strongest impact from President-Elect Trump’s victory in November. The oil and gas
refining and marketing sub-industry comprised just 7.7% of the market capitalization of the S&P 1500 energy sector as of
November 30, 2016. This sub-industry includes the “pure-play” refiners such as Valero Energy and Tesoro (TSO), companies
that make their living by turning crude oil into refined products such as gasoline, diesel and heating oil, but do not have
upstream operations. Companies that have both upstream and downstream operations are known as “integrated oils” and
include mainly behemoths such as ExxonMobil and Chevron (CVX), which dominate the energy landscape. Currently, the
refining industry must meet certain Environmental Protection Agency (EPA) regulations, including the Renewable Fuel
Standard (RFS). Under the RFS, refiners must either themselves manufacture and blend renewable fuels, such as ethanol, into
their various fuel types, or purchase the renewable fuels from another party. Whichever party creates the renewable fuels
generates a credit known as a Renewable Identification Number (RIN) and these RINs are bought and sold within the refining
industry. The inventories of renewable fuels can also be stored, creating an inventory of RINs. If RIN prices rise, those who
must purchase them will be paying more to satisfy their obligations.
Why 2017?
Given that RFS is driven by regulations, a change in Federal government opens the door for a change in regulations. While the
incoming president has not been especially specific about his Administration’s plans for the energy sector, we note that he is a
self-described non-believer in man-made climate change. As a result, we do not expect him to maintain the current approach
to energy regulation, particularly as it relates to renewable fuels.
Industry research firm Turner, Mason & Co. noted in September that RIN prices have been on the rise in 2016, led by a
shrinking RIN inventory and rising renewable volume obligations (RWO), the total number of gallons that a given refiner is
required to purchase. Essentially, the dollar obligation for any given refiner is simply determined by the price per RIN and the
RWO, both of which have been increasing. Under current regulations, the total amount of renewable fuels that must be
blended into refined products is expected to rise, unless the EPA changes its policies. We think there is a reasonable
6
possibility that Trump administration will significantly cut the RWO requirements going forward, which would be a boon for
independent refiners.
Progressive Fuels Limited, an industry data provider, notes that the price of RINs for 2016 has risen to category D6, the
largest category of RIN requirements, from the mid-$0.60 per gallon range at the beginning of the year to roughly $1.00 per
gallon recently. With a total U.S. obligation of roughly 18 billion gallons of renewable fuels to blend into the fuel supply, this
adds up.
Impact
Individual companies face different regulatory demands depending on how many gallons of unblended fuel that they produce.
However, RIN requirements have clearly increased over time. Valero Energy, for example, spent $440 million on its RIN
obligations in 2015, up from $372 million in 2014; through the first nine months of 2016, it spent $532 million, on pace for
approximately $700 million this year. Valero is projected to earn $5.0 billion in EBITDA this year, according to consensus
estimates from Capital IQ. In other words, projected RIN obligations (assuming RIN prices remain flat) amount to more than
14% of projected EBITDA.
It is worth comparing the extent to which publicly-traded refiners are either net buyers or net sellers of RINs with way their
shares traded on the day after the surprise Trump victory. For the net buyers of RINs, which are estimated to spend in excess
of 20% of EBITDA on RINs, the first post-election trading day saw an average 14.6% increase in share price. By contrast,
refiners with projected RIN spending totaling less than 20% of EBITDA (or don’t break out their RIN expenses at all) saw an
average increase in share price of just 6.3%. Meanwhile, companies that produce alternative fuels and are typically net sellers
of RINs saw their average share prices decline 1.3%.
Certainly, there are important unknowns for the energy sector going forward. We do not know who the new Energy Secretary
will be, and President Trump will eventually be more specific about his plans for alternative energy. Nonetheless, given his
apparent lack of enthusiasm over climate change and a lack of emphasis on moving away from fossil fuels, we would not be
surprised to see the relevant regulations shift in favor of fossil fuel refiners.
Winners
Prospective winners include oil and gas refiners that have been observed recently spending a relatively high percentage of
EBITDA on RINs. By definition, this list excludes refiners whose financial filings do not break out the cost of RIN expenses,
since it is impossible for us to determine the extent to which RIN expenses are meaningful. That said, the prospective winners
all have projected 2016 RINs expenses comprising at least 20% of projected 2016 EBITDA, including CVR Energy (CVR), Alon
USA Energy (ALJ), HollyFrontier (HFC), Calumet Specialty Products Partners LP (CLMT), and Delek US Holdings (DK).
Losers
The potential losers from a reduction or elimination of RVO obligations would include firms which produce renewable fuels
and earn RIN credits they can sell. Note that several of these firms are in fact integrated oils, such as Royal Dutch Shell
(RDS.A), BP plc (BP) and Chevron, all of which were cited in an October 2016 Wall Street Journal article as beneficiaries of
rising RIN prices. The other class of potential losers includes pure-play firms engaged in manufacturing of alternative fuels,
such as Renewable Energy Group (REGI) and Pacific Ethanol (PEIX).
7
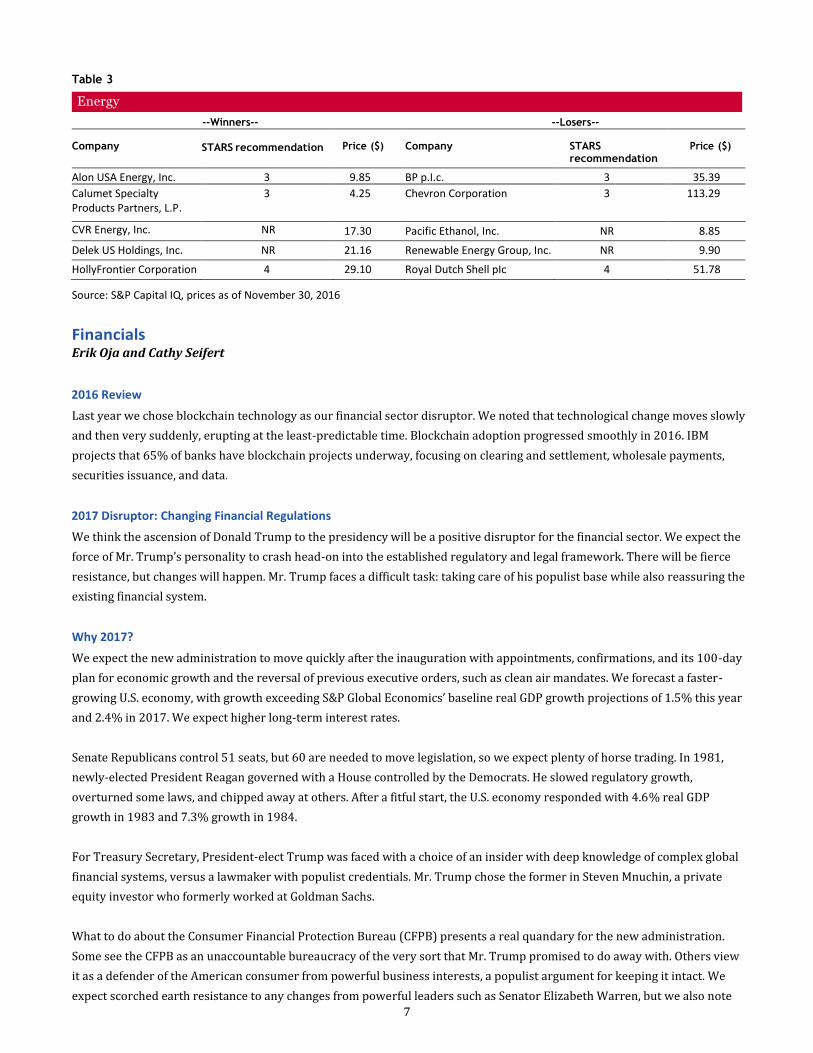
Table 3
Energy
--Winners-- --Losers-- Company
STARS recommendation
Price ($)
Company
STARS recommendation
Price ($)
Alon USA Energy, Inc. 3 9.85 BP p.I.c. 3 35.39
Calumet Specialty Products Partners, L.P.
3 4.25 Chevron Corporation 3 113.29
CVR Energy, Inc.
NR
17.30 Pacific Ethanol, Inc. NR 8.85
Delek US Holdings, Inc. NR 21.16 Renewable Energy Group, Inc. NR 9.90
HollyFrontier Corporation 4 29.10 Royal Dutch Shell pIc 4 51.78
Source: S&P Capital IQ, prices as of November 30, 2016
Financials Erik Oja and Cathy Seifert
2016 Review
Last year we chose blockchain technology as our financial sector disruptor. We noted that technological change moves slowly
and then very suddenly, erupting at the least-predictable time. Blockchain adoption progressed smoothly in 2016. IBM
projects that 65% of banks have blockchain projects underway, focusing on clearing and settlement, wholesale payments,
securities issuance, and data.
2017 Disruptor: Changing Financial Regulations
We think the ascension of Donald Trump to the presidency will be a positive disruptor for the financial sector. We expect the
force of Mr. Trump’s personality to crash head-on into the established regulatory and legal framework. There will be fierce
resistance, but changes will happen. Mr. Trump faces a difficult task: taking care of his populist base while also reassuring the
existing financial system.
Why 2017?
We expect the new administration to move quickly after the inauguration with appointments, confirmations, and its 100-day
plan for economic growth and the reversal of previous executive orders, such as clean air mandates. We forecast a faster-
growing U.S. economy, with growth exceeding S&P Global Economics’ baseline real GDP growth projections of 1.5% this year
and 2.4% in 2017. We expect higher long-term interest rates.
Senate Republicans control 51 seats, but 60 are needed to move legislation, so we expect plenty of horse trading. In 1981,
newly-elected President Reagan governed with a House controlled by the Democrats. He slowed regulatory growth,
overturned some laws, and chipped away at others. After a fitful start, the U.S. economy responded with 4.6% real GDP
growth in 1983 and 7.3% growth in 1984.
For Treasury Secretary, President-elect Trump was faced with a choice of an insider with deep knowledge of complex global
financial systems, versus a lawmaker with populist credentials. Mr. Trump chose the former in Steven Mnuchin, a private
equity investor who formerly worked at Goldman Sachs.
What to do about the Consumer Financial Protection Bureau (CFPB) presents a real quandary for the new administration.
Some see the CFPB as an unaccountable bureaucracy of the very sort that Mr. Trump promised to do away with. Others view
it as a defender of the American consumer from powerful business interests, a populist argument for keeping it intact. We
expect scorched earth resistance to any changes from powerful leaders such as Senator Elizabeth Warren, but we also note

8
that a recent court decision placed the CFPB under the direct control of the president. We predict CFPB Chief Richard Cordray
will depart in January, and that the nomination of a replacement will provide plenty of fireworks.
There is a long list of other potential regulatory changes that could improve the prospects of various precincts of the financial
sector. The Volcker Rule, which prohibits banks from holding and trading securities for their own profits, may be partially
relaxed. There is a broad grey area regarding what constitutes holdings needed for client liquidity. Banks have erred on the
side of caution, and have kept sparse inventories of securities, contributing to market volatility. We think banks with less than
$10 billion in assets may see a relaxation of Dodd-Frank reporting and compliance requirements. Investment managers,
retirement planners and life insurers, particularly those who compensate their sales employees per transaction, will benefit
from any delays or lifting of the Department of Labor’s Fiduciary Rule. Finally, insurance firms may see a rollback of their
designation as systemically important financial institutions (SIFIs), which currently forces them to hold higher liquidity, thus
limiting their ROE.
Impact
If the Volcker Rule is softened, we predict banks will hold higher inventories of securities, which would be a positive for
market liquidity. The largest insurance firms could be freed of their SIFI designations, aiding profitability and freeing them to
make acquisitions. Investment managers could continue in transaction-driven business lines. Smaller banks could see some
degree of freedom from the growth of banking regulations. Under the Trump administration, the CFPB would act less boldly,
allowing auto, credit card, and student loan lenders more leeway.
Winners
Regional banks such as Comerica (CMA) will likely be aided by a faster-growing economy. Banks like First Horizon Financial
(FHN) would be helped by a potential relaxation of the Volcker Rule. Consumer lenders such as Capital One Financial (COF)
would see less regulation of their sub-prime lending activities if the CFPB’s power is slightly diminished. For the handful of
insurers that were designated as SIFIs by Dodd-Frank, a repeal of this element of the act could be a positive factor if it
removes a degree of regulatory uncertainty. American International Group (AIG) and Prudential (PRU) would benefit.
Losers
We expect the Trump administration to attempt to assuage populist sentiments. This could drive up capital requirements for
the largest financial institutions. As a result, some may rethink their business models and sell off some assets or business
units. Large banks could divest asset management, commercial lending, capital markets, and consumer lending units. Bank of
America (BAC), JPMorgan Chase (JPM), Citigroup (C), and Wells Fargo (WFC) could potentially see a dilution of management
strength, higher transition costs, and a loss of cross-selling synergies under such a capital regime.
9
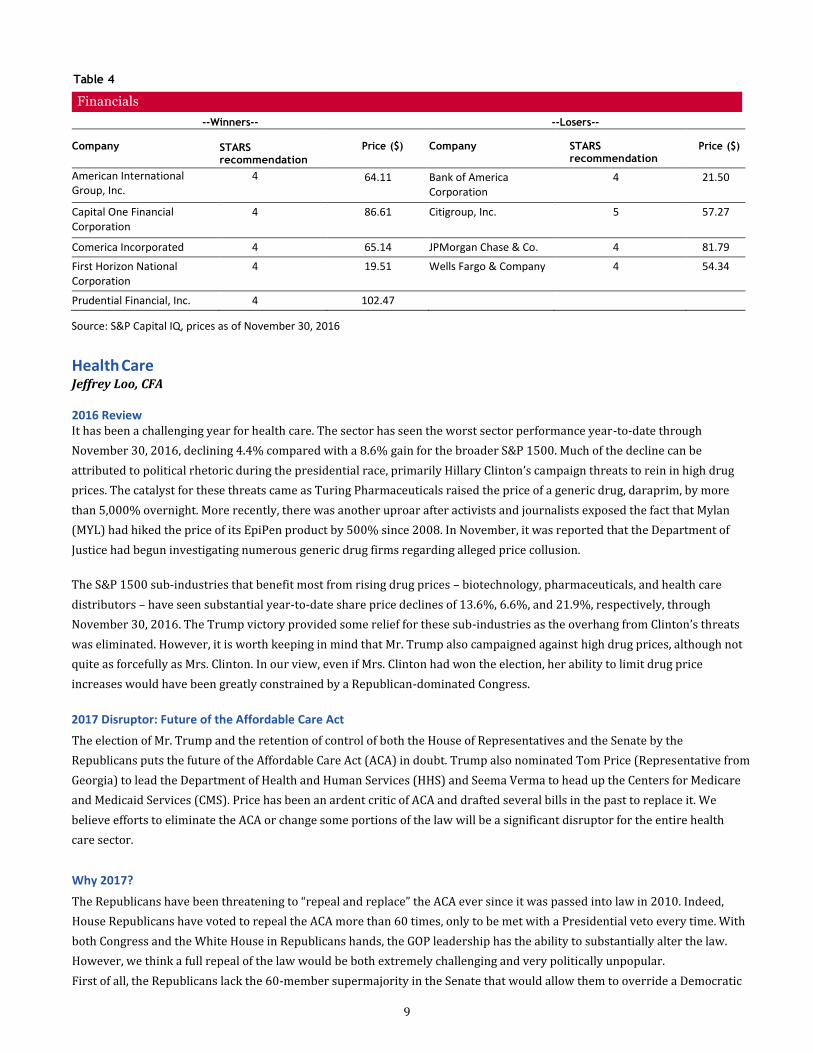
Table 4
Financials
--Winners-- --Losers-- Company
STARS recommendation
Price ($)
Company
STARS recommendation
Price ($)
American International Group, Inc.
4
64.11 Bank of America
Corporation 4 21.50
Capital One Financial Corporation
4 86.61 Citigroup, Inc. 5 57.27
Comerica Incorporated 4 65.14 JPMorgan Chase & Co. 4 81.79
First Horizon National Corporation
4 19.51 Wells Fargo & Company 4 54.34
Prudential Financial, Inc. 4 102.47
Source: S&P Capital IQ, prices as of November 30, 2016
Health Care Jeffrey Loo, CFA
2016 Review It has been a challenging year for health care. The sector has seen the worst sector performance year-to-date through
November 30, 2016, declining 4.4% compared with a 8.6% gain for the broader S&P 1500. Much of the decline can be
attributed to political rhetoric during the presidential race, primarily Hillary Clinton’s campaign threats to rein in high drug
prices. The catalyst for these threats came as Turing Pharmaceuticals raised the price of a generic drug, daraprim, by more
than 5,000% overnight. More recently, there was another uproar after activists and journalists exposed the fact that Mylan
(MYL) had hiked the price of its EpiPen product by 500% since 2008. In November, it was reported that the Department of
Justice had begun investigating numerous generic drug firms regarding alleged price collusion.
The S&P 1500 sub-industries that benefit most from rising drug prices – biotechnology, pharmaceuticals, and health care
distributors – have seen substantial year-to-date share price declines of 13.6%, 6.6%, and 21.9%, respectively, through
November 30, 2016. The Trump victory provided some relief for these sub-industries as the overhang from Clinton’s threats
was eliminated. However, it is worth keeping in mind that Mr. Trump also campaigned against high drug prices, although not
quite as forcefully as Mrs. Clinton. In our view, even if Mrs. Clinton had won the election, her ability to limit drug price
increases would have been greatly constrained by a Republican-dominated Congress.
2017 Disruptor: Future of the Affordable Care Act
The election of Mr. Trump and the retention of control of both the House of Representatives and the Senate by the
Republicans puts the future of the Affordable Care Act (ACA) in doubt. Trump also nominated Tom Price (Representative from
Georgia) to lead the Department of Health and Human Services (HHS) and Seema Verma to head up the Centers for Medicare
and Medicaid Services (CMS). Price has been an ardent critic of ACA and drafted several bills in the past to replace it. We
believe efforts to eliminate the ACA or change some portions of the law will be a significant disruptor for the entire health
care sector.
Why 2017?
The Republicans have been threatening to “repeal and replace” the ACA ever since it was passed into law in 2010. Indeed,
House Republicans have voted to repeal the ACA more than 60 times, only to be met with a Presidential veto every time. With
both Congress and the White House in Republicans hands, the GOP leadership has the ability to substantially alter the law.
However, we think a full repeal of the law would be both extremely challenging and very politically unpopular.
First of all, the Republicans lack the 60-member supermajority in the Senate that would allow them to override a Democratic
10
filibuster, which should effectively prevent them from being able to repeal the entire ACA. Second, repealing the law would
also eliminate several provisions that are popular with both Democrats and Republicans. These include allowing children up
to the age of 26 to remain on their parents’ insurance coverage; the elimination of annual and lifetime benefit caps; and the
requirement that insurers sell policies to anyone regardless of their health status.
Republicans will likely use a budgetary process called reconciliation, under which legislation may be passed with a simple
Senate majority of 51 votes, to target several ACA provisions they view unfavorably, including the individual mandate and the
Medicaid expansion, in our view. The individual mandate provides government subsidies that help about 13-14 million
Americans pay for health insurance while imposing a tax penalty to those who do not obtain insurance. The Medicaid
expansion has helped about seven million additional people get Medicaid coverage. Despite dozens of House votes to “repeal
and replace” the ACA, the Republicans have not presented any concrete plans to let these 20-21 million people retain health
insurance if the above provisions are eliminated. However, HHS-nominee Price has sponsored past legislation, including the
Empowering Patients First Act, which was intended to replace the ACA. Key components of this bill include providing tax
credits for the purchase of health insurance coverage and increasing health savings account (HSA) contribution limits.
The Medicaid expansion will likely be eliminated, in our view, since shrinking Medicaid is viewed favorably by most
Republicans. In one possible scenario, we see Republicans changing the current system of joint federal and state funding of an
entitlement program that guarantees coverage for all eligible citizens to one utilizing Medicaid block grants to states. Under
such a scenario, the federal government would provide each state with a block grant to pay for Medicaid coverage, providing
state governments with more flexibility in determining eligibility and benefits. Past Republican proposals, which the Obama
administration routinely rejected, include attaching a work requirement or other cost-sharing mechanism to obtain Medicaid
benefits.
The bigger challenge will be eliminating subsidies that help more than 13 million people obtain insurance. Removing the tax
penalty component of the individual mandate provision would be viewed positively, although it would likely lead to an
exodus of younger and healthier people from the insurance rolls. This would leave sicker patients as the ones paying for
insurance, which would adversely impact health insurers. Some Republicans have tossed around the idea of offering a tax
carrot to entice people to buy insurance. However, we think the elimination of the stick of tax penalties for not having
insurance would significantly reduce the total number of insured people.
One idea that Mr. Trump has championed is to allow insurers to sell insurance across state lines, based on the notion that it
would lead to increased competition and therefore better pricing and lower health care costs. The major insurance carriers
have not embraced this idea. Critics believe this idea would actually lead to higher costs because health care is “local”. This
means local insurance carriers enter into agreements with local health care providers (hospitals and physicians) by
promising them a healthy volume of patients in exchange for favorable rates. Providers agree to the preferential treatment
rates because they can count on having enough insured patients to support their practices. However, out-of-state insurance
carriers would not have the volume or the leverage to obtain favorable provider rates. Patients may be enticed by lower front-
end premiums offered by out-of-state insurance carriers, but their cost of treatment would be significantly higher.
Impact
Eliminating either the Medicaid expansion or the individual mandate, or both, would result in fewer insured patients. Keep in
mind, however, that any changes to the ACA would take time to pass and implement, perhaps up to two years. Nonetheless,
any Republican proposal to change or eliminate the individual mandate and/or the Medicaid Expansion will increase volatility
for the health care sector.
Winners
We do not see any clear winners if the individual mandate and/or Medicaid expansion is/are eliminated. We think the
potential of losing upwards of 20-22 million insured patients will likely result in lower health care utilization, resulting in
11
lower sales across the sector. On the other hand, fees and taxes paid by health care companies to help fund the ACA may also
potentially be eliminated, although that outcome is uncertain.
Losers
With the potential for fewer insured patients, we do not see any clear winners in the health care sector. Some taxes and fees
currently imposed on various sub-industries may be eliminated, but that outcome is very uncertain at this point.
Fewer people on the insurance rolls will drive lower utilization rates across the sector. We believe certain sub-industries such
as health care facilities, health care services, health care equipment (medical devices), and health insurers with a large
Medicaid clientele would likely see a more adverse impact. Uncompensated care rates would rise for hospitals and facilities.
Higher uncompensated care would drive more charity care, more bad debt, and steeper rate discounts, depressing revenue
and profits. Hospitals are the largest customers for medical devices; lower hospital profitability leads to lower demand; fewer
insured patients would lower demand for medical devices and health care services.
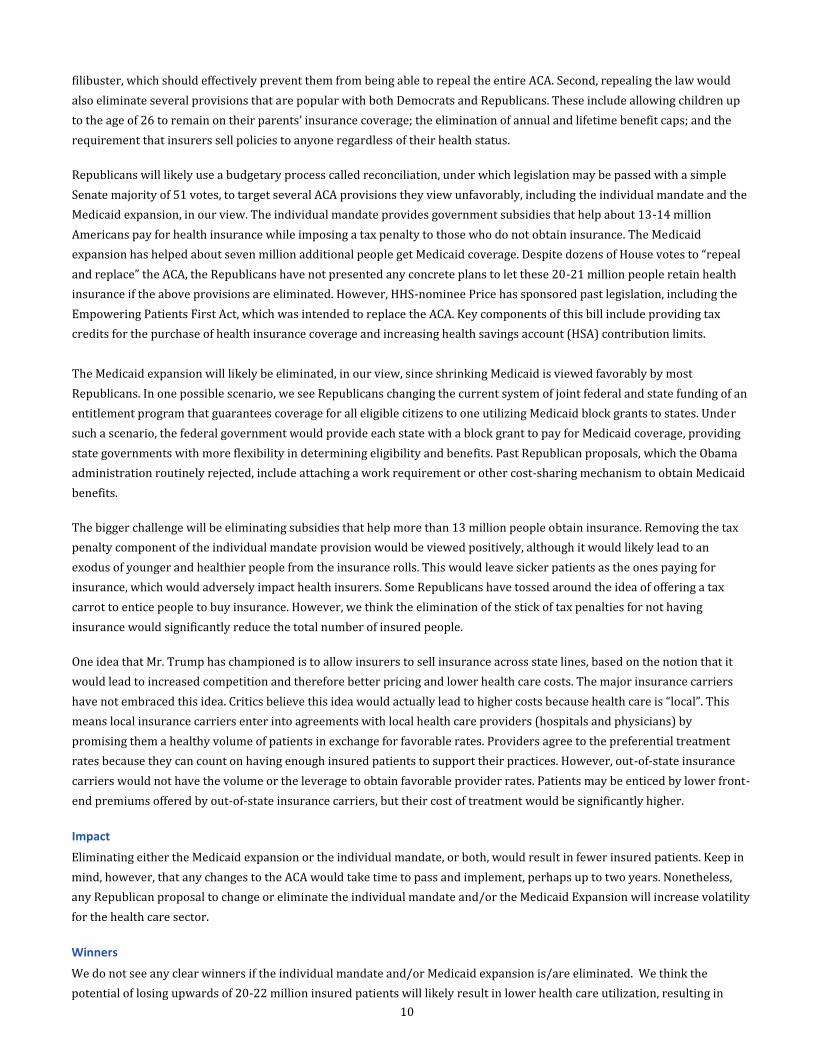
Table 5
Health Care
--Winners-- --Losers-- Company
STARS recommendation
Price ($)
Company
STARS recommendation
Price ($)
None Centene Corporation 3 57.95
Community Health Systems, Inc. 3 5.44
HCA Holdings, Inc. 3 71.20
Molina Healthcare, Inc. 3 52.69
Tenet Healthcare Corp. 3 15.18
WellCare Health Plans, Inc. 1 138.51
Source: S&P Capital IQ, prices as of November 30, 2016
Industrials Jim Corridore
2016 Review
We said higher infrastructure spending would be a major theme in 2016, as the presidential election would bring sharper
focus on the dire need to fix crumbling roads and bridges, expand electricity transmission lines, improve water treatment
facilities, extend oil and gas pipelines, and modernize airports. The Transportation Funding Act signed into law by President
Obama increased funding for transportation projects. Numerous big projects were launched, and infrastructure spending was
a central theme for both presidential candidates. However, it appears that the election cycle and a lame duck presidency kept
many more projects from moving forward. In addition, stubbornly low energy prices led to some energy project delays and
cancellations. Donald Trump made rebuilding infrastructure a stated priority, and his administration will likely accelerate
spending in 2017.
2017 Disruptor: Higher Defense Spending
Given the policy positions adopted and statements made by Mr. Trump in the presidential campaign, we think the outlook for
the defense sector has brightened substantially. In contrast to a landscape of sequestration, forced budget cuts, and a White
House that prioritized intelligence capabilities and drone warfare, we see a return to more traditional military spending
patterns.
12
Why 2017?
We anticipate higher defense budgets in 2017 and over the next several years, and we see a good possibility that
sequestration, at least as it relates to the military, has ended. This will likely boost revenues for defense companies, which
have sharply reduced operating costs over the past few years while using cash from operations to buy back stock and
significantly reduce share counts. This, to us, indicates a lot of EPS leverage from the incremental revenue growth that we
now think is likely over the next few years.
Impact
While Mr. Trump has not provided a great deal of specifics, let’s take a look at explicit statements he has made about defense
spending. First of all, Mr. Trump said (in a speech on September 7) that he would call on Congress to “fully eliminate the
defense sequester and … submit a new budget to rebuild our military.” Eliminating the sequester would get rid of mandatory
defense spending cuts totaling $106.6 billion.
Trump has also called for increased military preparedness. Some specifics he gave out include a call for 90,000 additional
army soldiers (a 17% gain), a 350-ship Navy (up from about 272 currently), 100 additional fighter jets, and strengthened
nuclear and missile defenses. Various estimates from military analysts calculate this additional spending at anywhere from
$55 billion to $100 billion annually. Increases would come in aircraft carriers, submarines, fighter jets, tanks and all manner
of conventional weaponry.
Winners
We think makers of conventional military hardware are likely to benefit from higher spending over the next several years.
Manufacturers of tanks, submarines, fighter jets, aircraft carriers, and other ships will be the primary beneficiaries. Makers
of ammunition, avionics and flight controls will also benefit. These companies include Lockheed Martin (LMT; jets, missile
defense, combat systems); Northrup Grumman (NOC; aircraft, intelligence, combat systems); Raytheon (RTN; air and
missile defense, combat systems, unmanned systems), General Dynamics (GD; military shipbuilding, combat system,
communication systems), L-3 Communications (LLL; military and cyber intelligence and electronic systems), and Orbital
ATK (OA; ammunition, flight systems).
We think public sector information technology geared companies (cyber security and cloud) could also benefit. Since CFRA
thinks the election establishes line of sight towards further improvement in the Department of Defense (DoD) budget, we
see potential for improvement in backlogs for tech sector companies such as CSRA (CSRA) and Leidos Holdings (LDOS).
Losers
We think all defense contractors are likely to see benefits from the increased spending expected from the Trump
administration. While military hardware is likely to be a major focus, we believe the sector as a whole is going to see stronger
demand for years to come, and therefore see no major losers from this disruptor in 2017.
13
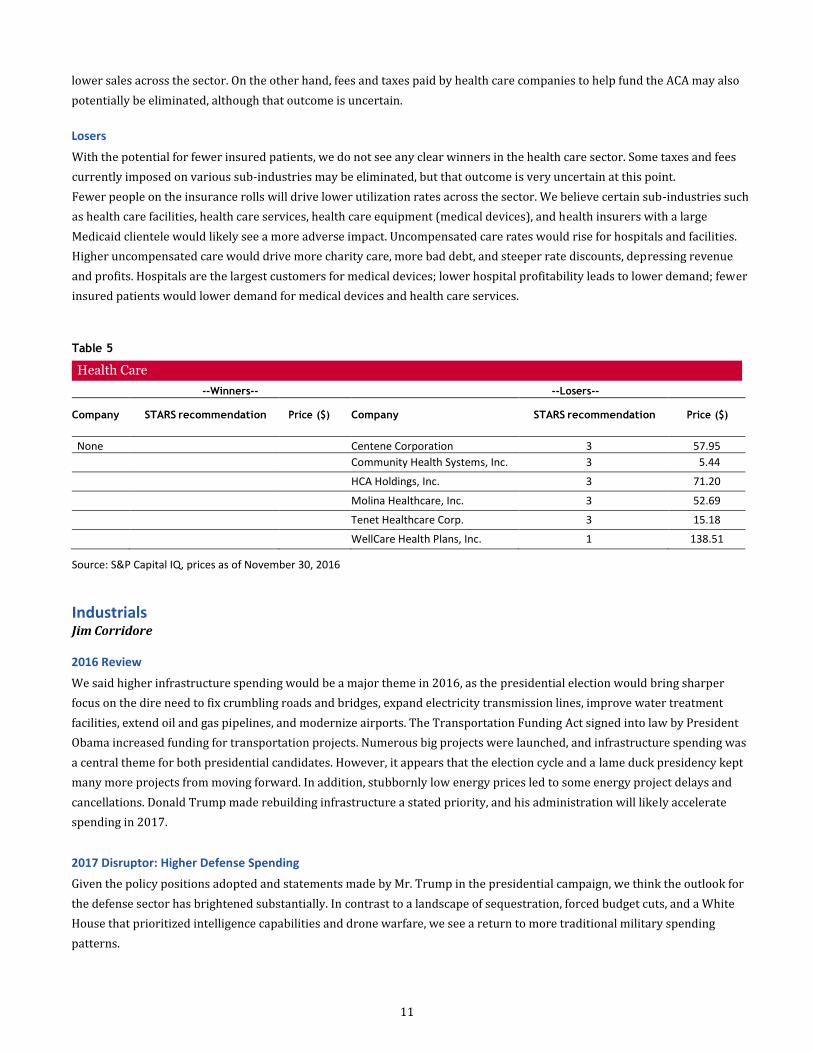
Table 6
Industrials
--Winners-- --Losers-- Company
STARS recommendation
Price ($)
Company
STARS recommendation
Price ($)
General Dynamics Corporation 4 176.40 None
L-3 Communications Holdings, Inc. 3 157.49
Lockheed Martin Corporation 5 266.40
Northrop Grumman Corporation 3 249.07
Orbital ATK, Inc. 5 85.74
Raytheon Company 4 149.24
Source: S&P Capital IQ, prices as of November 30, 2016
Information Technology Scott Kessler
2016 Review
Last year, we thought cash balances and capital allocations would be a major theme for the technology sector. We wrote: “…
pressure is building for what we see as cash-rich, relatively conservative technology companies to become more proactive
with their cash” and “… more companies [are] taking more risks with their capital and benefiting as a result, given that
current cash has not been generating much growth or returns.”
Not only did companies deploy considerable capital for buybacks, dividends, and acquisitions in 2016, but they also raised
even more funds for these purposes through debt issuance. One of the companies we highlighted, Qualcomm (QCOM),
announced one of the largest IT merger transactions ever with its pending purchase of NXP Semiconductors (NXPI), valued
at $47 billion. Another, Apple (AAPL), expanded its stock buyback by $35 billion and increased its dividend by 10%.
2017 Disruptor: Repatriation of Foreign Earnings
The ten largest technology sector companies in the S&P 500 by market capitalization had $709 billion in cash and investments
as of November 30, 2016. Of that amount, $523 billion, or 74%, was held overseas by foreign subsidiaries. We have long
thought there could be considerable benefits to companies being able to bring that capital back to the U.S. without having to
pay the currently required 35% tax rate. Consider the positive potential for additional domestic investment, buyback and
dividend actions, and M&A on the U.S. economy and related companies and stocks.
Why 2017?
As a candidate, Donald Trump said one of his core tax proposals was to “provide a deemed repatriation of corporate profits
held offshore at a one-time tax rate of 10%.” With Mr. Trump headed for the White House and Republicans retaining control
of Congress, we see a good chance a reduced repatriation tax could be enacted.
In fact, we think Mr. Trump’s proposed tax reductions, including the ones related to repatriating foreign earnings, could help
accelerate U.S. economic growth and increase the number of domestic jobs. Some have questioned whether repatriated
foreign earnings would really be used for purposes other than stock buybacks, harkening back to 2004, when the
implementation of a similar tax holiday was characterized as unsuccessful by many, including the Treasury Department and
the Democratic staff of the Senate Permanent Subcommittee on Investigations, separately in 2011.
Nonetheless, we think Mr. Trump and Congressional Republicans see a tax holiday as a way to stimulate domestic investment.
14
We also think requirements could be put in place to help ensure that repatriated capital is allocated to spur growth.
Impact
The biggest beneficiaries of a reduction in the repatriation tax would be the ten largest technology companies in the S&P 500,
which recently had $523 billion in overseas cash and investments. We think these firms would bring most of these funds
home and deploy them for internal and external investments such as R&D and M&A, as well as for stock buybacks and
dividends.
We believe these companies would be poised for more growth and more appealing valuations with additional investments
and by returning cash to shareholders. There would be a strong potential for greater revenue growth, fewer outstanding
shares, and higher yields.
Winners
Apple recently held 91% of its cash and investments held overseas. We think much of its $216 billion in foreign earnings
could be brought back to the U.S. for investment in new categories and products. Interestingly, Apple could also look to deploy
such capital to expand its domestic manufacturing capabilities. Its overseas cash and investments recently accounted for 37%
of its market cap.
Microsoft (MSFT), Intel (INTC), and Cisco Systems (CSCO) each recently had between 70% and 84% of their cash reserves
overseas, amounting to 23%, 29% and 40%, respectively, of their market capitalizations. We think these companies could add
to already healthy buybacks and dividends, and invest in additional R&D initiatives and manufacturing facilities, given that all
of these companies produce tangible products like chips, equipment, and hardware, and also develop software and provide
services.
Losers
Potential losers include companies domiciled outside the U.S., which would not be in a position to benefit as much or at all
from a reduced repatriation tax. Accenture (ACN), which recently ranked as the 12th largest technology company in the
S&P 500, held only a quarter of its revenue overseas, which accounted for only 2% of its market cap.
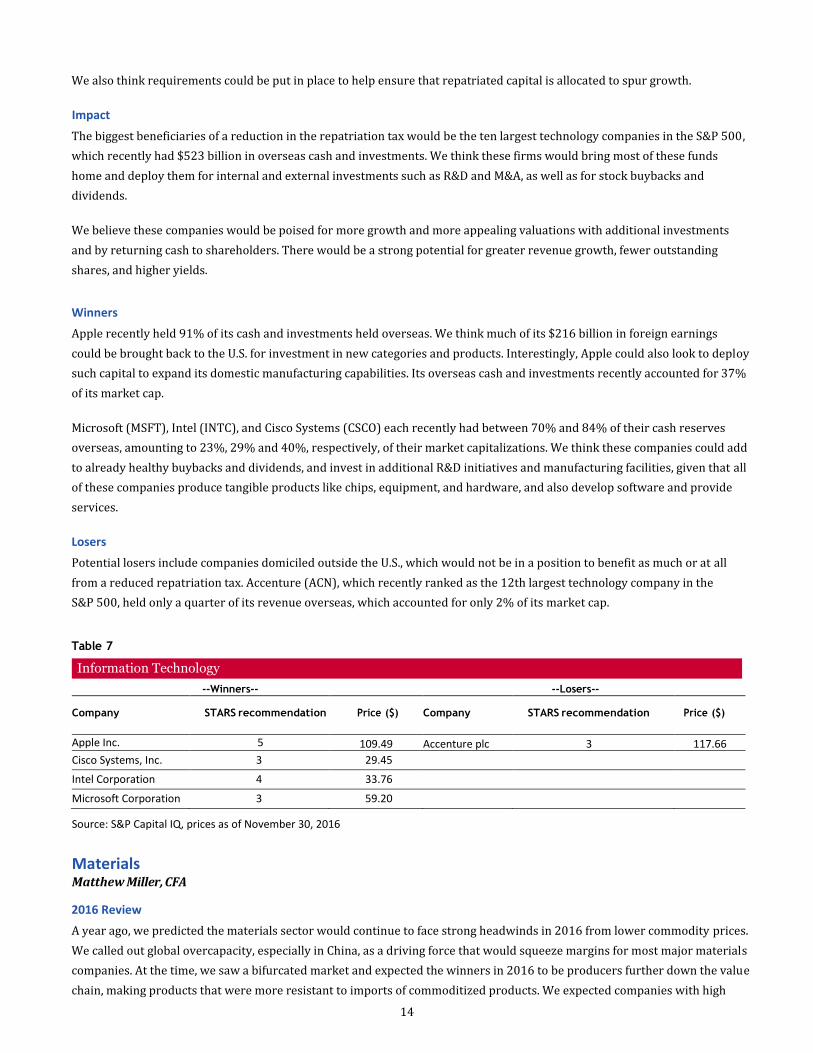
Table 7
Information Technology
--Winners-- --Losers-- Company
STARS recommendation
Price ($)
Company
STARS recommendation
Price ($)
Apple Inc.
5
109.49 Accenture plc 3 117.66
Cisco Systems, Inc. 3 29.45
Intel Corporation 4 33.76
Microsoft Corporation 3 59.20
Source: S&P Capital IQ, prices as of November 30, 2016
Materials Matthew Miller, CFA
2016 Review
A year ago, we predicted the materials sector would continue to face strong headwinds in 2016 from lower commodity prices.
We called out global overcapacity, especially in China, as a driving force that would squeeze margins for most major materials
companies. At the time, we saw a bifurcated market and expected the winners in 2016 to be producers further down the value
chain, making products that were more resistant to imports of commoditized products. We expected companies with high
15
leverage (both financial and operating) as those that would perform worst under our forecasted market fundamentals.
Although the first part of 2016 played out as we anticipated, the sector benefited from a rapid and dramatic rebound in
several commodities. Our expected winners outperformed both the broader market and the materials sector; the best
performers were the companies deemed to have the poorest fundamentals (i.e. relatively weaker balance sheets and higher
cost structures), driven by a turnaround in industry fundamentals combined with high financial and operating leverage.
2017 Disruptor: Infrastructure Demand
A May 2016 report from the American Society of Civil Engineers (ASCE) highlights the dire need to upgrade U.S.
infrastructure, including roads, bridges, airports, railways, water treatment facilities, electrical transmission lines, and other
heavy infrastructure. Long a source of national pride, U.S. infrastructure is crumbling from decades of underinvestment. The
ASCE report has highlighted the dangers and incremental costs of further delay. As a result, we see significant demand for
infrastructure spending, which should accelerate over the next several years. According to the ASCE, infrastructure spending
needs in the 2016 to 2025 period total $3.3 trillion, comprising $2.0 trillion of surface transportation spending, $344 billion
for waterways and ports, and $934 billion for electricity. Of this $3.3 trillion total, $1.9 billion was funded as of May 2016,
leaving a $1.4 billion funding gap.
Aging infrastructure has a real economic cost. The ASCE estimates potential GDP losses of $4.0 trillion and 2.5 million lost jobs
through 2025 if the funding gap is not met. Although political gridlock has left serious gaps in spending bills, we think
infrastructure is one issue that has bipartisan support. In late 2015, Congress passed the Fixing America’s Surface
Transportation Act (FAST). After the passage of 36 separate short-term stopgap bills, the FAST Act is the first federal law
since 2005 to provide long-term funding certainty for surface transportation infrastructure investment. The comprehensive
transportation bill authorizes $305 billion from 2016 through 2020 for highway, public transportation, road and vehicle
safety, and railways. This new act provides a multi-year tailwind for the construction materials sub-industry, but we believe
the FAST Act only scratches the surface of potential opportunities given the pent-up demand for infrastructure upgrades.
Why 2017?
We expect that one of President Trump’s first acts after inauguration will be the proposal of a massive infrastructure bill,
valued up to $1.0 trillion, by our calculations. Infrastructure and construction spending will likely be a cornerstone of the
Trump administration’s economic policy. During his victory speech, the first thing Mr. Trump mentioned was his
infrastructure plan: “We are going to fix our inner cities, and rebuild our highways, bridges, tunnels, airports, schools,
hospitals. We’re going to rebuild our infrastructure, which will become, by the way, second to none. And we will put millions
of our people to work as we rebuild it.” Although we expect a significant amount of congressional scrutiny on how to fund the
effort, we think infrastructure is an issue that will likely have overwhelming bipartisan support.
Impact
The Trump administration’s anticipated $1.0 trillion plan, most likely spread over a 10-year period, would have a meaningful
positive impact on the outlook for many sub-industries within the materials sector. The two sub-industries that we think are
impacted the most are construction materials and steel. Although we note projects from any announced spending bills may
not be started until 2018, the act of signing a large infrastructure bill would be a positive catalyst for sentiment in the
materials sector, leading to higher growth prospects and expanding valuation multiples.
Winners
We expect the major beneficiaries of a large infrastructure program to be construction materials companies such as Vulcan
Materials (VMC) and Martin Marietta Resources (MLM), steel producers like Steel Dynamics (STLD) and U.S. Steel (X), and
Cliffs Natural Resources (CLF), a major supplier of iron ore pellets to domestic steel mills. Construction materials companies,
which produce aggregates, crushed stone, and ready-mix concrete should benefit from strong secular growth, driven by both
16
the FAST Act and any additional infrastructure spending from the Trump administration.
Steel equities should not only benefit from higher levels of infrastructure-related demand, but could also benefit greatly from
Mr. Trump’s protectionist stance on trade policies. We think the Trump administration could magnify and vigorously enforce
already-punitive tariffs on Chinese steel manufacturers that have long plagued the domestic steel industry by dumping cheap
steel products into North America.
Losers
While we note higher infrastructure spending could lead to higher-priced input costs for certain companies within the
materials sector, we do not envision any equities in the sector losing out as a result of this theme.
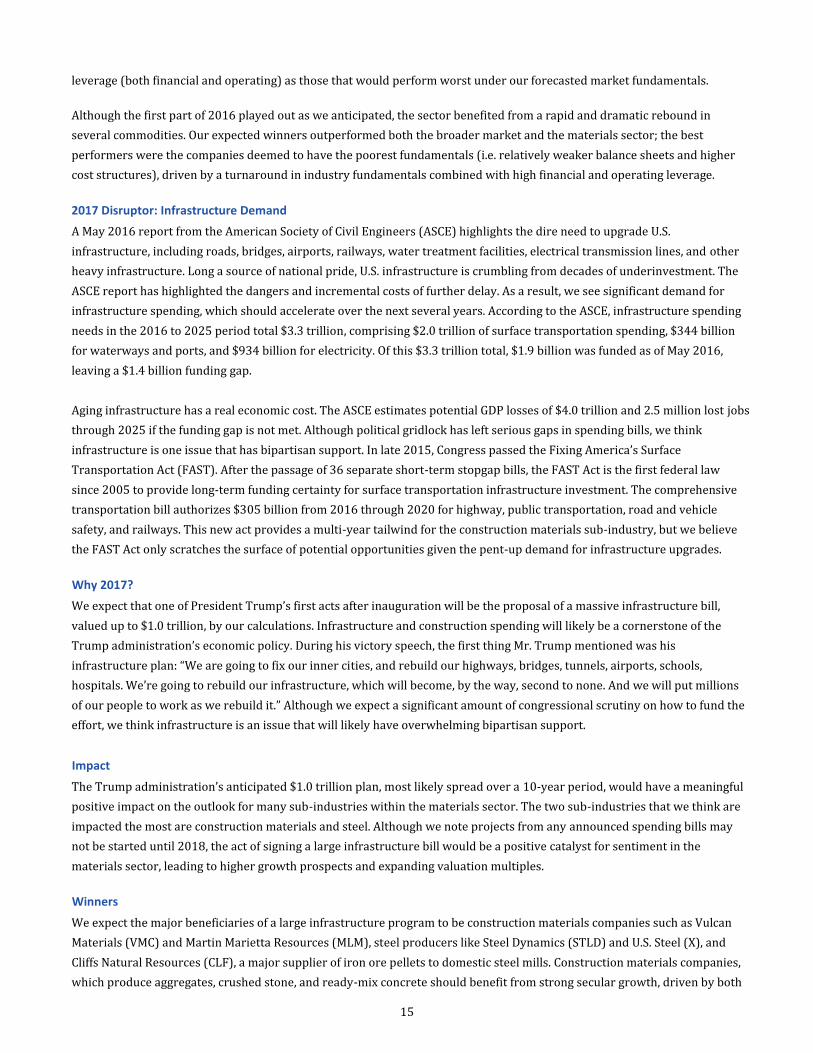
Table 8
Materials
--Winners-- --Losers-- Company
STARS recommendation
Price ($)
Company
STARS recommendation
Price ($)
Cliffs Natural Resources Inc.
4
9.24 None
Martin Marietta Materials, Inc. 5 220.90
Steel Dynamics, Inc. 5 36.01
United States Steel Corporation 4 32.03
Vulcan Materials Company 5 125.50
Source: S&P Capital IQ, prices as of November 30, 2016
Real Estate Ken Leon, Cathy Seifert
2016 Review
Real estate became the eleventh sector added to the Global Industry Classification Standard (GICS) used by S&P Dow Jones
Indices and MSCI Indices, effective on August 31, 2016. This moved U.S. equity property REITs and real estate operating
companies from the financial sector to their new home in real estate, which represents approximately 3% of the S&P 500
Index.
2017 Disruptor: Rising Interest Rates
Rising interest rates make REIT equities more volatile and add risk to the fundamentals, in our view. The Federal Open
Market Committee (FOMC) is likely to raise short-term interest rates in December and again in 2017. We see this action as a
shift from easy to more neutral monetary policy with gradual increases of interest rates over several years. We think the
Federal Reserve’s intent is to reduce monetary stimulus without slowing the US economy.
Why 2017?
The U. S. economy is much healthier now than at any period since the financial crisis, with job growth, employment levels, and
inflation all reflecting a modest recovery. The new Trump administration will likely look to increase fiscal spending for
infrastructure and for other types of development that may lead to both higher inflation and higher interest rates. We expect a
gradual rise in rates, assuming the Fed’s current monetary policy is driven by economic growth, rather than a means to
counter wage-push or cost-push inflation. In our opinion, the REIT outlook is also driven by economic and job growth, not just
interest rates. Favorable macroeconomic trends spur new real estate development, improve occupancy rates, and boost rental
rates, which in turn support higher cash flow and dividend growth. In some areas of the REIT space, including retail, very
limited new construction will also tilt the supply and demand equation in favor of property owners and REITs.
17
Impact
Conventional wisdom holds that higher interest rates are a negative for REIT fundamentals, reflecting an attendant rise in the
cost of borrowed funds, and/or tighter credit availability from bank lending or access to the debt/capital markets. These
factors could reduce REIT valuation metrics, such as price/net asset value (NAV). However, there is data to support the notion
that REITs are not overly sensitive to interest rate changes. S&P Dow Jones Indices published a report in January 2016, using
data going back to the 1970s, that supports this notion. U.S. REITS earned a positive return in four of six periods of rising
interest rates, while in half of those periods, U.S. REITs outperformed the S&P 500 Index.
Most U.S. REITs are also not highly leveraged. Using the SNL US Real Estate Index, recurring EBITDA/interest expense has
improved to 3.8X in 2015 from 2.8X in 2011, while short-term debt/total debt has been reduced to 7.9X in 2015 from 9.2X in
2011. However, variable-rate debt/total debt has expanded from 14.9X in 2011 to 22.1X in 2015 for U.S. equity REITs. This
may be a risk should rates rise rapidly, causing a reduction in growth for funds from operations (FFO). We see the amount of
variable-rate debt to total debt as a key measure, and a high variable-rate debt level may suggest less predictable sources and
higher costs of funding.
False starts of rising rates have led to volatility in REIT share prices during much of 2016, evidenced by the 9.6% decline in
the S&P Real Estate Sub-Industry Index, year-to-date through November 30, 2016, following an outperformance earlier in the
year. This partly comes from worries about rising interest rates and their impact on the SNL US REIT Equity Index with 4.0%
dividend yield, versus 2.0% for the S&P 500, as of November 30, 2016. Investors have mostly invested in REIT stocks for their
high yield, which historically provided attractive total returns.
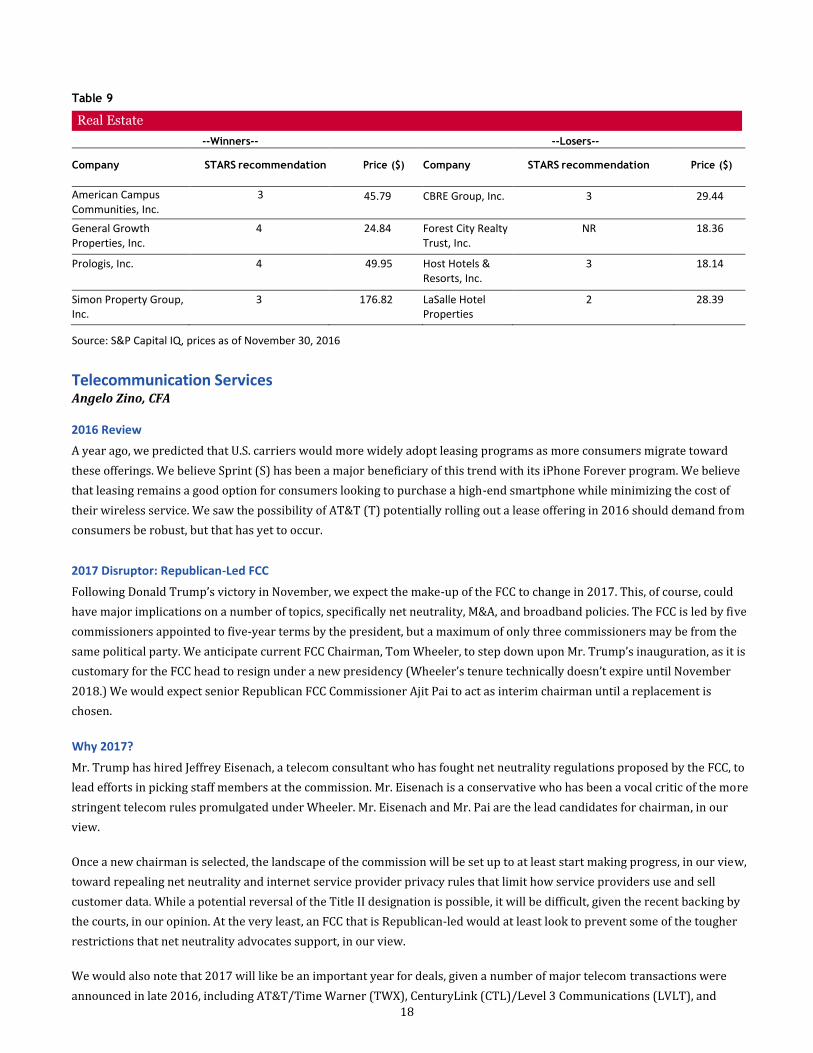
Winners
The industrial, multifamily, and retail REIT property types have the lowest variable debt/total debt at 13.1%, 14.9%, and
15.6%, respectively, as of the end of 2015. We think the industrial REITs are the best positioned with strong secular growth
from the e-commerce trends that are driving investment and property development. We identified Prologis (PLD), the market
leader with the largest tenants like Amazon, DHL, FedEx and other logistic companies. American Campus Communities (ACC)
is the leading developer of off-campus student housing properties, a recession-resistant sub-market. We selected Simon
Property Group (SPG), the largest enclosed mall operator with luxury store tenants that has a below peer average variable-
rate debt/total debt. Another winner is General Growth Properties (GGP), a major developer of regional malls with attractive
locations.
Losers
The real estate operating companies, or REOCs, hotel REITs and diversified/other REITs have the highest variable-rate
debt/total debt at 36.7%, 34.8% and 26.8% respectively as of the end of 2015. CBRE Group (CBG), a global commercial real
estate services company, has risk exposure to both rising rates and an economic downturn that would hurt transaction
fees. The hotel REIT property types also have exposure to rising rates and a cyclical downturn in business and tourist
travel. We have identified LaSalle Hotel Properties (LHO) and Host Hotels & Resorts (HST) as having exposure to
potentially rising rates and weaker demand. Another potential loser is Forest City Realty Trust (FCE.A), a diversified REIT
owner of retail, office, apartment and mixed-use properties that has a 43.2% ratio of variable-rate debt/total debt.
18
Table 9
Real Estate
--Winners-- --Losers-- Company
STARS recommendation
Price ($)
Company
STARS recommendation
Price ($)
American Campus Communities, Inc.
3
45.79 CBRE Group, Inc. 3 29.44
General Growth Properties, Inc.
4 24.84 Forest City Realty Trust, Inc.
NR 18.36
Prologis, Inc. 4 49.95 Host Hotels & Resorts, Inc.
3 18.14
Simon Property Group, Inc.
3 176.82 LaSalle Hotel Properties
2 28.39
Source: S&P Capital IQ, prices as of November 30, 2016
Telecommunication Services Angelo Zino, CFA
2016 Review
A year ago, we predicted that U.S. carriers would more widely adopt leasing programs as more consumers migrate toward
these offerings. We believe Sprint (S) has been a major beneficiary of this trend with its iPhone Forever program. We believe
that leasing remains a good option for consumers looking to purchase a high-end smartphone while minimizing the cost of
their wireless service. We saw the possibility of AT&T (T) potentially rolling out a lease offering in 2016 should demand from
consumers be robust, but that has yet to occur.
2017 Disruptor: Republican-Led FCC
Following Donald Trump’s victory in November, we expect the make-up of the FCC to change in 2017. This, of course, could
have major implications on a number of topics, specifically net neutrality, M&A, and broadband policies. The FCC is led by five
commissioners appointed to five-year terms by the president, but a maximum of only three commissioners may be from the
same political party. We anticipate current FCC Chairman, Tom Wheeler, to step down upon Mr. Trump’s inauguration, as it is
customary for the FCC head to resign under a new presidency (Wheeler’s tenure technically doesn’t expire until November
2018.) We would expect senior Republican FCC Commissioner Ajit Pai to act as interim chairman until a replacement is
chosen.
Why 2017?
Mr. Trump has hired Jeffrey Eisenach, a telecom consultant who has fought net neutrality regulations proposed by the FCC, to
lead efforts in picking staff members at the commission. Mr. Eisenach is a conservative who has been a vocal critic of the more
stringent telecom rules promulgated under Wheeler. Mr. Eisenach and Mr. Pai are the lead candidates for chairman, in our
view.
Once a new chairman is selected, the landscape of the commission will be set up to at least start making progress, in our view,
toward repealing net neutrality and internet service provider privacy rules that limit how service providers use and sell
customer data. While a potential reversal of the Title II designation is possible, it will be difficult, given the recent backing by
the courts, in our opinion. At the very least, an FCC that is Republican-led would at least look to prevent some of the tougher
restrictions that net neutrality advocates support, in our view.
We would also note that 2017 will like be an important year for deals, given a number of major telecom transactions were
announced in late 2016, including AT&T/Time Warner (TWX), CenturyLink (CTL)/Level 3 Communications (LVLT), and
19
Windstream (WIN)/EarthLink (ELNK). While Trump vowed to ensure the massive AT&T/Time Warner combination does not
occur, it remains to be seen if that had more to do with lobbying for votes than an actual policy stance. Regulators who have
historically opposed net neutrality and increased regulation of ISPs are usually not against mergers or acquisitions.
Impact
The net neutrality rules passed by the FCC in early 2015 and upheld by the courts in June 2016 are likely to face pressure
once the new administration takes over. Under Republican leadership, the commission would likely look to do away with
classifying broadband access as a Title II service, in our view. While undoing net neutrality would likely be a slow and difficult
task, the new FCC chairman could simply not enforce the rules in the meantime. This would bode well for ISPs like AT&T and
Verizon that have created video offerings where the data caps don’t count against wireless subscribers (the FCC stated that
these practices may violate net neutrality rules), making their offerings cheaper relative to competitors. With a Trump
presidency and Republican Congress, we see the potential for new legislation to reverse the FCC’s authority to regulate the
internet. At the very least, we see an environment that will lead to less stringent restrictions on ISPs.
The pending AT&T/Time Warner deal has taken most of the spotlight regarding merger policy, but the FCC’s role in this case
could be less demanding as in other large deals, given our view that Time Warner is much less regulated than AT&T’s existing
businesses. Given that the transaction is more vertically integrated, it should fare better than Comcast/Time Warner and
AT&T/T-Mobile, which were both rejected. The other pending mergers we previously cited would also need FCC approval and
we think a Republican-led FCC will support the approval of these transactions.
We see Sprint and T-Mobile potentially revisiting a combination during the Trump presidency (as early as 2017) as a more
merger-friendly FCC could take a different stance. The two companies have both previously cited that a larger third player
would improve the competitive landscape of the wireless space but as of late, both have been doing very well and taking share
on a standalone basis. While we think a revamped FCC could improve the prospects of a deal, we do think this horizontal
integration would find approval more challenging.
Winners
Under a Republican-led Presidency/Congress, ISPs are likely to see the biggest benefits, assuming an easing of regulations. This
group includes wireless companies like Verizon, AT&T, T-Mobile, and Sprint, as well as cable companies such as Comcast; and
other broadband providers. While it remains to be seen if “internet fast lanes” will be allowed at some point, a Republican-led FCC
will likely mark the end of the quest for tougher regulations on topics such as “zero rating.” (Zero rating refers to ISPs not charging
end customers for data used by certain applications or Internet services through their network.) Separately, we see a greater
probably of deals flowing through, at least on the FCC side. Given the potential for scale benefits, this should be a positive for the
overall space.
Losers
Content providers like Netflix (NFLX) and Alphabet/Google (GOOGL) would be hurt if existing net neutrality rules are altered,
with start-ups and smaller content providers being at most risk in a non-price regulated environment. Should more
consolidation take place under a Republican-led Congress, it could come at the detriment of tower providers like American
Tower (AMT) and Crown Castle (CCI), as it would reduce the customer base and potentially lead to the decommissioning of
sites.
The removal of net neutrality for some of the smaller rural incumbent local exchange carriers (ILECs), such as Cincinnati Bell
(CBB), could have negative implications, by our analysis. By removing a level playing field, we think this could further
entrench larger ISPs, rather than having them compete on the value of offered services.
There are uncertainties with other FCC programs for smaller providers, such as expanding the reach of broadband networks
in higher cost areas with Connect America Fund (CAF) revenue subsidies. While CAF I offered one-time subsidies totaling
20
$255 million), starting in 2012, CAF II saw a reduction in funding, effective August 2015. While the amount of funding
depends on the quality of individual provider networks, we think any material reduction from CAF I to CAF II could be a drag
on revenues of smaller carriers.
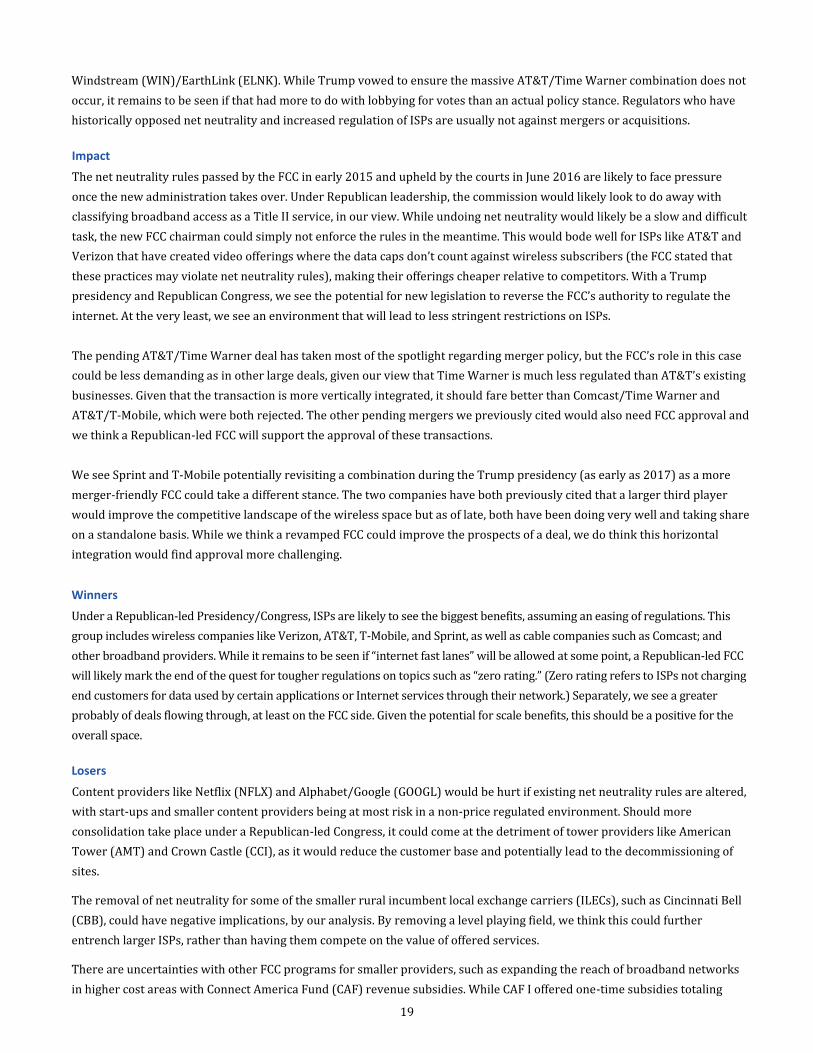
Table 10
Telecommunication Services
--Winners-- --Losers-- Company
STARS recommendation
Price ($)
Company
STARS recommendation
Price ($)
AT&T Inc. 4 38.88 Cincinnati Bell Inc. 3 20.40
CenturyLink, Inc. 4 23.74 Consolidated Communications Holdings Inc.
2 28.27
Sprint Corporation 3 7.94
T-Mobile US, Inc. 3 54.26
Verizon Communications, Inc. 3 49.87
Source: S&P Capital IQ, prices of November 30, 2016
Utilities Christopher Muir
2016 Review
Our prediction for 2016 was that higher interest rates – thanks to an improving economy – would be a negative for most
utility stocks. Higher interest rates lead to higher debt costs. While utilities are able to recover higher costs, they typically
have to wait until the next general rate case, which means higher costs can pressure earnings over the short term. With
pressure on earnings, we thought utilities could use higher dividends to attract investors. The ten largest utilities in the S&P
1500 increased their dividends by an average of 6.7%, while EPS was expected to only rise about 4% in 2016 and 1% in 2017.
Through July 6, 2016, the total return for the S&P 1500 utilities sector was 24.9%, but it has lost about half that ground with a
year-to-date gain of 12.8% through November 30.
2017 Disruptor: Lower Electric Power Prices
Next year, the federal government will likely act to reduce some of the regulations that surround production of electricity
from coal, in our view. Under President Obama, the EPA announced and finalized the Clean Power Plan, which, if upheld by
the courts, would make it extremely expensive to generate electricity from coal-fired power plants. We think that a Trump
administration will scrap the Clean Power Plan, which could enable electric generators to extend the life of some coal-fired
plants that were previously slated for closure.
Why 2017?
According to data from SNL Energy, companies have announced that they will retire 21.3 GW (7.9%) of coal-fired capacity
between 2017 and 2020, with 8.4 GW set for 2017. Should the Clean Power Plan regulation remain in place and be upheld by
the courts, we would expect additional coal plant retirement announcements. However, we think the new administration does
not support the Clean Power Plan and think it will act to withdraw the plan.
Impact
Even if the new administration rescinds the Clean Power Plan regulations immediately, utility companies that generate
electricity from coal will be faced with a decision on whether to invest in new sulfur dioxide and nitrogen dioxide emissions
controls in the face of a potential future administration that would restore similar regulations. Should a future administration
want to restore similar regulations, we expect it could be six to seven years before such regulations would even take effect.
21
This means that there is more time for generating units to recover any needed investments in emissions control equipment
and we think regulated coal-fired power plants might request from regulators the right to make such investments. At the
same time, the availability of additional generation will likely lead to more downward pressure on power prices, which are
already under pressure due to low natural gas prices. Some older and smaller coal plants were shutting down anyway due to
economic reasons. But we see the lower power prices pressuring profitability for unregulated generation.
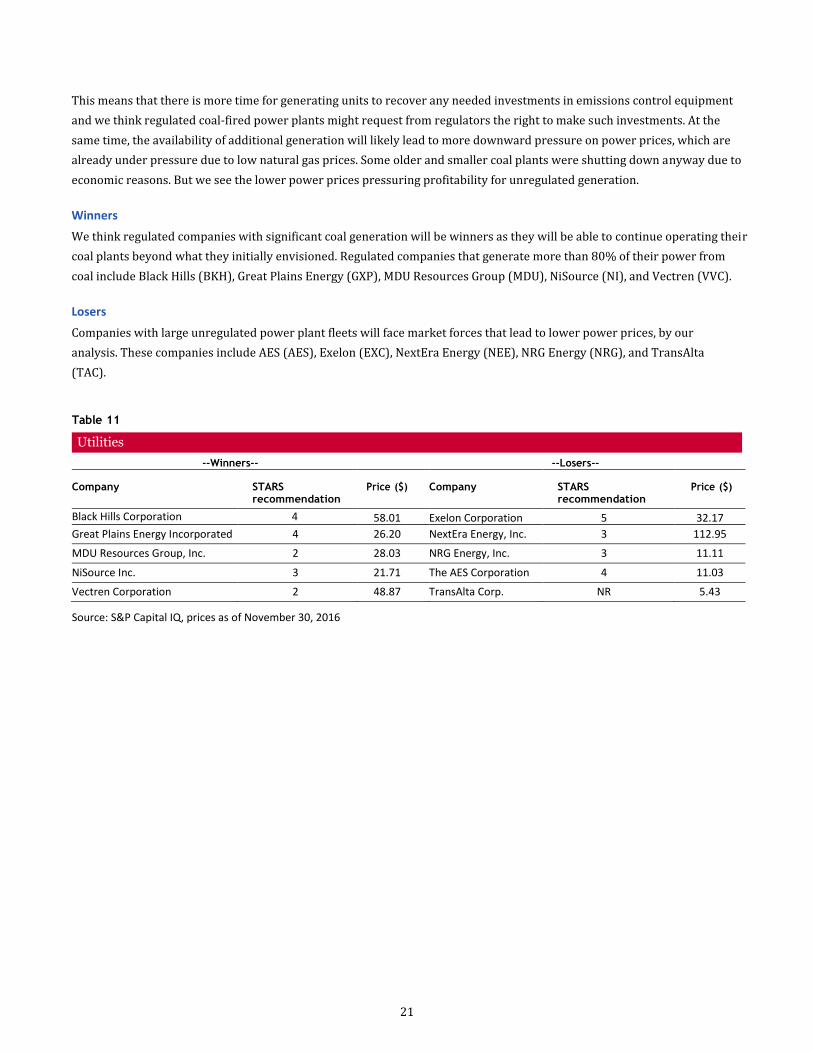
Winners
We think regulated companies with significant coal generation will be winners as they will be able to continue operating their
coal plants beyond what they initially envisioned. Regulated companies that generate more than 80% of their power from
coal include Black Hills (BKH), Great Plains Energy (GXP), MDU Resources Group (MDU), NiSource (NI), and Vectren (VVC).
Losers
Companies with large unregulated power plant fleets will face market forces that lead to lower power prices, by our
analysis. These companies include AES (AES), Exelon (EXC), NextEra Energy (NEE), NRG Energy (NRG), and TransAlta
(TAC).
Table 11
Utilities
--Winners-- --Losers-- Company
STARS recommendation
Price ($)
Company
STARS recommendation
Price ($)
Black Hills Corporation
4
58.01 Exelon Corporation 5 32.17
Great Plains Energy Incorporated 4 26.20 NextEra Energy, Inc. 3 112.95
MDU Resources Group, Inc. 2 28.03 NRG Energy, Inc. 3 11.11
NiSource Inc. 3 21.71 The AES Corporation 4 11.03
Vectren Corporation 2 48.87 TransAlta Corp. NR 5.43
Source: S&P Capital IQ, prices as of November 30, 2016
33194098 | 14653371
Disclosures
S&P GLOBAL™ and S&P CAPITAL IQ™ are used under license. The owner of these trademarks is S&P Global Inc. or its affiliate, which are not affiliated with CFRA Research or the author of this content. This content has been prepared by Accounting Research & Analytics, LLC and/or one of its affiliates. It is published and distributed by Accounting Research & Analytics, LLC d/b/a CFRA with the following exceptions: In the European Union/European Economic Area, by CFRA UK Limited (company number 08456139 registered in England & Wales with its registered office address at 131 Edgware Road, London, W2 2AP, United Kingdom), which is an Appointed Representative of Hutchinson Lilley Investments LLP, which is regulated by the UK Financial Conduct Authority (No. 582181); in Malaysia, by Standard & Poor’s Malaysia Sdn Bhd, which is regulated by the Securities Commission Malaysia (License No. CMSL/A0181/2007). The content of this report and the opinions expressed herein are those of CFRA based upon publicly-available information that CFRA believes to be reliable and the opinions are subject to change without notice. This analysis has not been submitted to, nor received approval from, the United States Securities and Exchange Commission or any other regulatory body. While CFRA exercised due care in compiling this analysis, CFRA AND ALL RELATED ENTITIES SPECIFICALLY DISCLAIM ALL WARRANTIES, EXPRESS OR IMPLIED, to the full extent permitted by law, regarding the accuracy, completeness, or usefulness of this information and assumes no liability with respect to the consequences of relying on this information for investment or other purposes. No content (including ratings, credit-related analyses and data, valuations, model, software or other application or output therefrom) or any part thereof (Content) may be modified, reverse engineered, reproduced or distributed in any form by any means, or stored in a database or retrieval system, without the prior written permission of CFRA. The Content shall not be used for any unlawful or unauthorized purposes. CFRA and any third-party providers, as well as their directors, officers, shareholders, employees or agents do not guarantee the accuracy, completeness, timeliness or availability of the Content. Past performance is not necessarily indicative of future results. This document may contain forward-looking statements or forecasts; such forecasts are not a reliable indicator of future performance. As of Nov. 30, 2016. S&P Capital IQ equity analysts' evaluation of the 12-month potential of stocks is indicated by STARS: 5 STARS=strong buy/total return is expected to outperform the total return of a relevant benchmark by a wide margin during the coming 12 months with shares rising in price on an absolute basis; 4 STARS=buy/total return is expected to outperform the total return of a relevant benchmark during the coming 12 months with shares rising in price on an absolute basis; 3 STARS=hold/total return is expected to closely approximate the total return of a relevant benchmark during the coming 12 months; 2 STARS=sell/total return is expected to underperform the total return of a relevant benchmark during the coming 12 months; 1 STAR=strong sell/total return is expected to underperform the total return of a relevant benchmark by a wide margin during the coming 12 months. NR=no recommendation. STARS assessments combine each equity analyst's view of both fundamentals and valuation. Source: S&P Capital IQ. This report is not intended to, and does not, constitute an offer or solicitation to buy and sell securities or engage in any investment activity. This report is for informational purposes only. Recommendations in this report are not made with respect to any particular investor or type of investor. Securities, financial instruments or strategies mentioned herein may not be suitable for all investors and this material is not intended for any specific investor and does not take into account an investor's particular investment objectives, financial situations or needs. Investors should seek independent financial advice regarding the suitability and/or appropriateness of making an investment or implementing the investment strategies discussed in this document and should understand that statements regarding future prospects may not be realized. Investors should note that income from such investments, if any, may fluctuate and that the value of such investments may rise or fall. Accordingly, investors may receive back less than they originally invested. Investors should seek advice concerning any impact this investment may have on their personal tax position from their own tax advisor. Please note the publication date of this document. It may contain specific information that is no longer current and should not be used to make an investment decision. Unless otherwise indicated, there is no intention to update this document. CFRA’s financial data provider is S&P Global Market Intelligence. THIS DOCUMENT CONTAINS COPYRIGHTED AND TRADE SECRET MATERIAL DISTRIBUTED UNDER LICENSE FROM S&P GLOBAL MARKET INTELLIGENCE. FOR RECIPIENT’S INTERNAL USE ONLY. The Global Industry Classification Standard (GICS) was developed by and/or is the exclusive property of MSCI, Inc. and Capital IQ, Inc. (“Capital IQ”). GICS is a service mark of MSCI and Capital IQ and has been licensed for use by CFRA. Redistribution or reproduction is prohibited without written permission. Copyright © 2016 CFRA. All rights reserved. CFRA, the CFRA inverted pyramid logo, and STARS are registered trademarks of CFRA.