Embed Size (px)
Citation preview
1
Market Integration and Famines in Early Modern Japan, 1717-1857
Jean-Pascal Bassino* Faculty of Mathematics and Social Sciences
Paul Valéry University (Montpellier III)
Abstract
While enjoying a long period of peace under the rule of the Tokugawa (1603-1867), associated with regional specialization and a relatively high degree of market integration, the Japanese population experienced severe famines that claimed several hundred thousands lives. The most dramatic episodes of the 18th and 19th century occurred in 1731-1733, 1783-1786, and 1833-1838. As agricultural practices, crop mix, and degree of commercialization and specialization varied across Japan, it is worth considering the possibility of regional differences of economic systems in response to exogenous shocks. This paper evaluates the degree of market integration and investigates how regional markets functioned during famines. JEL Classification: I39, N15, N35, N45, N75, N950 Draft version: November 2007
* Paul Valéry University, route de Mende, 34000 Montpellier, France E-mail: [email protected]
2
Market Integration and Famines in Early Modern Japan, 1717-1857
“In an extensive corn country, between all the different parts of which there is a free commerce and communication, the scarcity occasioned by the most unfavourable seasons can never be so great as to produce a famine.” Adam Smith (1776), Wealth of Nations (CH. 5, Of Bounties, Paragraph IV.5.45).
1. Introduction: This paper analyzes market responses to exogenous supply shocks affecting the availability of staples in low-income regions, with special attention to episodes of famines triggered by shocks of exceptional magnitude and duration. The purpose of this study is to evaluate to what extent regional differences in the functioning of markets were due to the degree of integration to the national economy. In order to perform a quantitative analysis, I rely on historical series of rice price in 15 Japanese regional urban markets covering the period 1717-1857. At that time, Japan was an almost closed economy, as a result of a deliberate policy of seclusion; overseas markets had practically no influence on the price of foods items until 1858.1 Rice was the most important staple and, by far, the most extensively traded item. Osaka and Edo (present-day Tokyo), and other urban markets, received sizable quantities of rice collected as payment of land taxes that were shipped from all over Japan.
Market integration, implying both price convergence and adjustment as response to shocks, is regarded as insuring low exposure to the risk of drastic decline in welfare in the aftermath of exogenous negative shocks, and well functioning markets are expected to play a positive role in alleviating the hardship of economics downturns resulting from crop failures in predominantly rural countries. In particular, following Smith (1776), well functioning markets have been viewed as essential for preventing the outbreak of famines, or reducing their magnitude, although this belief has been nuanced by more recent studies (Sen 1981; Ravaillon 1987, 1997). While Japan benefited from a long period of peace under the rule of the Tokugawa (1603-1867), and experienced a remarkable degree of market integration 2 , as well as the development of regional specialization and some kind of proto-industrialization, the country suffered from severe famines that claimed several hundreds thousands of lives. The three most dramatic famines of the 18th and 19th century occurred in 1731-1733, 1783-1786, and 1833-1838.3
Ravaillon (1996, 1997), among others, provides numerous examples showing that famines can arise without a decline of aggregate food supply, and were therefore man made disasters; but he also acknowledge that in some cases the inadequacy of food supply was the most important cause. It seems that famines occurring in early modern Japan were triggered by exogenous supply shocks of exceptional magnitude and duration rather than by market failure. We cannot dismiss that, in some regions, market failures and problems related to entitlements played also some role. 1 See Huber (1971) for a discussion on the impact of opening to World trade. 2 And market sophistication in the case of Osaka where future markets existed since the 17th century. According to Hamori et al. (2001) and Wakita (2001), the first future market in the world, Dojima rice market, appeared in Osaka in the 18th century. 3 These famine years are generally identified by the name of the era (name of reign of the Emperor used as denomination of the calendar years) as Kyoho 享保 , Tenmei 天明 and Tenpo 天保 famines, respectively. These are the three major famines that arose during the period 1717-1757 (Kikuchi 1997). Other crop failures resulted in some excess mortality during other years but with a more limited impact and at a more regional scale. The Horeki 宝暦 , famine that arose in 1754-1755 was comparatively less severe. Japan had experienced other major famines during the first century of Tokugawa rule, in particular the Kanei 寛永 (1641-1643), Empo 延宝 (1674-77), and Genroku 元禄 famines (1699-1701).
3
Still, it has been relatively well documented by Japanese historians (e.g. Kikuchi 1997) that excess mortality resulted more from the drastic drops in aggregate food supply than from market unfriendly regulations or the collapse of village-level arrangements aimed at guaranteeing that the most vulnerable members of the community would receive an allocation of food allowing them to survive.
The major explanation of the recurrence of famines seems that most Japanese rural folks (and also part of the urban population) were living on the edge in normal years, barely above subsistence level.4 Storage was limited and only small quantities of grain were used as feed for animal husbandry; hence, reducing the volume of staple used as feed in order to increase the human food consumption was not an option. A close investigation of the dates of natural hazards and famines reveals that excess mortality appeared only in the after successive years of crop failure. During the period 1717-1857, the number of years of crop failure largely exceeds that of famines. Local economic systems were able to cope with a single negative event, particularly when the producers enjoyed a bumper harvest the following year, but the resilience of the population was put to its limit by a succession of poor or catastrophic harvest years.
The impact of famine is revealed by demographic data. Quantitative evidence indicates that high levels of excess mortality were observed during famines, either due to starvation or pathologies directly related to malnutrition. During the Tenmei famine, the population declined by 925,000, while the reduction was 1,1146,000 during the Tenpo famine (Saito 2002: 232). Several regions were more severely hit (see appendix 2 for a map of Japanese regions). Records of local domains indicate, for instance, than more than 260,000 people died in the Tohoku in 1783-1784, during the first two years of the Tenmei famine.5 This is equivalent to around 13% of the population of the Tohoku in 1786.6 Saito (2002) argues convincingly that, in early modern Japan, famines acted as demographic corrective.7 Indeed between the early 18th and the mid 19th century, the Japanese population remained at a plateau of around 30 millions. Famines disappeared after the mid-19th century and a steady demographic growth was then observed during the second part of the late 19th and early 20th century. The reminder of this paper is organized into five sections. Section 2 offers a brief discussion of climate anomalies as determinants of crop failures in early modern Japan. Section 3 assesses the magnitude of interregional rice trade and discusses trade restrictions, and other types of famine relief policies. Section 4 presents the data. Section 5 evaluates the degree of integration of regional markets and identifies Osaka and Edo as leading markets. Section 6 adopts an error correction approach in order to analyze how regional markets functioned in response to natural hazard, particularly during famines episodes. Section 7 concludes. 2. Climate anomalies and crop failures in early modern Japan Although the major part of the Japanese archipelago enjoys a temperate sub-tropical climate with generous rainfalls, most regions are exposed to recurrent climate anomalies that
4 The Euro-Asian comparison of real wages (Bassino and Ma 2005; Allen et alii 2006) suggests that, even in Kyoto and Edo (present day Tokyo), where real wages were probably much higher than in rural areas, the level of welfare of unskilled workers was barely comparable to those observed in Milan or Madrid, two cities that were in the lowest range of the European cities, and roughly at the same level as in Beijing and Canton. The interregional comparison of wages adjusted for differences in purchasing power (Saito 2006) indicates that living standards in Kyoto, Osaka and Tokyo were much higher than in rural areas in early Meiji (1870s and 1880s), and therefore presumably also in the 18th and early 19th century. 5 Kikuchi (1997: 161); see Table A1, in appendix, for a breakdown for selected feudal domains (han). Due to the fragmentary nature of these records, we cannot reconstruct excess mortality series at the regional level. 6 Regional population data are reported in Ushio, Kurokawa and Nakamura eds (1974: 378). The Tokugawa government undertook population surveys every 6th year between 1726 and 1846 (with the exceptions of 1738, 1810, and 1816); see Saito (2002: 230) for details. 7 In the Mathusian sense of a check of relative overpopulation, for a given set of resources, institutions, and techniques (Malthus 1798). The successive epidemics waves also claimed many lived but their impact on demographic growth was comparatively small (Saito 2002).
4
severely affecting rice yields and, albeit to a lower extent, the yields of other crops that accounted for a sizable share of food supply until the second half of the 19th century.8 High levels of ecological vulnerability, related to climate anomalies, have been identified across the Japanese archipelago (White, 1995). The magnitude of crop failures can be assessed, for instance, on the basis of fiscal revenues (a major part of taxes were measured in rice and tax exemptions were granted in regions affected by crop failures as relief policy measure). Data covering most feudal domains (han) of Western Japan indicate that, in 1732, second year of Kyoho famine, fiscal revenues were in a range of 10 to 50% of the preceding five-year average (Kikuchi 1997: 88). Due to the paucity of data, it is however impossible to construct yearly series of agricultural output taking into account crop failures. Temperature, rainfall, and wind velocity data are not available before the end of the 19th century but climate anomalies have been recorded for various regions of Japan since the 7th century, and the same sources also mention years of famines and indicate the regions the most affected.9 These sources report four types of climate anomalies: drought, floods, cold winter, and cold summer (usually associated with persisting rainfall and/or low insulation, as the monsoon continues until mid or late August). Drought and floods were generally related to El Niño/La Nina oscillations10, while unusual low temperature levels resulted from major volcanic eruptions.11 Dramatic floods due to typhoons affected Kyushu and Shikoku more frequently than the rest of the country (see appendix 2 for a map of Japanese regions). Winter cultivation of barley, wheat, and buckwheat is possible in Western Japan, but yields are sensitive to abnormally low temperatures. As winter months are usually dry in most Japanese region, rice and other crops critically depend on spring rainfalls; hence, in low rainfall in May-June results in below average yields. Finally, rice harvests are extremely sensitive to low temperature in July, which is the period of pollination. Japanese historians have processed available data in order to identify climate anomalies that triggered famines since the 7th century. Drought, that was a major cause of famine until the 17th century, ceases to play an important role thereafter. In the 18th and 19th century, most famines were triggered by low temperature and excessive rainfall in summer.12 Out of the 40 years of cool (i.e. unusually cold) July-August recorded between 1714 and 1864, 10 were years of famine (Saito 2002: 229). Low spring rainfalls (dry May-June) appear at most as an aggravating factor of famines: 39 years of dry May-June are recorded for the same period, of which 5 were years of famines (ibid.). The most likely explanation for the lower impact of drought in the 18th and 19th century is the conversion of dry fields into paddy fields that occurring in the 17th century in a context of rapid demographic growth. Irrigation made rice cultivation less dependent on rainfall. But it is probable that, in the meantime, the process of intensification resulted in an increase in the share of rice in the crop mix and therefore a much higher sensitivity of food output level to low summer temperatures. Because yield sensitivity of the different crops to climate anomalies differed markedly across regions, we can presume that regional markets and economic systems were exposed to asymmetric shocks; in particular, rice output in the northeast of Japan, were normal temperatures were relatively low, was more sensitive to cold summer than in the rest of the country. The
8 Until the late 19th century, cereals other than rice (barley, millet) along with buckwheat, soybeans and other beans, played a major role in the nutrition in rural areas; on average, rice accounted for about half of the volume of staples consumed (Umemura et al. 1983). 9 Saito (1965) offers a comprehensive compilation of these data. 10 Major El Niño events took place in 1720, 1728, 1791, 1828, 1877-78, 1925-26, 1982-83, and 1997-98 (Yamakawa 1999). 11 The eruption of Mount Asama (in central Japan) in 1783, that has been regarded by scholars in Japanese studies as the cause of the Tenmei famine that arose between 1783 and 1786 (Totman 1993: 238-239), was in fact minimal in comparison with the series of volcanic eruption that took place in Iceland in 1783, known as Laki event (Zielsinski et al. 1994). These eruptions resulted in a significant cooling of the northern hemisphere (-1 to -3 degrees) that lasted for several years (see Highwood and Stevenson (2003) for a simulation) and disrupted the African monsoon and the flow of the Nile (Oman et al. (2006)). 12 Nishimura and Yoshikawa (1936), quoted in Saito (2002: 225)
5
picture is in fact more complex if we consider regional differences in the crop mix.13 The share of rice in percentage of the staple food output was particularly high in the core region of western Japan, the Kinki, around Kyoto and Osaka, and therefore total output was quite sensitive to low summer temperatures. Although the sensitivity to this type of climate anomaly was much higher the northeastern region but rice accounted on average for less than half of total output of staple in that part of Japan. 3. Interregional transportation of rice, trade restrictions, and other famine relief policies The cost of interregional shipment of rice and other foodstuffs could be one of the explanations for the severity of famines. Maritime transportation was restricted by the size of the vessels; the Tokugawa government prohibited the construction of large tonnage vessels as a measure of prevention of unauthorized international trade. Japanese road were not suitable for carriage. In addition, there were only a few bridges; most rivers had to be crossed by portage. It appears nevertheless that transportation costs did not prevent interregional rice trade and the shipment of rice over relatively long distance.14 As shown by Shiue (2002), and Shiue and Keller (2004) in the case of China, high transportation costs do not necessarily prevent market integration. In early modern in Japan too, rice and other staples were extensively traded over long distance. Studies by Japanese scholars (Miyamoto 1963, 1985, 1986; Iwahashi 1981; Shimbo 1985; Kusano 1996) have shown that a comparatively high degree of regional market integration had been attained at least since the 18th century. Osaka played a leading role in this trade as the dominant city of the Kinki region, and as Japan’s commercial hub. But Edo, at that time the biggest city in the world with a population in excess of 1 million, was the major destination of rice and other food items shipped either from Osaka or directly from other region. 15
We can evaluate to what extent transportation costs hindered rice trade by relying on available freight rate data. In the case of shipment to Edo via maritime transportation of rice originating at a distance in a range between 30 and 150 km, from 10 different locations on the coast of Boso peninsula (present-day Chiba prefecture), freight rates were roughly equivalent to 3 % of the value of the rice shipment per 100 km.16 The fact that a linear relation is observed (see figure 1A in appendix) suggests that, in normal circumstances, the cost of shipment over a distance of 1000 km was at most around 30% of rice price.17 The difference observed between prices in Osaka and coastal markets of western Japan is broadly consistent with this figure (see section 5 and information on distance between pairs of markets in appendix 2, Table A5). Rice was also cultivated in inland location; part of it was collected as taxes and shipped to Osaka, Edo and other destinations. Wigen (1995: 33) indicates that, in the region corresponding to present-day Nagano prefecture, overland transportation services provided by officially recognized operators was at least twice as costly as maritime or potamic shipping; but she also mentions that the cost of sending goods by private (horse back) train was only half the cost of using the official
13 Output estimates for staples other than rice are notoriously unreliable before the early 20th century (Bassino 2006) but we can use regional level consumption survey as proxy of local output. Interregional shipments of rice and soybeans accounted for a significant share of total output, but were negligible for other staples. 14 The cost of shipment combines in fact transaction cost for which there is almost no information and transportation cost for which some data are available. A recent studies by Takatsuki (2007) suggests that, in the Kinki region, local merchants were able to closely monitor the short term variation in rice prices in Osaka future market despite relatively high cost of information. 15 Owing to the alternate residence system (sankin kotai) impose by the Tokugawa government to the daimyo, part of the rice or other items collected as tax revenue in the various provinces had to be shipped and sold in Osaka (or other markets) in order to finance expenditures of the Daimyo and their entourage in Edo; see for instance Totman (1993: 108-111, 150-152) for a general presentation of the alternate residence system. 16 Based on data reported by Ogasawara and Kawamura (1982: 173). 17 Most regional markets were located at a distance in a range between 50 and 1000 km of Tokyo or Osaka. The maximum length of maritime routes was around 1500 km (e.g. from Echigo, on the coast of the See of Japan, to Edo).
6
counterpart (Wigen 1995: 49). This implies that the cost of land and maritime transportation were in fact comparable.18 Rice was, by far, the most important commercial item in early modern Japan, from both the viewpoints of demand and supply. On the demand side, rice was the staple food of the urban population and therefore the most important single consumption item for most urban households.19 On the supply side, a significant part of rice output was collected as taxes by daimyo, (or by the shogun) and then either sold to merchants in Osaka, Edo, or locally; part of the proceed of taxes was distributed to samurai as stipend (part of it being sold by samurai to local urban merchants). According to estimates by Miyamoto (1986: 208) for the early 19th century, out of a total average yearly output of 6.75 million koku20, a volume of 6.75 million koku was collected as taxes, of which 4.45 was available for sale (around 16% of total rice output). According to the same estimates, agricultural producers had on average a yearly surplus of around 1.81 million koku available for sale to local merchants (around 7% of total rice output).21 We can gauge, at the regional level, the importance of the shipments to Osaka and/or Edo by daimyo in the 19th century, as percentage of rice output, by combining information on rice shipments in the Bunsei era (see Table 1A in appendix) and regional data on agricultural output in early Meiji.22 The calculation indicates that shipments by daimyo accounted to 12%, 19%, and 14% of rice output for Shikoku, Chugoku, and Kyushu (mostly to Osaka), and 4% for Tohoku and Hokuriku (mostly to Edo). Tokugawa Japan was, in normal circumstances, a free trade area but, when faced with a succession of bad harvest years and the outbreak of a famine, the daimyo introduced emergency trade restrictions, including a ban on shipment to Edo and Osaka.23 On the basis of evidence for medieval and early modern Europe, it has been argued that, by preventing interregional trade, grain market regulation tended to amplify the negative impact of crop failures economies with low income and technological levels (Persson 1999). However, the experience of the Irish famine suggests that a ban on export could make sense when the purchasing power of urban residents (or foreigners) largely exceeds that of local consumers. This was clearly the case in early modern Japan; living standards were much higher in Edo and Osaka than in the rural areas, as evidenced by the predominance of rice, by far the most expensive staple, in urban staple food consumption. We cannot provide a quantitative assessment of the impact of trade restrictions during Japanese famines but we should remember that, in most regions, shipments by private agents accounted for only a small part of interregional trade. Hence, what really mattered was the decision of the daimyo, in the event of a crop failure, to ship outside their domain rice collected as tax, which was often sold in advance to Osaka or Edo merchants.24 Anecdotal evidence suggest that the daimyo were inclined to take the risk of reducing locally available food supply below subsistence level in order to preserve their reputation when the crop failure occurred after un 18In that case, the cost of land transportation of 100 kg rice would have been around 3% of the value of the shipment. This may seem implausibly low but we have to remember that 3 kg rice was roughly equivalent the weekly intake of an adult male, if rice was the staple food; it could be also noted that 3 kg rice was worth around 4.5 kg of barley at Edo or Osaka prices (Mitsui Bunko 1996: Tables 7 and 8). 19 Samurai, merchants, and craftsmen, and their dependants; altogether they accounted for more than 10% of the population 20 180 liters per koku of husked but unpolished rice; by convention, rice output was measured in Japan in husked rice equivalent. 21 Miyamoto indicates however that, due to wastage, the volume actually available for urban consumption (food consumption) and processing in urban areas (sake and other) was around 5 million koku He does not provide detail regarding the share rice collected as taxes in total wastage 22Output data are unreliable before the 1880s; considering that total population remained roughly at the same level until the 1870s, rice output in early Meiji can be regarded as an acceptable proxy for the late Tokugawa period. 23 Anecdotal information suggest that, in the event of a crop failure, the daimyo tended to ship to Osaka, or Edo, the rice that had been already sold in advance, probably in an attempt to maintain their reputation. They imposed trade restrictions and granted tax exemption only in case of recurrent crops failures. 24 It should be acknowledge that, in some cases, the rice sold in advance to Osaka merchants was not actually transported to Osaka or Edo but either sold locally or in other neighboring regions. Osaka and regional merchants were accustomed to trade titles of ownership of rice without implementing physical transaction (a practice described as kumai , which means literally ‘empty (of) rice’).
7
succession of reasonably good harvest years, but that they tended to default in the case of a repetition of crop failure years (Kikuchi 1997). Apart from trade restriction, the major aspect of relief policy introduced during famines was to grant partial or total land tax exemption. Such measures drastically reduced the volume of rice sold by local public authorities outside the domain and had presumably a positive influence on local availability of food items. Another measure commonly adopted during famine outbreaks were the distribution of food from public granaries and the prohibition of (or restriction on) the processing of rice as sake (Iwahashi 1981), which also tended to increase the aggregate food supply at the local level. 25 Staples other than rice, which accounted for about half of total staple food consumption in rural areas (on average, for Japan as a whole), were mostly self-consumed.26 When traded, the relatively low unit-prices of these staples (compared to rice) made their shipment uneconomical over long distance; it is likely that they were only traded locally.27 Information on crop failures for staples other than rice in unavailable but regional level yearly series for the late 19th century suggests that the impact of climate anomalies was relatively low. Hence we can suspect that rice crop failures, which resulted in peak levels in rice price series, had more influence on the severity of famines than variation in the output of other staples. 4. Data: rice price and natural disasters
This section presents data sources and discusses rice price series and additional information on natural disasters available at the regional level that can be used for assessing the extent of market integration and market responses to natural disasters and famines. The analysis is constrained by data availability. Rice is the sole item for which continuous data series have been collected by generations of Japanese historians at the regional level. Unfortunately, price data for markets other than Osaka are available only on a yearly basis (or, at most, as biannual series in the case for Edo and Kyoto).28 In order to investigate price seasonality and to ascertain that rice price is a good proxy for inflation, I use monthly wholesale price data for rice and various other items at Osaka market covering the period 1831-1857. Regarding natural disasters, I rely on regional level annual qualitative information compiled by Saito (1965) that indicates the occurrence of six different types of hazards: drought, low summer temperature, cyclonic wind, flood, earthquake, and locust infestation.29 I use this information for generating regional level yearly binary series covering the period 1717-1857 (1 for natural hazard year, 0 otherwise).
Yearly series of rice price covering a period of 141 years (1717-1857) are available for 15 markets: Osaka, Hanshu, Fukuchiyama, Hiroshima, Bocho, Saga, and Kumamoto, in western Japan (including Kyushu); Nagoya, Shinshu, and Shinano, in central Japan; Edo, Sendai, Aizu, Echigo, and Yonezawa, in eastern Japan.30 I rely on compilations of regional rice prices series that
25 Figures in volume are fragmentary and do not allow assessing the impact these distributions in terms of famine alleviation. 26 The major exception was wheat but it is likely that this cereal accounted for a small percentage of Japanese food supply 27 For instance, price series barley (the second most important staple) in Osaka market fluctuated in line with rice price, which is not surprising as it was a close substitute. Prices of staples other rice are available for Osaka only. 28 It must be noted that, for good reasons, yearly grain prices have been commonly used by in a number of studies on market integration in early modern Europe (Persson 1999; Jacks 2005a, 2000b) and India (Studer 2006). Because price adjustment was a relatively slow process, yearly series are well suited for analyzing market integration using Error Correction Models. This issue is discussed further in section 6. 29 Earthquakes had a limited impact on agricultural output (except when breaking dykes), but they disrupted transportation, particularly in inland locations; it is likely that locust infestations were related to climate anomalies. 30 See map in appendix 2. Data for Osaka (gold and silver prices), Hanshu, Fukuchiyama, Hiroshima, Bocho, Saga, Kumamoto, Nagoya, Edo, and Aizu are from Iwahashi (1981); data for Minami Shinshu, Shinano, Yonezawa and Echigo are from Yamasaki (1983). Several yearly series are in available from 1659, but the series for Osaka in gold ryo start only in 1717; It is possible to rely on other sources for converting prices in silver monme into gold prices but, for the sake of consistency, the analysis is restricted to the period 1717-1857. Price data in 1736-1737 for Yonezawa are missing. No attempt has been made to interpolate price data for these years. See Appendix 2 for a transcription in Japanese of these names and some additional information on the site of these cities and the distance to Osaka and Edo (Table 5A) and for a map (Map 2).
8
have been adjusted for differences in quality for any given market (Iwahashi 1981; Yamasaki 1983). Differences in quality were related to the region of origin (local varieties); data for Osaka market show that price differences for differences varieties of rice were stable over time. Price data are for the new rice of the year (shinmai) that commended a premium over old rice (stored from previous years). Price data are expressed in silver monme (weight of 3.75 grams) in western Japan and in gold ryo (approximately 15 grams of pure gold) in eastern Japan. 31 I converted series reported in silver monme into gold ryo by relying on the gold value of silver momne in Osaka implied by rice price series that are expressed both in ryo and momne.32 Unsurprisingly, short-term and long-term rice price volatility that can be observed in Osaka closely reflects variations in the overall level of consumer prices.33 This is largely explained by the weight of rice in any consumer price index that can be calculated on the basis of plausible expenditure baskets. An additional explanation is that rice is a major input in the processing of some other important consumers goods (mainly sake, but also to some extent shoyu, i.e. soy sauce), and that part of the urban wages in the cottage industry were in kind, generally measured in terms of rice volume. Overall, rice prices were more volatile than those of most other consumption items, suggesting a lower income elasticity of demand for rice than for other items. This implies therefore that the current income and saving of urban households allowed them to maintain their consumption pattern instead of shifting to cheaper substitutes such as barley.34 In principle, monthly price series should be used for analyzing regional market integration but it appears nevertheless acceptable to rely on yearly series. A first reason is that a high degree of seasonality of wholesale rice price can be observed on monthly series for Osaka market.35 Most of interregional rice transportation took place after the harvest, between September and April (Iwahashi 1978: 174). Autumn and winter were comparatively slack seasons in agriculture, during which rural manpower was available for land transportation by horseback or portage up to seaports or ports of river navigation. Relying on monthly rice prices in Osaka market, we can assess short-term volatility by calculating the coefficient of variation (CV) over 3 and 5-month period (centered). The CV declined after September (rice harvest) and remained at a low level until around May. The CV increased markedly between June and September, which can be interpreted as the result of Osaka merchants forging expectations about the next rice harvest on the basis on information received from different regions on favorable or unfavorable climate conditions and event such as typhoons. Information on the date of the year is usually available in regional level rice price data. It appears that period of reference is October or November; scattered monthly data show that prices were usually stabile between harvest time and late spring. A second justification for the use of yearly price series is that local prices were influenced by output volume of the last harvest, and expectations on the next harvest, but also by carry over of the previous harvests stored in public and private granaries. In addition to the demand of urban consumers, the demand for rice was related to its role as safety stock, particularly in
31 Japan had a bimetallic system, in fact tri-metallic if divisionary copper coins (zeni ) are taken into account. Rice was de facto the fourth currency: land taxes were measured in rice, although partly paid in silver (Yamamura 1988), and so were also the stipends paid by Daimyo and the Tokugawa government to their samurai. The value of the rice stored in public and private granaries probably exceeded that of metallic coins circulated. 32 Figure 2A (in appendix) shows that the exchange rate was fairly stable at around 60 monme per ryo over the entire period. For information on currencies, see the Bank of Japan website: http://www.imes.boj.or.jp/cm/english_htmls/feature_gra1-7.htm; and http://www.imes.boj.or.jp/cm/english_htmls/feature_gra1-6.htm Pure silver content of silver monme coins was around 3.11 grams (Bassino and Ma, 2005). 33 Monthly wholesale data at Osaka market are available in Miyamoto (1976). For further investigation of the relation between rice price and the price of other items, we can compare biannual retail price data for rice and other food and non-food commodities at stores of the house of Mitsui located in Osaka, Edo and Kyoto are reported Mitsui Bunko (1989); the original source is the archives of the commercial house of Mitsui (the forerunner of present-day Mitsui group). 34Barley, the second most important staple in rural areas (average for Japan as a whole), was commonly used in urban areas as input in food processing cottage industry and as feed 35 Monthly rice price data are from Miyamoto (1963: 122-124). On rice price seasonality in Osaka market, see Miyamoto (1975: 225).
9
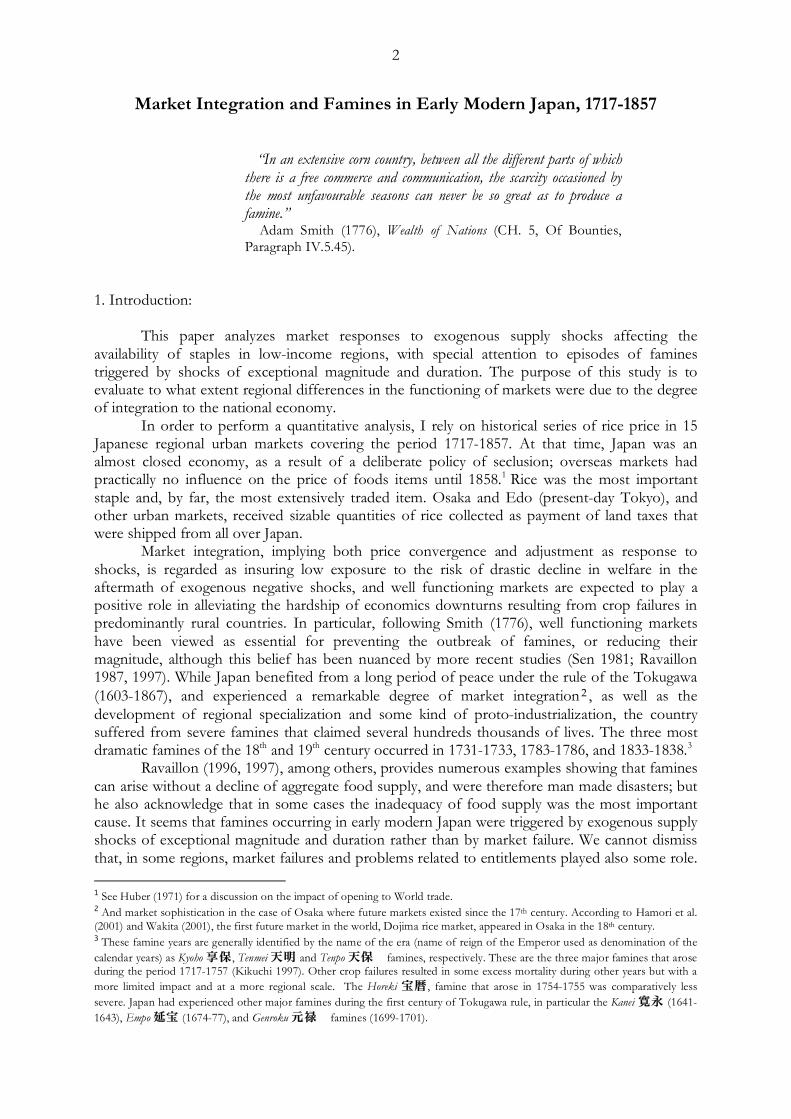
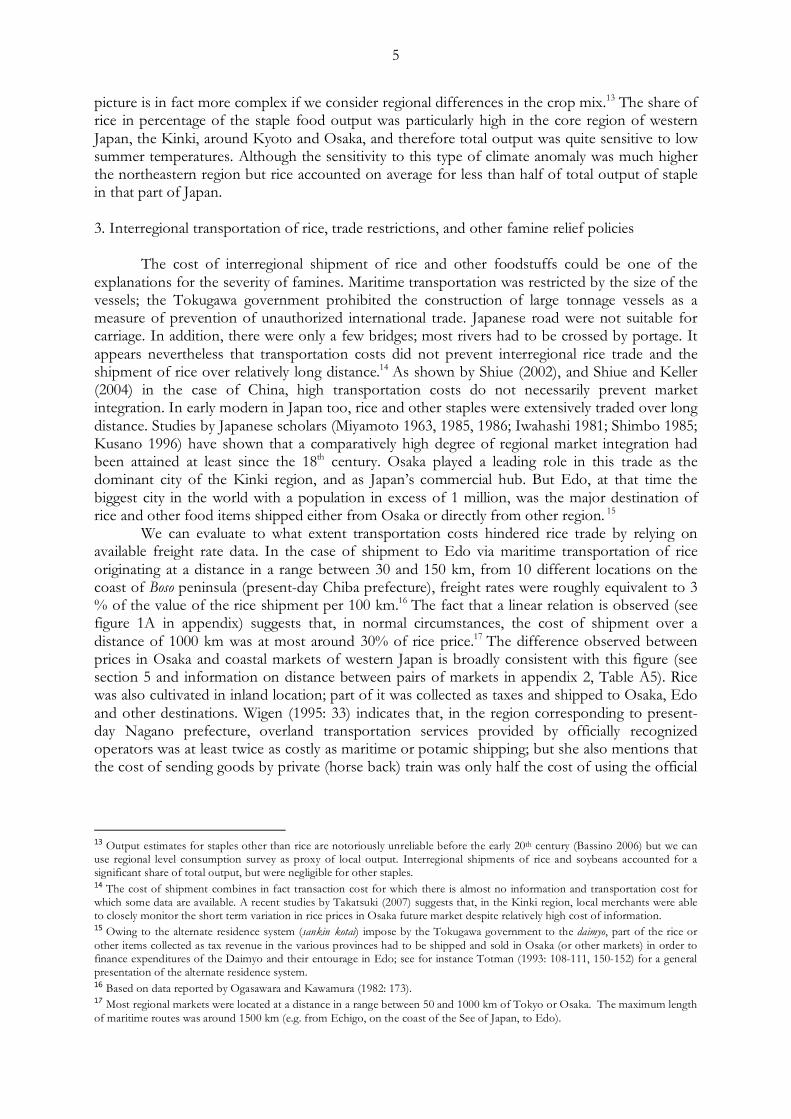
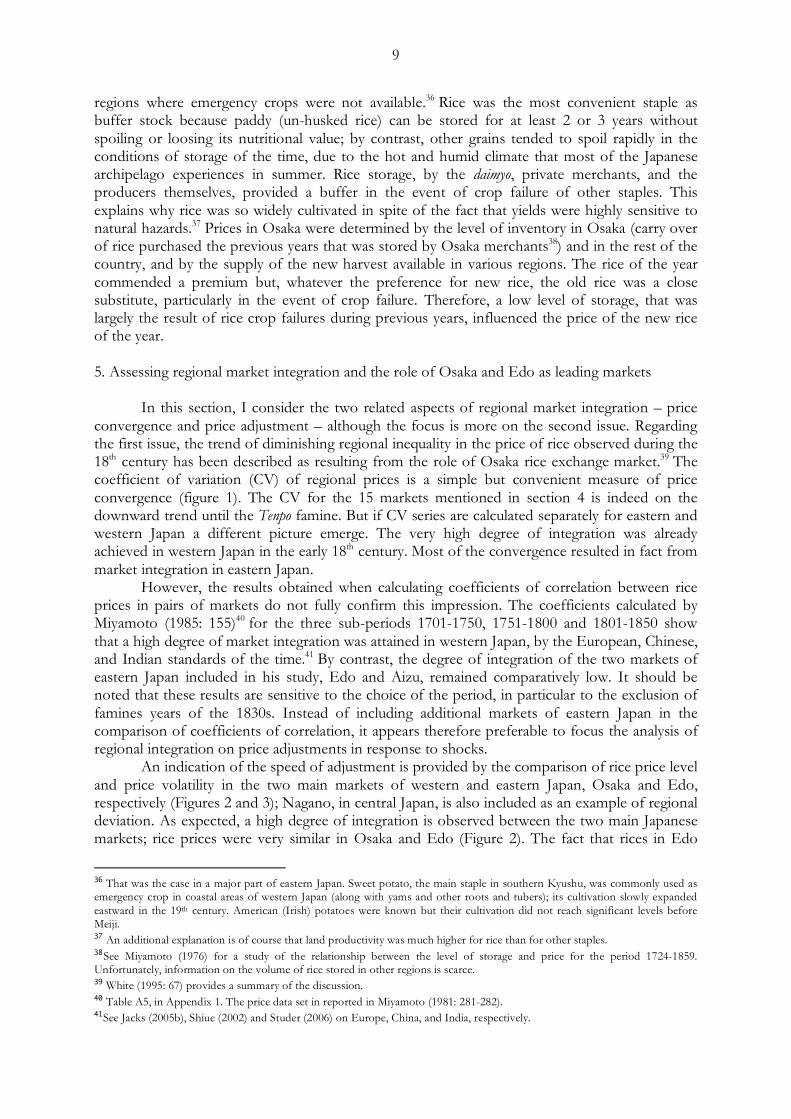
regions where emergency crops were not available.36 Rice was the most convenient staple as buffer stock because paddy (un-husked rice) can be stored for at least 2 or 3 years without spoiling or loosing its nutritional value; by contrast, other grains tended to spoil rapidly in the conditions of storage of the time, due to the hot and humid climate that most of the Japanese archipelago experiences in summer. Rice storage, by the daimyo, private merchants, and the producers themselves, provided a buffer in the event of crop failure of other staples. This explains why rice was so widely cultivated in spite of the fact that yields were highly sensitive to natural hazards.37 Prices in Osaka were determined by the level of inventory in Osaka (carry over of rice purchased the previous years that was stored by Osaka merchants38) and in the rest of the country, and by the supply of the new harvest available in various regions. The rice of the year commended a premium but, whatever the preference for new rice, the old rice was a close substitute, particularly in the event of crop failure. Therefore, a low level of storage, that was largely the result of rice crop failures during previous years, influenced the price of the new rice of the year. 5. Assessing regional market integration and the role of Osaka and Edo as leading markets In this section, I consider the two related aspects of regional market integration – price convergence and price adjustment – although the focus is more on the second issue. Regarding the first issue, the trend of diminishing regional inequality in the price of rice observed during the 18th century has been described as resulting from the role of Osaka rice exchange market.39 The coefficient of variation (CV) of regional prices is a simple but convenient measure of price convergence (figure 1). The CV for the 15 markets mentioned in section 4 is indeed on the downward trend until the Tenpo famine. But if CV series are calculated separately for eastern and western Japan a different picture emerge. The very high degree of integration was already achieved in western Japan in the early 18th century. Most of the convergence resulted in fact from market integration in eastern Japan. However, the results obtained when calculating coefficients of correlation between rice prices in pairs of markets do not fully confirm this impression. The coefficients calculated by Miyamoto (1985: 155)40 for the three sub-periods 1701-1750, 1751-1800 and 1801-1850 show that a high degree of market integration was attained in western Japan, by the European, Chinese, and Indian standards of the time.41 By contrast, the degree of integration of the two markets of eastern Japan included in his study, Edo and Aizu, remained comparatively low. It should be noted that these results are sensitive to the choice of the period, in particular to the exclusion of famines years of the 1830s. Instead of including additional markets of eastern Japan in the comparison of coefficients of correlation, it appears therefore preferable to focus the analysis of regional integration on price adjustments in response to shocks. An indication of the speed of adjustment is provided by the comparison of rice price level and price volatility in the two main markets of western and eastern Japan, Osaka and Edo, respectively (Figures 2 and 3); Nagano, in central Japan, is also included as an example of regional deviation. As expected, a high degree of integration is observed between the two main Japanese markets; rice prices were very similar in Osaka and Edo (Figure 2). The fact that rices in Edo
36 That was the case in a major part of eastern Japan. Sweet potato, the main staple in southern Kyushu, was commonly used as emergency crop in coastal areas of western Japan (along with yams and other roots and tubers); its cultivation slowly expanded eastward in the 19th century. American (Irish) potatoes were known but their cultivation did not reach significant levels before Meiji. 37 An additional explanation is of course that land productivity was much higher for rice than for other staples. 38See Miyamoto (1976) for a study of the relationship between the level of storage and price for the period 1724-1859. Unfortunately, information on the volume of rice stored in other regions is scarce. 39 White (1995: 67) provides a summary of the discussion. 40 Table A5, in Appendix 1. The price data set in reported in Miyamoto (1981: 281-282). 41See Jacks (2005b), Shiue (2002) and Studer (2006) on Europe, China, and India, respectively.
10
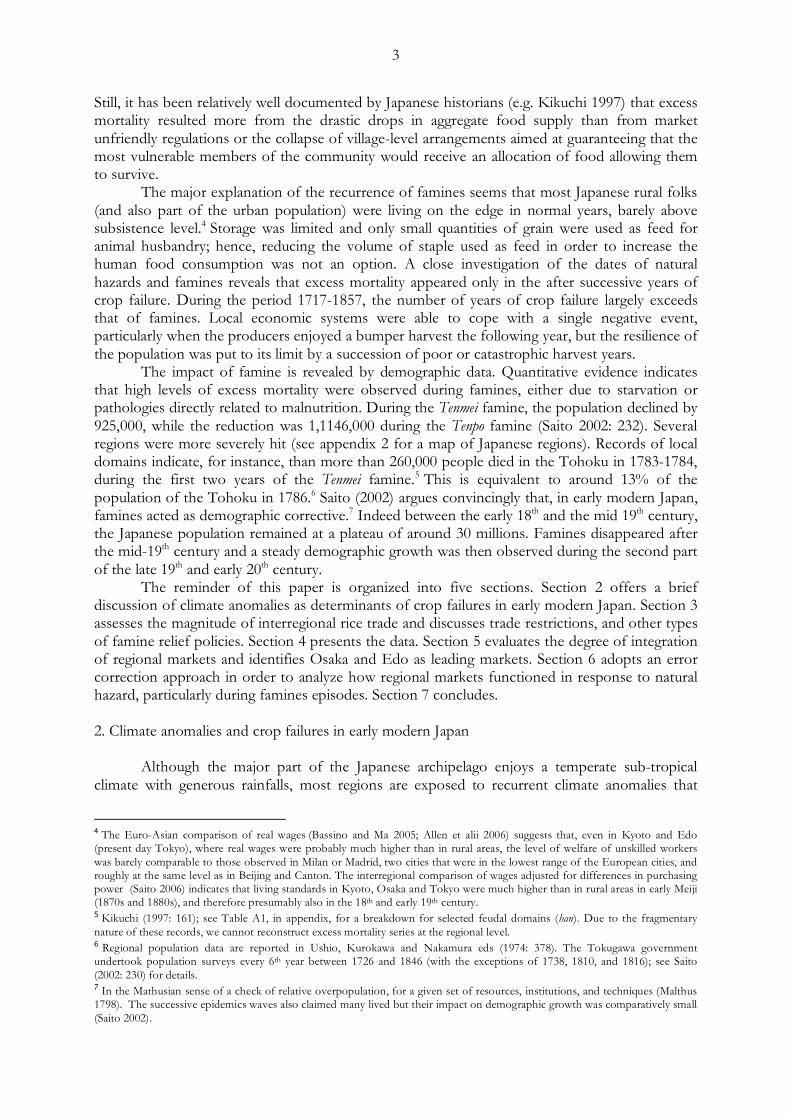
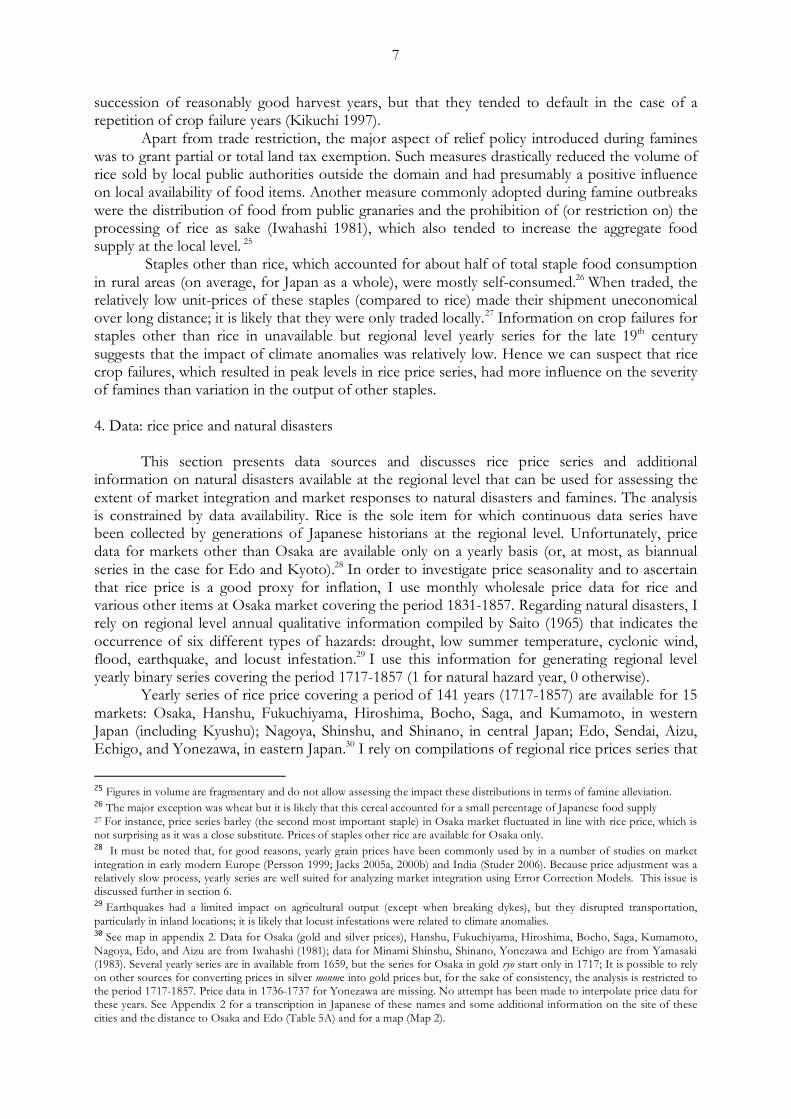
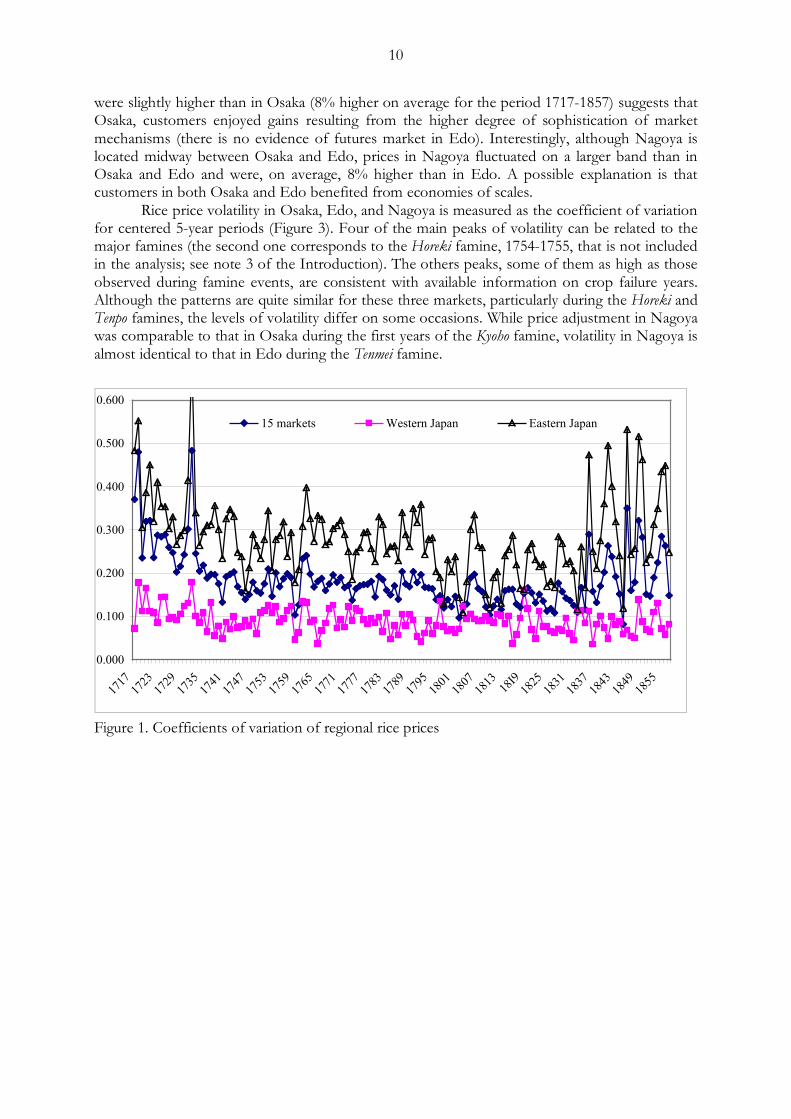
were slightly higher than in Osaka (8% higher on average for the period 1717-1857) suggests that Osaka, customers enjoyed gains resulting from the higher degree of sophistication of market mechanisms (there is no evidence of futures market in Edo). Interestingly, although Nagoya is located midway between Osaka and Edo, prices in Nagoya fluctuated on a larger band than in Osaka and Edo and were, on average, 8% higher than in Edo. A possible explanation is that customers in both Osaka and Edo benefited from economies of scales. Rice price volatility in Osaka, Edo, and Nagoya is measured as the coefficient of variation for centered 5-year periods (Figure 3). Four of the main peaks of volatility can be related to the major famines (the second one corresponds to the Horeki famine, 1754-1755, that is not included in the analysis; see note 3 of the Introduction). The others peaks, some of them as high as those observed during famine events, are consistent with available information on crop failure years. Although the patterns are quite similar for these three markets, particularly during the Horeki and Tenpo famines, the levels of volatility differ on some occasions. While price adjustment in Nagoya was comparable to that in Osaka during the first years of the Kyoho famine, volatility in Nagoya is almost identical to that in Edo during the Tenmei famine.
Figure 1. Coefficients of variation of regional rice prices
0.000
0.100
0.200
0.300
0.400
0.500
0.600
1717
1723
1729
1735
1741
1747
1753
1759
1765
1771
1777
1783
1789
1795
1801
1807
1813
18I9
1825
1831
1837
1843
1849
1855
15 markets Western Japan Eastern Japan
11
Figure 2: Current rice prices in Osaka, Edo, and Nagoya in gold ryo per koku
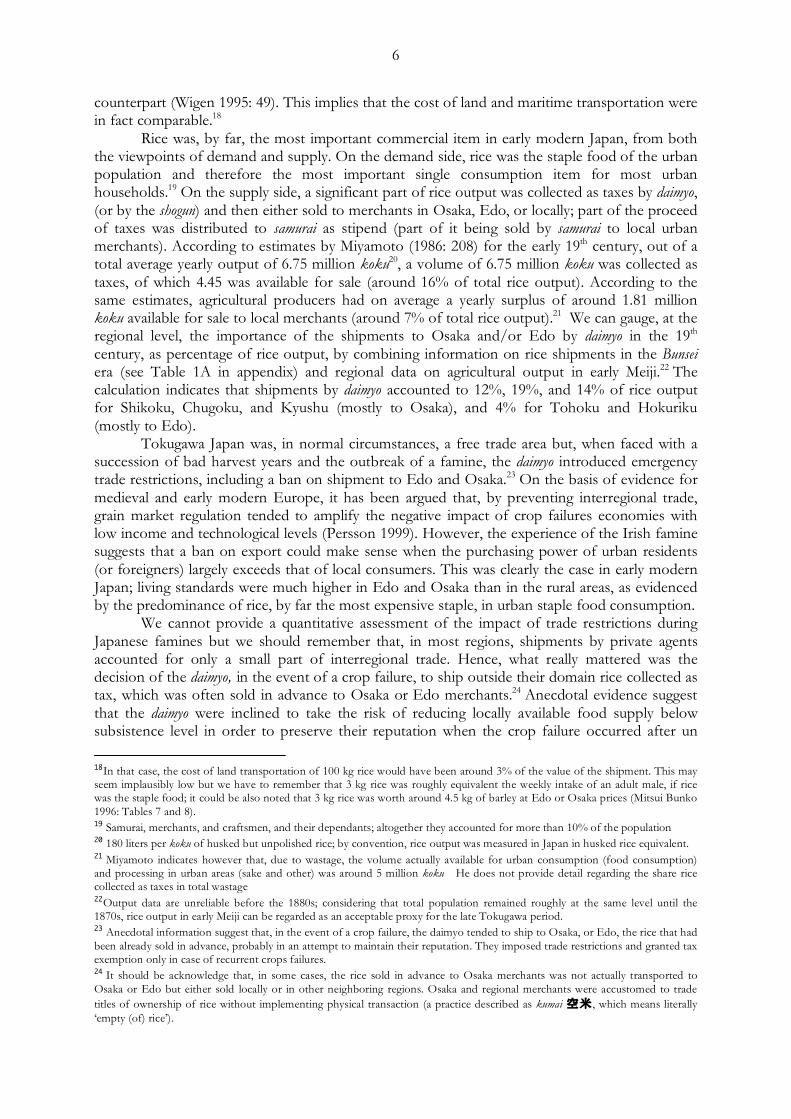
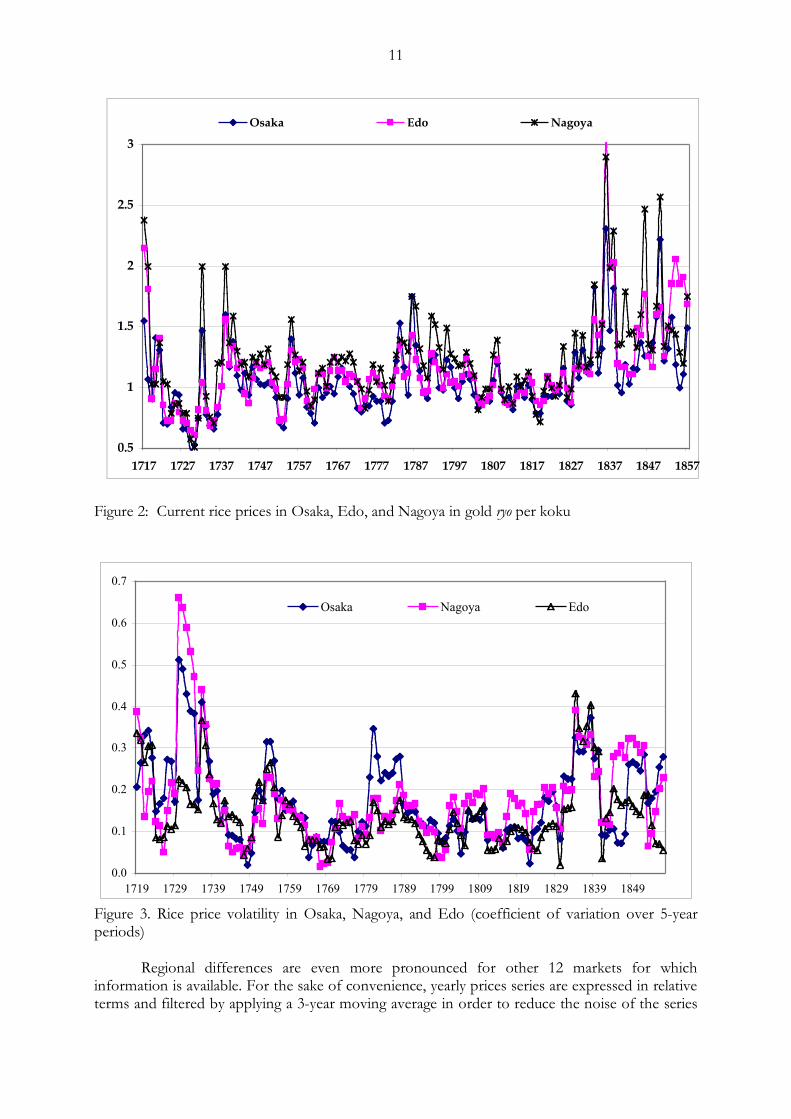
Figure 3. Rice price volatility in Osaka, Nagoya, and Edo (coefficient of variation over 5-year periods) Regional differences are even more pronounced for other 12 markets for which information is available. For the sake of convenience, yearly prices series are expressed in relative terms and filtered by applying a 3-year moving average in order to reduce the noise of the series
0.0
0.1
0.2
0.3
0.4
0.5
0.6
0.7
1719 1729 1739 1749 1759 1769 1779 1789 1799 1809 18I9 1829 1839 1849
Osaka Nagoya Edo
0.5
1
1.5
2
2.5
3
1717 1727 1737 1747 1757 1767 1777 1787 1797 1807 1817 1827 1837 1847 1857
Osaka Edo Nagoya
12
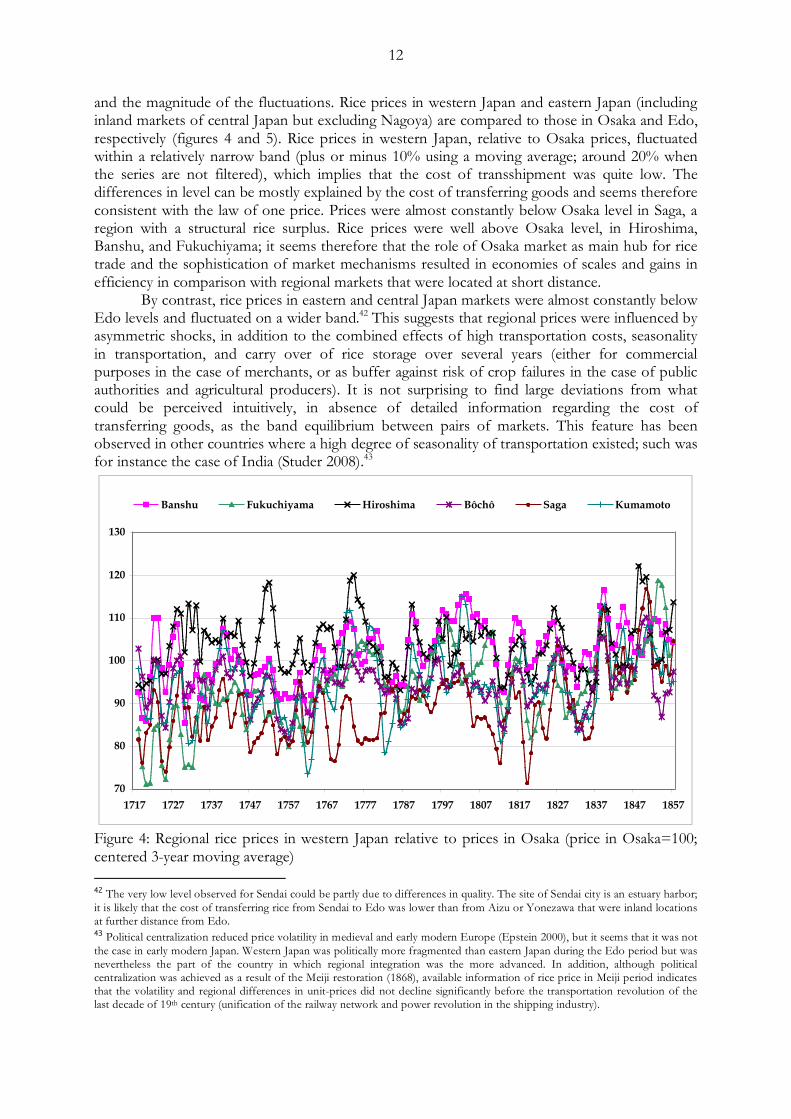
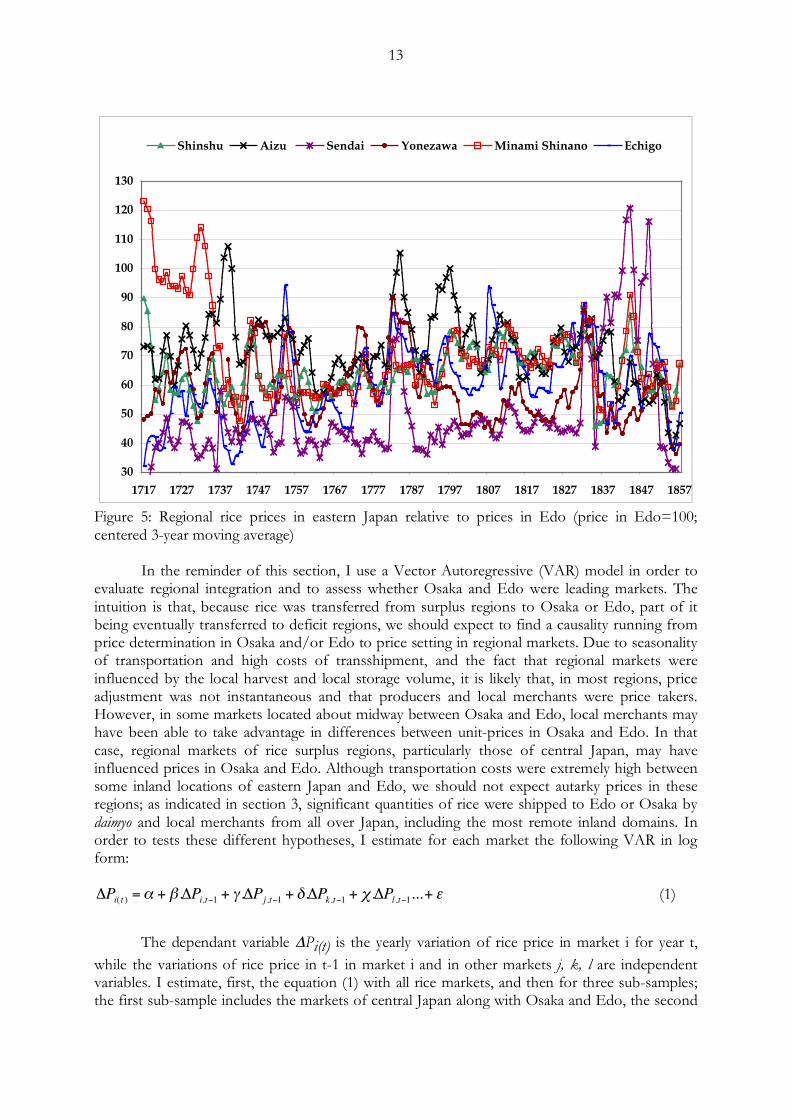
and the magnitude of the fluctuations. Rice prices in western Japan and eastern Japan (including inland markets of central Japan but excluding Nagoya) are compared to those in Osaka and Edo, respectively (figures 4 and 5). Rice prices in western Japan, relative to Osaka prices, fluctuated within a relatively narrow band (plus or minus 10% using a moving average; around 20% when the series are not filtered), which implies that the cost of transshipment was quite low. The differences in level can be mostly explained by the cost of transferring goods and seems therefore consistent with the law of one price. Prices were almost constantly below Osaka level in Saga, a region with a structural rice surplus. Rice prices were well above Osaka level, in Hiroshima, Banshu, and Fukuchiyama; it seems therefore that the role of Osaka market as main hub for rice trade and the sophistication of market mechanisms resulted in economies of scales and gains in efficiency in comparison with regional markets that were located at short distance. By contrast, rice prices in eastern and central Japan markets were almost constantly below Edo levels and fluctuated on a wider band.42 This suggests that regional prices were influenced by asymmetric shocks, in addition to the combined effects of high transportation costs, seasonality in transportation, and carry over of rice storage over several years (either for commercial purposes in the case of merchants, or as buffer against risk of crop failures in the case of public authorities and agricultural producers). It is not surprising to find large deviations from what could be perceived intuitively, in absence of detailed information regarding the cost of transferring goods, as the band equilibrium between pairs of markets. This feature has been observed in other countries where a high degree of seasonality of transportation existed; such was for instance the case of India (Studer 2008).43
Figure 4: Regional rice prices in western Japan relative to prices in Osaka (price in Osaka=100; centered 3-year moving average) 42 The very low level observed for Sendai could be partly due to differences in quality. The site of Sendai city is an estuary harbor; it is likely that the cost of transferring rice from Sendai to Edo was lower than from Aizu or Yonezawa that were inland locations at further distance from Edo. 43 Political centralization reduced price volatility in medieval and early modern Europe (Epstein 2000), but it seems that it was not the case in early modern Japan. Western Japan was politically more fragmented than eastern Japan during the Edo period but was nevertheless the part of the country in which regional integration was the more advanced. In addition, although political centralization was achieved as a result of the Meiji restoration (1868), available information of rice price in Meiji period indicates that the volatility and regional differences in unit-prices did not decline significantly before the transportation revolution of the last decade of 19th century (unification of the railway network and power revolution in the shipping industry).
70
80
90
100
110
120
130
1717 1727 1737 1747 1757 1767 1777 1787 1797 1807 1817 1827 1837 1847 1857
Banshu Fukuchiyama Hiroshima Bôchô Saga Kumamoto
13
Figure 5: Regional rice prices in eastern Japan relative to prices in Edo (price in Edo=100; centered 3-year moving average) In the reminder of this section, I use a Vector Autoregressive (VAR) model in order to evaluate regional integration and to assess whether Osaka and Edo were leading markets. The intuition is that, because rice was transferred from surplus regions to Osaka or Edo, part of it being eventually transferred to deficit regions, we should expect to find a causality running from price determination in Osaka and/or Edo to price setting in regional markets. Due to seasonality of transportation and high costs of transshipment, and the fact that regional markets were influenced by the local harvest and local storage volume, it is likely that, in most regions, price adjustment was not instantaneous and that producers and local merchants were price takers. However, in some markets located about midway between Osaka and Edo, local merchants may have been able to take advantage in differences between unit-prices in Osaka and Edo. In that case, regional markets of rice surplus regions, particularly those of central Japan, may have influenced prices in Osaka and Edo. Although transportation costs were extremely high between some inland locations of eastern Japan and Edo, we should not expect autarky prices in these regions; as indicated in section 3, significant quantities of rice were shipped to Edo or Osaka by daimyo and local merchants from all over Japan, including the most remote inland domains. In order to tests these different hypotheses, I estimate for each market the following VAR in log form:
!
"Pi( t ) =# + $."Pi,t%1 + & ."Pj ,t%1 + '."Pk,t%1 + (."Pl ,t%1...+ ) (1)
The dependant variable ΔPi(t) is the yearly variation of rice price in market i for year t, while the variations of rice price in t-1 in market i and in other markets j, k, l are independent variables. I estimate, first, the equation (1) with all rice markets, and then for three sub-samples; the first sub-sample includes the markets of central Japan along with Osaka and Edo, the second
30
40
50
60
70
80
90
100
110
120
130
1717 1727 1737 1747 1757 1767 1777 1787 1797 1807 1817 1827 1837 1847 1857
Shinshu Aizu Sendai Yonezawa Minami Shinano Echigo
14
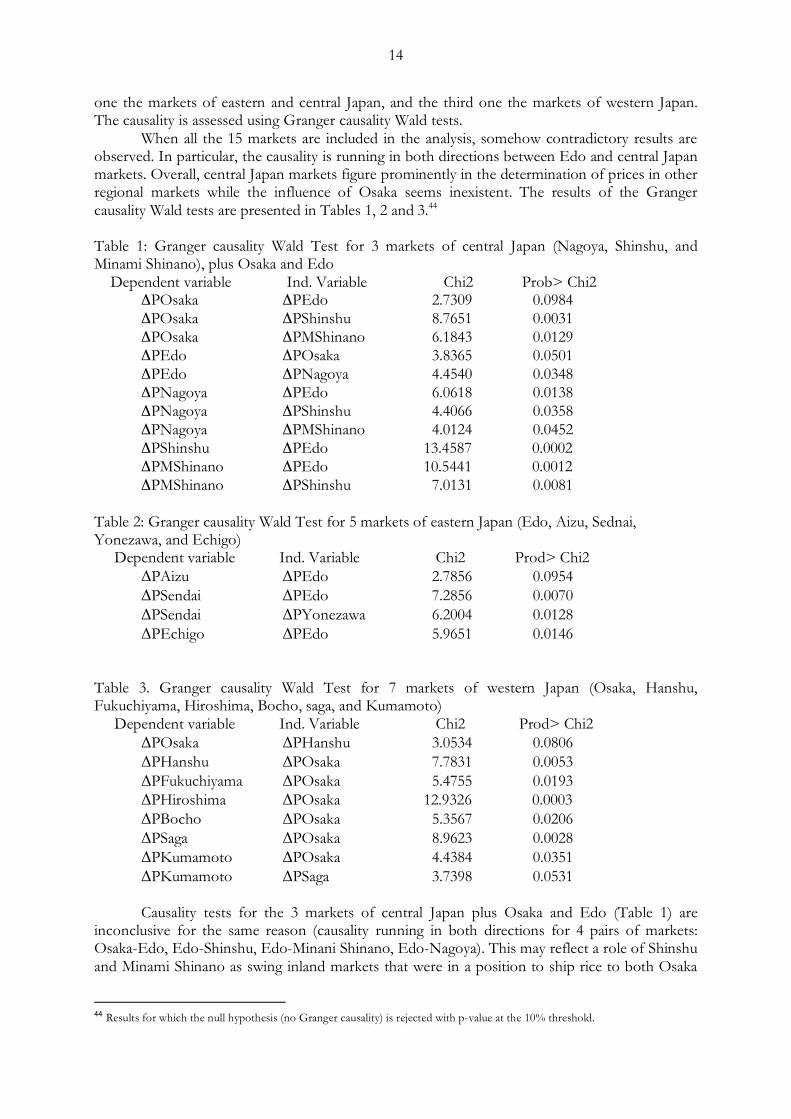
one the markets of eastern and central Japan, and the third one the markets of western Japan. The causality is assessed using Granger causality Wald tests. When all the 15 markets are included in the analysis, somehow contradictory results are observed. In particular, the causality is running in both directions between Edo and central Japan markets. Overall, central Japan markets figure prominently in the determination of prices in other regional markets while the influence of Osaka seems inexistent. The results of the Granger causality Wald tests are presented in Tables 1, 2 and 3.44 Table 1: Granger causality Wald Test for 3 markets of central Japan (Nagoya, Shinshu, and Minami Shinano), plus Osaka and Edo Dependent variable Ind. Variable Chi2 Prob> Chi2 ΔPOsaka ΔPEdo 2.7309 0.0984 ΔPOsaka ΔPShinshu 8.7651 0.0031 ΔPOsaka ΔPMShinano 6.1843 0.0129 ΔPEdo ΔPOsaka 3.8365 0.0501 ΔPEdo ΔPNagoya 4.4540 0.0348 ΔPNagoya ΔPEdo 6.0618 0.0138 ΔPNagoya ΔPShinshu 4.4066 0.0358 ΔPNagoya ΔPMShinano 4.0124 0.0452 ΔPShinshu ΔPEdo 13.4587 0.0002 ΔPMShinano ΔPEdo 10.5441 0.0012 ΔPMShinano ΔPShinshu 7.0131 0.0081 Table 2: Granger causality Wald Test for 5 markets of eastern Japan (Edo, Aizu, Sednai, Yonezawa, and Echigo) Dependent variable Ind. Variable Chi2 Prod> Chi2 ΔPAizu ΔPEdo 2.7856 0.0954 ΔPSendai ΔPEdo 7.2856 0.0070 ΔPSendai ΔPYonezawa 6.2004 0.0128 ΔPEchigo ΔPEdo 5.9651 0.0146 Table 3. Granger causality Wald Test for 7 markets of western Japan (Osaka, Hanshu, Fukuchiyama, Hiroshima, Bocho, saga, and Kumamoto) Dependent variable Ind. Variable Chi2 Prod> Chi2 ΔPOsaka ΔPHanshu 3.0534 0.0806 ΔPHanshu ΔPOsaka 7.7831 0.0053 ΔPFukuchiyama ΔPOsaka 5.4755 0.0193 ΔPHiroshima ΔPOsaka 12.9326 0.0003 ΔPBocho ΔPOsaka 5.3567 0.0206 ΔPSaga ΔPOsaka 8.9623 0.0028 ΔPKumamoto ΔPOsaka 4.4384 0.0351 ΔPKumamoto ΔPSaga 3.7398 0.0531 Causality tests for the 3 markets of central Japan plus Osaka and Edo (Table 1) are inconclusive for the same reason (causality running in both directions for 4 pairs of markets: Osaka-Edo, Edo-Shinshu, Edo-Minani Shinano, Edo-Nagoya). This may reflect a role of Shinshu and Minami Shinano as swing inland markets that were in a position to ship rice to both Osaka
44 Results for which the null hypothesis (no Granger causality) is rejected with p-value at the 10% threshold.
15
and Edo, or mostly to one of these destinations in case of deviation from the band equilibrium between these two markets. The results presented in tables 2 and 3 indicate that Edo and Osaka were the two leading markets, for eastern and western Japan, respectively. In eastern Japan, Yonezawa is the sole market that was not influenced by Edo or any other market, but it is unlikely that Yonezawa was in a situation of autarky prices. The fact that causality is running from Sendai to Yonezawa as well as from Edo to Sendai suggest that some indirect influence existed (for the pair Edo-Yonezawa, the causality from Edo to Yonezawa is close to the threshold). The results presented in table 3 are inconclusive for the pair Osaka-Hanshu that were located at very close distance. All other results unambiguously point toward an influence of prices in Osaka on prices in western Japan regional markets. The additional relation between Saga and Kumamoto does not come as a surprise. Both markets are located in Kyushu Island, at some distance of Osaka, and the region of Saga had a structural rice surplus. 6. Market responses to natural hazards and to famine episodes: an Error Correction approach In this section, I use an Error Correction Model (ECM) for analyzing the process of price adjustment during the period 1717-1857 with special attention to the functioning of regional markets in responses to natural hazards, in particular during famines episodes. The method is congruent to that adopted by O’Grada (2001) and O’Grada and Chevet (2002) for studying the functioning of markets during famines in 19th century Finland, and late 17th and early 18th century France.45 We could measure error correction coefficients for any pair of markets but, considering that the results obtained in section 5 point toward a clear role of Osaka as leading market in western Japan and, albeit with some qualifications, a similar role for Edo in eastern Japan, the study focuses on process of price adjustment vis-à-vis prices in Osaka and Edo. Price adjustment in Central Japan’s markets (Nagano, Shinhu and Minami Shinano) is measured vis-à-vis both Osaka and Edo (and coefficients are also reported for Osaka/Edo). While O’Grada and Chevet relied on monthly data, I use yearly series. The justification for the use of yearly data presented by Studer (2006) in his study on market integration in 18th and 19th century India also applies to early modern Japan. Studer convincingly argued that, even in Europe, price adjustment remained until the second half of the 19th century a relatively slow process that was a matter of years, not of months or weeks. Using monthly grain price series for Toulouse and Angoulème 1680-171246, he constructed series of yearly averages, calculated the implied yearly coefficient,47 and showed that “monthly and yearly data describe the adjustment process nearly identically.” As Osaka is the sole market for which monthly prices series are available, it is unfortunately impossible to replicate this calculation in order to check whether there was a similar relationship in early modern Japan between, say, Osaka and Edo. The first step is to estimate the standard ECM that reads as follows48:
!
" logPi,t =# + $." logP
A ,t + % .(logPi& logP
A)t&1 + ' (2)
For each market i, the constant term α indicates the price gap with the leading market A (either Osaka or Edo), while the coefficients β and γ indicate. If markets are efficient, the two conditions that should be met are 0<β<1 and γ<0.
45 Due to the lack of precise information on the cost of transportation between pairs of markets, we cannot adopt the Threshold-ECM method used by Ejrnaes and Persson (2000) and Jacks (2005a). 46 These are some of the underlying data of the study of the integration of French regional wheat markets by O’Grada and Chevet (2002). 47 The monthly adjustment coefficient is 0.054 (5.4% per month); The implied yearly adjustment coefficient is 0.46. 48 As indicated in equation 2, the series are differences in the log of prices and gaps between the price pairs. Individual price series were tested for stationarity.
16
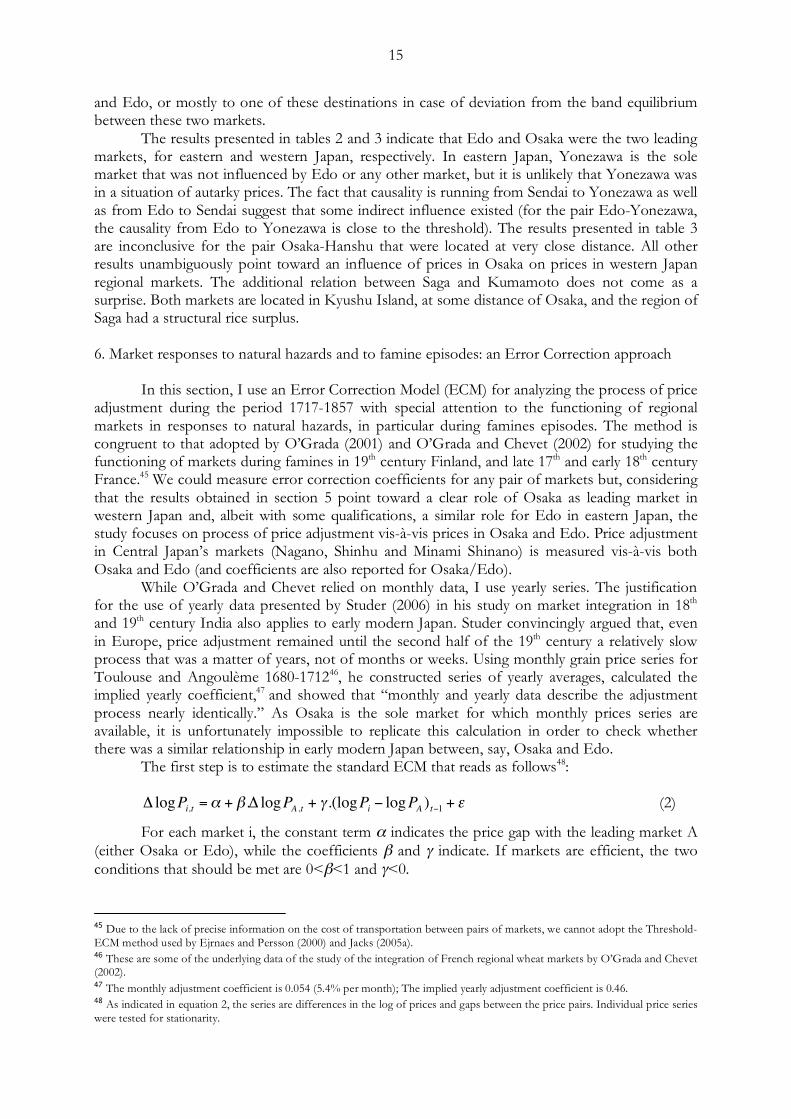
Estimation results for equation 2 are presented in Table 4. All β and γ coefficients are significant and of the expected sign. In most cases, the coefficient α is also significant (Hanshu is the only exception). The yearly error correction coefficients observed for the regional markets of western Japan are higher that the one implied by the French data (Toulouse and Angoulème 1680-1712) but nevertheless lower than 1, which implies that the entire correction of price differential in response to a shock required more than one year. Table 4: Estimation results for equation 2 α β γ R2 Osaka as leading market Edo 0.013*
(2.90) 0.635* (15.19)
-0.459* (-7.13)
0.64
Fukuchiyama -0.013* (-3.13)
0.875* (24.2)
-0.455* (-6.51)
0.82
Hanshu 0.004 (1.39)
0.818* (27.19)
-0.619* (-8.78)
0.85
Hiroshima 0.014* (4.02)
0.908* (27.54)
-0.874* (-10.56)
0.86
Bocho -0.022* (-5.71)
0.916* (29.04)
-0.842* (-10.24)
0.88
Saga -0.045* (-6.60)
0.932* (19.25)
-0.819* (-9.79)
0.78
Kumamoto -0.014* (-3.50)
0.688* (17.94)
-0.648* (-9.41)
0.73
Minami Shinano -0.0562* (-5.65)
0.561* (9.49)
-0.394* (-6.82)
0.48
Shinshu -0.098* (-7.96)
0.504* (8.42)
-0.585* (-8.96)
0.49
Nagoya 0.044* (6.64)
0.853* (19.42)
-0.670* (-9.04)
0.77
Edo as leading market Minami Shinano -0.072*
(-5.94) 0.560* (7.00)
-0.431* (-6.84)
0.40
Shinshu -0.137* (-8.67)
0.587* (7.72)
-0.700* (-9.29)
0.49
Nagoya 0.021* (3.70)
0.988* (15.46)
-0.612* (-7.76)
0.70
Aizu -0.081* (-6.14)
0.857* (9.66)
-0.543* (-7.18)
0.51
Sendai -0.188* (-7.11)
0.356# (2.47)
-0.572* (-7.90)
0.32
Yonezawa -0.121* (-6.31)
0.627* (6.58)
-0.497* (-6.67)
0.36
Echigo -0.104* (-5.58)
0.758* (7.70)
-0.440* (-6.18)
0.37
Number of observations (N)=140 (except for Yonezawa; N=137); t-ratios in parentheses; **= significant at a 1% level; #= significant at a 5% level.
17
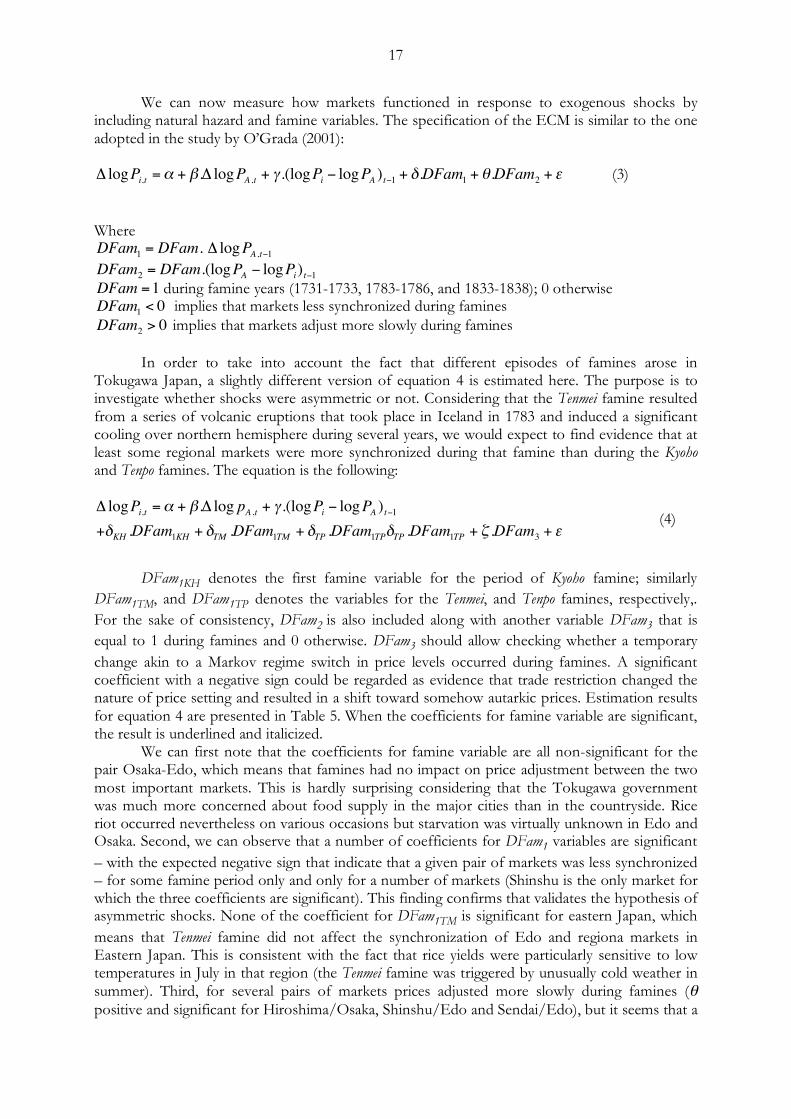
We can now measure how markets functioned in response to exogenous shocks by including natural hazard and famine variables. The specification of the ECM is similar to the one adopted in the study by O’Grada (2001):
!
" logPi,t =# + $." logP
A ,t + % .(logPi& logP
A)t&1 + '.DFam1 + (.DFam2 + ) (3)
Where
!
DFam1 = DFam. " logPA ,t#1
!
DFam2 = DFam.(logPA" logP
i)t"1
!
DFam =1 during famine years (1731-1733, 1783-1786, and 1833-1838); 0 otherwise
!
DFam1
< 0 implies that markets less synchronized during famines
!
DFam2
> 0 implies that markets adjust more slowly during famines In order to take into account the fact that different episodes of famines arose in Tokugawa Japan, a slightly different version of equation 4 is estimated here. The purpose is to investigate whether shocks were asymmetric or not. Considering that the Tenmei famine resulted from a series of volcanic eruptions that took place in Iceland in 1783 and induced a significant cooling over northern hemisphere during several years, we would expect to find evidence that at least some regional markets were more synchronized during that famine than during the Kyoho and Tenpo famines. The equation is the following:
!
" logPi,t =# + $." log pA ,t + % .(logPi & logPA )t&1
+'KH .DFam1KH + 'TM .DFam1TM + 'TP .DFam1TP'TP .DFam1TP + ( .DFam3 + ) (4)
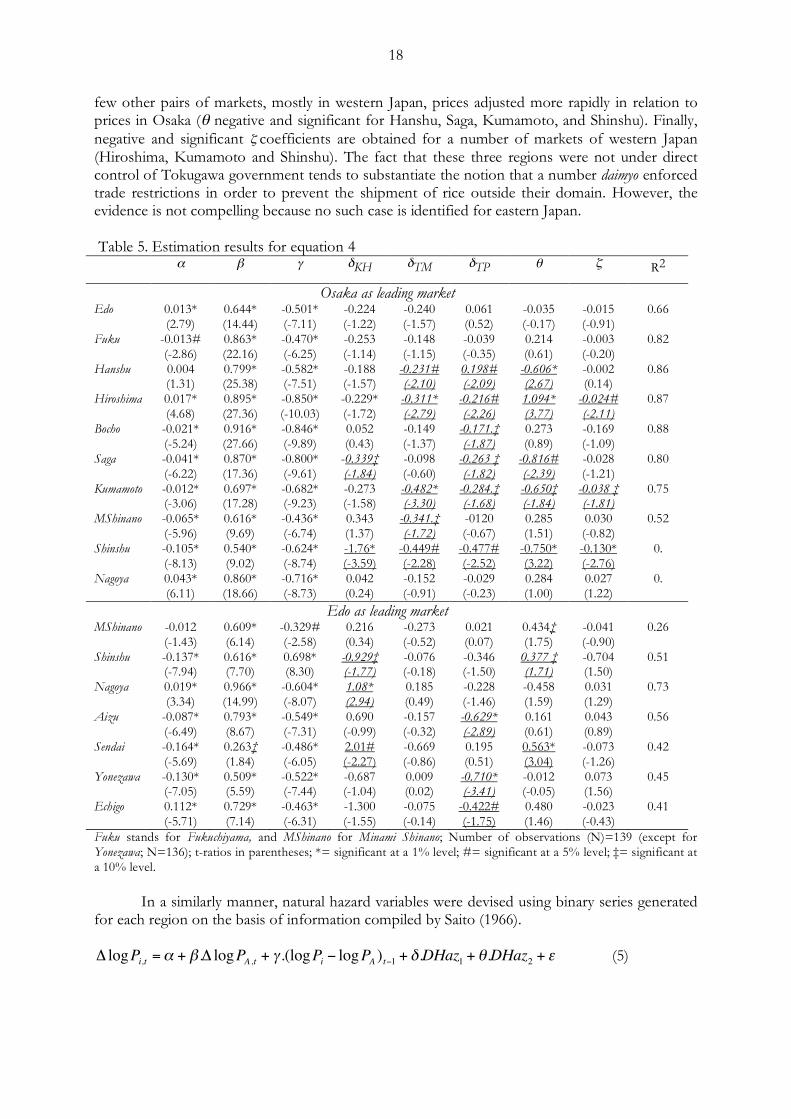
DFam1KH denotes the first famine variable for the period of Kyoho famine; similarly DFam1TM, and DFam1TP denotes the variables for the Tenmei, and Tenpo famines, respectively,. For the sake of consistency, DFam2 is also included along with another variable DFam3 that is equal to 1 during famines and 0 otherwise. DFam3 should allow checking whether a temporary change akin to a Markov regime switch in price levels occurred during famines. A significant coefficient with a negative sign could be regarded as evidence that trade restriction changed the nature of price setting and resulted in a shift toward somehow autarkic prices. Estimation results for equation 4 are presented in Table 5. When the coefficients for famine variable are significant, the result is underlined and italicized. We can first note that the coefficients for famine variable are all non-significant for the pair Osaka-Edo, which means that famines had no impact on price adjustment between the two most important markets. This is hardly surprising considering that the Tokugawa government was much more concerned about food supply in the major cities than in the countryside. Rice riot occurred nevertheless on various occasions but starvation was virtually unknown in Edo and Osaka. Second, we can observe that a number of coefficients for DFam1 variables are significant – with the expected negative sign that indicate that a given pair of markets was less synchronized – for some famine period only and only for a number of markets (Shinshu is the only market for which the three coefficients are significant). This finding confirms that validates the hypothesis of asymmetric shocks. None of the coefficient for DFam1TM is significant for eastern Japan, which means that Tenmei famine did not affect the synchronization of Edo and regiona markets in Eastern Japan. This is consistent with the fact that rice yields were particularly sensitive to low temperatures in July in that region (the Tenmei famine was triggered by unusually cold weather in summer). Third, for several pairs of markets prices adjusted more slowly during famines (θ positive and significant for Hiroshima/Osaka, Shinshu/Edo and Sendai/Edo), but it seems that a
18
few other pairs of markets, mostly in western Japan, prices adjusted more rapidly in relation to prices in Osaka (θ negative and significant for Hanshu, Saga, Kumamoto, and Shinshu). Finally, negative and significant ζ coefficients are obtained for a number of markets of western Japan (Hiroshima, Kumamoto and Shinshu). The fact that these three regions were not under direct control of Tokugawa government tends to substantiate the notion that a number daimyo enforced trade restrictions in order to prevent the shipment of rice outside their domain. However, the evidence is not compelling because no such case is identified for eastern Japan. Table 5. Estimation results for equation 4 α β γ δKH δTM δTP θ ζ R2
Osaka as leading market Edo 0.013*
(2.79) 0.644* (14.44)
-0.501* (-7.11)
-0.224 (-1.22)
-0.240 (-1.57)
0.061 (0.52)
-0.035 (-0.17)
-0.015 (-0.91)
0.66
Fuku -0.013# (-2.86)
0.863* (22.16)
-0.470* (-6.25)
-0.253 (-1.14)
-0.148 (-1.15)
-0.039 (-0.35)
0.214 (0.61)
-0.003 (-0.20)
0.82
Hanshu 0.004 (1.31)
0.799* (25.38)
-0.582* (-7.51)
-0.188 (-1.57)
-0.231# (-2.10)
0.198# (-2.09)
-0.606* (2.67)
-0.002 (0.14)
0.86
Hiroshima 0.017* (4.68)
0.895* (27.36)
-0.850* (-10.03)
-0.229* (-1.72)
-0.311* (-2.79)
-0.216# (-2.26)
1.094* (3.77)
-0.024# (-2.11)
0.87
Bocho -0.021* (-5.24)
0.916* (27.66)
-0.846* (-9.89)
0.052 (0.43)
-0.149 (-1.37)
-0.171.‡ (-1.87)
0.273 (0.89)
-0.169 (-1.09)
0.88
Saga -0.041* (-6.22)
0.870* (17.36)
-0.800* (-9.61)
-0.339‡ (-1.84)
-0.098 (-0.60)
-0.263 ‡ (-1.82)
-0.816# (-2.39)
-0.028 (-1.21)
0.80
Kumamoto -0.012* (-3.06)
0.697* (17.28)
-0.682* (-9.23)
-0.273 (-1.58)
-0.482* (-3.30)
-0.284.‡ (-1.68)
-0.650‡ (-1.84)
-0.038 ‡ (-1.81)
0.75
MShinano -0.065* (-5.96)
0.616* (9.69)
-0.436* (-6.74)
0.343 (1.37)
-0.341.‡ (-1.72)
-0120 (-0.67)
0.285 (1.51)
0.030 (-0.82)
0.52
Shinshu -0.105* (-8.13)
0.540* (9.02)
-0.624* (-8.74)
-1.76* (-3.59)
-0.449# (-2.28)
-0.477# (-2.52)
-0.750* (3.22)
-0.130* (-2.76)
0.
Nagoya 0.043* (6.11)
0.860* (18.66)
-0.716* (-8.73)
0.042 (0.24)
-0.152 (-0.91)
-0.029 (-0.23)
0.284 (1.00)
0.027 (1.22)
0.
Edo as leading market MShinano -0.012
(-1.43) 0.609* (6.14)
-0.329# (-2.58)
0.216 (0.34)
-0.273 (-0.52)
0.021 (0.07)
0.434‡ (1.75)
-0.041 (-0.90)
0.26
Shinshu -0.137* (-7.94)
0.616* (7.70)
0.698* (8.30)
-0.929‡ (-1.77)
-0.076 (-0.18)
-0.346 (-1.50)
0.377 ‡ (1.71)
-0.704 (1.50)
0.51
Nagoya 0.019* (3.34)
0.966* (14.99)
-0.604* (-8.07)
1.08* (2.94)
0.185 (0.49)
-0.228 (-1.46)
-0.458 (1.59)
0.031 (1.29)
0.73
Aizu -0.087* (-6.49)
0.793* (8.67)
-0.549* (-7.31)
0.690 (-0.99)
-0.157 (-0.32)
-0.629* (-2.89)
0.161 (0.61)
0.043 (0.89)
0.56
Sendai -0.164* (-5.69)
0.263‡ (1.84)
-0.486* (-6.05)
2.01# (-2.27)
-0.669 (-0.86)
0.195 (0.51)
0.563* (3.04)
-0.073 (-1.26)
0.42
Yonezawa -0.130* (-7.05)
0.509* (5.59)
-0.522* (-7.44)
-0.687 (-1.04)
0.009 (0.02)
-0.710* (-3.41)
-0.012 (-0.05)
0.073 (1.56)
0.45
Echigo 0.112* (-5.71)
0.729* (7.14)
-0.463* (-6.31)
-1.300 (-1.55)
-0.075 (-0.14)
-0.422# (-1.75)
0.480 (1.46)
-0.023 (-0.43)
0.41
Fuku stands for Fukuchiyama, and MShinano for Minami Shinano; Number of observations (N)=139 (except for Yonezawa; N=136); t-ratios in parentheses; *= significant at a 1% level; #= significant at a 5% level; ‡= significant at a 10% level. In a similarly manner, natural hazard variables were devised using binary series generated for each region on the basis of information compiled by Saito (1966).
!
" logPi,t =# + $." logP
A ,t + % .(logPi& logP
A)t&1 + '.DHaz1 + (.DHaz2 + ) (5)
19
The specifications of DHaz1 and DHaz2 are similar to those of DFam1 and DFam2, respectively. It turns out that the coefficients for DHaz1 and DHaz2 are not significant. This suggests that natural hazards, as such, or perhaps more correctly exogenous shocks of relatively small magnitude and/or that were not repeated over a 2 or 3-year period, did not affect the functioning of regional markets. 7. Conclusion: a tale of two countries Early modern Japan appears, to a large extent, as a counterexample to the argument advanced by Smith regarding the role of market integration in the prevention or alleviation of famines. Overall, regional rice markets were fairly well integrated and they functioned surprisingly well during the different famines. Natural hazards as such did not affect market integration; the resilience of economic systems was put to its limits when natural hazards occurred in succession. We can summarize the findings by contrasting the situations of eastern and western Japan. In normal circumstances, price adjustment with Edo of eastern Japan regional markets was not as smooth and rapid as price adjustment with Osaka of western Japan regional markets. But, contrary to the expectation that could be based on large price gaps and the high degree of fluctuation of regional prices relative to prices in Edo, it appears that eastern Japan regional markets did not shift to autarkic prices during famines. Quite the opposite: price adjustment was barely altered by famines in eastern Japan while prices tended to be less synchronized and adjustment slower in number of markets of western Japan. Some regions of western Japan experienced famines in spite of relatively low transportation costs, a high degree of regional integration, and the existence of sophisticated market mechanisms in Osaka. In the event of natural hazards, shipment of rice or other staple form surplus to deficit regions was in principle possible. Trade restriction possibly aggravated the magnitude of famines but, since ecological vulnerability was high, the most likely explanation for excess mortality is that western Japan as a whole was overpopulated, for the given set of techniques and institutions of the time. In eastern Japan, by contrast, markets were reasonably well integrated if we consider how high transportation costs were, particularly in inland regions. But it is likely that, in the event of natural hazards, the shipment of rice or other staple form surplus to deficit regions was uneconomical. In spite of the recurrence of natural hazards related to climate anomalies, Japan did not experience famine during the second half of the 19th century; what is more, the population started to expand rapidly. A combination of factor could explain how this result was achieved. The first and most obvious one is the unification of the national market, which means that regional prices gradually converged toward Osaka and Tokyo level by the turn of the century. The power revolution in maritime and, later, land transportation drastically reduced the cost of shipment over long distance, making rice surplus in Kyushu available in the Tohoku in the event of a crop failure. Rice cultivation expanded in region of high ecological vulnerability (low summer temperature in normal years) because the cultivation of other cereals and buckwheat was not required anymore as buffer in case of rice crop failure. An additional explanation may be the eastward diffusion of new crops, particularly sweet potatoes and Irish (American) potatoes, made emergency crops available in regions of eastern Japan that had to rely previously on cultivation non-rice grains as a risk management device and the carry-over of rice stored during several years as safety stock. The conversion of dry fields previously used for the cultivation of cereals other than rice into paddy fields, and the increase of potato cultivation resulted in an increase in food output per hectare, measured in terms of calories, and not only dissipated the specter of famine but also allowed feeding appropriately a growing population. This achievement too suggests that the famines experienced in early modern Japan had been mostly due to the inadequacy of aggregate food supply.
20
References Allen, Robert, Jean-Pascal Bassino, Debin Ma, Christine Moll-Murata, and Jan Luiten van
Zanden (2006). Wages, Prices, and Living Standards in China, Japan, and Europe (1738-1925). Paper presented at the World Congress of Economic History, Helsinki, August.
Bassino, Jean-Pascal (2006), Agricultural output and food supply in Meiji Japan: economic miracle or creative destruction?” Economic Development and Cultural Change, 54-2, 503-520.
Bassino, Jean-Pascal and Debin Ma (2005). Japanese Unskilled Wages in International Perspective, 1741-1913, Research in Economic History, 229-248.
Bengtsson T. and O. Saito, eds. (2000). Population and Economy: From Hunger to Modern Economic Growth Oxford: Oxford University Press.
Bird, Isabella (1991 (1911)), Unbeaten tracks in Japan. Tokyo: Tuttle. Ejrnaes, Mette and Karl Gunnar Persson (2000). Market Integration and Transport Costs in
France 1825-1903: A Threshold Error Correction Approach to the Law of One Price. Explorations in Economic History, 37, 149-173.
Ushio, Haruo, Noriaki Kurokawa and Takayoshi Nakamura eds (1974), Nihon retto ni okeru jinko bunpai to choki jikeiretsu bunseki (Analysis of Japanese archipelago’s population distribution and long term time series). Tokyo: Institute for Social Engineering (Shakaikogaku Kenkyujo).
Epstein, S.R. (2000). Freedom and Growth: the Rise of States and Markets in Europe, 1300-1750. London: Routledge.
Hamori, Shigeyuki, Naoko Hamori and David A. Anderson (2001). An Empirical Analysis of the Efficiency of the Osaka Rice Market During Japan's Tokugawa Era, Journal of Future Markets, 21:861-874.
Highwood, E. J. and D.S. Stevenson (2003). Atmospheric Impact of the 1783-1784 Laki Eruption: Climatic Effect of Sulfate Aerosols. Atmospheric Chemistry and Physics, 3, 1177-1189.
Huber, J. Richard (1971). Effect on Prices of Japan's Entry into World Commerce after 1858. The Journal of Political Economy, Vol. 79, No. 3. (May - Jun.), pp. 614-628.
Iwahashi, Masaru (1981). Kinsei Nihon bukka shi no kenkyu (Studies on Price History in Early Modern Japan). Tokyo: Ohara Shinsei Sha.
Jacks, David (2005a). Intra- and International Commodity Market integration in the Atlantic Economy, 1800-1913. Explorations in Economic History, 42, 381-413.
Jacks, Daniel (2005b). Market Integration in the North and Baltic Seas, 1500-1800. Journal of European Economic History, 285-329.
Keller, Wolfgang and Carol H. Shiue (2007). The Origins of Spatial Interaction, Evidence from Chinese Rice Markets, 1742-1795. Journal of Econometrics, 140-1, 304-332.
Keller, Wolfgang and Carol H. Shiue (2007). Tariffs, Trains, and Trade: The Role of Transportation versus Technology in the Expansion of Markets. Mimeo.
http://spot.colorado.edu/~shiue/TTTIT.pdf Kikuchi, Isao (1997). Kinsei no kikin [Famines in Early Modern Japan]. Tokyo: Yoshikawa
Kobunkan. Kusano, Masahiro (1996). Kinsei no shijo keizai to chiikisa, bukkashi kara no sekkin [
]. Kyoto Daigaku Gakujitsu Shuppankai. Malthus, Thomas (1798). An Essay on the Principle of Population, as it Affects the Future
Improvement of the Society. London: J. Johnston. Mitsui Bunko (ed.) (1989). “Kinsei Nihon goki ni okeru juyo bukka no dotai (Trends of Major
Prices in Early Modern Japan). Tokyo: University of Tokyo Press Miyamoto Mataji ed. (1963). Kinsei Osaka no bukka to rishi (Prices and Interest Rates in Early
Modern Osaka). Tokyo: Sobunsha.
21
Miyamoto, Matao (1975). Kinsei beika no hendo to Osaka ni okeru beikoku etsunen komedaka jukyu; Osaka beika, zenkoku beika, Osaka beika no ugoki (The fluctuation of rice prices and the demand and supply for rice in the Osaka market: 17321-1859). Osaka Daigaku Keizaigaku (Osaka Economic Papers), 25, 2-3, Dec., pp. 222-247.
Miyamoto, Matao (1981). Edo jidai no okeru shochiho komeshijokan no renkansei ni tsuite, 1651-1850 nen (Relationships among local rice markets in the Tokugawa period, 1651-1850). Osaka Daigaku Keizaigaku (Osaka Economic Papers), 31, 2-3, Dec., pp. 276-307.
Miyamoto, Matao (1985). Edo jidai ni okeru bukka no chiiki hikaku to shijo keisei (Comparison of Price levels and Market Formation in the Edo Period), in Harada, Toshimaru and Miyamoto, Matao eds., Rekishi no naka no bukka, zenkogyoka shakai no bukka to hatten (Prices in History; Prices and Economic Development Before the Industrialisation). Tokyo: Dobunkan, pp. 147-208.
Miyamoto, Matao (1986a), Emergence of National Market and Commercial Activities in Tokugawa Japan with special reference to the rice market, Osaka Economic Papers vol. 36, 1-2, pp.291-310.
Miyamoto, Matao (1986b), Kinsei Nihon no shijo keizai : Osaka kome shijo bunseki (The market economy of early modern Japan: An analysis of Osaka rice market). Tokyo : Yuhikaku.
O’Grada, Cormac (2001), Markets and Famines: Evidence from Nineteenth-Century Finland. Economic Development and Cultural Change, 49-3, 575-590.
O’Grada, Cormac and Jean-Pierre Chevet (2002). Famine and Market in Ancien Regime France. Journal of Economic History, 62-3, 706-733.
Ogasawara, Nagakazu and Masaru Kawamura (1982). Chiba ken no Rekishi. Tokyo: Yamakawa Shunpansha.
Oman, L., A. Robock, G. L. Stenchikov, and T. Thordarson (2006). High-latitude eruptions cast shadow over the African monsoon and the flow of the Nile, Geophysical Research Letters, 33.
Ono Takeo ed. 1980. Edo bukka jiten, Tokyo : Tenbosha. Persson, Karl Gunnar (1999). Grain Markets in Europe, 1500-1900: Integration and
Deregulation. Cambridge: Cambridge University Press. Ravaillon, Martin (1987). Markets and Famines, Oxford: Oxford University Press. Ravaillon, Martin (1997). Famines and Economics, Journal of Economic Literature, 35-5, 1219-
1921. Saito, Kentaro (2005). Real wages and the Market Integration in Modern Japan; Male agricultural
labourers, the 1890s to the 1930s. Paper presented at the World Congress of Economic History, Helsinki, August.
Saito, Osamu (1998). Chingin to rodo to seikatsu suijun: Nihon keizaishi ni okeru 18-20 seiki, (Wages, labor, and living standards in Japan from the 18th to the 20th century). Tokyo: Iwanami Shoten.
Saito, Osamu (2002)."The frequency of famines as demographic correctives in the Japanese past," Famine Demography: Perspectives from the Past and Present (T. Dyson and C. O’Grada, eds.) Oxford: Oxford University Press, pp. 218-239.
Saito, Ren-ichi (1966). Fukenbetsu nenbetsu kisho saiga hyo [ ┬ Annual Prefecture-Level Tables of Climate and Natural Hazards].
Sen, Amartya (1981). Poverty and Famines, An Essay on Entitlement and Deprivation. Oxford: Oxford University Press.
Shimbo, Hiroshi (1985). “Edo Sueki (bunsei-bakumatsu.Isshinki) ni okeru bukka doko to keizai Hatten (Prices and Economic Development in the Late Edo Period)” in Harada, Toshimaru and Miyamoto, Matao eds., Rekishi no Naka no Bukka, Zenkogyoka Shakai no Bukka to Hatten (Prices in History; Prices and Economic Development Before the Industrialisation). Tokyo: Dobunkan, pp. 107-146.
Shiue, Carol H. (2002). Transport Costs and the Geography of Arbitrage in Eighteenth-Century China, 92-5,
22
Shiue, Carol H. (2004). Local Granaries and Central Government Relief: Moral Hazard and Intergovernmental Finance in 18th and 19th century China. Journal of Economic History, 64-1, 100-124.
Shiue, Carol H. and Wolfgang Keller (2004). Markets in China and Europe on the Eve of the Industrial Revolution, NBER Working Paper#10778 http://papers.nber.org/papers/W10778
Smith, Adam (1776) An Inquiry into the Nature and Causes of the Wealth of Nations. London: Methuen and Co., Ltd., ed. Edwin Cannan, 1904. Fifth edition.
Spurr, William A. (1938). Business Cycles in Japan Before 1853. Journal of Political Economy, vol. 46, No. 5 (Oct), 653-687.
Studer, Roman (2006). India and the Great Divergence: Assessing the Efficiency of Grain Markets in 18th and 19th Century India. Oxford University, Nuffield College, Working Paper (Forthcoming in the Journal of Economic History in 2008).
Takatsuki, Haruo (2007). Kinsei Nihon okeru shijokan undo; chuo shijo to bunka keisei no hakyo (The rice price co-movement in Tokyugawa Japan). Osaka University Discussion Paper in Economics and Business 07-21.
Totman, Conrad (1993). Early Modern Japan. Berkeley: University of California Press. Umemura, Mataji, Nobukyo Takamatsu, and Shigeru Itoh (1983). Chiiki Keizai Tokei (Regional
Economic Statistics), Choki Keizai Tokei (Estimates of Long Term Economic Statistics), Volume 13.Tokyo: Toyo Keizai.
Vaporis, Constantine Nomikos (1994). Breaking Barriers; Travel and the State in Early Modern Japan. Cambridge (Mass.): Harvard University Press.
Wakita. Shigeru (2001). Efficiency of the Dojima rice futures market in Tokugawa period Japan, Journal of Banking & Finance, 25-3, 535-554.
White, James W. (1995). Ikki; Social Conflict and Political Protest in Early Modern Japan. Ithaca and London: Cornell University Press (ANU)
Wigen, Karen (1995). The making of a Japanese Periphery, 1750-1920. Berkeley: California University Press.
Yamakawa, Shuji (1999). Kosuiki ni okeru kiko hendo to shizen kasai (Climate variations and natural disasters in Little Ice Age). Bulletin of the National Museum of Japanese History, 81, 51-55.
Yamamura, Kozo (1988). From Coins to Rice: hypotheses on Kandaka and Kokudaka Systems. Journal of Japanese Studies, 14-2, 341-367.
Yamasaki Ryuzo (1983). Kinsei bukka shi kenkyu (Studies on Early Modern Price History). Tokyo: Ohara Shinseisha.
Zielinski, G. A., R. J. Fiacco, P. A. Mayewski, L. D. Meeker, S. Whitlow, M. S. Twickler, M. S. Germani, K. Endo, and M. Yasui (1994), Climatic impact of the A.D. 1783 Asama (Japan) eruption was minimal: Evidence from the GISP2 ice core, Geophysical Research Letters, 21(22), 2365–2368.


![[Amartya Sen] Poverty and Famines an Essay on Ent(BookFi.org)](https://img.pdfslide.us/doc/110x75/563db81b550346aa9a90a2f9/amartya-sen-poverty-and-famines-an-essay-on-entbookfiorg.jpg)