Embed Size (px)
Citation preview

MARKET EXPECTATIONS AMID ECONOMIC INDICATORS
C H Williams Talhar Wong & Yeo Sdn. Bhd. (24706-T)
“ Wo r k To g e t h e r Wi t h Yo u ”
Vo l u m e 7, I s s u e 3
July - September, 2009
Inside this issue:
MARKET EXPECTATIONS AMIDECONOMIC INDICATORS .............. 1
ECONOMY ...................................... 4
PROPERTY NEWS .......................... 5
NEW PROJECTS LAUNCHED ....... 6
COMMODITIES ............................... 8
DEVELOPMENT NEWS .................. 9
DEMAK LAUT INDUSTRIAL PARKPHASE III READY BUILTFACTORIES .....................................10
NEW BUILDING ICONS FORSARAWAK ........................................11
PERFORMANCE OF AUCTIONS /TENDERS ........................................ 12
PPK 344/06/2010 (023984)
0.0
50.0
100.0
150.0
200.0
250.0
300.0
1990 1991 1992 1993 1994 1995 1996 1997 1998 1999 2000 2001 2002 2003 2004 2005 2006 2007 2008 2009 *
KLSE IHRM IHRS CPI Msia CPI Swak
Year
Ind
ex
Indices-KLSE,HPI,CPI
The Economic Outlook
Malaysia took a strong beating from the global financial crisis in the 1st half of 2009 as the Malaysian indices contracted significantly.As the external sector tumbled, Malaysia’s GDP contracted by a steep -6.2% in Q1 2009, following a stagnant 0.1% growthin Q4 2008. External demand nose dived, dragging Malaysia’s exports down sharply in Q1 2009, affecting investments aswell.
2008 2009 2010WorldWorld Bank 1.9 -2.9 2.0International Monetary Fund (IMF) 3.1 -1.1 3.1MalaysiaAsian Development Bank (ADB) 4.6 -3.1 4.2MIER 5.1 -4.2 2.8MIDF NA -3.3 4.3Source : WTWY Research 2009
Table 1 GDP Growth Forecast (2009-2010)
Worse than RecoveryGDP Growth Forecast (%) expected expected
The GDP for Malaysia is projected to contract by between 3% to 4% for 2009 but expectedto see some positive growth of between 3% to 4% for 2010.

Page 2 Volume 7, Issue 3
MARKET EXPECTATIONS AMID ECONOMIC INDICATORS
Despite some positive signs in equities and commodities, analysts feel that the road to global recovery appears sluggish anduneven, with many more challenges to come. The World Bank’s and IMF’s revised projection reflects a deeper decline in2009. Overall, the World Bank feels that recovery has started but stresses that the economic crisis is far from over, despitea predicted return to positive global growth in 2010. While the global economy is likely to begin expanding again from thesecond half of 2009, the recovery is expected to be subdued as global demand remains depressed, unemployment remainshigh, and recession-like conditions continue until 2011.
As the global financial crisis unfolded in the Asian region which had been relatively shielded, Asian economic and marketindicators fell further from its lethargic pace in Q4 2008 into 2009.
However, by Q3 2009, there are some signs of recovery which offer glimmers of hope that the worse of the economic downturnis possibly over. The rate of decrease in many sectors seemed to have slowed down and the economy seems to be on theroad to recovery.
The Property Market
By and large, there seemed to be some movements now in the Malaysian property scene as detected by increased activitiesin recent months, especially after Bank Negara slashed the overnight policy rate to an all-time low of 2% per annum in February2009 and the subsequent drop in housing mortgage rates to as low as base lending rate minus 2.3% currently.
With the low bank interest rates, alternative investment in tangible assets like real estate is becoming attractive as it is oneof the best instruments to hedge against inflation.
The recent survey in mid July 2009 by MIER shows that people were more willing to spend since the 2nd quarter 2009. Comparedto Q1 2009, there is more bounce in the spending plans of households, with cars and personal computers high on the list,followed by furniture and higher demand for houses from central, northern and urban consumers (Source : MIER 24th NationalEconomic Briefing, 16 July 2009).
Even as the Consumer Sentiments Index improve, the Residential Property Index also shows similar upturn, although it’s tooearly to say if the recovery is permanent.
The Sarawak property market (and even more apparent elsewhere in Malaysia, especially in major towns like KL and Penang,albeit slower than the other regional markets of Singapore, HK and China) seems to be slowly lifting itself out from the gloomof 2008 by the 2nd quarter of 2009, and seems to show signs of recovery by the 3rd quarter of 2009. However, this upturndoes not mean a turnaround just yet, as the economy is expected to only fully recover after 2011.
Economic Indicators
The following indicators have shown an uptrend for Q2 2009 :
Consumer Sentiment Index (CSI)
• CSI surges 26.9 points (Q-O-Q) to breach 100 pointsthreshold level
Business Confidence Index (BCI)
• BCI gains 44.1 points (Q-O-Q)

SARAWAK PROPERTY BULLETIN Page 3
MARKET EXPECTATIONS AMID ECONOMIC INDICATORS
Consumer Price Index (CPI)
• CPI for Sarawak experienced a big increase in 2008(5.9%), mainly due to the increase in oil and commodityprices, but has since remained stagnant for 2009, asprices start to stabilise.
Consumer Price Index (2009/2008)
102
104
106
108
110
112
114
116
118
January February March April May June July August September October November December
Month
Ind
ex
2008 2009
Bank Interest Rates (%)
• The interest rates have reached an all time low of BLRof 5.51 and ALR of 4.84 as at August 2009.
Base and Average Lending Rate - Commercial Banks
7.49
8.68
9.29
8.22
6.83
8.03
9.18
10.33
8.04
6.79 6.70
5.51
8.99
9.72
10.29
9.65
8.24
9.28
10.12
11.51
9.72
7.757.46
6.08
4.84
5.98
6.006.39
6.78
6.396.20
6.726.72
5.98 6.12
6.57
6.116.51
6.67 6.41
0.00
2.00
4.00
6.00
8.00
10.00
12.00
14.00
1990 1991 1992 1993 1994 1995 1996 1997 1998 1999 2000 2001 2002 2003 2004 2005 2006 2007 2008 Aug
2009Year
BL
R/A
LR
(%
)
Commercial banks Average BLR
Average Lending Rate
Residential Property Index (RPI)
• The Residential Property Index shows an upturn (intandem with CSI) but too early to say it’s a turnaround.
Non-performing loans (NPL)
• The number of non-performing loans have dropped forMalaysia. However, the percentage (%) of nonperforming loans contributed from the broad propertysector has increased.
Non-Performing Loans for Property Sector
0
5000
10000
15000
20000
25000
30000
35000
Year
RM
mil
lio
n
0.00%
5.00%
10.00%
15.00%
20.00%
25.00%
30.00%
35.00%
40.00%
45.00%
% c
ha
ng
e N
PL
fo
r p
rop
ert
y
Broad Property Sector (RM million) 12555 13152.8 16213.8 19683.2 18628.2 15908.5 13654 13219.3
Others (RM million) 32774.1 29192.9 28686 27792.5 29913.9 24665.4 20406.7 19196.6
% of NPL for broad property sector 27.70% 31.06% 36.11% 41.46% 38.38% 39.21% 40.09% 40.78%
2002 2003 2004 2005 2006 2007 2008 2009
(Cont’d on Page 12)

Page 4 Volume 7, Issue 3
E C O N O M Y
Consumer Price Index (Jan-June 2009) increases by 2.5%
The Consumer Price Index (CPI) for Jan-June 2009 increased by 2.5% to 111.7 compared with 109.0 in the same periodlast year. However, when compared to the same month in 2008, the CPI for June registered a decrease of 1.4% from 113.4to 111.8. This decline is due to changes in the price of petrol and diesel, starting in June 2008. However, compared tothe previous month of May, the CPI increased by 0.1%. The 2.5% increase was contributed largely by increase in the indicesof all the main groups such as food and beverage (+7.2%) and housing, water, electricity, gas and other fuels (+1.6%), exceptthose of transport (-5.3%), clothing and footwear (-0.8%) and communications (-0.5%).
Source : Eastern Times, 23/7/2009
PeriodSales Value No. of Employees Salaries & Wages Productivity
(RM mil) (end of June 2009) (RM mil) (RM mil)
Jan-June 2009 216,456.8 933,357.0 11,257.5 231912
Jan-June 2008 291,991.2 1,012,655.0 12,252.0 288342
Difference -75,534.4 -79,298.0 -994.5 -56430
% -25.9 -7.8 -8.1 -19.6
Source : Compiled by WTWY Research (2009)
Almost half of Malaysia’s approved investments in the manufacturing sector so far for 2009 went to Sarawak which receivedRM7.3 billion, or 46% of the total. 1/4 was from local companies, while the rest were from foreign firms with active participationin capital intensive industries such as chemical, metal and wood products as well as other foreseeable areas in hydro powerprojects, aluminium, steel and agriculture.
Source : New Straits Times, 19/8/2009
Industrial Production Index Malaysia 2008-2009
140.0
120.0
100.0
80.0
60.0
40.0
20.0
0.0Jan-08 Feb-08 Mar-08 Apr-08 May-08 Jun-08 Jul-08 Aug-08 Sep-08 Oct-08 Nov-08 Dec-08 Jan-09 Feb-09 Mar-09 Apr-09 May-09 Jun-09 Jul-09
15.0
10.0
5.0
0.0
-5.0
-10.0
-15.0
-20.0
-25.0
-30.0
Overall
Overall (%)
Mining
Mining (%)
Manufacturing
Manufacturing (%)
Electricity
Electricity (%)
Ind
ices
Ind
ex G
row
th %
Manufacturing sector statistics (Jan-June 2009)
Source : Compiled by WTWY Research (2009)
SARAWAK PROPERTY BULLETIN Page 5
E C O N O M Y
MIER revises downward GDP target to -4.2%
The MIER has revised downwards its GDP target for Malaysia this year to -4.2% from -2.2% previously, citing deep declinesin macro indicators and the still fragile business and consumer confidence. It also lowered its 2010 growth forecast to 2.8%from 3.3% in anticipation of a more gradual “U” shape recovery rather than a “V” shape recovery. The think-tank also predictedthat exports would fall by as much as 21.8% for 2009 before growing by up to 7.3% for 2010. Inflation is expected to average1.6% this year and 2.5% in 2010 while unemployment was expected to reach 4.8% this year and moderate to 4.5% for 2010.
The Ringgit was still weak in the face of a downtrend in exports and was expected to remain volatile until recovery in a yearor two.
Source : 2nd Quarter 2009 Malaysian Economic Outlook, MIER
GDP declines at a slower rate in 2Q 2009
The Malaysian GDP contracted at a slower rate of 3.9% in the 2nd quarter of 2009 (Q1 2009 : 6.2%) with growth led by increasein public spending and private consumption. The services sector posted a positive growth of 1.6% due to better performanceof the finance and insurance subsector, and construction growth strengthened to 2.8% induced by the stimulus packageswhile the agriculture sector turned around with 0.3% growth supported by strong production of food crops and smaller declinein industrial crops.
BNM expected further improvements in the 3rd quarter of 2009, with an even slower rate of decline before positive growthemerges in the 4th quarter of 2009. Domestic demand is expected to gain some momentum with easier access to financing,lower rate of inflation and a stable financial market.
A revised GDP 2009 growth forecast will be announced in October 2009, together with the Budget for 2010.
Source : Adapted from Announcement by BNM governor, as reported in the NST 27/8/2009
BOUNCING OFF THE BOTTOM OF THE PROPERTY CYCLE ?
Barely a year after property prices plummet, the present increasing global liquidity appears to have lifted pricesof assets like stocks and property. The mother of all property indices, the Case Shiller Composite 20 Home Indexsaw its 1st month-on-month rise in May 2009 after falling 33% from a peak in July 2006. Property prices andtransactions in Asian countries like China, Hong Kong, Singapore, Taiwan and South Korea have risen from depressedlevels of the 1st quarter of 2009.
In Malaysia, lower interest rates, buoyant stock market, and better consumer sentiment have combined to boostdemand for properties. Bargain hunters queued for properties launched by reputable developers in major citieslike KL and Penang. Property companies are generally seeing better demand for property, and property agentsare seeing renewed interest from home buyers. However, the rental market remains soft as new supply outstripsdemand especially in the condominiums and office sector, where multi-nationals are downsizing. This is likelyto translate into lower rentals but not necessarily lower property prices as yields of alternative investments arelow at 2% or less. The low interest rates which have increased liquidity will likely create a bubble which wouldhopefully compensate for the current downturn. Meanwhile, property prices and stocks are likely to rise in theliquidity-induced asset price inflation. The prices of property stocks in Malaysia have risen sharply from their lowsin March 2009. But whether the property cycle has really bottomed out remains to be seen.
Source : Adapted from Starbiz, 17/8/2009
PR
OP
ER
TY
NE
WS
○ ○ ○ ○ ○ ○ ○ ○ ○ ○ ○ ○ ○ ○ ○ ○ ○ ○ ○ ○ ○ ○ ○ ○ ○ ○ ○ ○ ○ ○ ○ ○ ○ ○ ○ ○ ○ ○ ○ ○ ○ ○ ○ ○ ○ ○ ○ ○ ○ ○ ○ ○ ○ ○ ○ ○ ○ ○ ○ ○ ○ ○ ○
New Low Cost Houses to be 75% larger
New low cost houses will be 75% larger in terms of floor area, which will be increased from 400 sf to 700 sf althoughthe price will remain the same, at the ceiling price of RM42,000 and RM47,000. This hopes to make the low costhousing more conducive to present living conditions and to deter social ills.
Source : Eastern Times, 23/7/2009

Page 6 Volume 7, Issue 3
KUCHING
BINTULU
DORSETT CLOSE offers 8 units of exclusive semi-detached residentialunits at Jalan Bintangor, Kuching. Starting at a price from RM950,000,each unit consists of 2 full levels of living area, plus an attic and a spaciousbasement. It has a built-up area of more than 4,000 sq ft. and land areafrom 10 pts.
Twin One Resources Sdn Bhd is a mixed development located along 6th Mile, Jalan Matang offering 30 units of terracedand 24 units of semi-detached units under its 1st launch. The terraced units have a land area starting from 5.23 pts andare priced from RM179,000 for the single-storey and RM199,000 for the 11/2 storey. The semi-detached are priced from RM224,000for the single-storey with a land area from 7.86 pts and from RM246,000 for the 11/2 storey with a land area from 11.41 pts.
Taman Tatau
Developer Paling Construction Sdn Bhd
Type pf Property 2-Storey Shophouse
No. of Units b 20
Price (RM) 408,000 – 1,030,000
Building Size 20’ x 60’
Date launched August 2009
Developer Johabaru Sdn BhdType pf Property 3-Storey Shophouse and
2-Storey Industrial UnitNo. of Units 8 (Shophouse)
10 (Industrial Units)Price (RM) 550,000 – 750,000 (Shophouse)
400,000 – 600,000 (Industrial)Building Size 23’ x 65.6’ / 26.24’ x 65.6’ (Shophouse)
26.24’ x 43’ / 26.24’ x 54’ (Industrial)Land Area 139.90 – 158.80 sm (Shophouse)
495.40 – 942.80 sm (Industrial)Date launched August 2009

(cont’d)
SARAWAK PROPERTY BULLETIN Page 7
MIRI
Developer Wong Sung Ing & Sons Sdn Bhd
Type Of Development Commercial
Type of Property 2-storey shophouses
No Of Unit 10
Price (RM) RM700,000 (intermediate); RM900,000 (corner)
Land Area From 178.30 – 218.8
Wall Up Area From 356
Completion Date Under construction
Description Located at Miri-Bintulu Road
Ho Ho Garden
New Residential Projects launched for 3rd Quarter 2009
Source : WTWY Q3 2009 SurveyFigures in ( ) denote 3Q 2008 figuresFigures in [ ] denote whole year 2008 figures
Type Kuching Sibu Bintulu Miri
DH1T 38 (0) [115] 44 (0) [349] 0 (0) [62] 0 (333) [595]
DH2T 0 (290) [566] 155 (0) [857] 0 (0) [60] 0 (10) [170]
DH1SD 0 (0) [143] 0 (0) [40] 16 (0) [14] 0 (2) [98]
DH2SD 0 (20) [132] 50 (0) [215] 0 (0) [22] 0 (37) [249]
DH1D 0 (0) [0] 0 (0) [0] 0 (0) [0] 0 (0) [0]
DH2D 0 (0) [0] 1 (0) [0] 0 (0) [0] 0 (0) [0]
Total 38 (310) [956] 250 (0) [1461] 16 (0) [158] 0 (382) [1112]
Selling prices of houses launched in 2009 (RM)
Type Kuching Samarahan Sibu Bintulu Miri
SS terraced–Int. 179,000 – 229,000 155,888 160,000 – 220,000 – 177,000 – 240,000
SS terraced–corner 183,888 – 232,000 229,888 From 250,000 – 220,000 – 300,000
DS terraced–int. 169,000 – 337,888 152,888 250,000 – 330,000 260,000 – 290,000 305,000 – 400,000
DS terraced–corner 208,000 – 423,888 255,000 310,000 – 400,000 325,000 – 360,000 370,000 – 500,000
SS semi-dee 224,000 – 234,000 245,888 – 248,888 250,000 – 360,000 280,000 – 320,000 213,000 – 479,000
DS semi-dee 229,000 – 448,000 – 450,000 – 600,000 388,000 – 620,000 348,000 – 580,000

Page 8 Volume 7, Issue 3
0
2000000
4000000
6000000
8000000
10000000
12000000
14000000
16000000
18000000
20000000
1990 1991 1992 1993 1994 1995 1996 1997 1998 1999 2000 2001 2002 2003 2004 2005 2006 2007 2008 2009
*
Year
To
nn
e
0.00
500.00
1,000.00
1,500.00
2,000.00
2,500.00
3,000.00
Pri
ce
Production Exports Price
Price, Production & Export of CPO - Malaysia
* Up to August 2009
Crude Palm Oil prices are expected to remain firm in the 4th quarter 2009, at around RM2,375 per metric tonne.(Source : MIDF, 2/10/2009)
Products 2009 (Jan-June) 2008 (Jan-June) % ChangeFOB FOB
Products Volume Value Value Volume Value Value Volume Value(m3) (RM’000) % (m3) (RM’000) %
Logs 1,629,239 795,470 26.79% 1,917,963 897,756 22.58% -15.05% -11.39%
Sawn Timber 377,209 342,521 11.53% 561,664 509,663 12.82% -32.84% -32.79%
Plywood 1,193,275 1,470,191 49.51% 1,694,815 2,138,273 53.79% -29.59% -31.24%
Veneer 112,793 103,597 3.49% 189,880 167,264 4.21% -40.60% -38.06%
Dowels 1,159 4,062 0.14% 1,833 5,638 0.14% -36.77% -27.95%
Mouldings 4,239 10,272 0.35% 5,790 15,100 0.38% -26.79% -31.97%
Particleboard 19,004 8,005 0.27% 67,514 32,005 0.81% -71.85% -74.99%
MDF 88,792 102,589 3.45% 90,769 97,642 2.46% -2.18% 5.07%
Blockboard 8,128 7,442 0.25% 9,365 9,213 0.23% -13.21% -19.22%
LAM Board Flooring 3,436 8,685 0.29% 8,572 23,749 0.60% -59.92% -63.43%
Woodchips (tonne) 132,700 14,187 0.48% 128,700 14,151 0.36% 3.11% 0.25%
Other Timber Products 102,544 3.45% 64,753 1.63% 58.36%
Total 2,969,565 100.00% 3,975,207 100.00% -22.28%
Note : The value of log and timber exports from Sarawak for 1H 2009 has dropped by 25% year on yearThe volume of log and timber exports from Sarawak for 1H 2009 has also dropped by 15% to 33% recorded across 3 key commodities -plywood, logs and sawn timberAttributed to lower demands from traditional markets like Japan, China, India, the Middle East, US and EUPlywood remains the main export commodity, contributing about 50% or RM1.47 billion of the total export valueThe unit prices of most timber products had increased, esp for logs and sawn timber but not for plywood
Source : International Tropical Timber Organisation (ITTO), 2009
Export Summary of Timber and Timber Products from Sarawak
C O M M O D I T I E S
SARAWAK PROPERTY BULLETIN Page 9
Affordable Housing in Mukah
A sum of RM5.7 million has been allocated by the federal government under the Stimulus Package to developRumah Mampu Milik (RMM) in the Mukah division. Located at Petanak Road, the project is just about 1 km fromthe town centre and is expected to be completed within 18 months, over 3 phases, with the 1st phase consistingof 52 units. All the single storey affordable houses are sold between RM42,000 and RM47,000 each. It is expectedthat the demand for housing in Mukah will be great within the next 5 years, with the full implementation of SCOREand Mukah as the administrative centre.
Similar affordable housing projects are following suit in Tanjung Manis which is geared to be the Halal Hub in theregion, with a start of 150 units of such housing.
Source : The Borneo Post, 9/2009
4-storey block for SJK Nang Sang
A new RM3.4 million 4-storey building block will soon be added to SJK (C) Nang Sang at Jalan Ulu Sungei Merah,Sibu. The new building block includes 12 classrooms, a computer room, a science laboratory, a hall and a staffroom. It is expected to be completed in a year’s time from September, 2009.
Source : The Borneo Post, 11/9/2009
RM20 million for road upgrading in Sibu
RM20 million has been allocated to Sibu for upgrading the local roads. The roads to be upgraded include :
25 bridges (new or upgraded) will also be built in Sibu in the next 3 years at a cost of between RM2.5 million and RM3 million(including land compensation), with standard sizes of 20 metres long and 7.3 metres wide. The bridges include those at SungaiSeduan at Lake Garden, Bridge A and B at Sentosa, Sungai Empawah, Sungai Lebaan, Sungai Bidut at Bawang Assan andSungai Ranan in Kanowit.
Source : The Borneo Post, 15/9/2009
DE
VE
LO
PM
EN
T
N
EW
S
Public Listed Companies’ Announcements
Harn Len Corp Bhd (HLCB) will construct a new palm oil mill at the Masranti Estate in Samarahan, Sarawak at an estimatedcost of RM42.2 million. Work on the project would start in June 2010 and the mill is expected to be completed by end of2011.
Source : Bursa Malaysia General Announcement Ref. No. C-090827-61223 dated 27 August 2009
Sime Darby Plantation Sdn Bhd is set to invest an initial RM100 million to develop NCR lands in Julau, about 55 km fromSarikei, Sarawak which will cover 20,000 ha and involve landowners from 109 longhouses represented by the Land Custodyand Development Authority. The target was for Sime Darby to develop around 50,000 ha in Sarawak and 50,000 ha in Sabah.
Source : New Straits Times, 10/7/2009
��
Location Roads Stretch Works Completion
1 Old Airport Road 8.6 km from Kwong Ann Convert into aRoundabout dual-carriageway 2011
2 Old Airport Road to Includes Sg. Maaw and Convert into R5-typeSibu/Tanjong Manis junction Lung Chu Ming Road trunk road
3 Sibu-Tanjong Manis Road 82 km Building tar-sealed road Feb 2010
4 Melangan Road 9 km Upgrading up to 9 kmstretch

Page 10 Volume 7, Issue 3

SARAWAK PROPERTY BULLETIN Page 11
NEW BUILDING ICONS FOR SARAWAK
The ISLAMIC INFORMATION CENTRE, the 1st in the State,which was opened at Jalan Ong Tiang Swee, Kuching in2008, is unique in terms of design and architecture as ithas a distinctive Chinese style, combined beautifully withother ethnic designs. The centre is well equipped with anoffice and administration block, book shop, auditorium,library, function rooms, hostels and an open air atrium.
HOOVER MEMORIAL SQUARE, named after the latepioneer Methodist Pastor James Matthew Hoover, wascompleted in August 2009. Located at Island Road in Sibuthe building will exhibit photographs and articles relating tothe history of the Methodist Church in Sibu. The buildinghouse a joint treasury office, an administrative block, a library,conference room, a 180-parking lot bay and hostels formembers.
The newly-built YU LON SAN FEN EN SI TEMPLE locatedat KM26 Sibu-Bintulu Road, touted as the largest temple inSouth East Asia, caters to the faithfuls of Buddhism, Taoismand Confucianism. It features the 12 Chinese zodiac animalsand the huge temple can accommodate 4 big halls as wellas 2 accessory halls on both sides.
Dewan Undangan Negeri (DUN)
The Dewan Undangan Negeri (DUN), the new State Legislative
Building, marked the latest landmark for the State, with its
imposing structure across the Kuching River and had its grand
opening on July 27 2009 in conjunction with it being used as
the venue for the 218th Rulers’ Conference held on July 28
and 29. The new complex measures 9 floors with a height
of 27.7 metres, a diameter of 30.9 metres and a total area
of 760 sq metres. The chamber can hold up to 108 members.
BORNEO CONVENTION CENTRE KUCHING (BCCK) willopen officially on October 18 with four halls which,combined, can fit 2,076 delegates for banquets. There arealso 14 individual meeting rooms of various configurations.The smallest can sit up to 40 delegates theatre-style andthe largest, up to 500 delegates. Meeting rooms 12, 13 and14 can be combined to sit up to 1,100 delegates theatre-style.www.bcck.com.my
The information in this newsletter is subject to change and cannot be part of an offer or contract. Every reasonable care has been taken in providing this information and WTWYcannot be held responsible for any inaccuracies. The information and photographs in this newsletter cannot be reproduced in other publications without the permission of WTWY.
C H Williams Talhar Wong & Yeo Sdn Bhd (24706-T)
Printed By WISMA PRINTING SDN. BHD. (287428-U)
Address Lot 1949, Section 66, KTLD, Pending Industrial Estate,
Jalan Tekad, 93450 Kuching.
Tel 082-338131
Kuching Sibu Miri BintuluAssociate Offices: Kuala Lumpur Petaling Jaya Johor Bahru
Ipoh Alor Star Butterworth Kota Bharu Batu PahatKuala Terengganu Kuantan Malacca Seremban
Kota Kinabalu Sandakan Tawau Lahad Datu Labuan Brunei
Chartered SurveyorsValuersEstate AgentsProperty ManagersReal Estate CounselorsDevelopment Consultants
Published By C H Williams Talhar Wong & Yeo Sdn Bhd (24706-T)
Address No. 9, (First Floor), Jalan Song Thian Cheok,
P.O. Box 2236, 93744 Kuching.
Tel 082-246262
KUCHING
No 9 (First Floor)
Jalan Song Thian Cheok
P O Box 2236
93744 Kuching
Sarawak
Malaysia
Tel: 082-246262
Fax: 082-416909
Email: [email protected]
SIBU
No 11 & 12, 2nd Floor
Lorong Kampung Datu 3A
P O Box 1467
96008 Sibu
Sarawak
Malaysia
Tel: 084-319396
Fax: 084-320415
Email: [email protected]
MIRI
Lot 1139 Ground & First Floor
Miri Waterfront Commercial Centre
P O Box 1121
98008 Miri
Sarawak
Malaysia
Tel: 085-432821
Fax: 085-411786
Email: [email protected]
BINTULU
1st Floor, 35 BDA/Shahida
Commercial Centre
Lebuhraya Abang Galau
P O Box 363
97008 Bintulu
Sarawak
Malaysia
Tel: 086-335531
Fax: 086-335964
Email: [email protected]
www.wtwy.com
Visit Us On The Web
WTWY OfficesMARKET EXPECTATIONS AMID ECONOMIC INDICATORS
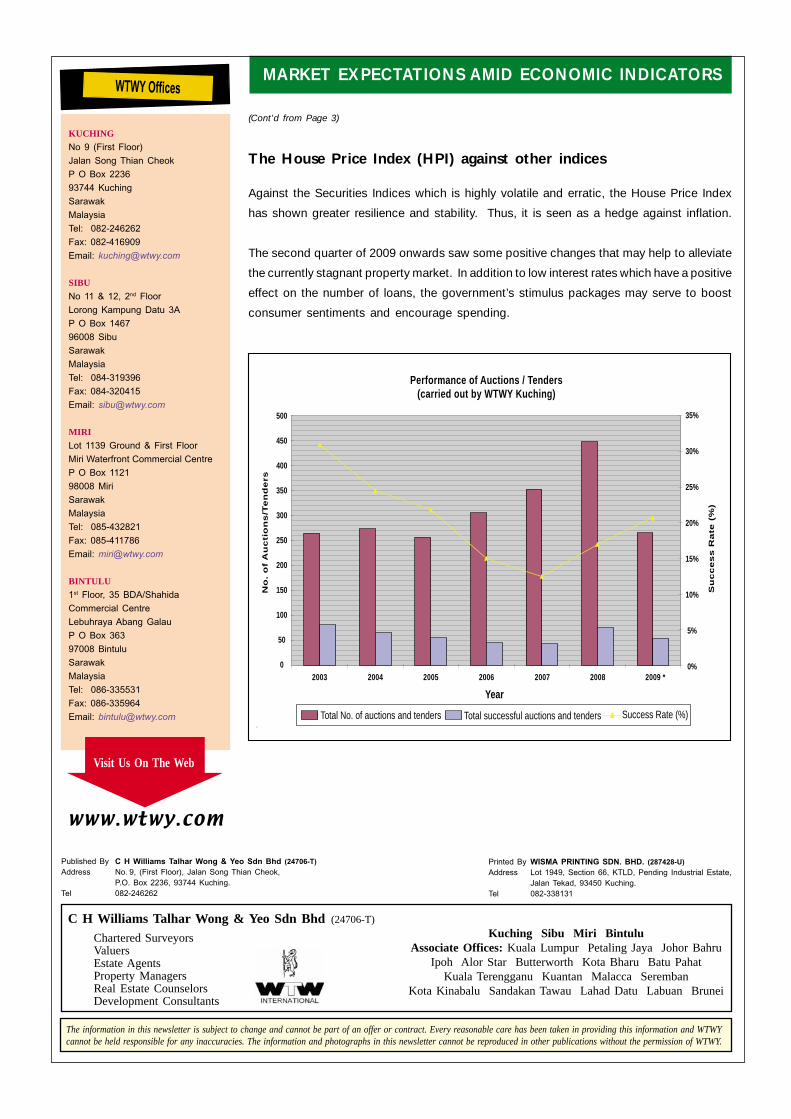
The House Price Index (HPI) against other indices
Against the Securities Indices which is highly volatile and erratic, the House Price Index
has shown greater resilience and stability. Thus, it is seen as a hedge against inflation.
The second quarter of 2009 onwards saw some positive changes that may help to alleviate
the currently stagnant property market. In addition to low interest rates which have a positive
effect on the number of loans, the government’s stimulus packages may serve to boost
consumer sentiments and encourage spending.
35%
30%
25%
20%
15%
10%
5%
0%
Performance of Auctions / Tenders(carried out by WTWY Kuching)
Total No. of auctions and tenders Total successful auctions and tenders Success Rate (%)
Year
No
. o
f A
uc
tio
ns
/Te
nd
ers
Su
cc
es
s R
ate
(%
)
2003 2004 2005 2006 2007 2008 2009 *
500
450
400
350
300
250
200
150
100
50
0
(Cont’d from Page 3)