Embed Size (px)
Citation preview
4The M
ark
et F
orc
es o
f Supply
and D
em
and
•S
upply
and d
em
and a
re th
e tw
o w
ord
s th
at e
conom
ists
use m
ost o
ften.
•S
upply
and d
em
and a
re th
e fo
rces th
at m
ake m
ark
et
econom
ies w
ork
.
•M
odern
mic
roeconom
ics is
about s
upply, d
em
and, a
nd
mark
et e
quilib
rium
.

MA
RK
ET
S A
ND
CO
MP
ET
ITIO
N
•A
mark
et
is a
gro
up o
f buyers
and s
elle
rs o
f a p
artic
ula
r good o
r serv
ice.
•T
he te
rms s
upply
and d
em
and re
fer to
the b
ehavio
r of
people
. . . as th
ey in
tera
ct w
ith o
ne a
noth
er in
mark
ets
.
MA
RK
ET
S A
ND
CO
MP
ET
ITIO
N
•B
uyers
dete
rmin
e d
em
and.
•S
elle
rs d
ete
rmin
e s
upply
Com
petitive
Marke
ts
•A
com
petitiv
em
ark
et
is a
mark
et in
whic
h th
ere
are
many
buyers
and s
elle
rs s
o th
at e
ach h
as a
neglig
ible
impact o
n
the m
ark
et p
rice.
Com
petitio
n: P
erfe
ct and O
therw
ise
•P
erfe
ct C
om
petitio
n•
Pro
du
cts
are
the
sa
me
•N
um
ero
us b
uye
rs a
nd
se
llers
so
tha
t ea
ch
ha
s n
o in
flue
nce
ove
r p
rice
•B
uye
rs a
nd
Se
llers
are
pric
e ta
ke
rs
•M
onopoly
•O
ne
se
ller, a
nd
se
ller c
on
trols
pric
e
Com
petitio
n: P
erfe
ct and O
therw
ise
•O
ligopoly
•F
ew
se
llers
•N
ot a
lwa
ys a
gg
ressiv
e c
om
pe
tition
•M
onopolis
tic C
om
petitio
n
•M
an
y s
elle
rs
•S
ligh
tly d
iffere
ntia
ted
pro
du
cts
•E
ach
se
ller m
ay s
et p
rice
for its
ow
n p
rod
uct
DE
MA
ND
•Q
uantity
dem
anded
is th
e a
mount o
f a g
ood th
at b
uyers
are
willin
g a
nd a
ble
to p
urc
hase.
•Law
of D
em
and
•T
he
law
of d
em
an
dsta
tes th
at, o
the
r thin
gs e
qu
al, th
e q
ua
ntity
d
em
an
de
d o
f a g
oo
d fa
lls w
he
n th
e p
rice
of th
e g
oo
d ris
es.
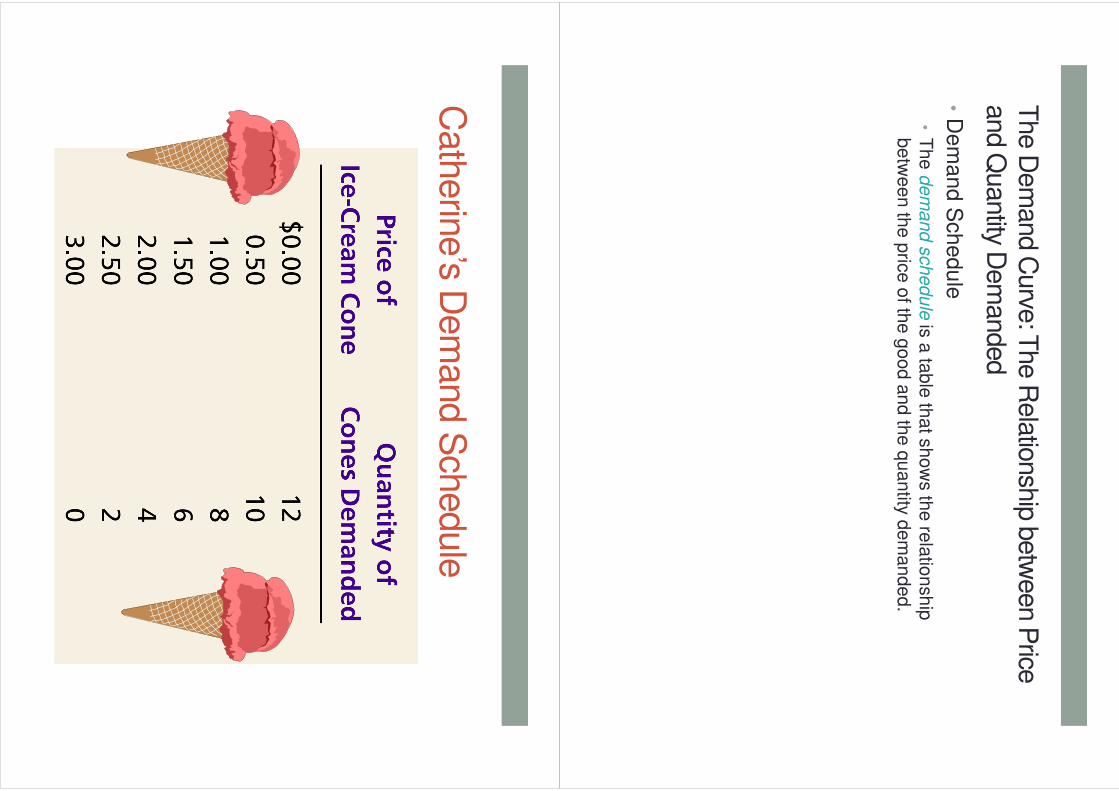
The D
em
and C
urve
: The R
ela
tionsh
ip b
etw
een P
rice
and Q
uantity D
em
anded
•D
em
and S
chedule
•T
he
de
ma
nd
sch
ed
ule
is a
tab
le th
at s
ho
ws th
e re
latio
nsh
ip
be
twe
en
the
pric
e o
f the
go
od
an
d th
e q
ua
ntity
de
ma
nd
ed
.
Cath
erin
e’s D
em
and S
chedule
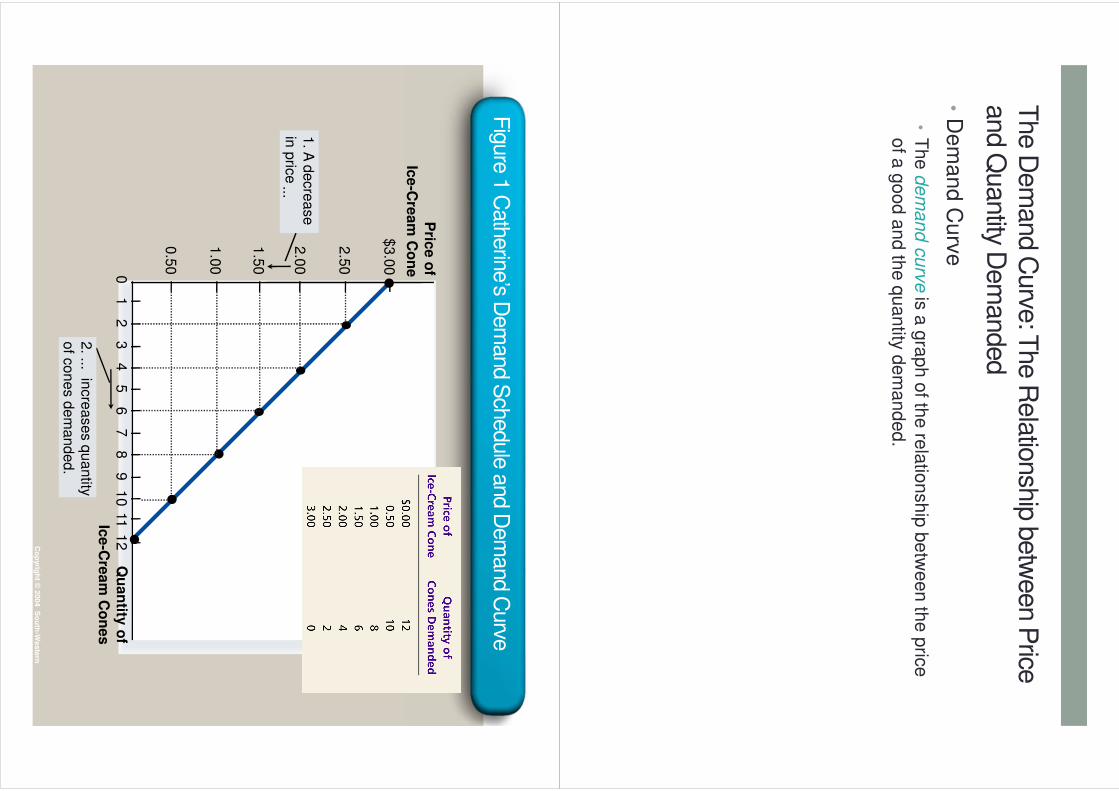
The D
em
and C
urve
: The R
ela
tionsh
ip b
etw
een P
rice
and Q
uantity D
em
anded
•D
em
and C
urv
e
•T
he
de
ma
nd
cu
rve
is a
gra
ph
of th
e re
latio
nsh
ip b
etw
ee
n th
e p
rice
of a
go
od
an
d th
e q
ua
ntity
de
ma
nd
ed
.
Fig
ure
1 C
ath
erin
e’s D
em
and S
chedule
and D
em
and C
urve
Co
pyrig
ht ©
2004 S
ou
th-W
este
rn
Pric
e o
f
Ice
-Cre
am
Co
ne0
2.5
0
2.0
0
1.5
0
1.0
0
0.5
0
12
34
56
78
91
011
Qu
an
tity o
f
Ice
-Cre
am
Co
ne
s
$3
.00
12
1. A
de
cre
ase
in
pric
e...
2. ...
incre
ase
s q
ua
ntity
of c
on
es d
em
an
de
d.
Marke
t Dem
and ve
rsus In
divid
ual D
em
and
•M
ark
et d
em
and re
fers
to th
e s
um
of a
ll indiv
idua
l dem
ands fo
r a p
artic
ula
r good o
r serv
ice.
•G
raphic
ally, in
div
idual d
em
and c
urv
es a
re s
um
med
horiz
onta
lly to
obta
in th
e m
ark
et d
em
and c
urv
e.
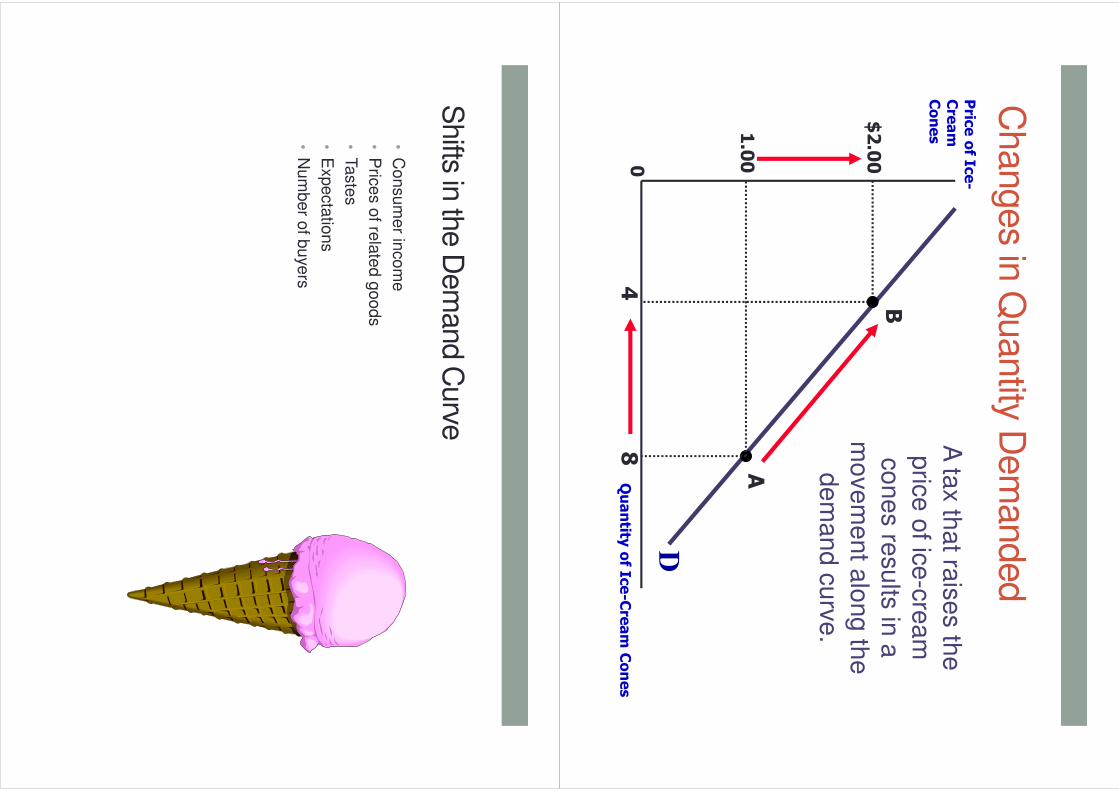
Shifts in
the D
em
and C
urve
•C
hange in
Quantity
Dem
anded
•M
ove
me
nt a
lon
g th
e d
em
an
d c
urv
e.
•C
au
se
d b
y a
ch
an
ge
in th
e p
rice
of th
e p
rod
uct.
0
D
Price of Ic
e-
Cream
Cones
Quantity
of Ic
e-Cream Cones
A ta
x th
at ra
ise
s th
e
pric
e o
f ice
-cre
am
co
ne
s re
su
lts in
a
mo
ve
me
nt a
lon
g th
e
de
ma
nd
cu
rve
.
A
B
8
1.00
$2.00
4
Changes in
Quantity D
em
anded
Shifts in
the D
em
and C
urve
•C
onsum
er in
com
e
•P
rices o
f rela
ted g
oods
•Taste
s
•E
xpecta
tions
•N
um
ber o
f buye
rs
Shifts in
the D
em
and C
urve
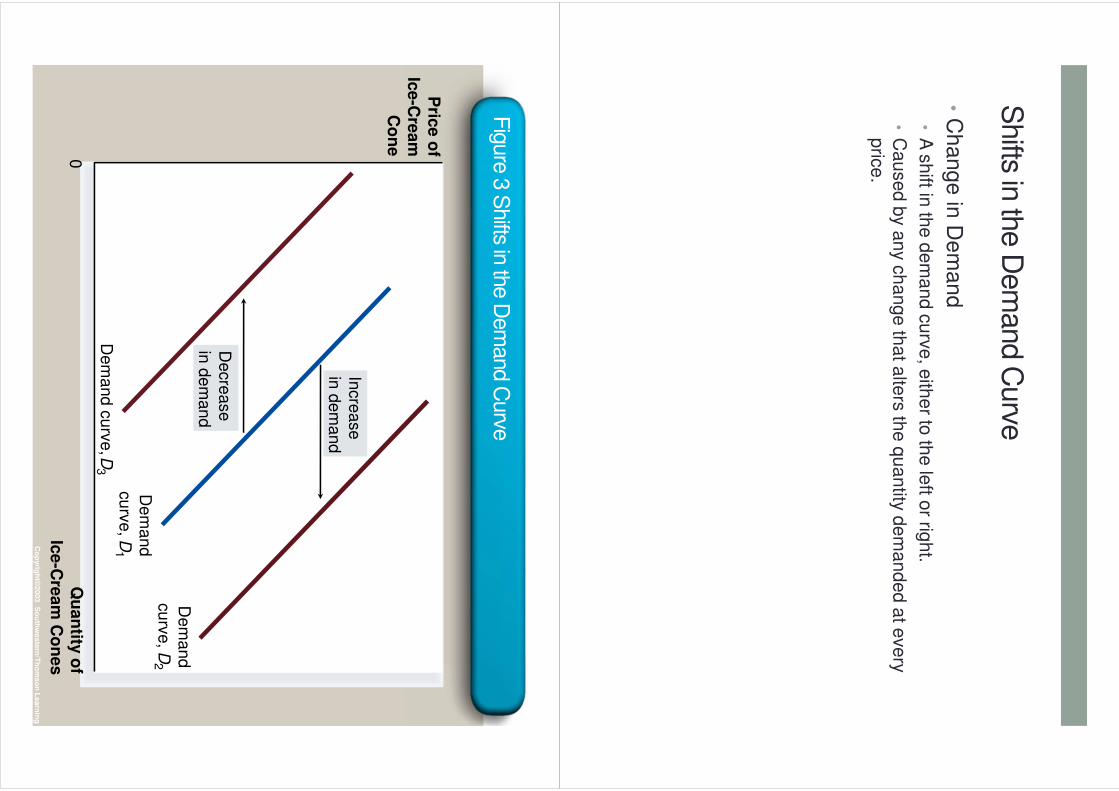
•C
hange in
Dem
and
•A
sh
ift in th
e d
em
an
d c
urv
e, e
ithe
r to th
e le
ft or rig
ht.
•C
au
se
d b
y a
ny c
ha
ng
e th
at a
lters
the
qu
an
tity d
em
an
de
d a
t eve
ry
pric
e.
Fig
ure
3 S
hifts in
the D
em
and C
urve
Co
pyrig
ht©
2003 S
ou
thw
este
rn/T
ho
mso
n L
earn
ing
Pric
e o
f
Ice-C
ream
Co
ne
Qu
an
tity o
f
Ice-C
ream
Co
nes
Incre
ase
in d
em
and
Decre
ase
in d
em
and
Dem
and c
urv
e, D
3
Dem
and
curv
e, D
1
Dem
and
curv
e, D
2
0
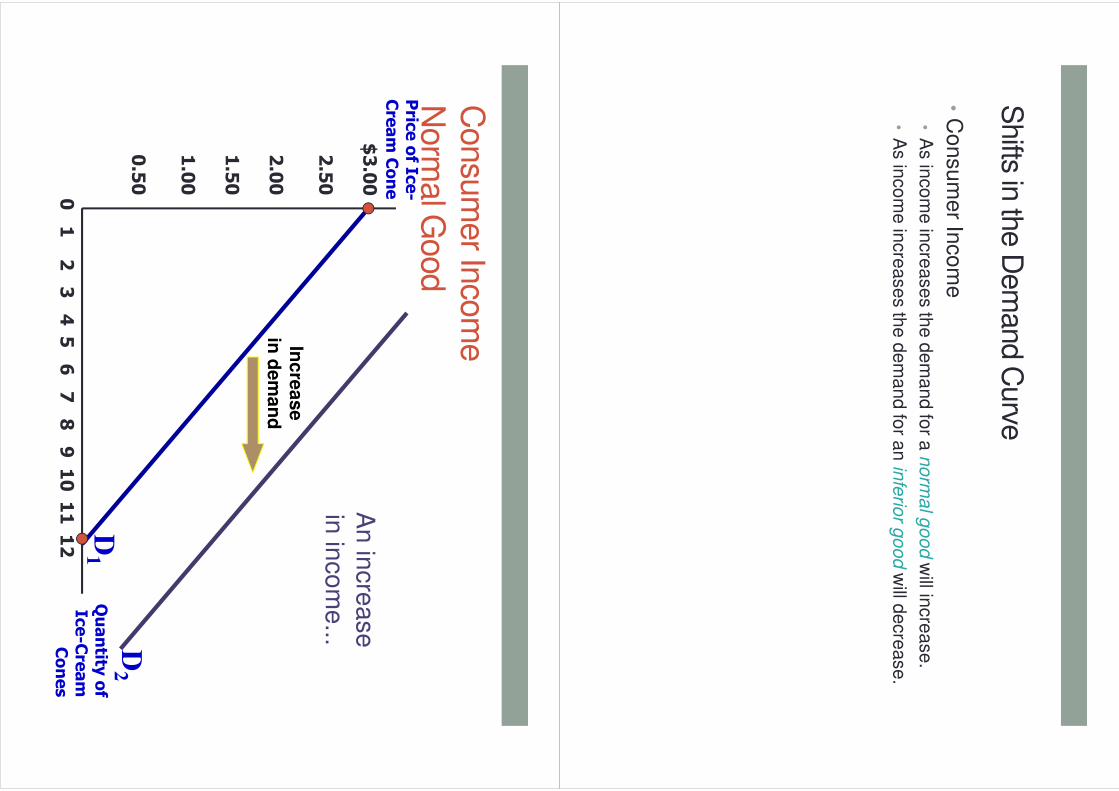
Shifts in
the D
em
and C
urve
•C
onsum
er In
com
e
•A
s in
co
me
incre
ase
s th
e d
em
an
d fo
r a n
orm
al g
oo
dw
ill incre
ase
.
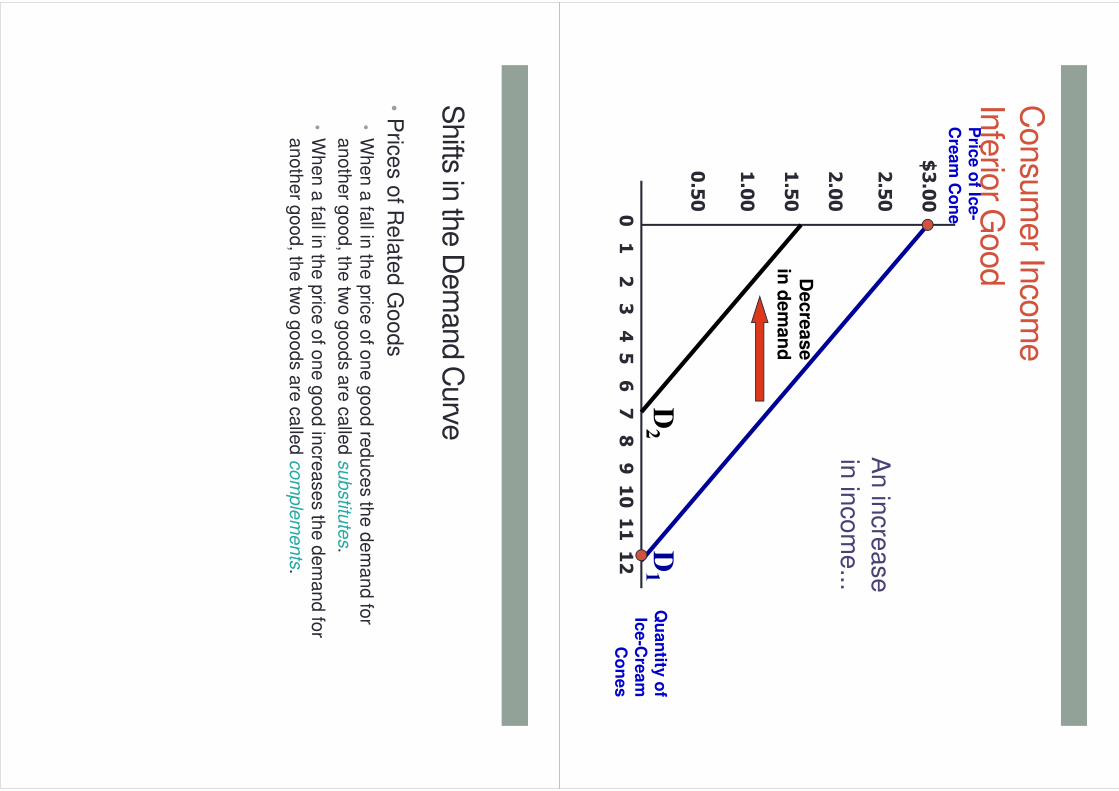
•A
s in
co
me
incre
ase
s th
e d
em
an
d fo
r an
infe
rior g
oo
dw
ill de
cre
ase
.
$3.00
2.50
2.00
1.50
1.00
0.50
21
345
67
8910
12
11
Price of Ic
e-
Cream Cone
Quantity
of
Ice-Cream
Cones
0
Inc
rea
se
in d
em
an
d
An
incre
ase
in
inco
me
...
D1
D2
Consu
mer In
com
eN
orm
al G
ood
$3.00
2.50
2.00
1.50
1.00
0.50
21
345
67
8910
12
11
Pric
e o
f Ice-
Cre
am
Co
ne
Qu
an
tity o
f Ic
e-C
ream
C
on
es
0
De
cre
as
ein
de
ma
nd
An
incre
ase
in
inco
me
...
D1
D2
Consu
mer In
com
eIn
ferio
r Good
Shifts in
the D
em
and C
urve
•P
rices o
f Rela
ted G
oods
•W
he
n a
fall in
the
pric
e o
f on
e g
oo
d re
du
ce
s th
e d
em
an
d fo
r a
no
the
r go
od
, the
two
go
od
s a
re c
alle
d s
ub
stitu
tes.
•W
he
n a
fall in
the
pric
e o
f on
e g
oo
d in
cre
ase
s th
e d
em
an
d fo
r a
no
the
r go
od
, the
two
go
od
s a
re c
alle
d c
om
ple
me
nts
.
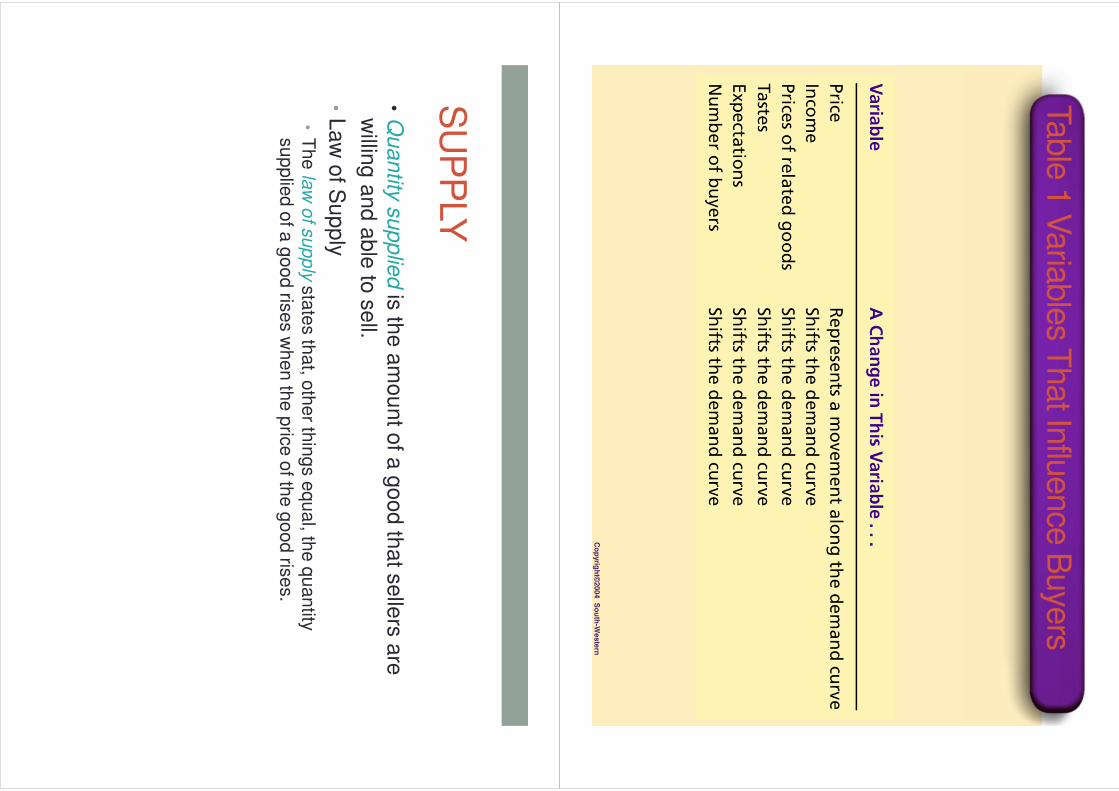
Table
1 V
aria
ble
s That In
fluence
Buye
rs
Co
pyrig
ht©
2004 S
ou
th-W
este
rn
SU
PP
LY
•Q
uantity
supplie
dis
the a
mount o
f a g
ood th
at s
elle
rs a
re
willin
g a
nd a
ble
to s
ell.
•Law
of S
upply
•T
he
law
of s
up
ply
sta
tes th
at, o
the
r thin
gs e
qu
al, th
e q
ua
ntity
su
pp
lied
of a
go
od
rise
s w
he
n th
e p
rice
of th
e g
oo
d ris
es.
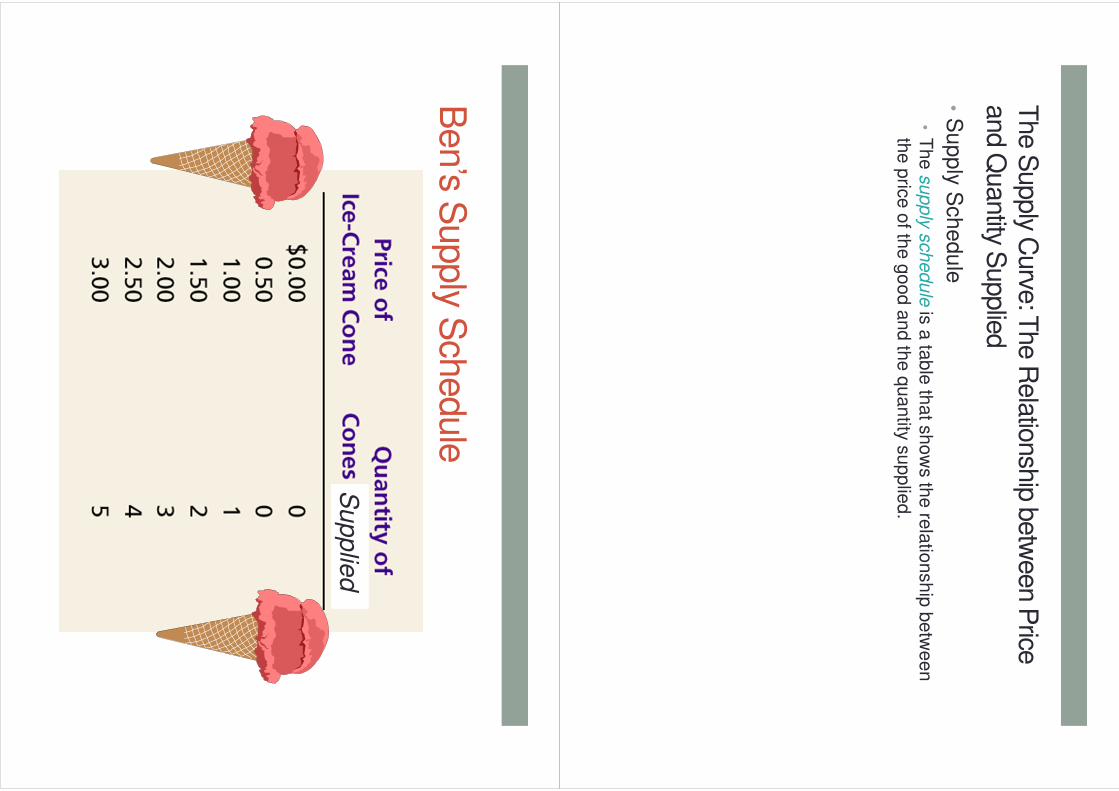
The S
upply C
urve
: The R
ela
tionsh
ip b
etw
een P
rice
and Q
uantity S
upplie
d
•S
upply
Schedule
•T
he
su
pp
ly s
ch
ed
ule
is a
tab
le th
at s
ho
ws th
e re
latio
nsh
ip b
etw
ee
n
the
pric
e o
f the
go
od
an
d th
e q
ua
ntity
su
pp
lied
.
Ben’s S
upply S
chedule
Su
pp
lied
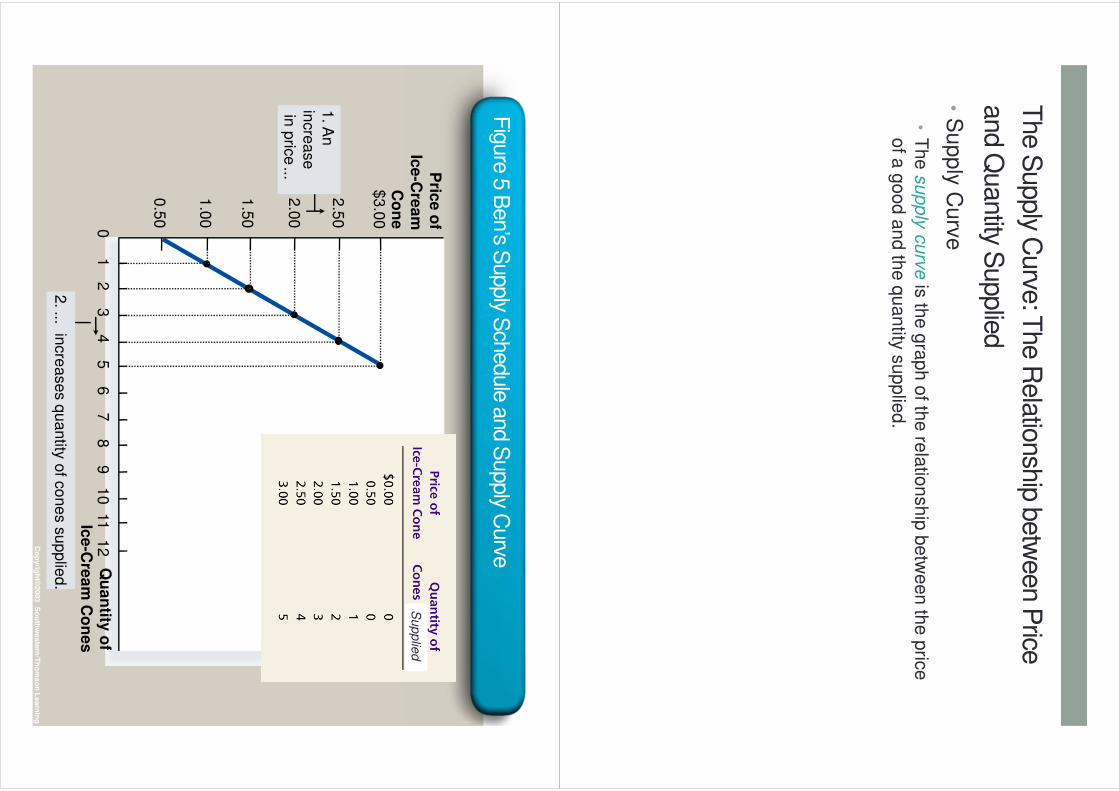
The S
upply C
urve
: The R
ela
tionsh
ip b
etw
een P
rice
and Q
uantity S
upplie
d
•S
upply
Curv
e
•T
he
su
pp
lycu
rve
is th
e g
rap
h o
f the
rela
tion
sh
ip b
etw
ee
n th
e p
rice
of a
go
od
an
d th
e q
ua
ntity
su
pp
lied
.
Fig
ure
5 B
en’s S
upply S
chedule
and S
upply C
urveC
op
yrig
ht©
2003 S
ou
thw
este
rn/T
ho
mso
n L
earn
ing
Pric
e o
f
Ice
-Cre
am
Co
ne
0
2.5
0
2.0
0
1.5
0
1.0
0
12
34
56
78
91
011
Qu
an
tity o
f
Ice
-Cre
am
Co
ne
s
$3
.00
12
0.5
0
1. A
nin
cre
ase
in p
rice
...
2. ...
incre
ase
s q
ua
ntity o
f co
ne
s s
up
plie
d.
Supplie
d
Marke
t Supply ve
rsus In
divid
ual S
upply
•M
ark
et s
upply
refe
rs to
the s
um
of a
ll indiv
idua
l supplie
s
for a
ll selle
rs o
f a p
artic
ula
r good o
r serv
ice.
•G
raphic
ally, in
div
idual s
upply
curv
es a
re s
um
med
horiz
onta
lly to
obta
in th
e m
ark
et s
upply
curv
e.
Shifts in
the S
upply C
urve
•In
put p
rices
•Technolo
gy
•E
xpecta
tions
•N
um
ber o
f selle
rs
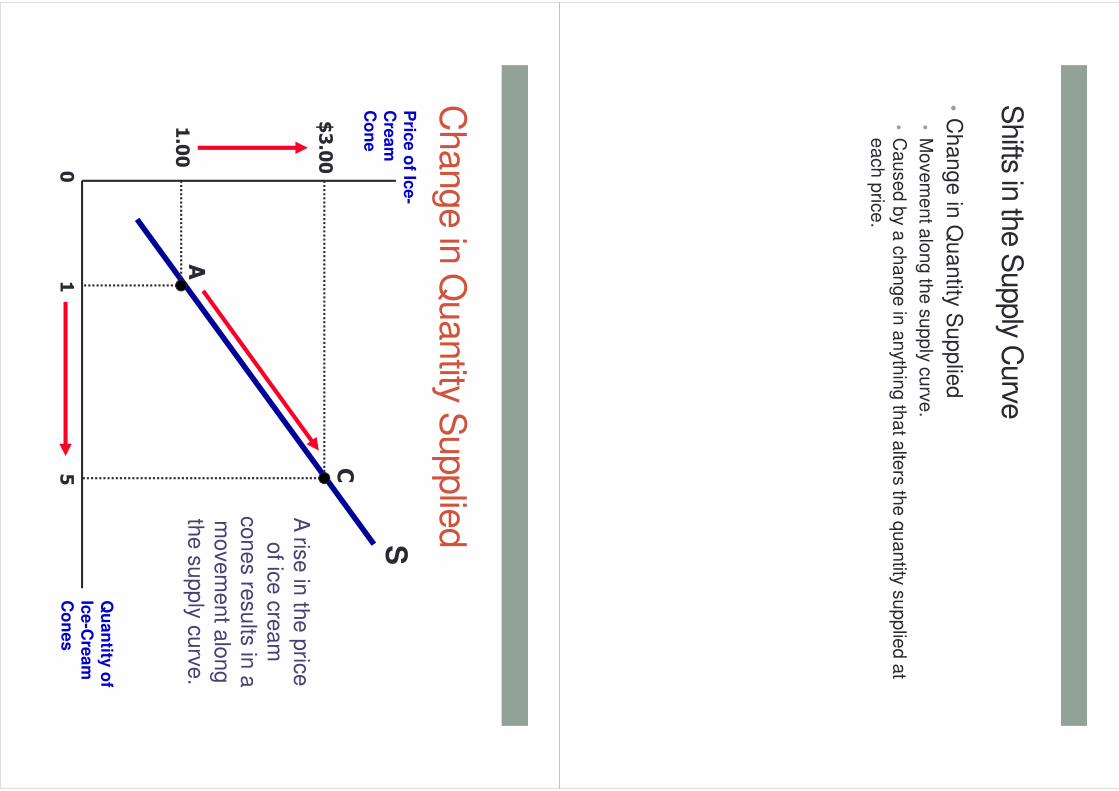
Shifts in
the S
upply C
urve
•C
hange in
Quantity
Supplie
d
•M
ove
me
nt a
lon
g th
e s
up
ply
cu
rve
.
•C
au
se
d b
y a
ch
an
ge
in a
nyth
ing
tha
t alte
rs th
e q
ua
ntity
su
pp
lied
at
ea
ch
pric
e.
15
Pric
e o
f Ice-
Cre
am
C
on
e
Qu
an
tity o
f Ic
e-C
ream
C
on
es
0
S
1.00
A
C$3.00
A ris
e in
the p
rice
of ic
e c
ream
cones re
sults
in a
m
ovem
ent a
long
the s
upply
curv
e.
Change in
Quantity S
upplie
d
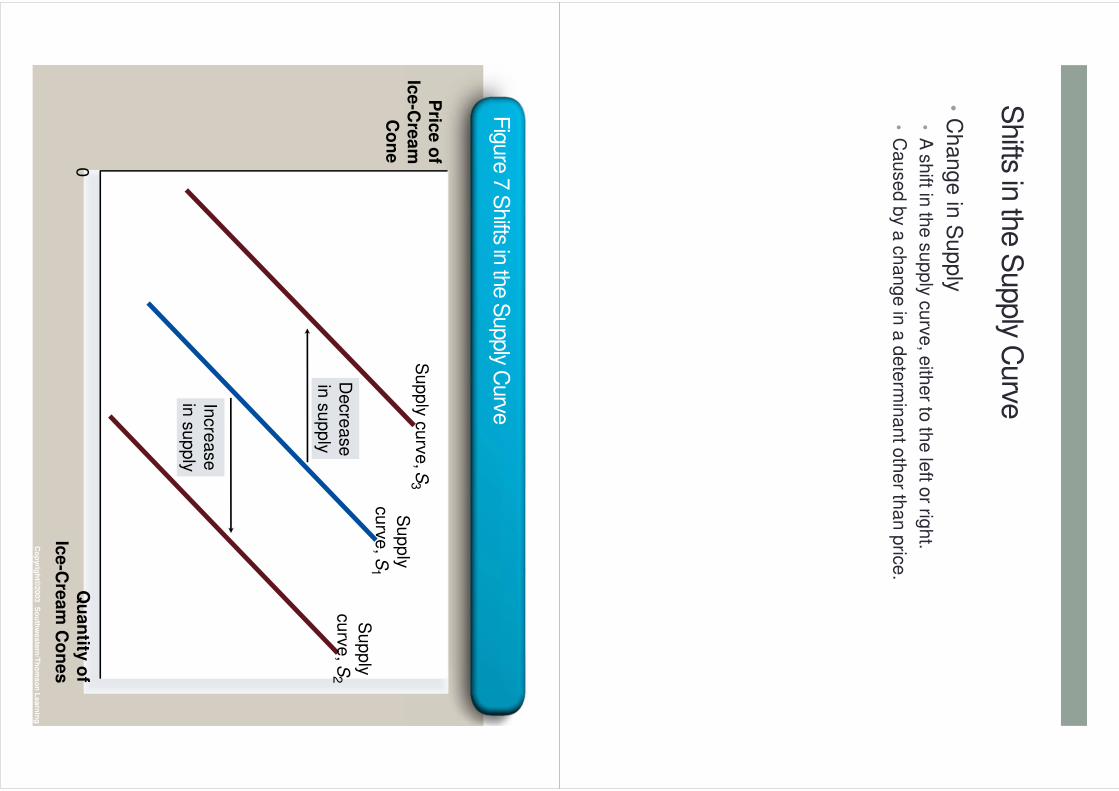
Shifts in
the S
upply C
urve
•C
hange in
Supply
•A
sh
ift in th
e s
up
ply
cu
rve
, eith
er to
the
left o
r righ
t.
•C
au
se
d b
y a
ch
an
ge
in a
de
term
ina
nt o
the
r tha
n p
rice
.
Fig
ure
7 S
hifts in
the S
upply C
urve
Co
pyrig
ht©
2003 S
ou
thw
este
rn/T
ho
mso
n L
earn
ing
Pric
e o
f
Ice
-Cre
am
Co
ne
Qu
an
tity o
f
Ice
-Cre
am
Co
ne
s0
Incre
ase
in s
up
ply
De
cre
ase
in s
up
ply
Su
pp
ly c
urv
e, S
3
cu
rve
, S
up
plyS
1S
up
ply
cu
rve
, S2
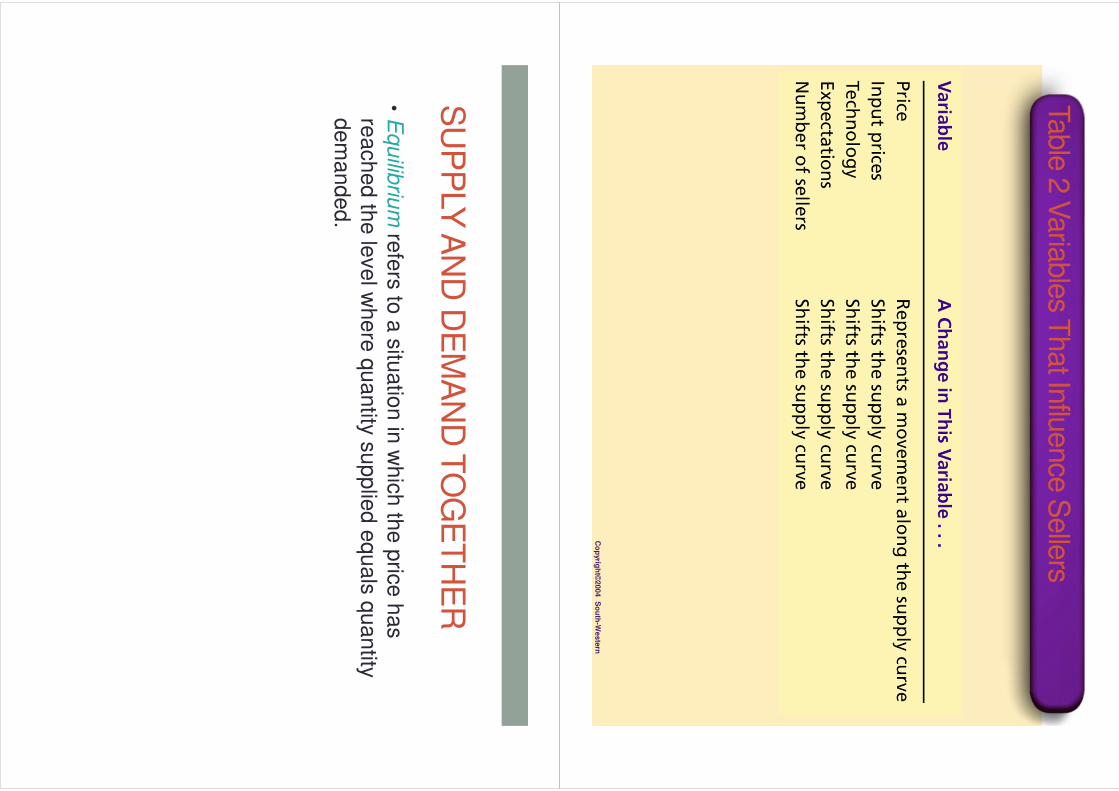
Table
2 V
aria
ble
s That In
fluence
Selle
rs
Co
pyrig
ht©
2004 S
ou
th-W
este
rn
SU
PP
LY A
ND
DE
MA
ND
TO
GE
TH
ER
•E
quilib
rium
refe
rs to
a s
ituatio
n in
whic
h th
e p
rice h
as
reached th
e le
vel w
here
quantity
supplie
d e
quals
quantity
dem
anded.
SU
PP
LY A
ND
DE
MA
ND
TO
GE
TH
ER
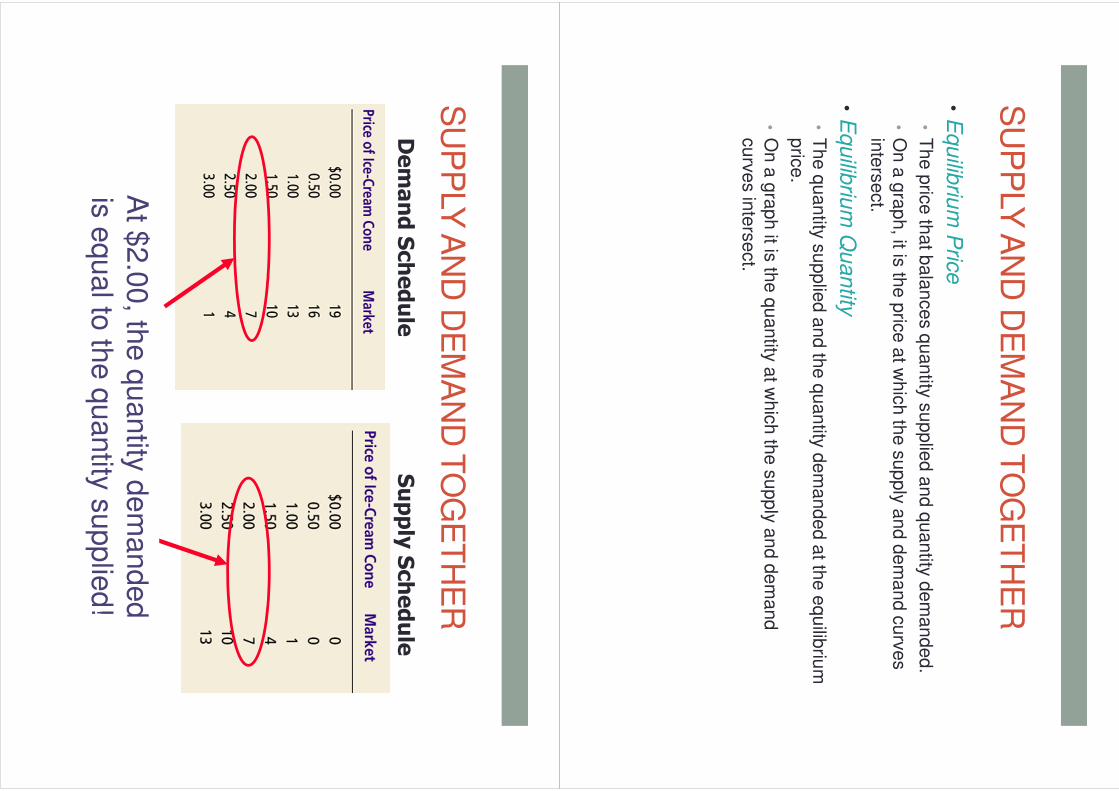
•E
quilib
rium
Pric
e
•T
he
pric
e th
at b
ala
nce
s q
ua
ntity
su
pp
lied
an
d q
ua
ntity
de
ma
nd
ed
.
•O
n a
gra
ph
, it is th
e p
rice
at w
hic
h th
e s
up
ply
an
d d
em
an
d c
urv
es
inte
rse
ct.
•E
quilib
rium
Quantity
•T
he
qu
an
tity s
up
plie
d a
nd
the
qu
an
tity d
em
an
de
d a
t the
eq
uilib
rium
p
rice
.
•O
n a
gra
ph
it is th
e q
ua
ntity
at w
hic
h th
e s
up
ply
an
d d
em
an
d
cu
rve
s in
ters
ect.
At $
2.0
0, th
e q
uantity
dem
anded
is e
qual to
the q
uantity
supplie
d!
SU
PP
LY A
ND
DE
MA
ND
TO
GE
TH
ER
Demand Schedule
Supply Schedule
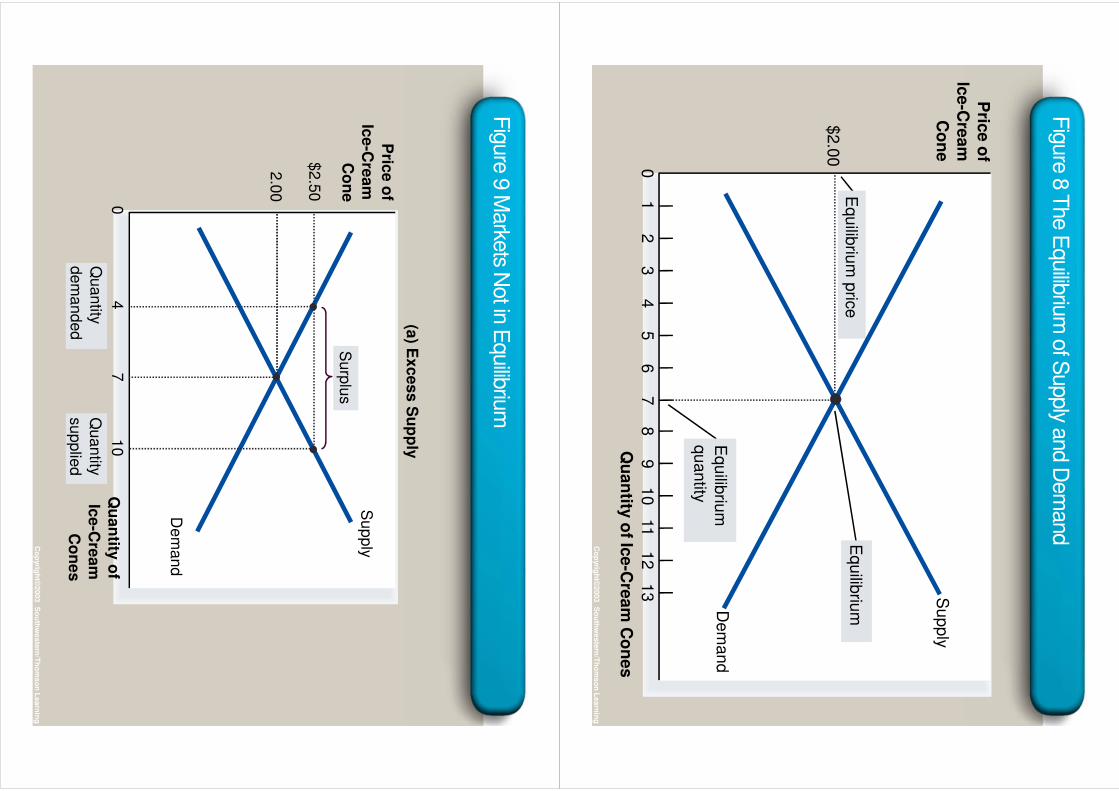
Fig
ure
8 T
he E
quilib
rium
of S
upply a
nd D
em
and
Co
pyrig
ht©
2003 S
ou
thw
este
rn/T
ho
mso
n L
earn
ing
Pric
e o
f
Ice-C
ream
Co
ne
01
23
45
67
89
10
1112
Qu
an
tity o
f Ice-C
ream
Co
nes
13
Equilib
rium
quantity
Equilib
rium
pric
eE
quilib
rium
Supply
Dem
and
$2.0
0
Fig
ure
9 M
arke
ts Not in
Equilib
rium
Co
pyrig
ht©
2003 S
ou
thw
este
rn/T
ho
mso
n L
earn
ing
Pric
e o
f
Ice
-Cre
am
Co
ne
0
Su
pp
ly
De
ma
nd
(a) E
xc
es
s S
up
ply
Qu
an
tity
de
ma
nd
ed
Qu
an
tity
su
pp
lied
Su
rplu
s
Qu
an
tity o
f
Ice
-Cre
am
Co
ne
s
4
$2
.50
10
2.0
0
7
Equilib
rium
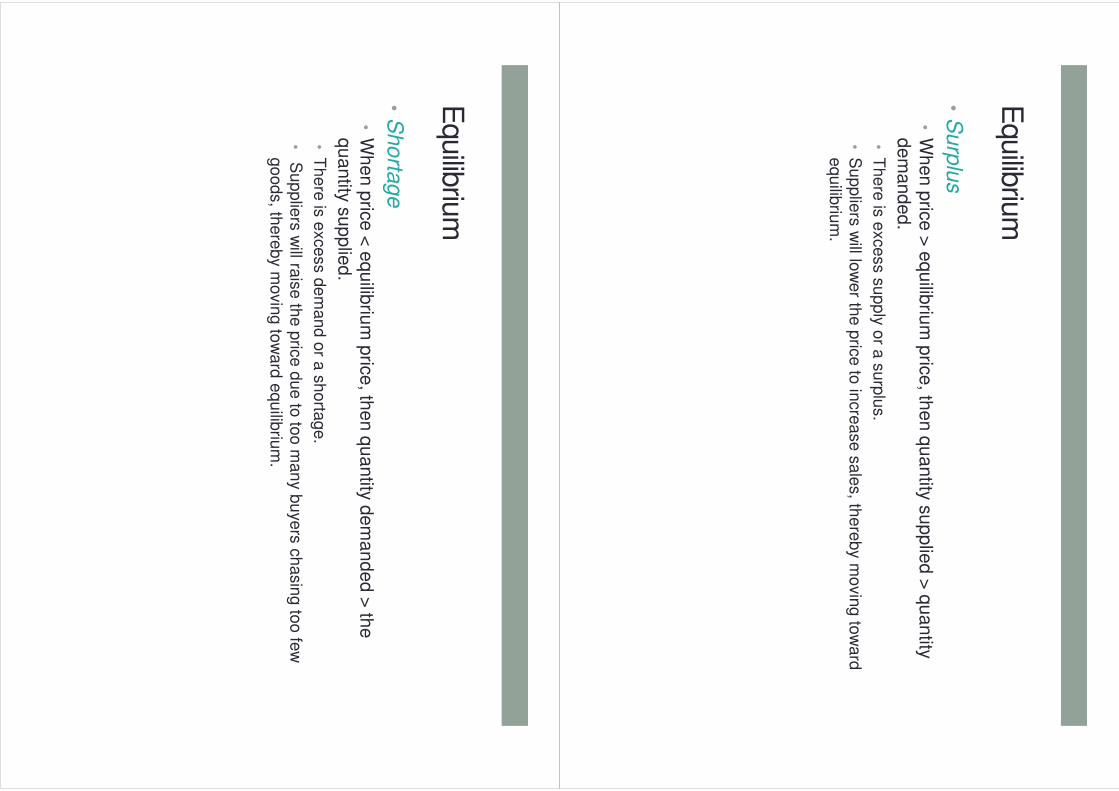
•S
urp
lus
•W
he
n p
rice
> e
qu
ilibriu
m p
rice
, the
n q
ua
ntity
su
pp
lied
> q
ua
ntity
d
em
an
de
d.
•T
here
is e
xcess s
upply o
r a s
urp
lus.
•S
upplie
rs w
ill low
er th
e p
rice to
incre
ase s
ale
s, th
ere
by m
ovin
g to
ward
equilib
rium
.
Equilib
rium
•S
horta
ge
•W
he
n p
rice
< e
qu
ilibriu
m p
rice
, the
n q
ua
ntity
de
ma
nd
ed
> th
e
qu
an
tity s
up
plie
d.
•T
here
is e
xcess d
em
and o
r a s
horta
ge.
•S
upplie
rs w
ill rais
e th
e p
rice d
ue to
too m
any b
uye
rs c
hasin
g to
o fe
w
goods, th
ere
by m
ovin
g to
ward
equilib
rium
.
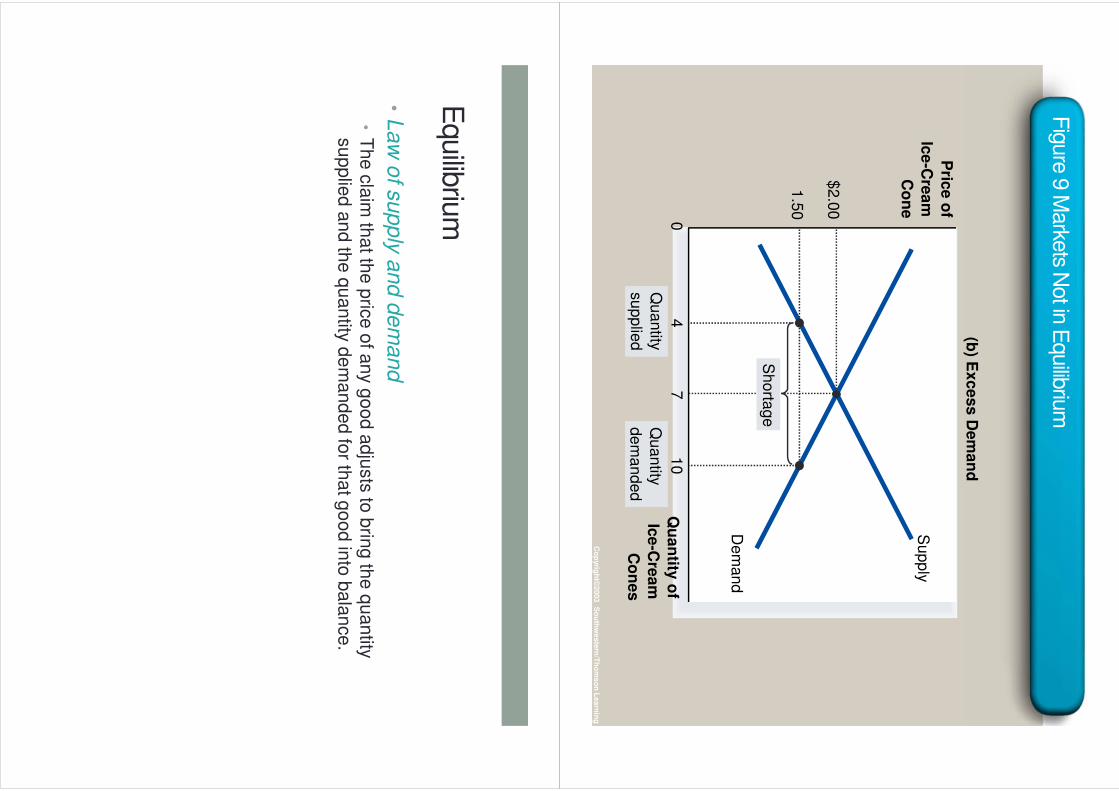
Fig
ure
9 M
arke
ts Not in
Equilib
rium
Co
pyrig
ht©
2003 S
ou
thw
este
rn/T
ho
mso
n L
earn
ing
Pric
e o
f
Ice
-Cre
am
Co
ne
0Q
ua
ntity
of
Ice
-Cre
am
Co
ne
s
Su
pp
ly
De
ma
nd
(b) E
xc
es
s D
em
an
d
Qu
an
tity
su
pp
lied
Qu
an
tity
de
ma
nd
ed
1.5
0
10
$2
.00
74
Sh
orta
ge
Equilib
rium
•Law
of s
upply
and d
em
and
•T
he
cla
im th
at th
e p
rice
of a
ny g
oo
d a
dju
sts
to b
ring
the
qu
an
tity
su
pp
lied
an
d th
e q
ua
ntity
de
ma
nd
ed
for th
at g
oo
d in
to b
ala
nce
.
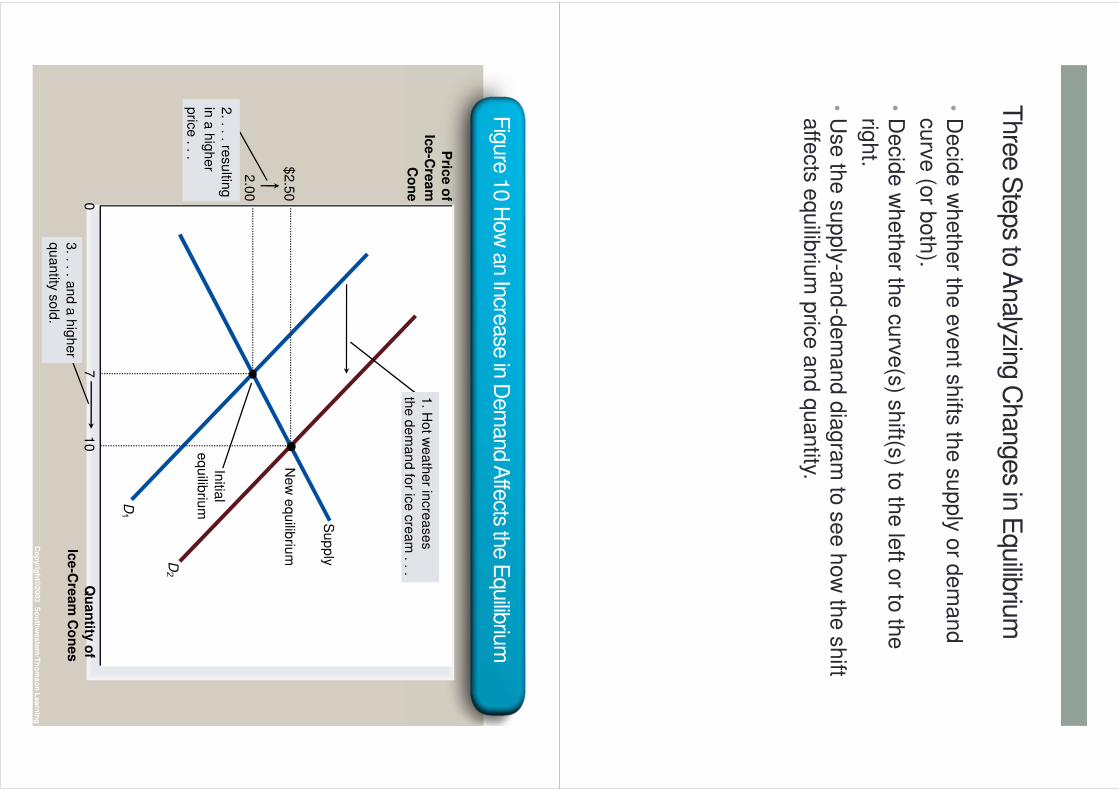
Thre
e S
teps to
Analyzin
g C
hanges in
Equilib
rium
•D
ecid
e w
heth
er th
e e
vent s
hifts
the s
upply
or d
em
and
curv
e (o
r both
).
•D
ecid
e w
heth
er th
e c
urv
e(s
) shift(s
) to th
e le
ft or to
the
right.
•U
se th
e s
upply
-and-d
em
and d
iagra
m to
see h
ow
the s
hift
affe
cts
equilib
rium
pric
e a
nd q
uantity.
Fig
ure
10 H
ow
an In
crease
in D
em
and A
ffects th
e E
quilib
rium
Co
pyrig
ht©
2003 S
ou
thw
este
rn/T
ho
mso
n L
earn
ing
Pric
e o
f
Ice
-Cre
am
Co
ne
0Q
ua
ntity
of
Ice
-Cre
am
Co
ne
s
Su
pp
ly
Initia
l
eq
uilib
riumD
D
3.
. . . an
d a
hig
he
r
qu
an
tity so
ld.
2. . . . re
su
lting
in a
hig
he
r
pric
e . . .
1. H
ot w
ea
the
r incre
ase
s
the
de
ma
nd
for ic
e c
rea
m . . .
2.0
0
7
Ne
w e
qu
ilibriu
m$
2.5
0
10
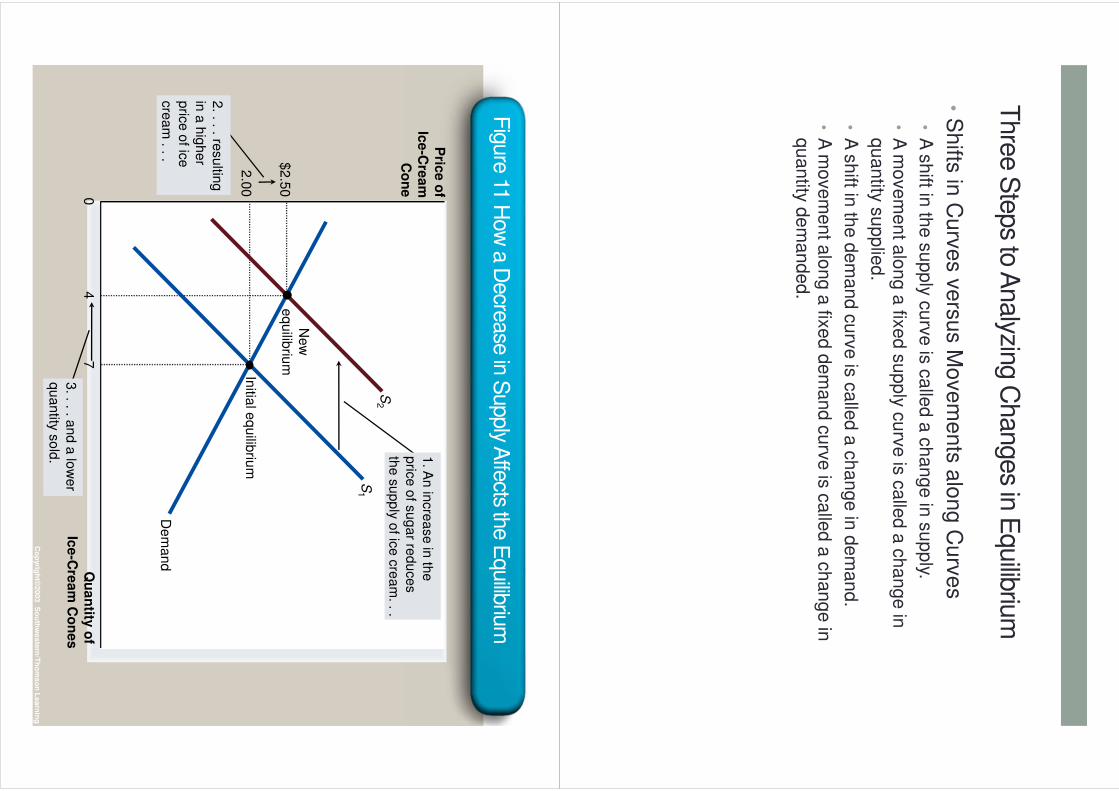
Thre
e S
teps to
Analyzin
g C
hanges in
Equilib
rium
•S
hifts
in C
urv
es v
ers
us M
ovem
ents
alo
ng C
urv
es
•A
sh
ift in th
e s
up
ply
cu
rve
is c
alle
d a
ch
an
ge
in s
up
ply.
•A
mo
ve
me
nt a
lon
g a
fixe
d s
up
ply
cu
rve
is c
alle
d a
ch
an
ge
in
qu
an
tity s
up
plie
d.
•A
sh
ift in th
e d
em
an
d c
urv
e is
ca
lled
a c
ha
ng
e in
de
ma
nd
.
•A
mo
ve
me
nt a
lon
g a
fixe
d d
em
an
d c
urv
e is
ca
lled
a c
ha
ng
e in
q
ua
ntity
de
ma
nd
ed
.
Fig
ure
11 H
ow
a D
ecre
ase
in S
upply A
ffects th
e E
quilib
rium
Co
pyrig
ht©
2003 S
ou
thw
este
rn/T
ho
mso
n L
earn
ing
Pric
e o
f
Ice
-Cre
am
Co
ne
0Q
ua
ntity
of
Ice
-Cre
am
Co
ne
s
De
ma
nd
Ne
we
qu
ilibriu
m
Initia
l eq
uilib
rium
S1
S2
2. . . . re
su
lting
in a
hig
he
rp
rice
of ic
ecre
am
. . .
1. A
n in
cre
ase
in th
ep
rice
of s
ug
ar re
du
ce
sth
e s
up
ply o
f ice
cre
am
. . .
3.. . . a
nd
a lo
we
rq
ua
ntity s
old
.
2.0
0
7
$2
.50
4
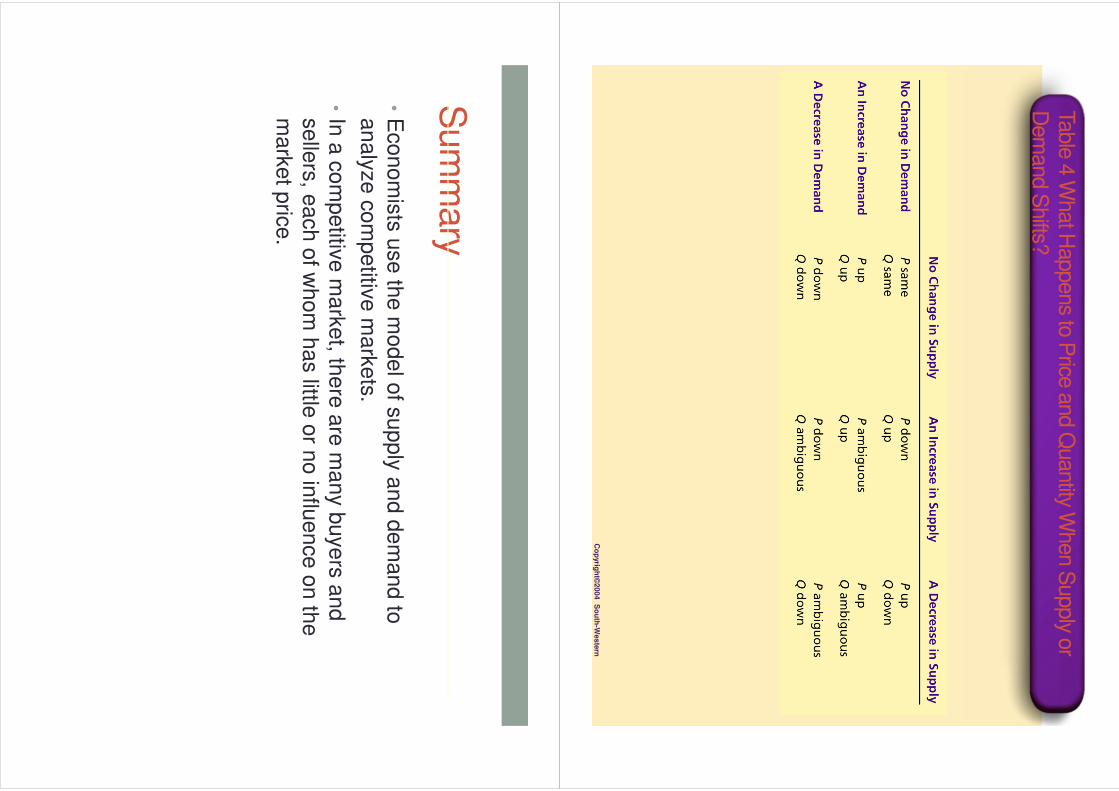
Table
4 W
hat H
appens to
Price
and Q
uantity W
hen S
upply o
r D
em
and S
hifts?
Co
pyrig
ht©
2004 S
ou
th-W
este
rn
Sum
mary
•E
conom
ists
use th
e m
odel o
f supply
and d
em
and to
analy
ze c
om
petitiv
e m
ark
ets
.
•In
a c
om
petitiv
e m
ark
et, th
ere
are
many b
uyers
and
selle
rs, e
ach o
f whom
has little
or n
o in
fluence o
n th
e
mark
et p
rice.
Sum
mary
•T
he d
em
and c
urv
e s
how
s h
ow
the q
uantity
of a
good
depends u
pon th
e p
rice.
•A
cco
rdin
g to
the
law
of d
em
an
d, a
s th
e p
rice
of a
go
od
falls
, the
q
ua
ntity
de
ma
nd
ed
rise
s. T
he
refo
re, th
e d
em
an
d c
urv
e s
lop
es
do
wn
wa
rd.
•In
ad
ditio
n to
pric
e, o
the
r de
term
ina
nts
of h
ow
mu
ch
co
nsu
me
rs
wa
nt to
bu
y in
clu
de
inco
me
, the
pric
es o
f co
mp
lem
en
ts a
nd
su
bstitu
tes, ta
ste
s, e
xp
ecta
tion
s, a
nd
the
nu
mb
er o
f bu
ye
rs.
•If o
ne
of th
ese
facto
rs c
ha
ng
es, th
e d
em
an
d c
urv
e s
hifts
.
Sum
mary
•T
he s
upply
curv
e s
how
s h
ow
the q
uantity
of a
good
supplie
d d
epends u
pon th
e p
rice.
•A
cco
rdin
g to
the
law
of s
up
ply, a
s th
e p
rice
of a
go
od
rise
s, th
e
qu
an
tity s
up
plie
d ris
es. T
he
refo
re, th
e s
up
ply
cu
rve
slo
pe
s u
pw
ard
.
•In
ad
ditio
n to
pric
e, o
the
r de
term
ina
nts
of h
ow
mu
ch
pro
du
ce
rs
wa
nt to
se
ll inclu
de
inp
ut p
rice
s, te
ch
no
log
y, exp
ecta
tion
s, a
nd
the
n
um
be
r of s
elle
rs.
•If o
ne
of th
ese
facto
rs c
ha
ng
es, th
e s
up
ply
cu
rve
sh
ifts.
Sum
mary
•M
ark
et e
quilib
rium
is d
ete
rmin
ed b
y th
e in
ters
ectio
n o
f the
supply
and d
em
and c
urv
es.
•A
t the e
quilib
rium
pric
e, th
e q
uantity
dem
anded e
quals
th
e q
uantity
supplie
d.
•T
he b
ehavio
r of b
uyers
and s
elle
rs n
atu
rally
driv
es
mark
ets
tow
ard
their e
quilib
rium
.
Sum
mary
•To a
naly
ze h
ow
any e
vent in
fluences a
mark
et, w
e u
se
the s
upply
-and-d
em
and d
iagra
m to
exam
ine h
ow
the
even a
ffects
the e
quilib
rium
pric
e a
nd q
uantity.
•In
mark
et e
conom
ies, p
rices a
re th
e s
ignals
that g
uid
e
econom
ic d
ecis
ions a
nd th
ere
by a
llocate
resourc
es.