Embed Size (px)
Citation preview

MarketEquilibrium and Market Demand:
Perfect Competition
Chapter 8

Discussion Topics
Derivation of market supply curveElasticity of supply and producer surplusMarket equilibrium under perfect
competitionTotal economic surplusAdjustments to market equilibrium

Page 123
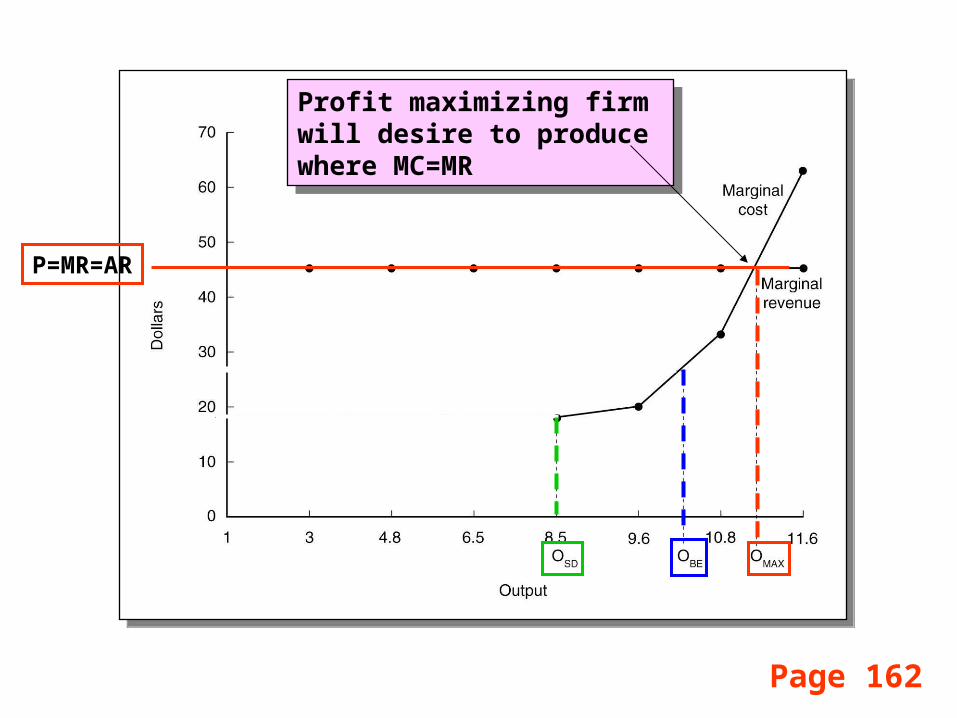
P=MR=AR
Remember the firm’ssupply curve?
Remember the firm’ssupply curve?

Page 162
Firm’s supply curvestarts at shut downlevel of output
Firm’s supply curvestarts at shut downlevel of output
P=MR=AR
Page 162
Profit maximizing firm will desire to producewhere MC=MR
Profit maximizing firm will desire to producewhere MC=MR
P=MR=AR

Page 162
Economic losses will occurbeyond output OMAX, whereMC > MR
Economic losses will occurbeyond output OMAX, whereMC > MR
P=MR=AR

Market supply curve can be thought of as the horizontal summationof the supply decisions of all firms in the market. Here, at a priceof $1.50, Gary would supply 2 tons of broccoli and Ima would supply 1 ton, giving a market supply of 3 tons.
Market supply curve can be thought of as the horizontal summationof the supply decisions of all firms in the market. Here, at a priceof $1.50, Gary would supply 2 tons of broccoli and Ima would supply 1 ton, giving a market supply of 3 tons.
Page 163
Building the Market Supply CurveBuilding the Market Supply Curve

Market supply curve can be thought of as the horizontal summationof the supply decisions of all firms in the market. Here, at a priceof $1.50, Gary would supply 2 tons of broccoli and Ima would supply 1 ton, giving a market supply of 3 tons.
Market supply curve can be thought of as the horizontal summationof the supply decisions of all firms in the market. Here, at a priceof $1.50, Gary would supply 2 tons of broccoli and Ima would supply 1 ton, giving a market supply of 3 tons.
+
Page 163
Building the Market Supply CurveBuilding the Market Supply Curve

Market supply curve can be thought of as the horizontal summationof the supply decisions of all firms in the market. Here, at a priceof $1.50, Gary would supply 2 tons of broccoli and Ima would supply 1 ton, giving a market supply of 3 tons.
Market supply curve can be thought of as the horizontal summationof the supply decisions of all firms in the market. Here, at a priceof $1.50, Gary would supply 2 tons of broccoli and Ima would supply 1 ton, giving a market supply of 3 tons.
+ =
Page 163
Building the Market Supply CurveBuilding the Market Supply Curve

Merging Demand and Supply
Price
Quantity
D S
PE
QE
Market clearing priceMarket clearing price

Merging Demand and Supply
Price
Quantity
D S
PE
QE
Chapters 3-5Chapters 3-5

Merging Demand and Supply
Price
Quantity
D S
PE
QE
Factors that changedemand: Other prices Consumer income Tastes and preferences Real wealth effect Global events
Factors that changedemand: Other prices Consumer income Tastes and preferences Real wealth effect Global events
D*
QE*
PE*

Merging Demand and Supply
Price
Quantity
D S
PE
QE
Chapters 6-7Chapters 6-7

Merging Demand and Supply
Price
Quantity
D S
PE
QE
Factors that changesupply: Input costs Government policy Price expectations Weather & disease Global events
Factors that changesupply: Input costs Government policy Price expectations Weather & disease Global events
QE*
PE*
S*
Concept of Producer Surplus
Producer surplus is a fancy term economists use for profit. We measure producer surplusas the area above the supply curve andbelow the market equilibrium price.
Page 165

Concept of Producer Surplus
Producer surplus is a fancy term economists use for profit. We measure producer surplusas the area above the supply curve andbelow the market equilibrium price.
Total economic surplus is therefore equal toconsumer surplus discussed in Chapter 4 plus producer surplus.
Page 165

Page 165
F G
Product price
Market Price of $4Market Price of $4
A B
Producer surplus at $4is equal to area ABC
Producer surplus at $4is equal to area ABC

Page 165
F G
Producer surplus at $6is equal to area EDC
Producer surplus at $6is equal to area EDC
Product price
Suppose Price Increased to $6…Suppose Price Increased to $6…

Page 165
The gain in producer surplus if the price increases from $4is equal to area AEDB
The gain in producer surplus if the price increases from $4is equal to area AEDB
F G
Producers are betteroff economically byresponding to thisprice increase byproducing output G
Producers are betteroff economically byresponding to thisprice increase byproducing output GC

An Example of Economic Welfare AnalysisAn Example of Economic Welfare Analysis
Page 169
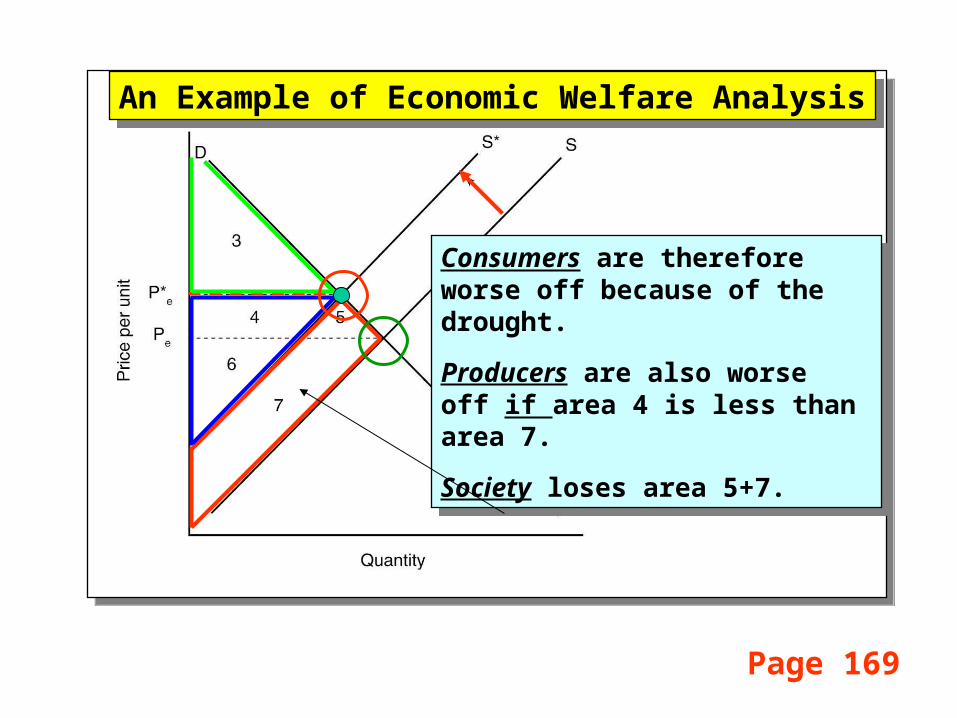
Assume a drought occursthat results in a decreasein supply from S to S*.
Before this happened,consumer surplus wasarea 3+4+5 while producersurplus was equal toarea 6+7. Total economicequals area 3+4+5+6+7
Assume a drought occursthat results in a decreasein supply from S to S*.
Before this happened,consumer surplus wasarea 3+4+5 while producersurplus was equal toarea 6+7. Total economicequals area 3+4+5+6+7

An Example of Economic Welfare AnalysisAn Example of Economic Welfare Analysis
After the decrease insupply, consumer surplusis just area 3. They lose area 4 and area 5.
Producers gain area 4 butlose area 7.
After the decrease insupply, consumer surplusis just area 3. They lose area 4 and area 5.
Producers gain area 4 butlose area 7.
Page 169
An Example of Economic Welfare AnalysisAn Example of Economic Welfare Analysis
Page 169
Consumers are thereforeworse off because of thedrought.
Producers are also worse off if area 4 is less than area 7.
Society loses area 5+7.
Consumers are thereforeworse off because of thedrought.
Producers are also worse off if area 4 is less than area 7.
Society loses area 5+7.

Measuring Surplus LevelsMeasuring Surplus Levels
Page 168
Product price
DS
$4
10
$1
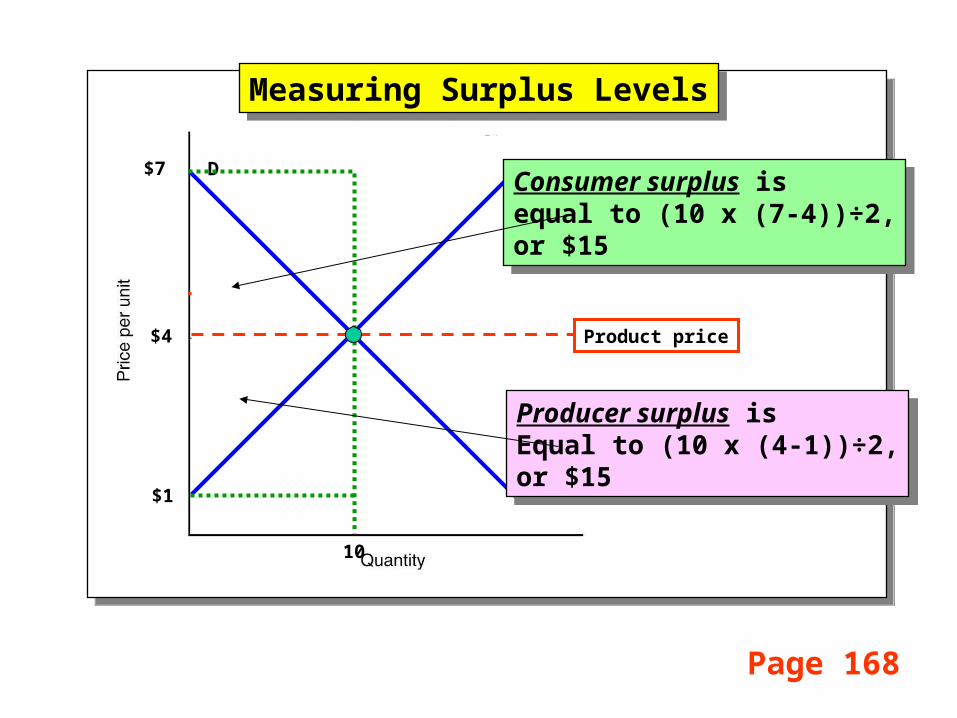
$7Consumer surplus isequal to (10 x (7-4))÷2,or $15
Consumer surplus isequal to (10 x (7-4))÷2,or $15
Measuring Surplus LevelsMeasuring Surplus Levels
Page 168
Product price
DS
$4
10
$1
$7Consumer surplus isequal to (10 x (7-4))÷2,or $15
Consumer surplus isequal to (10 x (7-4))÷2,or $15
Producer surplus isEqual to (10 x (4-1))÷2,or $15
Producer surplus isEqual to (10 x (4-1))÷2,or $15

Measuring Surplus LevelsMeasuring Surplus Levels
Page 168
Product price
DS
$4
10
$1
$7Consumer surplus isequal to (10 x (7-4))÷2,or $15
Consumer surplus isequal to (10 x (7-4))÷2,or $15
Producer surplus isEqual to (10 x (4-1))÷2,or $15
Producer surplus isEqual to (10 x (4-1))÷2,or $15
Total economic surplusis therefore $30…
Total economic surplusis therefore $30…

Modeling Commodity
Prices

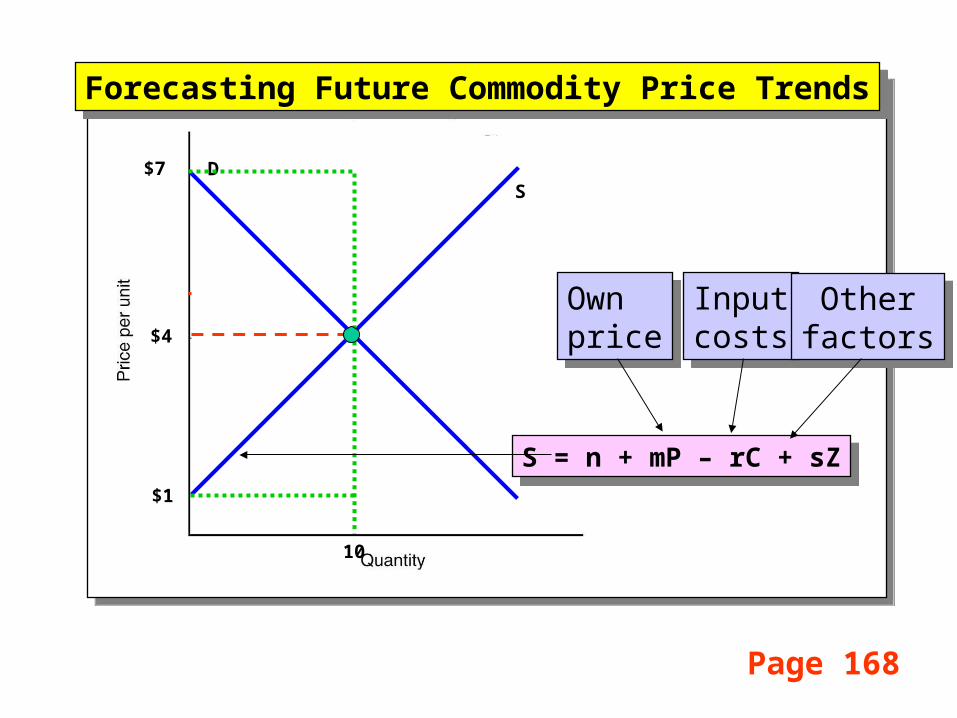
Forecasting Future Commodity Price TrendsForecasting Future Commodity Price Trends
Page 168
DS
$4
10
$1
$7
D = a – bP + cYD + eXD = a – bP + cYD + eX
Ownprice
Ownprice
Disposableincome
Disposableincome
Otherfactors
Otherfactors
Page 168
DS
$4
10
$1
$7
S = n + mP – rC + sZS = n + mP – rC + sZ
Ownprice
Ownprice
Inputcosts
Inputcosts
Forecasting Future Commodity Price TrendsForecasting Future Commodity Price Trends
Otherfactors
Otherfactors

Projecting Commodity PriceProjecting Commodity Price
Page 221
D = SD = S
DS
$4
10
$1
$7
D = 10 – 6P + .3YD + 1.2XD = 10 – 6P + .3YD + 1.2X
S = 2 + 4P – .2C + 1.02ZS = 2 + 4P – .2C + 1.02Z
Substitute the demand and supplyequations into the the equilibriumcondition and solve for price
Substitute the demand and supplyequations into the the equilibriumcondition and solve for price

Many Applications Policy decisions by Congress and
the president Commodity modeling by brokers
and traders Credit repayment capacity
analysis by lenders Outlook presentations by
extension economists Planting decisions by farmers Herd size and feedlot placement
decisions by livestock producers Strategic planning for processors

Market Disequilibrium

Market SurplusMarket Surplus
At the price is PS, producers wouldsupply QS.
At the price is PS, producers wouldsupply QS.
Page 170

Market SurplusMarket Surplus
At the price is PS, consumers wouldonly want QD.
At the price is PS, consumers wouldonly want QD.
Page 170

Market SurplusMarket Surplus
At the price is PS, a market surplus equal QS – QD exists
At the price is PS, a market surplus equal QS – QD exists
Page 170

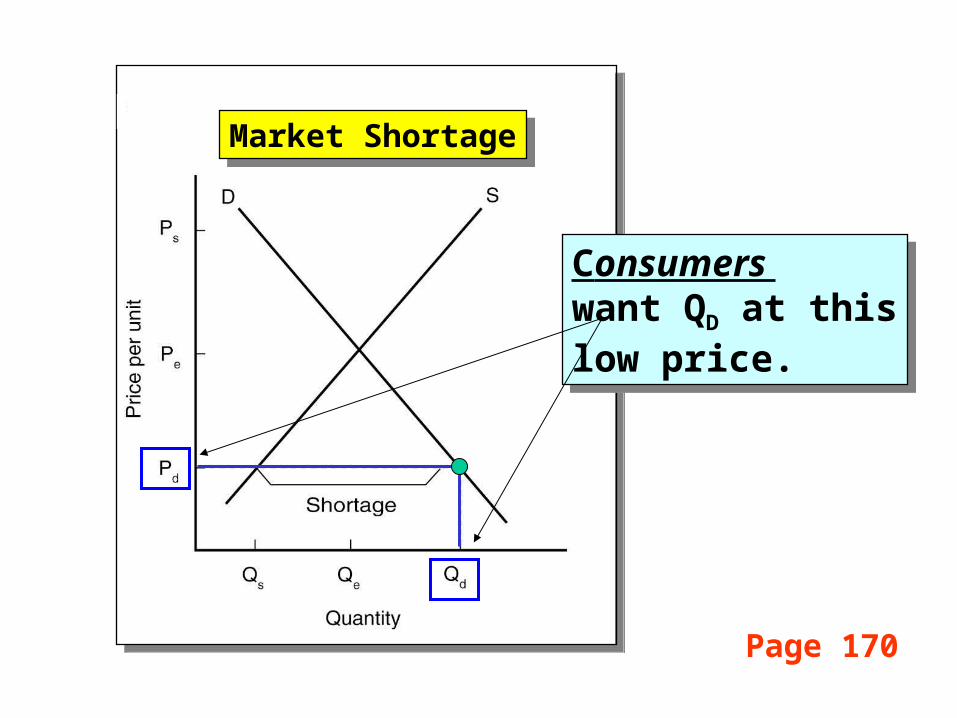
Market ShortageMarket Shortage
At the price is PD, producers wouldonly supply QS.
At the price is PD, producers wouldonly supply QS.
Page 170
Market ShortageMarket Shortage
Consumers want QD at thislow price.
Consumers want QD at thislow price.
Page 170

Market ShortageMarket Shortage
Consumers want QD at thislow price.
Consumers want QD at thislow price.
Page 170
At the price is PS, a market shortage equal QD – QS exists
At the price is PS, a market shortage equal QD – QS exists

Adjustments to Market Equilibrium
Markets converge to equilibrium over time unless other events in the economy occur.
One explanation for this adjustment whichmakes sense in agriculture is the Cobwebtheory. This names stems from the spiderlike trail the adjustment process makes.

Year 2 ReactionsYear 2 Reactions
Producers use last year’sprice as their expectedprice for year 2.
Consumers on the otherhand pay this year’s price determined by Q2.
Producers use last year’sprice as their expectedprice for year 2.
Consumers on the otherhand pay this year’s price determined by Q2.
Page 172

Year 3 ReactionsYear 3 Reactions
P2
P3
Producers now decide toproduce less at the lowerexpected price. Thislower quantity pushesprice up to P3 in year 3.
Producers now decide toproduce less at the lowerexpected price. Thislower quantity pushesprice up to P3 in year 3.
Page 172

Cobweb Pattern Over TimeCobweb Pattern Over Time
Marketequilibrium
Marketequilibrium
The market converges tomarket equilibrium wheredemand intersects supplyat price PE. In some markets, this adjustmentperiod may only be monthsor even weeks rather thanyears assumed here.
The market converges tomarket equilibrium wheredemand intersects supplyat price PE. In some markets, this adjustmentperiod may only be monthsor even weeks rather thanyears assumed here.
Page 172

Market-to-Firm Linkages

Some Important Jargon
We need to distinguish between movement along a demand or supply curve, and shifts in the demand or supply curve.

Some Important Jargon
We need to distinguish between movement along a demand or supply curve, and shifts in the demand or supply curve.
Movement along a curve is referred to as a“change in the quantity demanded or supplied”. A shift in a curve is referred to as a “changein demand or supply”.

Page 167
Increase in demandpulls up price from Pe to Pe*
Increase in demandpulls up price from Pe to Pe*
Decrease in demandpushes price downfrom Pe to Pe*
Decrease in demandpushes price downfrom Pe to Pe*

Page 167
Increase in supplypushed price down from Pe to Pe*
Increase in supplypushed price down from Pe to Pe*
Decrease in supplypulls up price from Pe to Pe*
Decrease in supplypulls up price from Pe to Pe*

Merging Demand and Supply
Price
Quantity
D S
PE
QE
Chapters 6-7Chapters 6-7
Chapters 3-5Chapters 3-5

Firm is a “Price Taker” Under Perfect Competition
Price
Quantity
D S
PE
QE
Price
OMAX
AVC MC
The MarketThe Market The FirmThe Firm

If Demand Increases……
Price
Quantity
D S
PE
QE
Price
AVC MC
The MarketThe Market The FirmThe Firm
10 11
D1

If Demand Decreases……
Price
Quantity
D S
PE
QE
Price
AVC MC
The MarketThe Market The FirmThe Firm
9 10
D2

Firm is a “Price Taker” in the Input Market
Price
Quantity
D S
PE
QE
Price
LMAX
MVP
MIC
Labor MarketLabor Market The FirmThe Firm

Firm is a “Price Taker” in the Input Market
Price
Quantity
D S
PE
QE
Price
LMAX
MVP
MIC
Labor MarketLabor Market The FirmThe Firm

Effects of Increasing The Minimum Wage
Price
Quantity
D S
PMIN
QD
Price
LMAX
MVP
MIC
Labor MarketLabor Market The FirmThe Firm
QS

SummaryMarket equilibrium price and quantity
are given by the intersection of demand and supply
Producer surplus captures the profit earned in the market by producers
Total economic surplus is equal to producer surplus plus consumer surplus
A market surplus exists when the quantity supplied exceeds the quantity demanded.
A market shortage exists when the quantity demanded exceeds the quantity supplied.

Chapter 9 focuses on market equilibrium and product prices under conditions of imperfect competition….