Embed Size (px)
Citation preview

MARKET ENVIRONMENT REPORT April 2015

MERCER Market Environment Report April 2015 2
About Mercer
Mercer is a global provider of investment services, and offers customized guidance at each stage of the investment
decision, risk management, and investment monitoring process. We have been dedicated to meeting clients’ needs for
more than 40 years, and work with the fiduciaries of retirement funds, foundations, endowments, wealth management
firms and other investors in more than 60 countries. We offer clients a continuum of services in order to tailor solutions
specific to their unique requirements and governance objectives. Our services include:
For further information contact:
Chris Kohler, Endowments and Foundations, [email protected] or at 630 750 8017
John Nussbaumer, Retirement Plans and Health Care, [email protected] or at 404 442 3280
David Eisenberg, Wealth Management Providers, [email protected] or at 617 747 9454
Missed our recent publications? These materials are available on Mercer.com.
Setting an Appropriate Liquidity Budget: Making the Most of a Long Investment Horizon
Global REITs - A Mercer Point of View
Hedge Fund Managers and the Swiss Black Swan
Defined Contribution - Customizing Target Date Funds
Defined Benefit - Best Ideas for the Hibernation Portfolio
Not-for-Profit - Is A Stronger Dollar Good For Your Investment Portfolio?

MERCER Market Environment Report April 2015 3
Overview
Table of Contents
Performance
International equities outperformed domestic equities in Q1 4
Macro environment
Oil prices stabilized 5
The dollar extended its rally 6-7
Has the Eurozone economy turned the corner? 8
Another first quarter slump for the US economy 10
Weak commodity prices and a slowing China weigh 11
on emerging economies
The Fed dialed back tightening expectations 12-13
Financial markets
Equities remain attractive relative to bonds 14-15
US equities: Earnings face near-term headwinds 16-17
Small-caps expensive, but less exposed to dollar strength 18
Emerging market equities face near-term risks 19
International equities have better earnings growth prospects
than the US 20-21
Treasury yields declined further in Q1 22-23
High yield bonds rebounded in Q1 24
Depreciating currencies hurt returns for local emerging
market debt 25
Dollar strength and excess oil supply weigh on commodities 26
Valuations and interest rate sensitivity are concerns for 27
Global REITs
Hedge funds 28
Liability driven investing: Maintain tactical underhedge, 29
favor credit
Executive Summary
Global equities got off to a solid start in 2015 as easy monetary conditions and
improving growth helped drive European and Japanese equities higher. US
equities, in contrast, posted muted returns. The MSCI ACWI index earned
4.9% in local currencies and 2.3% in US$.
While US growth disappointed in Q1, data for other developed markets was
encouraging. The IMF projects advanced economies will expand by 2.4% this
year, which would be the strongest year since 2010 and a solid improvement
from the 1.8% rate in 2014.
Diverging monetary policies seem to be the primary driver of currency markets.
The trade-weighted dollar continued its ascent during the first quarter, rising by
8.1%. We believe the dollar is likely to continue to rise, although at a slower
pace than it did during the last six months.
The Fed reined in tightening expectations at its March meeting, but still
appears likely to lift rates in 2015, which could introduce more volatility into
asset prices and lead to the long-awaited correction in equity markets.
Nevertheless, global monetary policy will remain extremely easy for the
foreseeable future due to policies in Europe and Japan.
While equity valuations are elevated and prospective returns are below
average, we continue to favor them relative to bonds. The prospective equity
risk premium on equities remains attractive, and low bond yields could put
further upward pressure on valuations.
We continue to favor non-US developed equities over US equities. Non-US
stocks are more reasonably priced than US equities. Furthermore, weak
currencies and improving growth should help Eurozone and Japanese
companies grow earnings. Meanwhile, the strong dollar and the potential for
wage increases have dampened the outlook for US profits.
We are cautious on the near-term outlook for emerging market stocks relative
to developed stocks and would not be surprised to see them continue to
underperform. Nevertheless, we continue to favor strategic overweights.
Given current spreads and yields, we maintain a preference for high yield
bonds over Treasuries, but favor global equities to high yield bonds.
With traditional assets priced to provide lower returns going forward, we
continue to suggest investors seek additional return drivers, such as manager
alpha, illiquidity and other non-traditional risk factors.

MERCER Market Environment Report April 2015 4
International equities outperformed domestic equities in Q1
1.0
4.9 3.5
10.2
3.1 2.2
1.0
10.9
11.6
10.2
8.0
4.9
0
2
4
6
8
10
12
14
US (S&P500)
MSCI EAFE Europe Japan Pacific ExJapan
EmergingMkts
(%)
First Quarter Returns for Global Markets US $
Local Currency
Source: MSCI, Datastream
Non-US equities substantially
outperformed in Q1 benefiting
from an improved growth
outlook.
Dollar strength
weighed on US$
returns, although
internationals still
outperformed in
unhedged terms.
3.1
-2.1
5.4
2.4
6.6
2.0
0.5
2.7
-4
-2
0
2
4
6
8
Gro
wth
Va
lue
Gro
wth
Va
lue
Gro
wth
Va
lue
De
fen
siv
e
Dyna
mic
Russell Top 200 Russell Midcap Russell 2000 Russell 1000
(%)
First Quarter Style Performance
Source: Datastream
Growth outperformed value
across all capitalizations in Q1.
Defensive indexes lagged
during the quarter.
-5.9
-4.4
-4.0
-1.5
0.0
1.0
1.1
1.4
1.6
2.2
2.3
2.5
2.5
4.0
4.2
4.3
4.9
5.6
-10 -5 0 5 10
Commodity Futures
Intl Fixed
Emerg Mkt Debt (Local)
Natural Res Stks
T-Bills
US Large-Cap Stks
US MBS
US TIPS
US Treasuries
Emerg Mkt Stks
US I/G Corp Bonds
Fund of Hedge Funds
US High Yield Bonds
US Mid-Cap Stks
Global REITs
US Small-Cap Stks
Intl Large-Cap Stks
Intl Sm-Cap Stks
First Quarter Performance (%)
Source: Datastream
Small-caps outperformed large-caps
in Q1. Dollar strength may have
weighed on multinational large-cap
firms, while small-caps are more
domestically focused.
Funds of hedge funds
outperformed global
stocks and US bonds.
The MSCI ACWI index earned
2.3% and the Barclays Aggregate
index returned 1.6%.
Credit outperformed
Treasuries.
The real yield on 5-
year TIPS fell from
0.52% to –0.14%.
LCEMD losses were due to currency
declines. $US-denominated debt
returned 1.9%.
The yield on the 10-year
Treasury dropped from
2.17% to 1.94% in Q1.
The S&P 500 lagged most
markets in Q1.

MERCER Market Environment Report April 2015 5
0
200
400
600
800
1,000
1,200
1,400
1,600
1,800
4
5
6
7
8
9
10
199
5
199
6
199
7
199
8
199
9
200
0
200
1
200
2
200
3
200
4
200
5
200
6
200
7
200
8
200
9
201
0
201
1
201
2
201
3
201
4
201
5
Rig
Co
un
t
Millio
n B
arr
els
per
Day
US Oil Production
Barrels per Day (MM, Smoothed, LHS) US Oil Rig Count (RHS)
The US rig count measures the number of rigs actively drilling
oil wells. The count has declined by nearly 50%, driven by
idling of low efficiency rigs. New supply from active, high
productivity rigs is still outpacing the production decline from
existing wells. Supply could continue to rise in the near-term,
but a sustained drop in rig count should eventually lead to
lower production as existing wells are depleted.
Oil prices stabilized
Oil fell from $53 to $48 a barrel in Q1, although prices recovered to the
mid-$50s in early April. Rising inventories suggest continued
oversupply. However, the estimated global excess supply of 1M
barrels per day represents only about 1% of total demand. Lower
prices and improving global economic growth should help lift demand,
absorbing some of the current excess supply. Going forward, supply
dynamics will likely be a key factor in determining future prices.
US production has accounted for nearly 60% of global crude oil supply
growth since 2011. While production has continued to increase due to
projects started before the price collapse, energy companies are
slashing capital expenditures. US production could potentially level-off
later this year due to the rapid depletion rate of shale wells.
Technological enhancements continue to drive the cost of US shale
drilling lower, which means prices may not have to rise much to get
investment flowing again.
A nuclear deal with Iran could release more supply, but a supply
disruption is a constant risk in the Middle East.
The decline in oil prices should help global growth because
consuming countries generally have a higher propensity to spend than
producing countries. However, a renewed downturn could destabilize
some regimes, leading to greater geopolitical risks.
Source: Bloomberg
200
250
300
350
400
450
500
199
0
199
1
199
2
199
3
199
4
199
5
199
6
199
7
199
8
199
9
200
0
200
1
200
2
200
3
200
4
200
5
200
6
200
7
200
8
200
9
201
0
201
1
201
2
201
3
201
4
201
5
Millio
n B
arr
els
US Crude Oil Inventory
20
40
60
80
100
120
Jan
-14
Fe
b-1
4
Mar-
14
Ap
r-1
4
May-1
4
Jun
-14
Jul-
14
Au
g-1
4
Se
p-1
4
Oct-
14
No
v-1
4
De
c-1
4
Jan
-15
Fe
b-1
5
Mar-
15
Ap
r-1
5
$ P
er
Barr
el
WIT Oil Futures Prices
1M
12M
36M
Source: Bloomberg
Source: Bloomberg
US inventory has jumped by 25% since the start of the year,
suggesting oversupply in the US. With the futures prices
trading higher than spot, there is an incentive to hold oil for
sale at higher prices in later months.
Following the free-fall in 2H14 and
January, prices stabilized in the
remainder of Q1 and have rebounded in
early April.

MERCER Market Environment Report April 2015 6
-35
-30
-25
-20
-15
-10
-5
0
5
Sw
iss F
ran
c
Ta
iwa
n D
olla
r
India
n R
upe
e
Ch
inese Y
ua
n
Jap
an
ese
Ye
n
Ko
rea
n W
on
Mexic
an P
eso
Ne
w Z
eala
nd $
GB
Pou
nd
Au
str
alia
n D
olla
r
Ca
na
dia
n D
olla
r
Eu
ro
Bra
zili
an
Re
al
(%)
Performance of Foreign Currencies Versus the Dollar Q1
1-Year
The trade-weighted dollar continued its ascent during the first quarter,
rising by 8.1%. It advanced by as much as 9.7%, but pared gains after
the March FOMC meeting. The euro tumbled 11.3%, and most
commodity sensitive currencies and emerging market currencies also
declined. We believe the dollar is likely to continue to rise, although at
a slower pace than it did during the last six months.
Monetary policy seems the primary driver of currency markets. The
dollar has a significant yield advantage on intermediate- and long-
term bonds. With many European cash rates now negative and the
Fed likely to begin lifting rates in 2015, the gap should widen on the
short-end as well.
The 10-year US Treasury ended the quarter yielding 1.9%
compared to 0.2% in Germany and 0.4% in Japan. With global
savings running high, the dollar should continue to benefit from
foreign capital inflows.
Some of the liquidity from the ECB’s €1.1T QE program could leak
into the US due to relatively attractive yields.
The dollar’s surge over the last nine months has pushed it into
overvalued territory. While not at unprecedented levels, the dollar is
rich against most major currencies based on purchasing power parity
(PPP). A widening current account deficit is another intermediate-term
bearish factor for the dollar. While both valuations and the current
account deficit suggest the dollar has already run too far, they are not
likely to prevent an overshoot over the short-term.
Perhaps the biggest risk for the dollar is if the Fed proves less
aggressive in hiking rates than the market expects. A strong dollar
impedes US growth and reduces inflation, which could potentially
keep the Fed on the sideline for longer. Calculations by the IMF
suggest that a 10% appreciation in the real trade-weighted dollar has
an equivalent effect as a 100 basis-point rate hike. A perceived
change in the outlook for interest rate differentials could cause a
stampede out of the dollar as speculators have record long exposure.
The dollar extended its rally
Source: Bloomberg
The Swiss Franc surged 20% in
mid-January as the central bank
abandoned its cap relative to the
euro, but has since given back
most of those gains.
The euro fell by 11.3% against the
dollar in Q1, the largest quarterly
decline in the history of the
common currency.
The yen had a quite quarter, falling just 0.3%
-20
-10
0
10
20
30
40
50
197
3
197
6
197
9
198
2
198
5
198
8
199
1
199
4
199
7
200
0
200
3
200
6
200
9
201
2
201
5
Rela
tiv
e t
o G
eo
metr
ic M
ean
(%
)
US Dollar - Real Effective Exchange Rate
The real trade-weighted
dollar would need to
appreciate another 12%
to return to the 2002
high.
Source: Bloomberg
The dollar pulled back
8% in 1998, before
continuing to trend
higher.

MERCER Market Environment Report April 2015 7
-40
-30
-20
-10
0
10
20
30
40
50
199
0
199
2
199
4
199
6
199
8
200
0
200
2
200
4
200
6
200
8
201
0
201
2
201
4
(%)
Currency Valuation Versus US Dollar
(Based on Relative PPP)
Euro UK Pound
Yen Australian$
The yen trades at a 27% discount
to the dollar, while the euro is at a
10% discount.
50
150
250
350
450
550
650
Jan
-08
Jul-
08
Jan
-09
Jul-
09
Jan
-10
Jul-
10
Jan
-11
Jul-
11
Jan
-12
Jul-
12
Jan
-13
Jul-
13
Jan
-14
Jul-
14
Jan
-15
Jul-
15
Jan
-16
Jul-
16
(1/2
008=
100)
Central Bank Balance Sheet Growth
US EMU UK Japan
The dollar extended its rally (cont.)
The Fed’s and the Bank of England’s balance
sheets are expected to remain flat going
forward, while the ECB and the Bank of Japan
are expected to expand their balance sheets.
The ECB’s QE program should take its balance
sheet back to 2012 levels.
Projections >>>
Source: Bloomberg, Mercer
Source: Bloomberg
Dollar Expensive
Dollar Cheap
-6
-4
-2
0
2
4
6
8
Sw
itzerl
an
d
Eu
rozo
ne
Ch
ina
Jap
an
India
Mexic
o
US
Ca
na
da
Bra
zil
Au
str
alia UK
Current Account Balances
(2015 estimates, % of GDP)
-1.0
-0.5
0.0
0.5
1.0
1.5
2.0
2.5
US
UK
Germ
any
Sp
ain
Sw
itzerl
an
d
De
nm
ark
Sw
ede
n
Jap
an
(%)
Selected Government Bond Yields
Target 5-year 10-year
Source: Bloomberg
Source: IMF
5y German bonds
finished the quarter with
a negative yields.
Switzerland and Denmark
have lowered policy target
rates to -0.75% to discourage
exchange rate appreciation
against the euro.
Current account balances argue against further
deprecation of the euro/USD. The Eurozone’s
current account surplus exceeds 3% of GDP,
compared to a 2% deficit for the US. This is
likely to widen further in 2016 at current
exchange rates.
The weak euro has mostly
benefitted the exports of
Germany, which is not in need of
the subsidy.
MERCER Market Environment Report April 2015 8
-100
-75
-50
-25
0
25
50
75
100
125
De
c-1
2
Mar-
13
Jun
-13
Se
p-1
3
De
c-1
3
Mar-
14
Jun
-14
Se
p-1
4
De
c-1
4
Mar-
15
Citigroup Economic Surprise Index US
Eurozone
Japan
Has the Eurozone economy turned the corner?
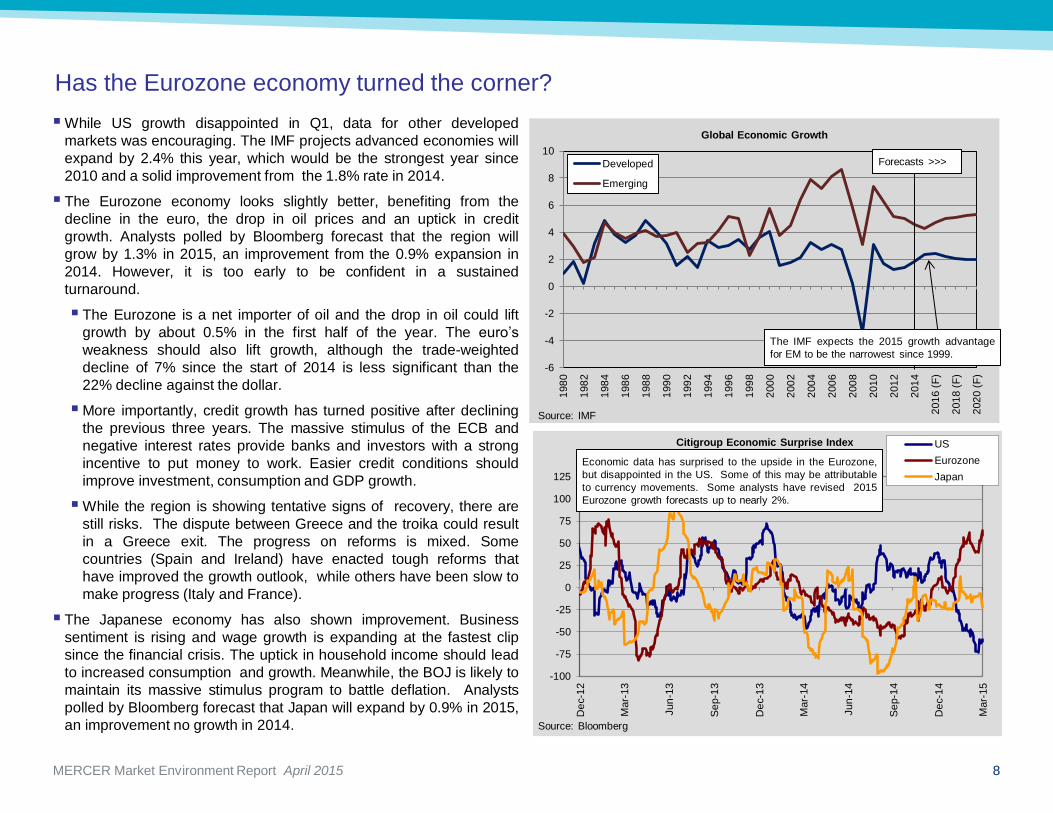
While US growth disappointed in Q1, data for other developed
markets was encouraging. The IMF projects advanced economies will
expand by 2.4% this year, which would be the strongest year since
2010 and a solid improvement from the 1.8% rate in 2014.
The Eurozone economy looks slightly better, benefiting from the
decline in the euro, the drop in oil prices and an uptick in credit
growth. Analysts polled by Bloomberg forecast that the region will
grow by 1.3% in 2015, an improvement from the 0.9% expansion in
2014. However, it is too early to be confident in a sustained
turnaround.
The Eurozone is a net importer of oil and the drop in oil could lift
growth by about 0.5% in the first half of the year. The euro’s
weakness should also lift growth, although the trade-weighted
decline of 7% since the start of 2014 is less significant than the
22% decline against the dollar.
More importantly, credit growth has turned positive after declining
the previous three years. The massive stimulus of the ECB and
negative interest rates provide banks and investors with a strong
incentive to put money to work. Easier credit conditions should
improve investment, consumption and GDP growth.
While the region is showing tentative signs of recovery, there are
still risks. The dispute between Greece and the troika could result
in a Greece exit. The progress on reforms is mixed. Some
countries (Spain and Ireland) have enacted tough reforms that
have improved the growth outlook, while others have been slow to
make progress (Italy and France).
The Japanese economy has also shown improvement. Business
sentiment is rising and wage growth is expanding at the fastest clip
since the financial crisis. The uptick in household income should lead
to increased consumption and growth. Meanwhile, the BOJ is likely to
maintain its massive stimulus program to battle deflation. Analysts
polled by Bloomberg forecast that Japan will expand by 0.9% in 2015,
an improvement no growth in 2014.
Economic data has surprised to the upside in the Eurozone,
but disappointed in the US. Some of this may be attributable
to currency movements. Some analysts have revised 2015
Eurozone growth forecasts up to nearly 2%.
-6
-4
-2
0
2
4
6
8
10
198
0
198
2
198
4
198
6
198
8
199
0
199
2
199
4
199
6
199
8
200
0
200
2
200
4
200
6
200
8
201
0
201
2
201
4
201
6 (
F)
201
8 (
F)
202
0 (
F)
Global Economic Growth
Developed
Emerging
Source: IMF
Source: Bloomberg
The IMF expects the 2015 growth advantage
for EM to be the narrowest since 1999.
Forecasts >>>

MERCER Market Environment Report April 2015 9
Has the Eurozone economy turned the corner? (cont.)
0.0
0.5
1.0
1.5
2.0
2.5
3.0
Mar-
10
Se
p-1
0
Mar-
11
Se
p-1
1
Mar-
12
Se
p-1
2
Mar-
13
Se
p-1
3
Mar-
14
Se
p-1
4
Mar-
15
(%)
Eurozone 2-Year Inflation Expectations 2-Years Forward
-8
-6
-4
-2
0
2
4
De
c-1
0
Mar-
11
Jun
-11
Se
p-1
1
De
c-1
1
Mar-
12
Jun
-12
Se
p-1
2
De
c-1
2
Mar-
13
Jun
-13
Se
p-1
3
De
c-1
3
Mar-
14
Jun
-14
Se
p-1
4
De
c-1
4
(%)
Eurozone Growth in Household and Non-financial Corporate Loans
(Rolling 3-month annualized)
-4
-3
-2
-1
0
1
2
3
199
1
199
3
199
5
199
7
199
9
200
1
200
3
200
5
200
7
200
9
201
1
201
3
201
5
(%)
Japanese Wage Growth
BCA estimates that from 2012 to
2014 credit in the Eurozone shrank
by around €300B a year,
substantially weighing on growth.
Credit growth turned positive in early
2012, but quickly plummeted as the
debt crisis intensified. Today, Eurozone
yields are at record lows, and the ECB
is expanding its balance sheet by
€720B a year.
Inflation expectations made a welcome move upwards in the
first quarter. Still, they remain below the ECB’s target of 2%,
with the market pricing in inflation of only 1.2% between 2017
and 2019. This suggests that the ECB is likely to maintain its
QE program until the end of 2016 at the earliest.
Nominal wage growth in Japan is at
its highest level since before the
financial crisis. Higher wage growth
could translate into increased
consumption and higher GDP growth.
Source: Bloomberg Source: Bloomberg
Source: Bloomberg Source: Bloomberg
0.0
0.5
1.0
1.5
2.0
2.5
3.0
3.5
Fe
b-1
3
Ap
r-1
3
Jun
-13
Au
g-1
3
Oct-
13
De
c-1
3
Fe
b-1
4
Ap
r-1
4
Jun
-14
Au
g-1
4
Oct-
14
De
c-1
4
Fe
b-1
5
Ap
r-1
5
(%)
2015 GDP Growth
Consensus Expectations
US Eurozone
UK Japan
US growth expectations will likely
decline further if Q1 growth is as
low as expected.
The Eurozone’s growth outlook has
been revised upward this year and
may improve further.
Source: Bloomberg

MERCER Market Environment Report April 2015 10
-6
-4
-2
0
2
4
6
199
0
199
2
199
4
199
6
199
8
200
0
200
2
200
4
200
6
200
8
201
0
201
2
201
4
(%)
Year-Over-Year Growth in Employment and Hourly Wages
Non-farm Payrolls
Average Hourly Wages
Another first quarter slump for the US economy
The US economy sputtered in the first quarter. Economists forecasted
2.8% growth at the start of the quarter, but now predict growth of only
1.3% (which could be too optimistic). Some temporary factors
contributed to this, including the weather and the West Coast ports
strike. The strength of the dollar and the decline in energy investment
were also drags. The decline in energy prices should be a positive for
growth in 2015, but the benefits were only partially realized in Q1
because households saved much of the windfall.
Employment growth in the quarter was disappointing relative to recent
history, although solid in absolute terms. Payrolls increased by an
average of 197k per month in Q1, down from 324k in 4Q14, while
unemployment slipped from 5.6% to 5.5%. Household income is
growing at a solid pace, which should continue to support spending.
With the reduction in energy investment, business investment is a wild
card. Energy represents 10% to 15% of total business investment, but
that drag could be overcome by other sectors of the economy.
Given the temporary factors, it is probably a mistake to read too much
into Q1 results. Indeed, it is reminiscent of 1Q14 when the economy
contracted 2.1% due largely to poor weather. The economy
rebounded strongly in subsequent quarters. Economists expect a
similar pattern in 2015. Forecasts for full year growth for 2015 have
only come down slightly, from 3.0% to 2.9%.
0
4
8
12
16
20
195
0
195
3
195
6
195
9
196
2
196
5
196
8
197
1
197
4
197
7
198
0
198
3
198
6
198
9
199
2
199
5
199
8
200
1
200
4
200
7
201
0
201
3
(%)
Trade as % of GDP Exports
Imports
30
35
40
45
50
55
60
65
70
199
8
199
9
200
0
200
1
200
2
200
3
200
4
200
5
200
6
200
7
200
8
200
9
201
0
201
1
201
2
201
3
201
4
201
5
ISM Business Activity Indexes
Manufacturing
Services
The Q1 hiring represents 1.7% annualized
employment growth, significantly faster
than working-age population growth
(~0.5%), meaning labor market slack
would continue to be absorbed.
Hourly wage growth of
2.1% over the last year
was modest, but positive
in inflation-adjusted terms.
Wage growth should
improve further in 2015 as
more labor slack is
absorbed
Source: Bloomberg, BLS
Source: Bloomberg Source: Bureau of Economic Analysis
Trade is a fairly small portion of the US economy,
but higher than in the previous two periods of
dollar strength.
Exports’ share of GDP fell by 2 percentage points
during the mid-80s dollar bull market and by a
similar amount in the late-90s/early-00s bull
market.
The manufacturing index fell to 51.5 in
March, but the services index remains at
healthy levels.

MERCER Market Environment Report April 2015 11
Weak commodity prices and a slowing China weigh on emerging economies
While developed economic growth continues to show signs of
improvement, emerging market growth is decelerating. However,
there were wide divergences across EM economies due to the varying
impact of weak commodity prices (good for importers, bad for
exporters) and the willingness to implement structural reforms.
The outlook in India has continued to improve as inflation has fallen
and investment has expanded, with growth forecasted to rise to
7.4% this year versus 4.7% in 2014.
In contrast, the sharp decline in oil prices and a stalled political
environment have weighed on the Russian and Brazilian
economies, both of which are forecasted to shrink in 2015.
The strength of the dollar continues to be a concern. While it should
help EM exports, tighter US monetary policy could lead to instability
for countries reliant on capital inflows and those with large external
(particularly US$) debt. The decline in commodities amplifies these
pressures for exporters. While the risk of a widespread EM crisis is
low, some countries appear vulnerable, which could have a contagion
impact.
Chinese growth slowed in Q1 as credit and investment activity fell
further. China is also hampered by its managed peg to the US dollar,
which means its currency is appreciating on a trade-weighted basis.
The manufacturing PMI fell below 50 in Q1, suggesting contracting
activity in that sector. While economists polled by Bloomberg expect
7% growth this year, some analysts believe growth is running well
behind the official statistics.
The slowdown in growth has a silver lining as it is being driven by
structural reforms to transition the economy away from credit-led
investment and towards consumption. This should pay dividends
over the long-term.
The slowdown has caused policy makers to loosen monetary
policy, which has contributed to a run in Chinese equities.
7.4
4.7 5.0
1.5 0.2 0.6
3.0
7.0
7.4
5.3
2.2
-0.7
-4.0
3.5
-6
-4
-2
0
2
4
6
8
10
12
14
Ch
ina
India
Indo
ne
sia
So
uth
Afr
ica
Bra
zil
Ru
ssia
Tu
rkey
(%)
Economic Growth
2014 2015 (F)
-6
-4
-2
0
2
4
6
8
10
Mar-
13
Jun
-13
Se
p-1
3
De
c-1
3
Mar-
14
Jun
-14
Se
p-1
4
De
c-1
4
Mar-
15
(%)
2015 GDP Growth
Consensus Expectations China India
Brazil Russia
There is a wide divergence in
growth expectations across EM
countries. EM importers and
reformers are faring well, while
energy exporters and those with
stalled political environments are
struggling.
Chinese growth
has not fallen
below 7% since
1990.
2015 would represent the
worst year for Brazilian
growth since 1990 and since
2009 in Russia.
Brazilian and Russian
growth forecasts continue to
be slashed with both
economies in recession.
Chinese growth estimates
may be revised downward,
while expectations in India
could rise further.
Source: Bloomberg
Source: Bloomberg

MERCER Market Environment Report April 2015 12
The Fed reined in tightening expectations at its March meeting. The
FOMC members’ average target rate expectation for the end of 2015
fell from 1% to 0.6%, which hints the first rate hike could occur at the
September or October meeting. Longer-term bond yields continued to
fall in Q1 with the yield on the 10-year Treasury declining by 23 bps to
1.94%.
While the Fed’s rate forecasts have moved closer to market
expectations, there remains a wide gap, especially beyond 2015. The
Fed projects the target rate will hit 3% by the end of 2017, while Fed
funds futures price a rate of only 1.5%.
Weak Q1 growth notwithstanding, economic conditions suggest the
market’s expectations are too dovish. The unemployment rate is near
its historical average, suggesting wage growth pressures should
increase. While the headline CPI was essentially flat over the last year
due to falling energy prices, core inflation is edging higher.
European monetary policies likely explain the disconnect between US
economic conditions and rates. The yields on US Treasuries appear
very attractive to European investors facing negative rates. As such,
liquidity from European QE could find its way to the US bond market.
This might keep intermediate- and long-term yields depressed even
when the Fed starts to lift short-term rates, flattening the yield curve.
The allure of US bonds could put the Fed in a difficult position. If the
Fed sets interest rates appropriately for US conditions, it could lead to
more foreign inflows and a further strengthening in the dollar, hurting
exporters. Conversely, if the Fed keeps rates low to discourage
inflows, it risks an overheating economy and inflation.
The Fed still appears likely to lift rates in 2015, which is a concern
given the support zero rates have provided to capital markets since
2009. Higher short-term rates are likely to lead to higher volatility and
perhaps even a correction; however, global monetary policies remain
very accommodative on balance. Furthermore, the process of rate
normalization in the US is likely to be gradual and dependent on an
improving economy. As such, we think markets should be able to
overcome this headwind.
The Fed dialed back tightening expectations
0.0
0.5
1.0
1.5
2.0
2.5
3.0
Cu
rren
t 1 2 3 4 5 6 7 8 9
10
Implie
d F
orw
ard
Tre
asury
Yie
ld (
%)
Years
10-Year Treasury Forward Rates
0.0
0.5
1.0
1.5
2.0
2.5
3.0
3.5
4.0
3/31/2015 12/31/2015 12/31/2016 12/31/2017 Long-Run
Expectations for Fed Funds Target Rate
Fed Fund Futures (Dec. 2014)
Fed Fund Futures (April 2015)
FOMC Average (Dec. 2014)
FOMC Average (Mar. 2015)
Economic theory and history suggest that Treasury yields should approximate
nominal GDP growth over the long-term. Consensus forecasts project long-term
nominal GDP growth of 4.6%. However, the yield curve has the 10-year Treasury
rising to only 2.5% by 2025. Bond yields are well below where they should be
unless one has a very pessimistic view of growth prospects, or a dovish view of
Fed policy. An alternate explanation is that monetary policies overseas are
driving funds into US Treasuries, keeping rates low.
The Fed revised its growth expectations
downward in Q1, although it continues
to envision more rapid tightening than
the bond market.
Source: Federal Reserve, Bloomberg
Source: Bloomberg

MERCER Market Environment Report April 2015 13
0
1
2
3
4
5
6
0
2
4
6
8
10
12
198
4
198
6
198
8
199
0
199
2
199
4
199
6
199
8
200
0
200
2
200
4
200
6
200
8
201
0
201
2
201
4
Ch
an
ge i
n A
vera
ge H
ou
rly
Earn
ing
s (
12M
, %
)
Un
em
plo
ym
en
t R
ate
(%
)
Wage Growth and Unemployment
Unemployment Rate (LHS)
Average Hourly Earnings (RHS)
-2.0
-1.5
-1.0
-0.5
0.0
0.5
1.0
1.5
2.0
2.5
3.0
3.5
Dec-13 Feb-14 Apr-14 Jun-14 Aug-14 Oct-14 Dec-14 Feb-15
10-Year Yields on Select Government Bonds
Germany Swiss
UK US
0.0
0.5
1.0
1.5
2.0
2.5
3.0
3.5
Mar-
09
Se
p-0
9
Mar-
10
Se
p-1
0
Mar-
11
Se
p-1
1
Mar-
12
Se
p-1
2
Mar-
13
Se
p-1
3
Mar-
14
Se
p-1
4
Mar-
15
(%)
Inflation Breakeven Rate on TIPS
5-year
5-yr / 5 yrs Forward
The Fed dialed back tightening expectations (cont.)
While the Fed directly controls short-term rates, it has only indirect control over
intermediate-term rates, which are also closely linked to supply/demand. Low rates
overseas suggest strong demand for Treasuries, which should act as an anchor on
intermediate rates.
There is a strong link between the unemployment rate and
wage growth, which suggests high wage growth in 2015.
However, the unemployment rate may understate labor
market tightness given the decline in participation rates.
The 5y/5y inflation breakeven rate is
currently below the Fed’s target.
Source: Bloomberg
Source: Bloomberg, BLS Source: Bloomberg
-4
-2
0
2
4
6
200
0
200
1
200
2
200
3
200
4
200
5
200
6
200
7
200
8
200
9
201
0
201
1
201
2
201
3
201
4
201
5
(%)
Rolling 12-Month Inflation
CPI
CPI Core
The CPI is down slightly over 12
months. It will rebound towards the
core CPI unless oil prices keep falling.
Core inflation is edging higher and is
not far from the Fed’s target.
Source: Bloomberg

MERCER Market Environment Report April 2015 14
Global equities got off to a solid start in 2015 as easy monetary
conditions and improving growth helped drive European and
Japanese equities higher. US equities, in contrast, posted muted
returns. The MSCI ACWI index earned 4.9% in local currencies and
2.3% in US$.
The global growth outlook is favorable, especially compared to the
recent past, which should be supportive of equity earnings. While
some EM economies continue to struggle, US growth should recover
from its Q1 disappointment, and the prospects for the Eurozone and
Japan are improving.
A Fed rate hike in 2015 and the evolution of forward guidance could
introduce more volatility into asset prices and finally lead to the long-
awaited correction in equity markets. Nevertheless, global monetary
policy will remain extremely easy for the foreseeable future due to
policies in Europe and Japan.
With yet another strong quarter driven mostly by valuation expansion,
most indicators suggest global equity valuations are rich on an
absolute basis, but not alarmingly so.
While equity valuations are elevated and prospective returns are
below average, we continue to favor them relative to bonds. More than
half of outstanding Eurozone debt trades at negative yields, with
German yields negative out to 9 years. The prospective equity risk
premium on equities remains attractive, and low bond yields could put
further upward pressure on valuations.
We continue to favor non-US developed equities over US equities.
Non-US stocks are more reasonably priced than US equities.
Furthermore, weak currencies and improving growth should help
Eurozone and Japanese companies grow earnings. Meanwhile, the
strong dollar and the potential for wage increases have dampened the
outlook for US profits.
With equity valuations high and bond yields absurdly low, the
prospective absolute return on balanced portfolios is low. We continue
to suggest investors seek additional return drivers, such as manager
alpha, illiquidity and other non-traditional risk factors.
Equities remain attractive relative to bonds, but more caution warranted
The P/E ratio on the MSCI World
index is near the long-term median.
Source: Datastream
0
5
10
15
20
25
30
35
40
197
5
197
7
197
9
198
1
198
3
198
5
198
7
198
9
199
1
199
3
199
5
199
7
199
9
200
1
200
3
200
5
200
7
200
9
201
1
201
3
201
5
MSCI World P/E Ratio
Normalized Earnings
Reported Earnings
`
-4
-2
0
2
4
6
8
10
12
14
16
18
195
0
195
4
195
8
196
2
196
6
197
0
197
4
197
8
198
2
198
6
199
0
199
4
199
8
200
2
200
6
201
0
201
4
(%)
Real Expected Returns on Stocks and Bonds
Real Yield on 10-yr Treasuries
Normalized Earnings Yield on S&P 500
60/40 Blend Expected Real Return
Source: Datastream, Mercer
Source: Datastream, Bloomberg, S&P, Federal Reserve, Mercer
The trailing P/E ratio on the MSCI World index has risen
from 15 to 19 since the start of 2013.
Theory suggests the
earnings yield provides a
rough estimate of the
future real return on
equities.
With real interest rates near
zero and elevated equity
valuations, the real expected
return on a 60/40 portfolio is
less than 2.5% (assuming no
changes in valuation).

MERCER Market Environment Report April 2015 15
3.8 3.8 6.4
10.7
17.5
25.9 25.6
6.3
0
5
10
15
20
25
30
<-4
0
-40 to
-30
-30 to
-20
-20 to
-10
-10 to
0
0 to
10
10 to
20
>2
0
Pro
babili
ty (
%)
S&P 500 Returns (%)
S&P 500 - One Year Expected Return Distribution Curve
0
1
2
3
4
5
6
7
8
199
4
199
6
199
8
200
0
200
2
200
4
200
6
200
8
201
0
201
2
201
4
(%)
Cost of One-Year Put Options on the S&P 500
Protection Beyond 20% Loss
-2
-1
0
1
2
3
4
5
6
7
8
199
0
199
4
199
8
200
2
200
6
201
0
201
4
(%)
S&P 500 - Equity Risk Premium Versus Long-Term Treasuries
This calculation uses normalized earnings,
which assumes earnings are 26% less than
current levels. Based on reported
earnings, the risk premium was 4.1%.
Based on normalized earnings, the equity risk premium
on the S&P 500 stands at 3%. Due to lower valuations
on non-US stocks, the risk premium on global developed
equities is higher. We estimate that the risk premium on
the MSCI World index is 3.5%.
Source: Mercer, S&P, Bloomberg
Median
since 1956
The cost of one-year tail risk
insurance fell from 2.5% to 2.2%, but
remains above the long-term median.
Source: Parametric, Bloomberg
Equities remain attractive relative to bonds, but more caution warranted (cont.)
The options market prices a 14%
probability of a 20% or worse
decline in 2015, which is above the
historical occurrence of 8%. The expected distribution curve is
negatively skewed (large losses more
likely than large gains), suggesting
option buyers are still willing to pay-up
for downside protection.
S&P 500 Performance Around the
Beginning of Tightening Cycles
-20
-10
0
10
20
30
40
50
May-5
8
Jul-61
Jul-67
Feb-7
2
Jan-7
7
Jul-80
Feb-8
3
Oct-
86
Jan-9
4
Jun-9
9
Jun-0
4
May-5
8
Jul-61
Jul-67
Feb-7
2
Jan-7
7
Jul-80
Feb-8
3
Oct-
86
Jan-9
4
Jun-9
9
Jun-0
4
Six Months Prior 12 Months After
(%)
Historically, the market has earned an
average of 6% in the twelve months following
an interest rate increase. This is below the
overall average of 11%, but the market only
fell in two of eleven observations.
Source: Mercer, Bloomberg
The market has performed well in the 6
months prior to tightening. With a more
transparent Fed, the market could act
before the Fed in the coming cycle.
Source: Bloomberg, Mercer

MERCER Market Environment Report April 2015 16
0
10
20
30
40
50
60
195
6
196
0
196
4
196
8
197
2
197
6
198
0
198
4
198
8
199
2
199
6
200
0
200
4
200
8
201
2
US Shiller's P/E Ratio
S&P 500
MSCI US
US equities: Earnings face near-term headwinds
US equities ended a choppy first quarter up 1.0%. The P/E ratio on
trailing earnings moved from 19.4 to 20.2, which is above the median
of 17.4 since 1956. Valuations continue to appear elevated, especially
on measures that adjust for record profit margins. The P/E ratio based
on average 10Y real earnings (Shiller’s methodology) finished the
quarter at 26.6, compared to a median of 19.3 since 1956.
US earnings are facing mounting downward pressures. Quarterly S&P
500 earnings fell 13.8% year-over-year in Q4. Low oil prices have
gutted energy earnings. Furthermore, the strong dollar has meant a
negative translation effect on foreign sales. Analysts have slashed
2015 EPS estimates by 11% in the last 6 months and now expect a
decline in 2015. While healthy economic growth should support
revenue growth, the earnings growth prospects over intermediate-
term are mixed.
While lower energy prices have had a negative short-term impact
on earnings, they should ultimately reduce input costs, resulting in
a net positive impact. The dollar is a wildcard. Further weakness
will erode profits, but the marginal impact will fade when the dollar
stabilizes. Companies also continue to buyback their own equities,
which increases earnings per share.
With the economy approaching full employment, wage growth
could begin to accelerate, eroding profitability. There are already
signs of a margin squeeze as wage costs are rising faster than
productivity and core consumer prices.
The combination of weak earnings and high valuations are worrisome,
especially with the potential for a Fed rate hike in 2015. Nevertheless,
interest rates remain extremely low and valuations remain fairly
attractive against bonds. While we expect stocks to outperform bonds,
current valuations leave little margin for error.
Source: S&P, MSCI, Bloomberg, Mercer
Shiller’s P/E based on S&P 500 EPS finished the quarter at 26.6, which is 38%
above its historical median. The ratio based on MSCI EPS stood at a more
reasonable 24.2, which is 24% above the historical median.
Introduced in 2001, FAS 142, requires
annual testing of goodwill for impairment
as opposed to amortizing it over 40 years.
FAS 142 impacted S&P 500 (GAAP)
earnings, but not MSCI earnings.
80
90
100
110
120
130
140
Dec-09 Jul-10 Feb-11 Sep-11 Apr-12 Nov-12 Jun-13 Jan-14 Aug-14 Mar-15
(EP
S)
S&P 500 Operating Earnings Estimates
2012
2013
2014
2015
Source: Bloomberg
2015 estimates have fallen sharply.
Earnings estimates for the energy sector
have been cut by over 60% in the last 6
months and the strong dollar has led to
further negative revisions.

MERCER Market Environment Report April 2015 17
-3
-2
-1
0
1
2
3
4
5
6
199
0
199
2
199
4
199
6
199
8
200
0
200
2
200
4
200
6
200
8
201
0
201
2
201
4
(%)
Productivity and Hourly Wage Growth
Rolling 4 Quarters
Real Compensation Per Hour
Non Farm Business Output
0.0%
5.0%
10.0%
15.0%
20.0%
25.0%
1%
2%
3%
4%
Mar-02 Mar-04 Mar-06 Mar-08 Mar-10 Mar-12 Mar-14
(Yo
Y C
han
ge)
Wage Growth vs. Small Business Sentiment
ECI Private Wages & Salaries (LHS)
NFIB planning to raise compensation (RHS, 3Q Advanced)
0%
2%
4%
6%
8%
10%
12%
14%
16%
50%
52%
54%
56%
58%
60%
62%
64%
66%
68%
196
0
196
3
196
6
196
9
197
2
197
5
197
8
198
1
198
4
198
7
199
0
199
3
199
6
199
9
200
2
200
5
200
8
201
1
201
4
Aft
er-
Tax
Pro
fits
Com
pensation o
f E
mplo
ye
es
Employee Compensation and Profits
Share of Non-financial Corporate GDP
Employee Compensation (LS) Corporate Profits (RS)
US equities: Earnings face near-term headwinds (cont.)
Source: Bloomberg
Wage growth has been stubbornly low
since the financial crisis. However, as
the labor market improves, wages
should increase, pressuring margins.
High profit margins have mostly come at the
expense of salaries. Employees currently
receive 57% of corporate value-added (a
proxy for revenues), versus a median of 63%.
A further uptick in
compensation will
likely pressure profits.
Source: Bureau of Economic Analysis
-80%
-60%
-40%
-20%
0%
20%
40%
60%
80%
-20%
-10%
0%
10%
20%
200
0
200
2
200
4
200
6
200
8
201
0
201
2
201
4
Ro
llin
g 1
2-M
on
th C
han
ge
An
nu
al
Ch
an
ge
S&P 500 Cost of Goods Sold (COGS) and Oil
S&P 500 COGS per Share (LHS) WTI Oil (RHS)
Source: Bloomberg, Mercer
The BEA estimates that energy input costs equate to more than 2% of US
private industry revenues. A decline in oil prices of over 50% should
therefore lower costs and support margins.
More businesses are planning on
raising compensation, a sign that
there is less slack in the labor
market.
Productivity growth has been sluggish
for the last few years. Recently, real
wages have exceeded productivity,
suggesting margin squeeze.
Source: Bloomberg

MERCER Market Environment Report April 2015 18
-20
-15
-10
-5
0
5
10
15
-4
-3
-2
-1
0
1
2
3
1980 1983 1986 1988 1991 1994 1996 1999 2002 2004 2007 2010 2012
Ru
ssell 2
000 -
S&
P 5
00 5
y
(%)
Sta
nd
ard
Dev
iati
on
s f
rom
Mean
Small-caps / Large-caps Valuation and Subsequent Excess Return
(Based on P/E, P/B and P/S)
Relative Valuation (LHS) Subsequent 5y Excess Return (RHS)
18.9
15.7
12.4
16.8
2.1
8.2
25.1
21.6
15.2
19.7
1.5
8.5
35.3
27.8
18.9 19.1
1.3
6.2
0
10
20
30
40
P/E - TrailingReported
P/E - 5 YrAverage
Earnings
P/CF P/E - 1Yr.Forward
(I/B/E/S)
Dividend Yield EPS Growth -Last 10 Yrs
US Equity Valuations by Capitalization
Russell Top 200
Russell Midcap
Russell 2000
Small-caps expensive, but less exposed to dollar strength
In a continuation of Q4 performance, small-cap equities outperformed
large-caps during the first quarter (4.3% vs. 1.0%). Dollar strength and
an active M&A environment are fundamental factors that could benefit
small-caps relative to large-caps. However, small-cap valuations
remain very stretched and large-caps are better positioned to profit
from improving conditions in developed economies overseas.
The performance of small-caps vs. large-caps tends to move in multi-
year cycles. While large-caps have lagged over the past two quarters,
they have outperformed small-caps by 450 bps over the past year.
With valuations on small-caps remaining rich and less scope for
further dollar appreciation, we expect large-caps to maintain a
performance edge over the intermediate-term.
Growth stocks outperformed value equities during Q1 across all
capitalizations. Value stocks were negatively impacted by larger
exposure to the financial, energy and utility sectors, which finished the
quarter in the red. While segments of the growth stock universe
(biotech, social media) are overvalued, growth stocks more broadly
appear fairly valued relative to value stocks, and we continue to
recommend no style bias versus the strategic policy.
Small-caps underperformed
for this full period, which
means valuations should have
been lower. We estimate fair
value at -0.4 to -0.7.
Small-caps still appear
expensive based on this blend
of valuation measures.
Small-caps Unattractive
Small-caps attractive
Source: Russell
Source: NDR, Datastream, Mercer
Mid-caps are expensive
relative to large-caps, but less
so than small-caps.
The valuation of growth
to value is near the long-
term mean.
Source: Russell
-20
-15
-10
-5
0
5
10
15
20
0.0
0.3
0.5
0.8
1.0
1.3
1.5
1.8
2.0
1980 1983 1986 1989 1992 1995 1998 2001 2004 2007 2010 2013
Su
bseq
uen
t 5-Y
r R
ela
tiv
e P
erf
orm
an
ce
(%)
R1000G
/R1000V
Rela
tiv
e t
o M
ean
Valuation of Russell 1000 Growth to Value
and Subsequent Performance
Valuation of R1000G/R1000V
Subsequent 5-Yr Relative Return (R1000G - R1000V)
Source: Russell, Bloomberg
Value attractive
Growth attractive

MERCER Market Environment Report April 2015 19
0
5
10
15
20
25
30
35
He
alth C
are
Co
ns. S
tap
les
Indu
str
ials
Mate
rials
Te
lecom
Co
ns. D
isc.
Utilit
ies
Info
Te
ch
Fin
ancia
ls
En
erg
y
(%)
P/E By Sector
MSCI Emerging Markets
MSCI World
Emerging market equities face near-term risks
Emerging market stocks rose 4.9% in local currency terms and 2.2%
in US$ during Q1. There was wide dispersion in US$ returns across
countries. Chinese and Indian stocks gained 8.1% and 5.4%,
respectively, while Brazilian stocks fell 14.6%. Russian stocks
rebounded 18.6%, but are 25.1% lower for 12 months.
Valuations on emerging market stocks are mixed. With a trailing P/E
of 14, they appear fairly attractive on the surface. However, this is
largely because of energy and financials, which are arguably cheap
for a reason. The median sector in the EM index trades at a less
appealing P/E of 16. Valuations vary widely across countries. Indian
stocks trade at a P/E of 20, as investors have priced-in the improved
outlook. Chinese stocks, with a 38% weight to financials, trade a P/E
of 11. Russia appears to be a bargain, but has serious geopolitical
risks and is sensitive to energy prices.
We are cautious on the near-term outlook for EM stocks and would
not be surprised to see them continue to underperform developed
markets. Earnings are likely decline in 2015 due to the concentration
in commodity sectors. Slowing growth in China, the largest export
market for many EM countries, represents another risk. Finally, Fed
tightening could lead to capital flight. We anticipate that the wide
divergence in economic conditions across countries, and valuations
and earnings across sectors will persist. As such, we continue to
advocate for the use of active management.
0
5
10
15
20
25
30
Se
p-9
5
Mar-
97
Se
p-9
8
Mar-
00
Se
p-0
1
Mar-
03
Se
p-0
4
Mar-
06
Se
p-0
7
Mar-
09
Se
p-1
0
Mar-
12
Se
p-1
3
Mar-
15
P/E on MSCI Emerging Markets
Cap-Weighted
Median
The median P/E is at a 17% premium
to the cap-weighted P/E. Historically,
the median P/E has been at a 9%
premium.
-60
-50
-40
-30
-20
-10
0
10
20
1996 1997 1998 2000 2001 2003 2004 2005 2007 2008 2010 2011 2013 2014
(%)
Valuation of MSCI Emerging Markets to Developed Markets
(Based on an average of P/E, P/B and P/CF)
Source: Datastream
Source: Datastream Source: Bloomberg
Emerging energy and financial stocks trade
at more attractive valuations than in
developed economies; however, health care,
consumer staples and industrials trade at
substantial premiums.

MERCER Market Environment Report April 2015 20
International equities have better earnings growth prospects than the US
International developed equities posted strong returns in Q1. The
MSCI EAFE index returned 10.9% in local terms, outperforming the
S&P 500 by nearly 10 percentage points, although the strength of the
dollar slashed the return to 4.9% in US$.
European stocks surged 11.6% in local terms in Q1 and 3.5% in US$.
European equities are now fully-valued on trailing earnings, trading at
comparable levels to the US. Profits are likely to be a key driver of
absolute and relative performance.
The profit outlook for Europe is promising. The weaker euro will
have a positive impact on earnings. Furthermore, European
companies tend to have high operating leverage, so the uptick in
economic growth (if sustained) could lead to much higher EPS.
Easy monetary policy should also support equities. European
equities yield nearly 300 bps more than 10Y German bunds (3.1%
vs. 0.2%), so there is a powerful incentive for European investors to
step further out on the risk spectrum.
Potential risks for Eurozone stocks include a left-tail event in
Greece, another fizzled economic recovery and a failure in
earnings to come through.
Japanese stocks jumped 10.2% in US$ (the yen was flat). It was
encouraging to see Japanese equites perform strongly in the absence
of yen weakness. Valuations on Japanese stocks appear relatively
attractive at a P/E of 17 on trailing earnings. Furthermore, companies
still have ample capacity to grow earnings as management teams
slowly become more focused on shareholder value.
The strong local currency gains posted by the MSCI EAFE index over
the last year has closed some of the valuation gap to the US. We still
view international developed stocks as more attractive than US stocks
due to better earnings growth potential. Additionally, looser monetary
policy should provide a nice tailwind, while US stocks could face a
headwind from Fed tightening.
Further dollar strength is a risk due to the divergence in monetary
policies. As such, investors could consider hedging a portion of their
international developed allocation to guard against a dollar overshoot.
European stocks are trading at
29% discount to US stocks versus
a historical average of 12%.
-50
-40
-30
-20
-10
0
10
20
30
40
50
No
v-7
9
Jan
-82
Mar-
84
May-8
6
Jul-
88
Se
p-9
0
No
v-9
2
Jan
-95
Mar-
97
May-9
9
Jul-
01
Se
p-0
3
No
v-0
5
Jan
-08
Mar-
10
May-1
2
Jul-
14
(%)
Discount of MSCI Europe to MSCI US
(Based on Shiller's PE)
Europe trades at a 29% discount to
US equities based on average 10-
year real earnings versus a historical
median of 13%.
Source: Datastream, Mercer
20.0 19.5
17.3
13.7
24.2
16.1
25.3
13.1 12.5
10.0 8.9
8.2
2.9 1.9 1.4 1.6 2.0 3.1 1.7
2.6
0
5
10
15
20
25
30
MSCI US MSCI Europe MSCI Japan MSCI EM
Global Valuations
P/E Trailing
Shiller's P/E
P/CF
P/B
Dividend Yield
ROE in Japan is 21% below its 2007-peak.
Stronger domestic growth, the drop in oil
prices and a weak yen should help lift
profitability.
European equities are
yielding 3.1%, while US
stocks yield only 2.0%.
Source: Bloomberg, Mercer

MERCER Market Environment Report April 2015 21
International equities have better earnings growth prospects than the US (cont.)
0
20
40
60
80
100
120
140
197
0
197
3
197
6
197
9
198
2
198
5
198
8
199
1
199
4
199
7
200
0
200
3
200
6
200
9
201
2
201
5
EP
S i
n l
ocal
cu
rren
cy
term
s
Growth in Earnings Per Share US
Europe
0
5
10
15
20
25
30
35
40
45
No
v-7
9
Jan
-82
Mar-
84
May-8
6
Jul-
88
Se
p-9
0
No
v-9
2
Jan
-95
Mar-
97
May-9
9
Jul-
01
Se
p-0
3
No
v-0
5
Jan
-08
Mar-
10
May-1
2
Jul-
14
P/E Ratio on MSCI Europe
Trailing P/E
Shiller P/E
Over the long-term, European and US firms have grown profits at a
similar pace. The gap in earnings since 2011 likely reflects cyclical
rather than structural factors. The outlook for European shares are
dependent on this gap closing, which may happen as the Eurozone
economy improves.
Historically, European firms have
experienced stronger earnings
growth during bull markets,
reflecting their higher operating
leverage and larger exposure to
cyclical sectors.
Based on Shiller’s PE, European
stocks are trading at a 2%
discount to their historical average
since 1979. US stocks are trading
at a 24% premium.
Source: Datastream, MSCI Source: Datastream, Mercer
0
5
10
15
20
25
30
0.0
1.0
2.0
3.0
4.0
5.0
6.0
197
5
197
8
198
1
198
4
198
7
199
0
199
3
199
6
199
9
200
2
200
5
200
8
201
1
201
4
P/C
F
P/B
Japanese Equity Valuations
P/B
P/CF
Japan trades at a 25% discount
on P/B and a 4% premium based
on P/CF.
Source: Datastream
-3
-2
-1
0
1
2
3
4
198
2
198
4
198
6
198
8
199
0
199
2
199
4
199
6
199
8
200
0
200
2
200
4
200
6
200
8
201
0
201
2
201
4
Sta
nd
ard
Dev
iati
on
s f
rom
Mean
Valuation of US$ Based on Relative PPP
(Avg CPI and PPI)
EAFE Basket
EUR
JPY
The dollar appears 12% overvalued
relative to EAFE currencies, but
remains about 10% below the
average level of 2001-02.
Source: Bloomberg, Mercer

MERCER Market Environment Report April 2015 22
-2
-1
0
1
2
3
4
5
3 mo 6 mo 1 yr 2 Yr 3 Yr 5 yr 7 yr 10 yr 20 yr 30 yr
(%)
Treasury Yield Curve
Treasuries at 12/31/13 TIPS at 12/31/13
Treasuries at 12/31/14 TIPS at 12/31/14
Treasuries at 03/31/15 TIPS at 03/31/15
2.5
1.4
3.3 3.3
5.6
3.2
6.8
2.2
1.4
2.6 3.1
6.6
2.1
6.5
2.1
1.3
2.4 2.9
6.2
2.0
6.3
0
3
6
9
Agg. Treas GSE MBS I/G Corp HY Corp Munis Local EMD
(%)
Bond Yields
Dec-13 Dec-14 Mar-15
Treasury yields declined further in Q1
Source: Federal Reserve, Bloomberg
The curve shifted down and modestly flattened in Q1. During
the quarter, the 2-year yield declined by 11 bps to 0.56, while
the 10- and 30-year yields fell by 23 and 21 bps to 1.94%
and 2.54%, respectively.
Source: Barclays, JPMorgan
Yields across all fixed
income sectors
moved lower in Q1.
The Barclays Treasury index rose 1.7% in Q1, as the yields on 10-
and 30-year Treasuries fell by 23bps and 21bps to 1.94% and 2.54%,
respectively. The Barclays Long Treasury index returned 4.0% in Q1
and is up over 21% for the last 12 months.
TIPS slightly underperformed Treasuries during Q1, advancing 1.4%.
For investors with inflation sensitive liabilities, TIPS have appeal
relative to Treasuries. There is a risk of an inflation surprise if the Fed
is too slow to normalize policy. The 1.8% 10-yr breakeven rate on
TIPS provides cheap insurance for this.
We expect interest rates will edge higher, but not expect a sharp
move. The Fed is likely to raise short-term rates at a slow, measured
pace, and the excess supply of global savings should keep a lid on
the long end of the curve. With the ECB and BOJ likely to keep
nominal rates near zero for years to come, demand for relatively high
yielding Treasuries should remain significant.
The Barclays Corporate index gained 2.3% in Q1. During the quarter,
the yield on the Corporate index declined by a modest 20 bps to
3.1%. The option-adjusted spread to Treasuries was unchanged at
1.3%, which is near the long-term median.
Given average spreads and favorable economic conditions, we
maintain a slight preference for investment-grade corporate bonds
over Treasuries. Downside risk for corporates relative to Treasuries
is limited over the short-term.
Over the intermediate-term, credit quality trends are important to
monitor. While interest coverage ratios are high, the credit quality
of the IG corporate bond universe has declined. The tendency of
companies to buyback equities with debt is increasing balance
sheet risks.
While the expected return on government bonds is unattractive, we
don’t expect a significant increase in rates due to overseas demand.
However, the downward shift in the long end of the yield curve makes
the risk of duration exposure very asymmetrical.
The real yield on 5-year TIPS
fell below zero in Q1. The
inflation breakeven rate on 5-
and 10-year TIPS finished at
just 1.5% and 1.8%.
Following a tough
second half of
2014, junk bonds
faired well in the
first quarter.
The yield on local EMD declined,
but currency depreciation led to
losses.

MERCER Market Environment Report April 2015 23
-1.5
-1.0
-0.5
0.0
0.5
1.0
1.5
2.0
2.5
199
1
199
3
199
5
199
7
199
9
200
1
200
3
200
5
200
7
200
9
201
1
201
3
201
5
Spread on 10Y US Treasuries to German Bunds
0
10
20
30
40
50
60
70
198
8
199
0
199
2
199
4
199
6
199
8
200
0
200
2
200
4
200
6
200
8
201
0
201
2
201
4
(%)
of
I/G
Bonds O
uts
tandin
g
Quality of Investment Grade Bonds
Aaa Aa
A Baa
0.0
0.5
1.0
1.5
2.0
2.5
3.0
3.5
4.0
198
9
199
1
199
3
199
5
199
7
199
9
200
1
200
3
200
5
200
7
200
9
201
1
201
3
(%)
Investment-Grade Corporate Bond Credit Spread
OAS
Median OAS
Quality Adjusted Median OAS
Treasury yields declined further in Q1(cont.)
The spread on investment-grade bonds was flat in Q1.
When factoring in the decline in the quality of the
universe, the current spread is 11 bps above the long-
term median. Given the favorable US economic outlook,
the current spread appears attractive.
Source: Barclays, Mercer
The adjusted
median reflects
the decline in the
credit quality of
the index.
Source: Bloomberg, Mercer
Relatively high bond yields in the US could
continue to attract money from overseas
investors.
The yield advantage of 10y
Treasuries over German
bunds is the highest since
1989.
Source: Bloomberg
The quality of the investment-grade bond
universe is trending lower. The share of the
universe in Baa-rated bonds has reached 44%.
2.0
2.5
3.0
3.5
4.0
4.5
5.0
5.5
6.0
0
50
100
150
200
250
300
350
2001 2002 2003 2005 2006 2007 2008 2009 2010 2012 2013 2014
($ T
rillio
n)
($ B
illio
n)
Corporate Bonds Outstanding and Dealer Inventory
Primary Dealer Inventory of Corporate Bonds (LHS)
US Corporate Bonds Outstanding (RHS)
Some analysts worry that
dealers have pulled away
from the corporate market
due to tighter regulations,
making them less likely to
provide liquidity in times of
stress.
While this could result in gap-
down moves in prices, investors
who do not sell into a panic
would likely only suffer temporary
mark-to-market losses.
Source: Federal Reserve, Bloomberg

MERCER Market Environment Report April 2015 24
0% 2%
6% 9%
12%
70%
0% 2% 4% 5%
10%
79%
0%
10%
20%
30%
40%
50%
60%
70%
80%
90%
2015 2016 2017 2018 2019 2020+
(% M
ark
et
Valu
e)
High Yield Bonds by Maturity
High Yield
HY Energy
25
50
75
100
1252
4
6
8
10
30-Jun-14 31-Aug-14 31-Oct-14 31-Dec-14 28-Feb-15
($ p
er
Bbl)
(%)
High Yield OAS vs. Oil Prices High Yield (LHS)
HY Energy (LHS)
HY ex. Energy (LHS)
WTI Oil (RHS, Inverted)
0
1000
2000
3000
4000
5000
6000
7000
8000
9000
10000
0
2
4
6
8
10
12
14
16
18
20
1994 1997 2000 2003 2006 2009 2012 2015
(%)
High Yield OAS vs. 10-year Treasury Yield
High yield OAS 10-yr Treasury Yield
The yield on the Barclays High Yield index declined from 6.6% to
6.2% during the first quarter, leading the index to a 2.5% gain. The
option adjusted spread narrowed by 17 bps and finished the quarter at
4.7%, which is modestly below the long-term median.
Despite a 10.6% drop in oil prices, the energy sector stabilized in Q1
and returned 2.4%. A sustained period of low oil prices will likely lead
to a spike in defaults for energy firms. Given our expectation of a
strengthening economy, the risk of broad systemic defaults appears
low. Nevertheless, we expect bouts of volatility, which should create
pockets of opportunity for skillful active managers.
We continue to maintain a preference for high yield bonds over
Treasuries. Spreads are modestly below average, but a healthy US
economy and favorable maturity schedule should keep defaults low,
especially outside the energy sector. Should Treasury yields increase,
we expect the spread to narrow, lessening the impact for high yield
bonds. Nevertheless, we believe global equities offer a better reward-
to-risk over the intermediate-term.
High yield bonds rebounded in the first quarter
Source: Barclays, Bloomberg
A narrowing in the high yield spread
could lessen the impact of rising
rates. Over the past 20 years, the
high yield OAS has narrowed all nine
times the 10-year Treasury yield has
risen 1% or more.
Source: Bank of America Source: Barclays, Mercer
While we do not expect broad systemic
defaults, we expect bouts of volatility,
which could create pockets of
opportunity.
The energy OAS widened by 88 bps in mid-March as oil prices
dropped by over 15%. The non-energy OAS held up better, but
still increased by 48bps.
The inability to meet or refinance maturing
debt obligations is a key driver of default.
Energy defaults could rise due to low oil prices,
but near term risks appear manageable.
Companies are focusing on liquidity by
reducing capital budgets and only 11% of
energy bonds mature before 2019. In addition,
M&A can also help some companies avoid
bankruptcy.

MERCER Market Environment Report April 2015 25
80
90
100
110
120
130
199
4
199
6
199
8
200
0
200
2
200
4
200
6
200
8
201
0
201
2
201
4
01/3
1/1
994 =
100
Real Effective Exchange Rate for Local EMD Currencies
0
2
4
6
8
10
2002 2003 2004 2005 2006 2007 2008 2009 2010 2011 2012 2013 2014
(%)
Local Currency EM Debt Yields and Inflation
Yields
Inflation
-8
-6
-4
-2
0
2
4
198
0
198
3
198
6
198
9
199
2
199
5
199
8
200
1
200
4
200
7
201
0
201
3
% o
f G
DP
Weighted Current Account for Local EMD
Local emerging market debt (EMD) declined by 4.0% in Q1. As was
the case in 2014, returns were negatively impacted by currency
weakness. Many EMD issuer currencies were down between 3% and
10% versus the US$, with the Brazilian real falling 16.9%. In local
currency terms, EMD rose 2.5% in the first quarter.
The outlook for EM currencies is mixed. The weighted-average
country in the EMD index is expected to run a 1.4% current account
deficit in 2015, suggesting the need for capital inflows. Higher US
yields are a key risk and may divert capital away from EMD and drive
currencies lower. Meanwhile, lower oil prices could create winners
(importers) and losers (exporters). However, the rout in EM currencies
has improved valuations and suggests that these risks may already
be discounted.
The real yield on EMD is attractive relative to the developed world.
While the current nominal yield of 6.3% is 50 bps below the historical
median, inflation has been declining in many emerging economies,
and the credit quality of the index has improved.
Fundamentals in EM have been much more desynchronized recently
as evidenced by diverging central bank policies across several
countries. We believe a skilled active manager should be able to add
value in this asset class.
Depreciating currencies hurt returns for local emerging market debt
The real yield on local currency EM debt
is 2.0% based on 2015 inflation
estimates, well above the historical
average real yield of 1.2%.
Source: Datastream, JPMorgan, IMF, Mercer
Despite improving credit quality
and falling inflation, local nominal
EMD yields are only moderately
below long-term averages.
A real exchange rate adjusts for inflation
differentials. A currency with high inflation could
rise in real terms due to higher costs, but
depreciate in nominal terms. All else equal, a
rising REER means exports are less competitive.
The weighted-average REER for the
local EMD index was trading above
trend in 2010, which likely
contributed to deterioration in trade
balances. The REER is now below
trend, albeit above average.
Theory suggests an upward trend in EM REER
due to relatively higher productivity growth,
making their economies more competitive.
Source: BIS, Bloomberg, JPMorgan, Mercer
Source: JPMorgan, IMF, Mercer
Depreciating currencies should reduce current account
deficits as exports gain competitiveness and import
prices increase, reducing domestic demand.
The current account balances of countries in the JPMorgan
GBI-EM Global Diversified index have deteriorated in recent
years. However, the projected 2015 current account deficits are
lower than before the 1997 crisis. Additionally, EM countries
have larger currency reserves than in 1997.

MERCER Market Environment Report April 2015 26
51 51
33
19
0
10
20
30
40
50
60
Jun-14 Sep-14 Dec-14 Mar-15
(EP
S)
2015 S&P Energy Earnings Estimates
-60
-45
-30
-15
0
15
Jun
-14
Jul-
14
Au
g-1
4
Se
p-1
4
Oct-
14
No
v-1
4
De
c-1
4
Jan
-15
Fe
b-1
5
Mar-
15
(%,
06/3
0/1
4=
0)
Oil and Energy Stocks
(since June 2014)
WTI Oil
S&P Large-cap Energy
S&P Mid-cap Energy
S&P Small-cap Energy
Dollar strength and excess oil supply weigh on commodities
The S&P GSCI Commodity index fell 6.8% in Q1 as oil prices slid
10.6% on dollar strength and excess supply. Natural resource stocks
fared better, but still lost 1.5%.
Many energy companies hedge short-term production (one to three
years) so they can withstand a temporary oil price decline. However, a
prolonged period of low oil prices will undoubtedly impair their
earnings potential. The silver lining is that the bar is set lower as
analysts have aggressively cut earnings forecasts for the energy
sector.
While the short-term prospects are muddled, we continue to support
strategic exposure to natural resource investments as a hedge against
unexpected inflation and geopolitical risks.
Commodity futures returns are being adversely impacted by negative
roll yields, primarily due to contango in oil futures. As such, we favor
obtaining commodity exposure through natural resource equities over
commodity futures. Source: Bloomberg
Small-cap energy stocks continued to
bear the brunt of the pain in Q1,
declining 5.6%.
Source: Bloomberg
2015 energy earnings estimates have
been cut by over 60% in the last six
months and by over 40% in 2015 alone.
-60
-40
-20
0
20
40
60
80
Jan-92 Jan-95 Jan-98 Jan-01 Jan-04 Jan-07 Jan-10 Jan-13
(%)
Decomposition of Rolling 1-year Commodity Futures Returns
Spot Return Collateral Roll Yield
Roll yields turned negative in Q1. Oil futures for June and December delivery
trade at 4% and 15% premiums to the spot price, respectively.
Source: Bloomberg, DJ-UBS, S&P, Goldman Sachs

MERCER Market Environment Report April 2015 27
The FSTE/EPRA NAREIT index returned 4.2% for the quarter,
outperforming the MSCI World index. US REITs earned 4.7%,
benefitting from the decline in interest rates. Improving economic
conditions and plunging bond yields led to a 20.4% return for
continental European property firms. The Japanese market fell 1.4%.
Global REITs should benefit from stronger economic growth, but
valuations appear fairly expensive. Low interest rates in the US and
overseas have drawn yield chasers. While we don’t expect a sharp
increase in rates over the short-term, REITs are likely to be very
sensitive to rates should it occur.
Globally, REITs are trading at a 9% premium to NAV versus a
historical average discount of close to 10%. US REITs finished the
quarter at a 6% premium to NAV. Most Asian markets traded at
sizable discounts, although those discounts were generally in-line
with historical averages. European REITs finished the quarter at a
whopping 22% premium to NAV, suggesting investors may have
already priced in the improved growth outlook.
Global REITs yield 3.7%, which is attractive relative to sovereign
debt. However, it is only 130 bps yield premium to global stocks,
which is below the historical average of 210 bps. REITs appear fairly
expensive relative to global stocks on most measures.
While we expect rates to remain low globally, REITs could struggle
in relative terms as the Fed starts to lift short-term rates. In 2013,
they underperformed equities by 28 percentage points as the yield
on the 10-year Treasury rose by 126 bps.
The hunt for yield continues to drive capital to core real estate, with low
cap and lending rates providing a tailwind. Going forward, asset
appreciation will be driven more by income growth. In the value added
market, the improvement in fundamentals presents an opportunity to fix
broken assets, with submarkets of select major markets increasingly
presenting opportunities. Investors are still active in the subordinate
debt, but yields are decreasing. However, subordinate debt funds
continue to present attractive risk adjusted returns in light of stable
fundamentals.
Valuations and interest rate sensitivity are concerns for Global REITs
-50
-40
-30
-20
-10
0
10
20
30
199
0
199
2
199
4
199
6
199
8
200
0
200
2
200
4
200
6
200
8
201
0
201
2
201
4
(%)
Global REITs
Valuation Relative to NAV
Global REITs have risen 16% over the last year, but
valuations are mostly unchanged as cash flows and
property prices have increased.
Source: Principal
REITs are nowhere near as
expensive as they were before
the financial crisis.
0
1
2
3
4
5
6
7
8
9
199
0
199
2
199
4
199
6
199
8
200
0
200
2
200
4
200
6
200
8
201
0
201
2
201
4
(%)
Global REITs
Dividend Yield
Source: Principal
Dividend yields on global REITs are near record lows in absolute terms, but
they have still benefited from the search for yield due to ultra-low yields on
sovereign bonds. Based on a multiple regression, US REITs have exhibited a
0.8 beta to the return on long Treasuries over the last three years.

MERCER Market Environment Report April 2015 28
Hedge funds outperformed equities and bonds for the quarter
Macro events drove markets in Q1, leading to rather wild swings as
investors tried to digest the effects of European QE, the Greek
election, the abandonment of the Swiss Franc peg, energy price
volatility and weak US economic data. Hedge funds were able to
produce consistently positive results, with the average multi-manager
portfolio outpacing equities and bonds.
Systematic macro strategies continued to experience stellar
performance. Trends were plentiful in Q1, with interest rates,
particularly on German Bunds, representing the primary driver of
returns. Discretionary macro strategies also posted a positive return
during the quarter, benefitting from currency and select equity
positions, but were hurt by commodity-related exposure. Overall,
dispersion was elevated, with a number of portfolios hurt by the
SNB’s decision to abandon its peg to the euro.
Mergers led the event-driven strategy for the quarter. Distressed
strategies posted modestly positive results during a relatively quiet
quarter for restructuring events. Special situation and post-
reorganization equity exposure was generally additive during Q1,
while structured credit produced mixed results.
Long/short equity managers posted solid result as dispersion within
US equities provided ample opportunities. Longs generally added
value. Short were mixed, but many managers captured dispersion
and generated short alpha. Inter-sector, style, market cap, and
regional disparities were plentiful, creating additional opportunities.
Relative value managers posted reasonable returns as the wide
dispersion in style, cap and regional performance created a
favorable environment. Convertible managers also posted gains,
amidst healthy new issuance, though energy-related exposure
continued to be punished.
With the Volker Rule putting limitations on the ability of dealers to
provide liquidity, we have seen massive moves occur in a variety of
markets, punctuated by the Swiss franc’s unprecedented volatility.
While this obviously introduces risk, we believe for a well constructed
hedge fund program, the opportunities to be a liquidity provider will
ultimately compensate for these risks.
2.5
5.1
2.4
2.3
2.1
2.0
1.7
1.7
0.6
2.3
1.6
5.4
18.3
3.4
3.0
1.4
1.1
0.4
3.5
-3.6
5.4
5.7
-5.0 0.0 5.0 10.0 15.0 20.0
HFRI FOF
HFRI Macro: Systematic
HFRI Merger Arb
HFRI Equity Hedge
HFRI Convertible Arbitrage
HFRI Event-Driven
HFRI Macro: Discretionary
HFRI Equity Market Neutral
HFRI Distressed
MSCI ACWI
Barclays Agg
(%)
Hedge Fund Performance
First Quarter
1-Year
Source: Hedge Fund Research
The average fund of
hedge funds posted good
returns in Q1.
-3.0
5.7
-1.6 -1.6
5.6
-1.5
2.1
-0.9
0.5 0.2
1.7
0.6
-4.0
-2.0
0.0
2.0
4.0
6.0
8.0
Jan Feb Mar
(%)
Monthly Returns
S&P 500
MSCI ACWI
Barclays Agg
HFR FOF
Source: Hedge Fund Research,
Hedge funds typically
earn their risk reduction
stripes during difficult
markets.

MERCER Market Environment Report April 2015 29
60%
65%
70%
75%
80%
85%
90%
95%
100%
105%
110%
De
c-0
7
Jun
-08
De
c-0
8
Jun
-09
De
c-0
9
Jun
-10
De
c-1
0
Jun
-11
De
c-1
1
Jun
-12
De
c-1
2
Jun
-13
De
c-1
3
Jun
-14
De
c-1
4
S&P 1500 Pension Funded Status
Liability driven investing: Maintain tactical underhedge, favor credit
Rates continued to decrease during the first quarter. At year-end,
Mercer’s assumed fair value rates were on average 104bps in excess
of current rates at tenors over 20 years. At the intermediate part of the
curve, from 5 to 20 years, spot rates are 70bps below fair value range.
For those plans that are currently under their strategic interest rate
hedge ratio, we believe the current yield environment does not
warrant a move towards the strategic hedge target.
Credit spreads are slightly above historical averages and the
economic environment remains favorable. As such, we favor an
overweight to credit spread exposure relative to the strategic
benchmark, after taking note of any credit exposure the plan may
obtain elsewhere in its portfolio.
Swap rates decreased during the quarter. Swap spreads over
Treasury rates have fallen considerably and were about -30 bps at the
30 year tenor. Swap spreads at the front and belly were about +12
bps on average. At these yields, sponsors looking to extend duration
should consider using swaps at tenors shorter than 20 years.
Treasury futures and STRIPS continue to offer slightly richer yields at
the long end of the curve.
The Society of Actuaries recently published a study indicating
significantly increased life expectancies than what is currently
assumed by most plan sponsors in the calculation of their balance
sheet liability. This longer life expectancy will increase liabilities by 5%
to 10% depending on a plan’s current assumption.
PBGC annual per participant premiums were recently increased
significantly, from $49 per participant in 2014 to $64 per participant in
2016, and increasing with inflation thereafter.
Along with increasing costs, many plans are still significantly better
funded than in previous years and are thus in a position where the
absolute cost and cash impact of a buyout has decreased. Based on
the Mercer US Pension Buyout index, as of March 31, 2015, for a
sample retiree plan modelled, the cost of maintaining the defined
benefit plan is approximately equal to the cost of transferring liabilities
to an insurer at 105.6% of accounting liability.
0.0%
0.5%
1.0%
1.5%
2.0%
2.5%
3.0%
3.5%
4.0%
4.5%
5.0%
0 5 10 15 20 25 30Years
Spot Yield Curve Versus Fair Value
Yield curve Fair Value Yield Curve
Source: Federal Reserve, Mercer
We define fair value rates as those rates applying today that would
allow the plan to lengthen duration with no change in expected
return. Our fair value rates reflect our assumption that future spot
short rates converge to a long term real yield of 1.8%, plus an
inflation rate of 2.2% plus an inflation risk premium of 0.3%.
Source: Mercer
Mercer estimates the aggregate funded status of S&P 1500 pension
plans. The funded status improved from 78.9% at the beginning of
the year to 79.8%. Asset gains overpowered the decline in interest
rates and increase in longevity assumptions. $480 billion deficit is
down from $504 billion at the beginning of the year.

MERCER Market Environment Report April 2015 30
Important Notices
References to Mercer shall be construed to include Mercer LLC and/or its associated companies.
© 2015 Mercer LLC. All rights reserved.
This contains confidential and proprietary information of Mercer and is intended for the exclusive use of the parties to whom it was provided by Mercer. Its content may not be modified, sold or otherwise
provided, in whole or in part, to any other person or entity, without Mercer’s prior written permission.
The findings, ratings and/or opinions expressed herein are the intellectual property of Mercer and are subject to change without notice. They are not intended to convey any guarantees as to the future
performance of the investment products, asset classes or capital markets discussed. Past performance does not guarantee future results. Mercer’s ratings do not constitute individualized investment advice.
Information contained herein has been obtained from a range of third party sources. While the information is believed to be reliable, Mercer has not sought to verify it independently. As such, Mercer makes no
representations or warranties as to the accuracy of the information presented and takes no responsibility or liability (including for indirect, consequential or incidental damages), for any error, omission or
inaccuracy in the data supplied by any third party.
This does not constitute an offer or a solicitation of an offer to buy or sell securities, commodities and/or any other financial instruments or products or constitute a solicitation on behalf of any of the investment
managers, their affiliates, products or strategies that Mercer may evaluate or recommend.
For the most recent approved ratings of an investment strategy, and a fuller explanation of their meanings, contact your Mercer representative.
For Mercer’s conflict of interest disclosures, contact your Mercer representative or see www.mercer.com/conflictsofinterest.
THE FOLLOWING PROVISIONS APPLY TO DATA OR OTHER SERVICES PROVIDED BY THE FOLLOWING COMPANIES: Where “End User” appears before the Vendor
name, a direct end-user license with the Vendor is required to receive some indices. You are responsible for ensuring you have in place all such licenses as are required by Vendors.
BARCLAYS: © Barclays Bank PLC 2014. This data is provided by Barclays Bank PLC. Barclays Bank PLC and its affiliated companies accept no liability for the accuracy, timeliness or completeness of such
data which is provided “as is.” All warranties in relation to such data are hereby extended to the fullest extent permitted under applicable law.
BARCLAYS CAPITAL: The Barclays Indices are a proprietary product of Barclays. Barclays shall maintain exclusive ownership of and rights to the Barclays Indices and that inclusion of the Barclays Indices
in this Service shall not be construed to vest in the subscriber any rights with respect to the Indices. The subscriber agrees that it will not remove any copyright notice or other notification or trade name or
marks of Barclays that may appear in the Barclays Indices and that any reproduction and/or distribution of the Barclays Indices (if authorized) shall contain such notices and/or marks.
BLOOMBERG L.P.: © 2014 Bloomberg L.P. All rights reserved. BLOOMBERG, BLOOMBERG PROFESSIONAL, BLOOMBERG FINANCIAL MARKETS, BLOOMBERG NEWS, BLOOMBERG
TRADEMARK, BLOOMBERG BONDTRADER, AND BLOOMBERG TELEVISION are trademarks and service marks of Bloomberg L.P. a Delaware Limited Partnership.
IBNY Mellon Asset Servicing: Source: © 2014 BNY Mellon Performance Risk and Analytics, LLC. All Rights Reserved.
CITIGROUP GLOBAL MARKETS (formerly SALOMON SMITH BARNEY): Smith Barneysm and Citigroup Global Equity Indexsm are service marks of Citigroup Inc. "BECAUSE ACCURACY COUNTS®" is a
registered service mark of Citigroup Inc. FloatWatch© is a trade mark of Citigroup Inc. Citigroup Global Equity Index Systemsm , Citigroup Broad Market Indexsm, Citigroup Primary Market Indexsm, Citigroup
Extended Market Indexsm, Citigroup Cap-Range Indexsm, Citigroup Internet Index (NIX)sm, Citigroup Style Indices (Growth/Value)sm, Citigroup Property Indexsm are service marks of Citigroup Inc. ©2014
Citigroup Inc All rights reserved. Any unauthorized use, duplication or disclosure is prohibited by law and may result in prosecution. Citigroup, including its parent, subsidiaries and/or affiliates ("the Firm"),
usually makes a market in the securities discussed or recommended in its report and may sell to or buy from customers, as principal, securities discussed or recommended in its report. The Firm or employees
preparing its report may have a position in securities or options of any company discussed or recommended in its report. An employee of the Firm may be a director of a company discussed or recommended in
its report. The Firm may perform or solicit investment banking or other services from any company discussed or recommended in its report. Securities recommended, offered, or sold by SSB: (i) are not insured
by the Federal Deposit Insurance Corporation; (ii) are not deposits or other obligations of any insured depository institution (including Citibank); and (iii) are subject to investment risks, including the possible
loss of the principal amount invested. Although information has been obtained from and is based upon sources SSB believes to be reliable, we do not guarantee its accuracy and it may be incomplete or
condensed. All opinions and estimates constitute SSB’s judgment as of the date of the report and are subject to change without notice. Its report is for informational purposes only and is not intended as an
offer or solicitation for the purchase or sale of a security. Its report does not take into account the investment objectives or financial situation of any particular person. Investors should obtain advice based on
their own individual circumstances before making an investment decision.
CREDIT SUISSE FIRST BOSTON LLC. (CSFB): Copyright © 1996 – 2014 Credit Suisse First Boston LLC and/or its affiliate companies. All rights reserved.
DataStream : Source: ThomsonReuters Datastream

MERCER Market Environment Report April 2015 31
Important Notices
Dow Jones: The Dow Jones IndexesSM are proprietary to and distributed by Dow Jones & Company, Inc. and have been licensed for use. All content of Dow Jones IndexesSM © 2014 is proprietary to Dow
Jones & Company, Inc.
“End User” FTSE™ : is a trade mark of the London Stock Exchange PLC and The Financial Times Limited and is used by FTSE International Limited under license. Russell Investment Group Europe Ltd is
licensed by FTSE International Limited to distribute FTSE Advanced Service and other FTSE indices. FTSE shall not be responsible for any error or omission in FTSE data. All copyright and database rights in
FTSE products belong to FTSE or its licensors. Redistribution of the data comprising the FTSE products is not permitted. You agree to comply with any restrictions or conditions imposed upon the use, access,
or storage of the data as may be notified to you by FTSE or Russell/Mellon Europe Ltd. You are not permitted to receive the FTSE Advanced Service unless you have a separate agreement with FTSE.
“FTSE™”, “FT-SE™” and “Footsie™” are trade marks of London Stock Exchange PLC and The Financial Times Limited and are used by FTSE International Limited under license.
The FTSE Private Investor Indices are owned and calculated by FTSE International and are produced in association with APCIMS (Association of Private Client Investment Managers and Stockbrokers).
FTSE International Limited 2014
The UK Value and Growth Indices are owned and calculated by FTSE International Limited in association with Russell Investment Group. FTSE International Limited 2014.
RUSSELL INVESTMENT GROUP: Russell Investment Group is the source and owner of certain of the data contained or reflected in this material and all trademarks and copyrights related thereto. The
material may contain confidential information and unauthorized use, disclosure, copying, dissemination or redistribution is strictly prohibited. This is a user presentation of the data. Russell Investment Group is
not responsible for the formatting or configuration of this material or for any inaccuracy in presentation thereof. Returns and security data for the Russell indices are provided by Mellon Analytical Solutions.
Russell indices are trademarks/service marks of the Russell Investment Group. Russell® is a trademark of the Russell Investment Group.
HFRI: Source: Hedge Fund Research, Inc., © HFR, Inc. 2014, www.hedgefundresearch.com
JPMORGAN: The JPMorgan EMBI Index (i) is protected by copyright and JPMorgan claims trade secret rights, (ii) is and shall remain the sole property of JPMorgan, and (iii) title and full ownership in the
JPMorgan EMBI Index is reserved to and shall remain with JPMorgan. All proprietary and intellectual property rights of any nature, including patents, copyrights, trademarks and trade secrets regarding the
JPMorgan EMBI Index, and any and all parts, copies, modifications, enhancements and derivative works are owned by, and shall remain the property of JPMorgan and its affiliates. The JPMorgan EMBI Index
and related materials and software were developed, compiled, prepared and arranged by JPMorgan through expenditure of substantial time, effort and money and constitute valuable intellectual property and
trade secrets of JPMorgan. The JPMorgan EMBI Index shall not be used in a manner that would infringe the property rights of JPMorgan or others or violate the laws, tariffs, or regulations of any country.
MSCI®: Portions of this report are copyright MSCI 2014. Unpublished. All Rights Reserved. This information may only be used for your internal use, may not be reproduced or redisseminated in any form and
may not be used to create any financial instruments or products or any indices. This information is provided on an “as is” basis and the user of this information assumes the entire risk of any use it may make or
permit to be made of this information. Neither MSCI, any of its affiliates or any other person involved in or related to compiling, computing or creating this information makes any express or implied warranties or
representations with respect to such information or the results to be obtained by the use thereof, and MSCI, its affiliates and each such other person hereby expressly disclaim all warranties (including, without
limitation, all warranties of originality, accuracy, completeness, timeliness, non-infringement, merchantability and fitness for a particular purpose) with respect to this information. Without limiting any of the
foregoing, in no event shall MSCI, any of its affiliates or any other person involved in or related to compiling, computing or creating this information have any liability for any direct, indirect, special, incidental,
punitive, consequential or any other damages (including, without limitation, lost profits) even if notified of, or if it might otherwise have anticipated, the possibility of such damages. MSCI is a registered
trademark of MSCI, Inc.
NAREIT: NAREIT® is the exclusive registered mark of the National Association of Real Estate Investment Trusts.
NCREIF: All NCREIF Data - Copyright by the National Council of Real Estate Investment Fiduciaries. This information is proprietary and may not be reported in whole or in part without written permission.
STANDARD & POOR’S: Standard & Poor’s information contained in this document is subject to change without notice. Standard & Poor’s cannot guarantee the accuracy, adequacy or completeness of the
information and is not responsible for any errors or omissions or for results obtained from use of such information. Standard & Poor’s makes no warranties or merchantability for a particular purpose. In no
event shall Standard & Poor’s be liable for direct, indirect or incidental, special or consequential damages from the information here regardless or whether such damages were foreseen or unforeseen.
Investment advisory services provided by Mercer Investment Consulting, Inc.